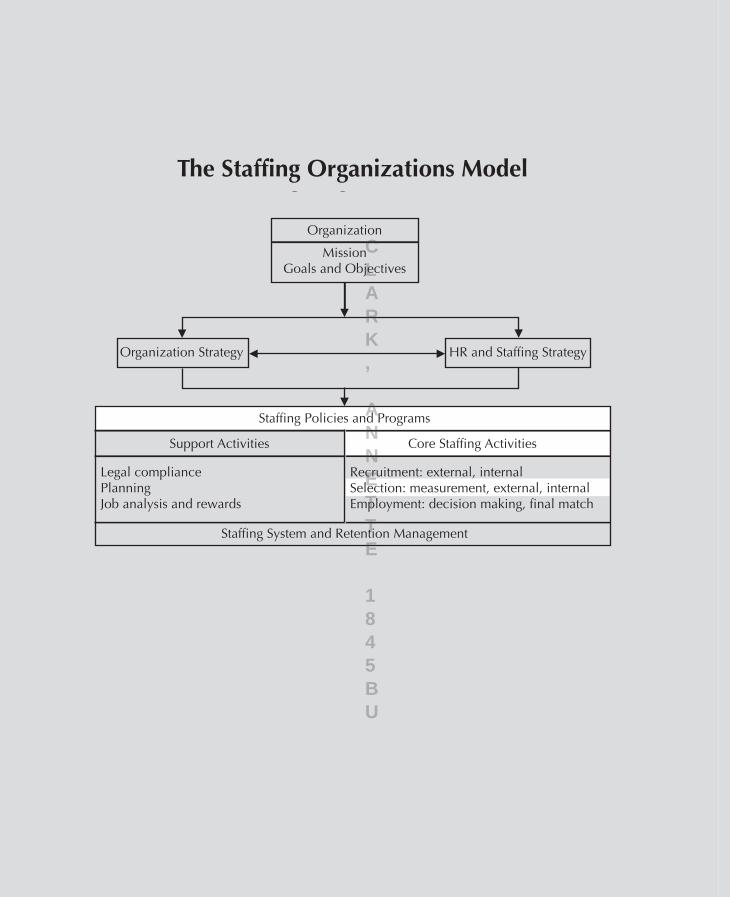
The Staffing Organizations Model Organization Mission Goals and Objectives Organization Strategy s e i t i v i t c A g n i f f a t S e r o C s e i t i v i t c A t r o p p u S HR and Staffing Strategy Staffing Policies and Programs Staffing System and Retention Management Legal compliance Planning Job analysis and rewards Recruitment: external, internal Selection: measurement, external, internal Employment: decision making, final match C L A R K , A N N E T T E 1 8 4 5 B U
Transcript
The Staffing Organizations ModelThe Staffing Organizations Model
Organization
MissionGoals and Objectives
Organization Strategy
seitivitcA gniffatS eroCseitivitcA troppuS
HR and Staffing Strategy
Staffing Policies and Programs
Staffing System and Retention Management
Legal compliancePlanningJob analysis and rewards
Recruitment: external, internalSelection: measurement, external, internalEmployment: decision making, final match
hen12680_ch07_310-368.indd 310 3/30/11 9:25 AM
CLARK, ANNETTE 1845BU
Part Four
Staffing Activities: Selection
C h a p t e r S e v e nMeasurement
C h a p t e r e i g h tExternal Selection I
C h a p t e r n i n eExternal Selection II
C h a p t e r t e nInternal Selection
hen12680_ch07_310-368.indd 311 3/30/11 9:25 AM
CLARK, ANNETTE 1845BU
hen12680_ch07_310-368.indd 312 3/30/11 9:25 AM
CLARK, ANNETTE 1845BU
ChapTer Seven
Measurement
Learning Objectives and IntroductionLearning ObjectivesIntroduction
Importance and Use of Measures
Key ConceptsMeasurementScoresCorrelation Between Scores
Quality of MeasuresReliability of MeasuresValidity of MeasuresValidation of Measures in StaffingValidity GeneralizationStaffing Metrics and Benchmarks
Collection of Assessment DataTesting ProceduresAcquisition of Tests and Test ManualsProfessional Standards
• Define measurement and understand its use and importance in staffing decisions
• Understand the concept of reliability and review the different ways reliability of measures can be assessed
• Define validity and consider the relationship between reliability and validity• Compare and contrast the two types of validation studies typically conducted• Consider how validity generalization affects and informs validation of mea-
sures in staffing• Review the primary ways assessment data can be collected
introduction
In staffing, measurement is a process used to gather and express information about people and jobs in numerical form. Measurement is critical to staffing because, as far as selection decisions are concerned, a selection decision can only be as effec-tive as the measures on which it is based.
The first part of this chapter presents the process of measurement in staffing decisions. After showing the vital importance and uses of measurement in staffing activities, three key concepts are discussed. The first concept is that of measure-ment itself, along with the issues raised by it—standardization of measurement, levels of measurement, and the difference between objective and subjective mea-sures. The second concept is that of scoring and how to express scores in ways that help in their interpretation. The final concept is that of correlations between scores, particularly as expressed by the correlation coefficient and its significance. Calculating correlations between scores is a very useful way to learn even more about the meaning of scores.
What is the quality of the measures used in staffing? How sound an indicator of the attributes measured are they? Answers to these questions lie in the reliability and validity of the measures and the scores they yield. There are multiple ways of doing reliability and validity analysis; these methods are discussed in conjunction with numerous examples drawn from staffing situations. As these examples show, the quality of staffing decisions (e.g., who to hire or reject) depends heavily on the quality of measures and scores used as inputs to these decisions. Some orga-nizations rely only on common staffing metrics and benchmarks—what leading organizations are doing—to measure effectiveness. Though benchmarks have their value, reliability and validity are the real keys in assessing the quality of selection measures.
hen12680_ch07_310-368.indd 315 3/30/11 9:25 AM
CLARK, ANNETTE 1845BU
316 parT FOur Staffing Activities: Selection
An important practical concern involved in the process of measurement is the collection of assessment data. Decisions about testing procedures (who is qualified to test applicants, what information should be disclosed to applicants, and how to assess applicants with standardized procedures) need to be made. The collection of assessment data also includes the acquisition of tests and test manuals. This pro-cess will vary depending on whether paper- and-pencil or computerized selection measures are utilized. Finally, in the collection of assessment data, organizations need to attend to professional standards that govern their proper use.
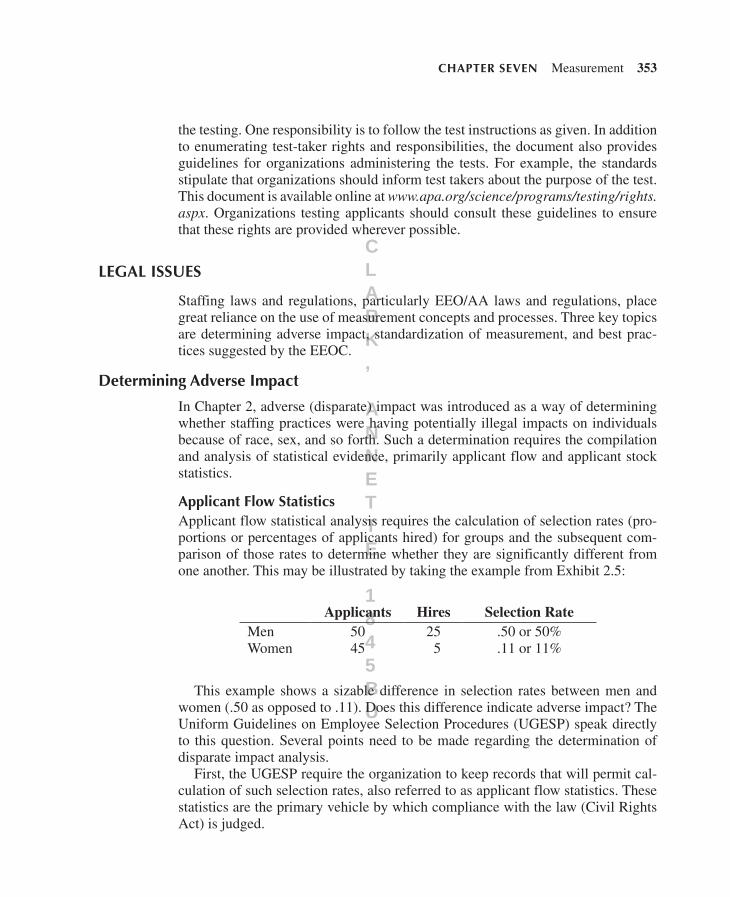
Measurement concepts and procedures are directly involved in legal issues, par-ticularly equal employment opportunity and affirmative action (EEO/AA) issues. This requires collection and analysis of applicant flow and stock statistics. Also reviewed are methods for determining adverse impact, standardization of mea-sures, and best practices as suggested by the Equal Employment Opportunity Commission (EEOC).
iMpOrTanCe and uSe OF MeaSureS
Measurement is one of the key ingredients for, and tools of, staffing organizations. Indeed, it is virtually impossible to have any type of systematic staffing process that does not use measures and an accompanying measurement process.
Measures are methods or techniques for describing and assessing attributes of objects that are of concern to us. Examples include tests of applicants’ KSAOs (knowledge, skill, ability, and other characteristics), evaluations of employees’ job performance, and applicants’ ratings of their preferences for various types of job rewards. These assessments of attributes are gathered through the measurement process, which consists of (1) choosing an attribute of concern, (2) developing an operational definition of the attribute, (3) constructing a measure of the attribute (if no suitable measure is available) as it is operationally defined, and (4) using the measure to actually gauge the attribute.
Results of the measurement process are expressed in numbers or scores—for example, applicants’ scores on an ability test, employees’ performance evaluation rating scores, or applicants’ ratings of rewards in terms of their importance. These scores become the indicators of the attribute. Through the measurement process, the initial attribute and its operational definition are transformed into a numerical expression of the attribute.
Key COnCepTS
This section covers a series of key concepts in three major areas: measurement, scores, and correlation between scores.
hen12680_ch07_310-368.indd 316 3/30/11 9:25 AM
CLARK, ANNETTE 1845BU
ChapTer Seven Measurement 317
Measurement
In the preceding discussion, the essence of measurement and its importance and use in staffing were described. It is important to define the term “measurement” more formally and explore implications of that definition.
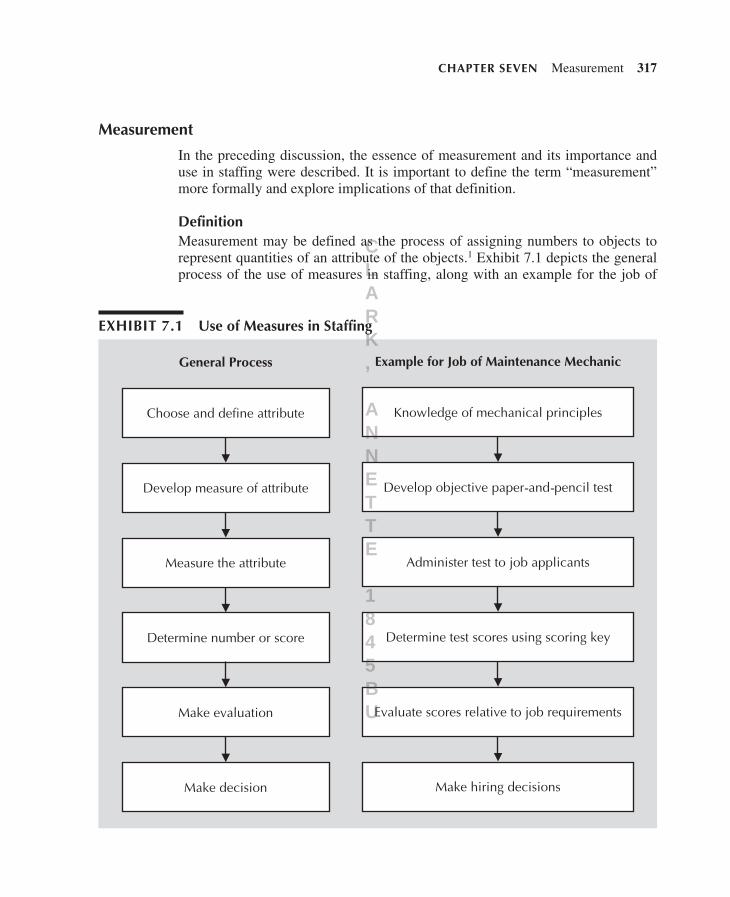
definitionMeasurement may be defined as the process of assigning numbers to objects to represent quantities of an attribute of the objects.1 Exhibit 7.1 depicts the general process of the use of measures in staffing, along with an example for the job of
exhibiT 7.1 use of Measures in Staffing
hen12680_ch07_310-368.indd 317 3/30/11 9:25 AM
CLARK, ANNETTE 1845BU
318 parT FOur Staffing Activities: Selection
maintenance mechanic. The first step in measurement is to choose and define an attribute (also called a construct) to be measured. In the example, this is knowledge of mechanical principles. Then, a measure must be developed for the attribute so that it can physically be measured. In the example, a paper- and-pencil test is devel-oped to measure mechanical knowledge, and this test is administered to applicants. Once the attribute is physically measured, numbers or scores are determined (in the example, the mechanical test is scored). At that point, the applicants’ scores are evaluated (which scores meet the job requirements), and a selection decision can be made (e.g., hire a maintenance mechanic).
Of course, in practice, this textbook process is often not followed explicitly, and thus selection errors are more likely. For example, if the methods used to determine scores on an attribute are not explicitly determined and evaluated, the scores them-selves may be incorrectly determined. Similarly, if the evaluation of the scores is not systematic, each selection decision maker may put his or her own spin on the scores, thereby defeating the purpose of careful measurement. The best way to avoid these problems is for all those involved in selection decisions to go through each step of the measurement process depicted in Exhibit 7.1, apply it to the job(s) in question, and reach agreement at each step of the way.
StandardizationThe hallmark of sound measurement practice is standardization.2 Standardization is a means of controlling the influence of outside or extraneous factors on the scores generated by the measure and ensuring that, as much as possible, the scores obtained reflect the attribute measured.
A standardized measure has three basic properties:
1. The content is identical for all objects measured (e.g., all job applicants take the same test).
2. The administration of the measure is identical for all objects (e.g., all job applicants have the same time limit on a test).
3. The rules for assigning numbers are clearly specified and agreed on in advance (e.g., a scoring key for the test is developed before it is administered).
These seemingly simple and straightforward characteristics of standardization of measures have substantial implications for the conduct of many staffing activities. These implications will become apparent throughout the remainder of this text. For example, assessment devices, such as the employment interview and letters of ref-erence, often fail to meet the requirements for standardization, and organizations must undertake steps to make them more standardized.
Levels of MeasurementThere are varying degrees of precision in measuring attributes and in representing differences among objects in terms of attributes. Accordingly, there are different
hen12680_ch07_310-368.indd 318 3/30/11 9:25 AM
CLARK, ANNETTE 1845BU
ChapTer Seven Measurement 319
levels or scales of measurement.3 It is common to classify any particular measure as falling into one of four levels of measurement: nominal, ordinal, interval, or ratio.
Nominal. With nominal scales, a given attribute is categorized, and numbers are assigned to the categories. With or without numbers, however, there is no order or level implied among the categories. The categories are merely different, and none is higher or lower than the others. For example, each job title could represent a dif-ferent category, with a different number assigned to it: managers = 1, clericals = 2, sales = 3, and so forth. Clearly, the numbers do not imply any ordering among the categories.
Ordinal. With ordinal scales, objects are rank ordered according to how much of the attribute they possess. Thus, objects may be ranked from best to worst or from highest to lowest. For example, five job candidates, each of whom has been evaluated in terms of overall qualification for the job, might be rank ordered from 1 to 5, or highest to lowest, according to their job qualifications.
Rank orderings only represent relative differences among objects; they do not indicate the absolute levels of the attribute. Thus, the rank ordering of the five job candidates does not indicate exactly how qualified each of them is for the job, nor are the differences in their ranks necessarily equal to the differences in their quali-fications. The difference in qualifications between applicants ranked 1 and 2 may not be the same as the difference between those ranked 4 and 5.
Interval. Like ordinal scales, interval scales allow us to rank order objects. How-ever, the differences between adjacent points on the measurement scale are now equal in terms of the attribute. If an interval scale is used to rank order the five job candidates, the differences in qualifications between those ranked 1 and 2 are equal to the differences between those ranked 4 and 5.
In many instances, the level of measurement falls somewhere between an ordi-nal and interval scale. That is, objects can be clearly rank ordered, but the differ-ences between the ranks are not necessarily equal throughout the measurement scale. In the example of the five job candidates, the difference in qualifications between those ranked 1 and 2 might be slight compared with the distance between those ranked 4 and 5.
Unfortunately, this in- between level of measurement is characteristic of many of the measures used in staffing. Though it is not a major problem, it does signal the need for caution in interpreting the meaning of differences in scores among people.
Ratio. Ratio scales are like interval scales in that there are equal differences between scale points for the attribute being measured. In addition, ratio scales have a logical or absolute true zero point. Because of this, how much of the attribute each object possesses can be stated in absolute terms.
hen12680_ch07_310-368.indd 319 3/30/11 9:25 AM
CLARK, ANNETTE 1845BU
320 parT FOur Staffing Activities: Selection
Normally, ratio scales are involved in counting or weighing things. There are many such examples of ratio scales in staffing. Assessing how much weight a can-didate can carry over some distance for physically demanding jobs such as fire-fighting or general construction is an example. Perhaps the most common example is counting how much previous job experience (general or specific) job candidates have had.
Objective and Subjective MeasuresFrequently, staffing measures are described as being either objective or subjective. Often, the term “subjective” is used in disparaging ways (“I can’t believe how subjective that interview was; there’s no way they can rate me fairly on the basis of it”). Exactly what is the difference between so- called objective and subjective measures?
The difference, in large part, pertains to the rules used to assign numbers to the attribute being assessed. With objective measures, the rules are predetermined and usually communicated and applied through some sort of scoring key or system. Most paper- and-pencil tests are considered objective. The scoring systems in sub-jective measures are more elusive and often involve a rater or judge who assigns the numbers. Many employment interviewers fall into this category, especially those with an idiosyncratic way of evaluating people’s responses, one that is not known or shared by other interviewers.
In principle, any attribute can be measured objectively or subjectively, and some-times both are used. Research shows that when an attribute is measured by both objective and subjective means, there is often relatively low agreement between scores from the two types of measures. A case in point pertains to the attribute of job performance. Performance may be measured objectively through quantity of output, and it may be measured subjectively through performance appraisal ratings, yet these two types of measures correlate only weakly with each other.4 Undoubtedly, the raters’ lack of sound scoring systems for rating job performance was a major contributor to the lack of obtained agreement.
It thus appears that whatever type of measure is used to assess attributes in staffing, serious attention should be paid to the scoring system or key. In a sense, this requires nothing more than having a firm knowledge of exactly what the orga-nization is trying to measure. This is true for both paper- and-pencil (objective) measures and judgmental (subjective) measures, such as the employment inter-view. It is simply another way of emphasizing the importance of standardization in measurement.
Scores
Measures yield numbers or scores to represent the amount of the attribute being assessed. Scores are thus the numerical indicator of the attribute. Once scores have
hen12680_ch07_310-368.indd 320 3/30/11 9:25 AM
CLARK, ANNETTE 1845BU
ChapTer Seven Measurement 321
been derived, they can be manipulated in various ways to give them even greater meaning and to better describe characteristics of the objects being scored.5
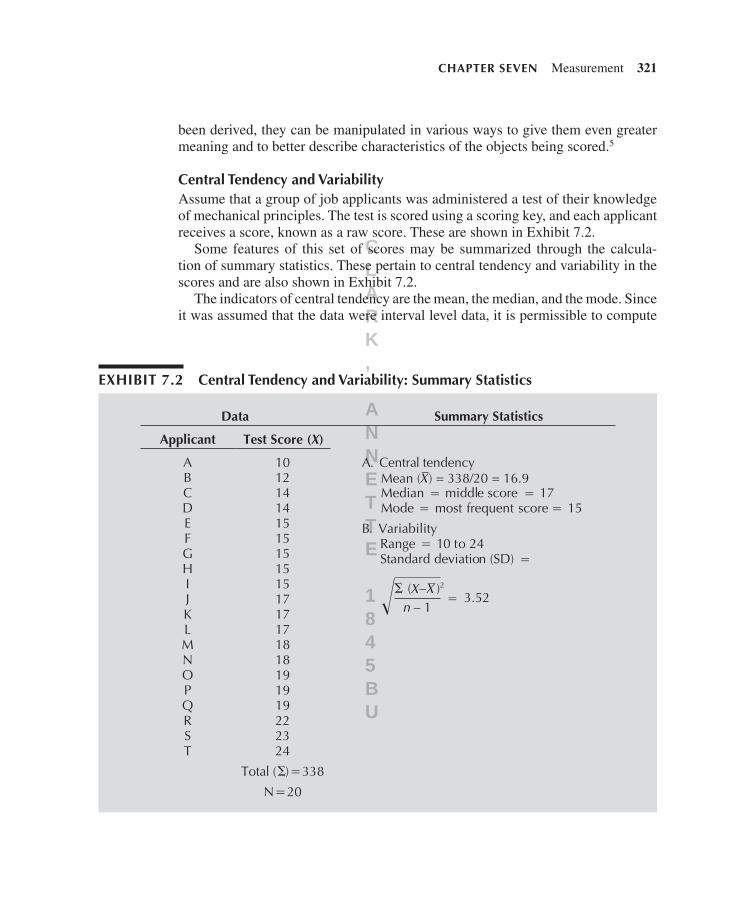
Central Tendency and variabilityAssume that a group of job applicants was administered a test of their knowledge of mechanical principles. The test is scored using a scoring key, and each applicant receives a score, known as a raw score. These are shown in Exhibit 7.2.
Some features of this set of scores may be summarized through the calcula-tion of summary statistics. These pertain to central tendency and variability in the scores and are also shown in Exhibit 7.2.
The indicators of central tendency are the mean, the median, and the mode. Since it was assumed that the data were interval level data, it is permissible to compute
scitsitatSyrammuSataD
Applicant Test Score (X)
ABCDEFGHIJKLMNOPQRST
1012141415151515151717171818191919222324
Total ( ) 338
N 20
A. Central tendency
Median middle score 17Mode most frequent score 15
B. VariabilityRange 10 to 24Standard deviation (SD)
2( )3.52
Mean (X) = 338/20 = 16.9_
X Xn – 1
–
exhibiT 7.2 Central Tendency and variability: Summary Statistics
hen12680_ch07_310-368.indd 321 3/30/11 9:25 AM
CLARK, ANNETTE 1845BU
322 parT FOur Staffing Activities: Selection
all three indicators of central tendency. Had the data been ordinal, the mean should not be computed. For nominal data, only the mode would be appropriate.
The variability indicators are the range and the standard deviation. The range shows the lowest to highest actual scores for the job applicants. The standard devi-ation shows, in essence, the average amount of deviation of individual scores from the average score. It summarizes the amount of spread in the scores. The larger the standard deviation, the greater the variability, or spread, in the data.
percentilesA percentile score for an individual is the percentage of people scoring below the individual in a distribution of scores. Refer again to Exhibit 7.2, and consider applicant C. That applicant’s percentile score is in the 10th percentile (2/20 3 100). Applicant S is in the 90th percentile (18/20 3 100).
Standard ScoresWhen interpreting scores, it is natural to compare individuals’ raw scores with the mean, that is, to ask whether scores are above, at, or below the mean. But a true understanding of how well an individual did relative to the mean takes into account the amount of variability in scores around the mean (the standard deviation). That is, the calculation must be “corrected” or controlled for the amount of variability in a score distribution to accurately present how well a person scored relative to the mean.
Calculation of the standard score for an individual is the way to accomplish this correction. The formula for calculation of the standard score, or Z, is as follows:
ZX XSD
=−
Applicant S in Exhibit 7.2 had a raw score of 23 on the test; the mean is 16.9 and the standard deviation is 3.52. Substituting into the above formula, applicant S has a Z score of 1.7. Thus, applicant S scored about 1.7 standard deviations above the mean.
Standard scores are also useful for determining how a person performed, in a relative sense, on two or more tests. For example, assume the following data for a particular applicant:
Test 1 Test 2Raw score 50 48Mean 48 46SD 2.5 .80
hen12680_ch07_310-368.indd 322 3/30/11 9:25 AM
CLARK, ANNETTE 1845BU
ChapTer Seven Measurement 323
On which test did the applicant do better? To answer that, simply calculate the applicant’s standard scores on the two tests. The Z score on test 1 is .80, and the Z score on test 2 is 2.5. Thus, while the applicant got a higher raw score on test 1 than on test 2, the applicant got a higher Z score on test 2 than on test 1. Viewed in this way, it is apparent that the applicant did better on the second of the two tests.
Correlation between Scores
Frequently in staffing there are scores on two or more measures for a group of individuals. One common occurrence is to have scores on two (or often, more than two) KSAO measures. For example, there could be a score on the test of knowl-edge of mechanical principles and also an overall rating of the applicant’s probable job success based on the employment interview. In such instances, it is logical to ask whether there is some relation between the two sets of scores. Is there a ten-dency for an increase in knowledge test scores to be accompanied by an increase in interview ratings?
As another example, an organization may have scores on a particular KSAO measure (e.g., the knowledge test) and on a measure of job performance (e.g., performance appraisal ratings) for a group of individuals. Is there a correlation between these two sets of scores? If there is, this would provide some evidence about the probable validity of the knowledge test as a predictor of job performance. This evidence would help the organization decide whether to incorporate the use of the test into the selection process for job applicants.
Investigation of the relationship between two sets of scores proceeds through the plotting of scatter diagrams and through calculation of the correlation coefficient.
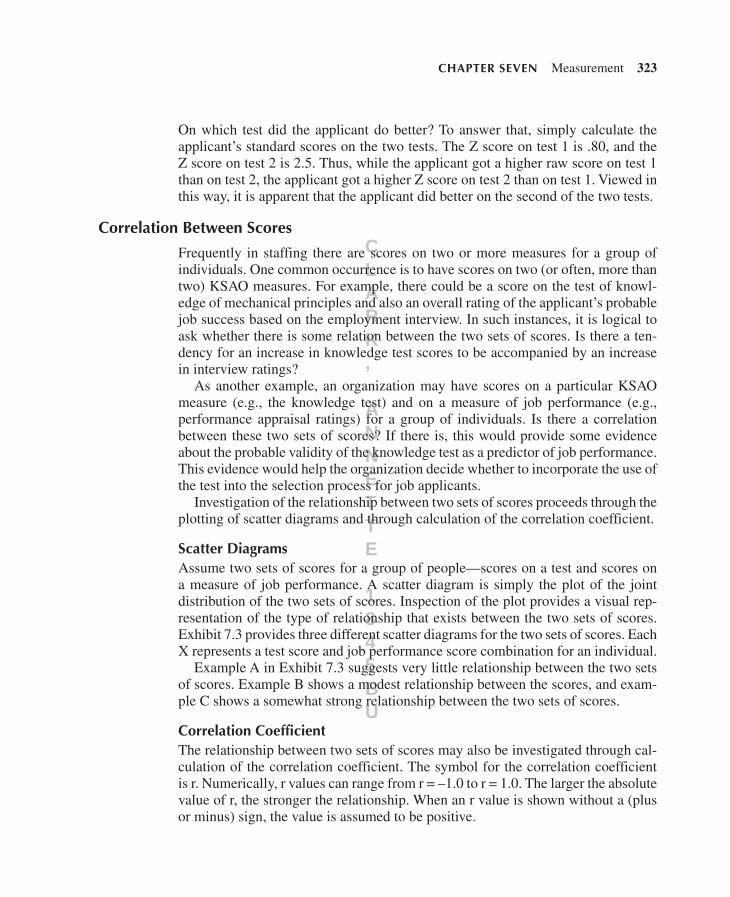
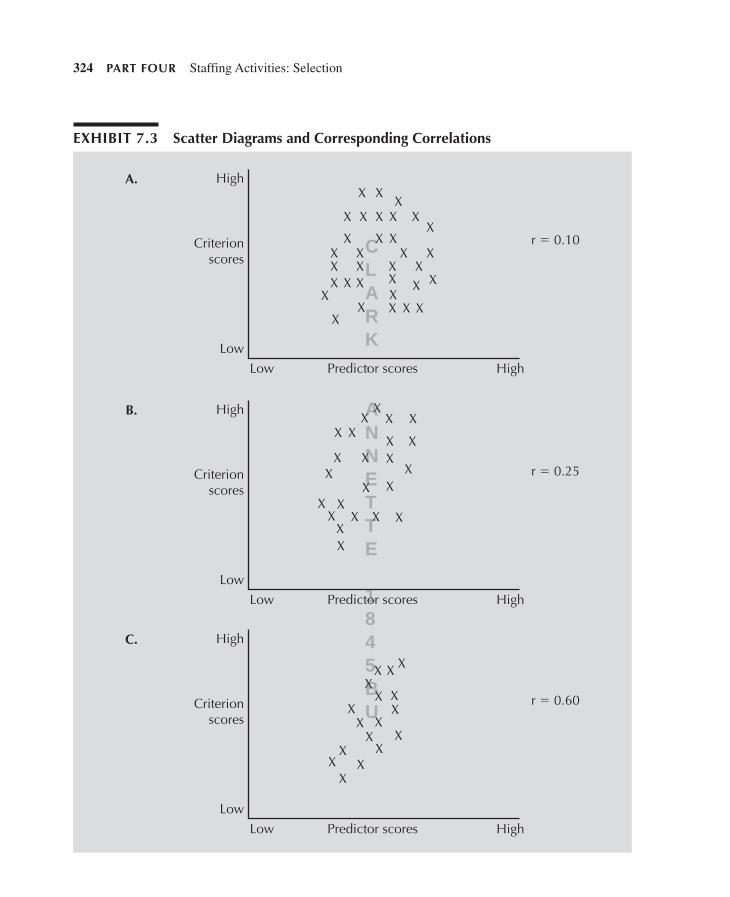
Scatter diagramsAssume two sets of scores for a group of people—scores on a test and scores on a measure of job performance. A scatter diagram is simply the plot of the joint distribution of the two sets of scores. Inspection of the plot provides a visual rep-resentation of the type of relationship that exists between the two sets of scores. Exhibit 7.3 provides three different scatter diagrams for the two sets of scores. Each X represents a test score and job performance score combination for an individual.
Example A in Exhibit 7.3 suggests very little relationship between the two sets of scores. Example B shows a modest relationship between the scores, and exam-ple C shows a somewhat strong relationship between the two sets of scores.
Correlation CoefficientThe relationship between two sets of scores may also be investigated through cal-culation of the correlation coefficient. The symbol for the correlation coefficient is r. Numerically, r values can range from r = –1.0 to r = 1.0. The larger the absolute value of r, the stronger the relationship. When an r value is shown without a (plus or minus) sign, the value is assumed to be positive.
hen12680_ch07_310-368.indd 323 3/30/11 9:25 AM
CLARK, ANNETTE 1845BU
324 parT FOur Staffing Activities: Selection
exhibiT 7.3 Scatter diagrams and Corresponding Correlations
High
Criterionscores
Low
Low Predictor scores High
r 0.10
XX
X
XXX X XX
XX XX X X XX X X XX X X X X X
X X
XX X X X
High
Criterionscores
Low
Low Predictor scores High
r 0.25
X XXXX
X
X X
XXX X
XX X
X XX X X X
XX
High
Criterionscores
Low
Low Predictor scores High
r 0.60
XXX
X
X XX X
X XX
XX
XX
XX
A.
B.
C.
hen12680_ch07_310-368.indd 324 3/30/11 9:25 AM
CLARK, ANNETTE 1845BU
ChapTer Seven Measurement 325
Naturally, the value of r bears a close resemblance to the scatter diagram. As a demonstration of this, Exhibit 7.3 also shows the approximate r value for each of the three scatter diagrams. The r in example A is low (r = .10), the r in example B is moderate (r = .25), and the r in example C is high (r = .60).
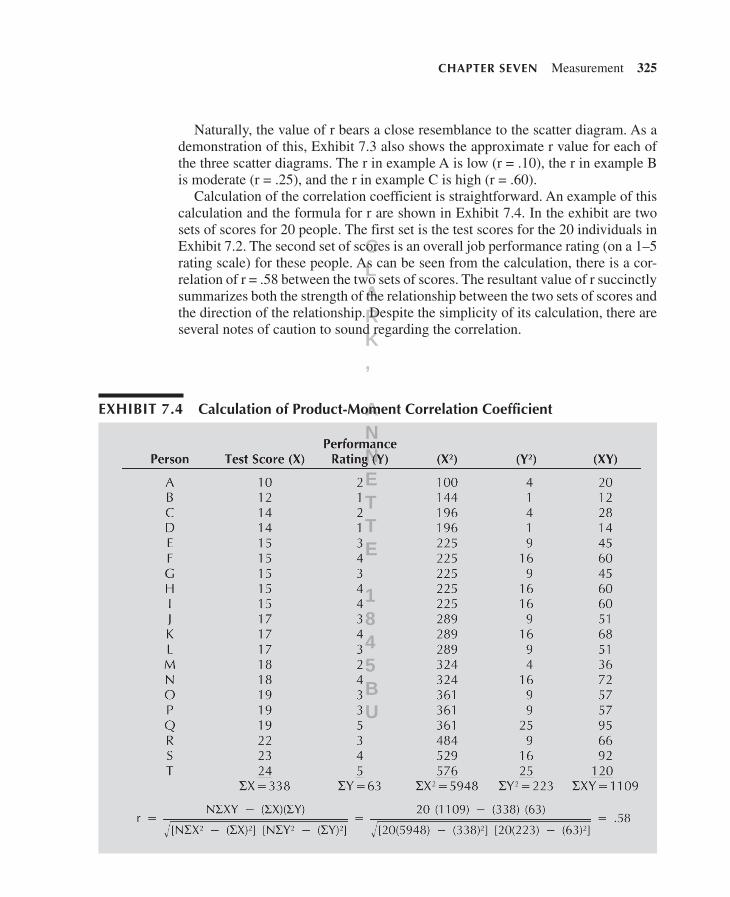
Calculation of the correlation coefficient is straightforward. An example of this calculation and the formula for r are shown in Exhibit 7.4. In the exhibit are two sets of scores for 20 people. The first set is the test scores for the 20 individuals in Exhibit 7.2. The second set of scores is an overall job performance rating (on a 1–5 rating scale) for these people. As can be seen from the calculation, there is a cor-relation of r = .58 between the two sets of scores. The resultant value of r succinctly summarizes both the strength of the relationship between the two sets of scores and the direction of the relationship. Despite the simplicity of its calculation, there are several notes of caution to sound regarding the correlation.
exhibiT 7.4 Calculation of product- Moment Correlation Coefficient
hen12680_ch07_310-368.indd 325 3/30/11 9:25 AM
CLARK, ANNETTE 1845BU
326 parT FOur Staffing Activities: Selection
First, the correlation does not connote a proportion or percentage. An r = .50 between variables X and Y does not mean that X is 50% of Y or that Y can be predicted from X with 50% accuracy. The appropriate interpretation is to square the value of r, for r2, and then say that the two variables share that percentage of common variation in their scores. Thus, the proper interpretation of r = .50 is that the two variables share 25% (.52 3 100) common variation in their scores.
Second, the value of r is affected by the amount of variation in each set of scores. Other things being equal, the less variation there is in one or both sets of scores, the smaller the calculated value of r will be. At the extreme, if one set of scores has no variation, the correlation will be r = .00. That is, for there to be a correlation, there must be variation in both sets of scores. The lack of variation in scores is called the problem of restriction of range.
Third, the formula used to calculate the correlation in Exhibit 7.4 is based on the assumption that there is a linear relationship between the two sets of scores. This may not always be a good assumption; something other than a straight line may best capture the true nature of the relationship between scores. To the extent that two sets of scores are not related in a linear fashion, use of the formula for calcula-tion of the correlation will yield a value of r that understates the actual strength of the relationship.
Finally, the correlation between two variables does not imply causation between them. A correlation simply says how two variables covary or correlate; it says nothing about one variable necessarily causing the other one.
Significance of the Correlation CoefficientThe statistical significance refers to the likelihood that a correlation exists in a population, based on knowledge of the actual value of r in a sample from that population. Concluding that a correlation is indeed statistically significant means that there is most likely a correlation in the population. That means if the organiza-tion were to use a selection measure based on a statistically significant correlation, the correlation is likely to be significant when used again to select another sample (e.g., future job applicants).
More formally, r is calculated in an initial group, called a sample. From this piece of information, the question arises whether to infer that there is also a cor-relation in the population. To answer this, compute the t value of our correlation using the following formula,
tr
r n=
− −( ) /1 22
where r is the value of the correlation, and n is the size of the sample.A t distribution table in any elementary statistics book shows the significance
level of r.6 The significance level is expressed as p < some value, for example,
hen12680_ch07_310-368.indd 326 3/30/11 9:25 AM
CLARK, ANNETTE 1845BU
ChapTer Seven Measurement 327
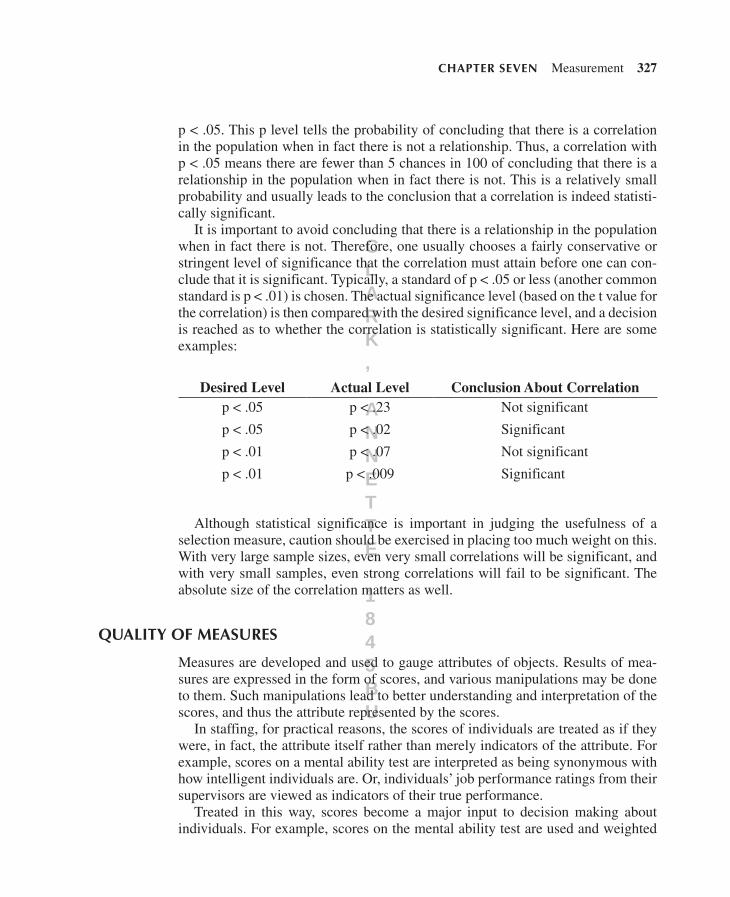
p < .05. This p level tells the probability of concluding that there is a correlation in the population when in fact there is not a relationship. Thus, a correlation with p < .05 means there are fewer than 5 chances in 100 of concluding that there is a relationship in the population when in fact there is not. This is a relatively small probability and usually leads to the conclusion that a correlation is indeed statisti-cally significant.
It is important to avoid concluding that there is a relationship in the population when in fact there is not. Therefore, one usually chooses a fairly conservative or stringent level of significance that the correlation must attain before one can con-clude that it is significant. Typically, a standard of p < .05 or less (another common standard is p < .01) is chosen. The actual significance level (based on the t value for the correlation) is then compared with the desired significance level, and a decision is reached as to whether the correlation is statistically significant. Here are some examples:
Although statistical significance is important in judging the usefulness of a selection measure, caution should be exercised in placing too much weight on this. With very large sample sizes, even very small correlations will be significant, and with very small samples, even strong correlations will fail to be significant. The absolute size of the correlation matters as well.
QuaLiTy OF MeaSureS
Measures are developed and used to gauge attributes of objects. Results of mea-sures are expressed in the form of scores, and various manipulations may be done to them. Such manipulations lead to better understanding and interpretation of the scores, and thus the attribute represented by the scores.
In staffing, for practical reasons, the scores of individuals are treated as if they were, in fact, the attribute itself rather than merely indicators of the attribute. For example, scores on a mental ability test are interpreted as being synonymous with how intelligent individuals are. Or, individuals’ job performance ratings from their supervisors are viewed as indicators of their true performance.
Treated in this way, scores become a major input to decision making about individuals. For example, scores on the mental ability test are used and weighted
Desired Level Actual Level Conclusion About Correlationp < .05 p < .23 Not significant
p < .05 p < .02 Significant
p < .01 p < .07 Not significant
p < .01 p < .009 Significant
hen12680_ch07_310-368.indd 327 3/30/11 9:25 AM
CLARK, ANNETTE 1845BU
328 parT FOur Staffing Activities: Selection
heavily to decide which job applicants will receive a job offer. Or, performance ratings may serve as a key factor in deciding which individuals will be eligible for an internal staffing move, such as a promotion. In these and numerous other ways, management uses these scores to guide the conduct of staffing activities in the organization. This is illustrated through such phrases as “Let the numbers do the talking,” “We manage by the numbers,” and “Never measured, never managed.”
The quality of the decisions made and the actions taken are unlikely to be any better than the quality of the measures on which they are based. Thus, there is a lot at stake in the quality of the measures used in staffing. Such concerns are best viewed in terms of reliability and validity of measures.7
reliability of Measures
Reliability of measurement refers to the consistency of measurement of an attri-bute.8 A measure is reliable to the extent that it provides a consistent set of scores to represent an attribute. Rarely is perfect reliability achieved, because of the occur-rence of measurement error. Reliability is thus a matter of degree.
Reliability of measurement is of concern both within a single time period in which the attribute is being measured and between time periods. Moreover, reli-ability is of concern for both objective and subjective measures. These two con-cerns help create a general framework for better understanding reliability.
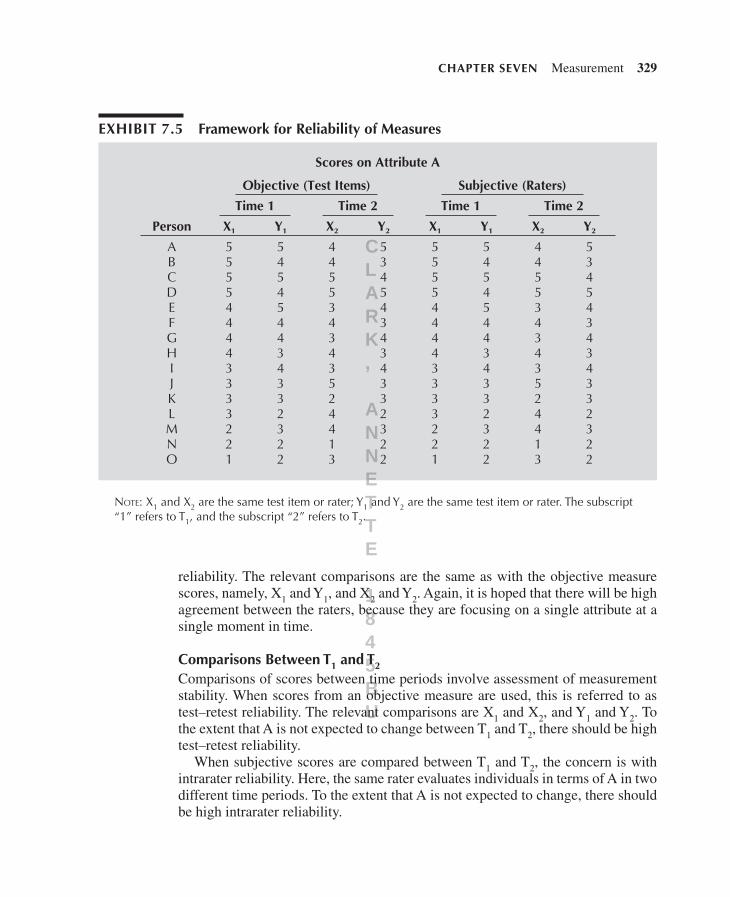
The key concepts for the framework are shown in Exhibit 7.5. In the exhibit, a single attribute, “A” (e.g., knowledge of mechanical principles), is being mea-sured. Scores (ranging from 1 to 5) are available for 15 individuals. A is being measured in time period 1 (T1) and time period 2 (T2). In each time period, A may be measured objectively, with two test items, or subjectively, with two raters. The same two items or raters are used in each time period. (In reality, more than two items or raters would probably be used to measure A, but for simplicity, only two are used here.) Each test item or rater in each time period is a submeasure of A. There are thus four submeasures of A—designated X1, X2, Y1, and Y2—and four sets of scores. In terms of reliability of measurement, the concern is with the con-sistency or similarity in the sets of scores. This requires various comparisons of the scores.
Comparisons Within T1 or T2
Consider the four sets of scores as coming from the objective measure, which used test items. Comparing sets of scores from these items in either T1 or T2 is called internal consistency reliability. The relevant comparisons are X1 and Y1, and X2 and Y2. It is hoped that the comparisons will show high similarity, because both items are intended to measure A within the same time period.
Now treat the four sets of scores as coming from the subjective measure, which relied on raters. Comparisons of these scores involve what is called interrater
hen12680_ch07_310-368.indd 328 3/30/11 9:25 AM
CLARK, ANNETTE 1845BU
ChapTer Seven Measurement 329
reliability. The relevant comparisons are the same as with the objective measure scores, namely, X1 and Y1, and X2 and Y2. Again, it is hoped that there will be high agreement between the raters, because they are focusing on a single attribute at a single moment in time.
Comparisons between T1 and T2
Comparisons of scores between time periods involve assessment of measurement stability. When scores from an objective measure are used, this is referred to as test–retest reliability. The relevant comparisons are X1 and X2, and Y1 and Y2. To the extent that A is not expected to change between T1 and T2, there should be high test–retest reliability.
When subjective scores are compared between T1 and T2, the concern is with intrarater reliability. Here, the same rater evaluates individuals in terms of A in two different time periods. To the extent that A is not expected to change, there should be high intrarater reliability.
exhibiT 7.5 Framework for reliability of Measures
Scores on Attribute A
Person
Objective (Test Items)
Time 1
X1 Y1
Time 2
X2 Y2
Subjective (Raters)
Time 1
X1 Y1
Time 2
X2 Y2
ABCDEFGHIJKLMNO
555544443333221
545454434332322
445534343524413
534543434332322
555544443333221
545454434332322
445534343524413
534543434332322
Note: X1 and X2 are the same test item or rater; Y1 and Y2 are the same test item or rater. The subscript “1” refers to T1, and the subscript “2” refers to T2.
hen12680_ch07_310-368.indd 329 3/30/11 9:25 AM
CLARK, ANNETTE 1845BU
330 parT FOur Staffing Activities: Selection
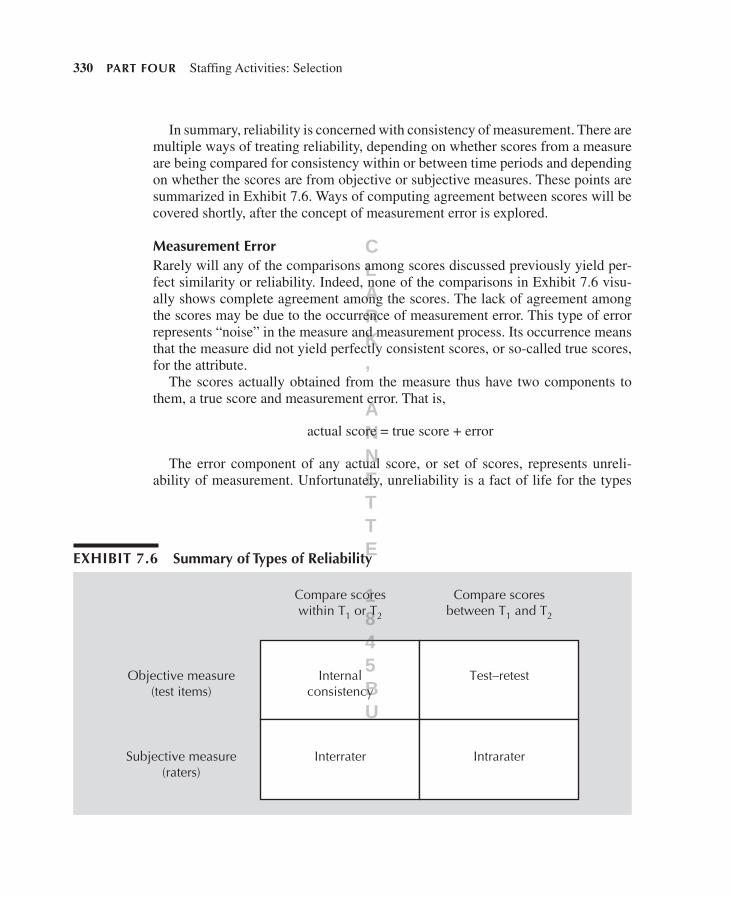
In summary, reliability is concerned with consistency of measurement. There are multiple ways of treating reliability, depending on whether scores from a measure are being compared for consistency within or between time periods and depending on whether the scores are from objective or subjective measures. These points are summarized in Exhibit 7.6. Ways of computing agreement between scores will be covered shortly, after the concept of measurement error is explored.
Measurement errorRarely will any of the comparisons among scores discussed previously yield per-fect similarity or reliability. Indeed, none of the comparisons in Exhibit 7.6 visu-ally shows complete agreement among the scores. The lack of agreement among the scores may be due to the occurrence of measurement error. This type of error represents “noise” in the measure and measurement process. Its occurrence means that the measure did not yield perfectly consistent scores, or so- called true scores, for the attribute.
The scores actually obtained from the measure thus have two components to them, a true score and measurement error. That is,
actual score = true score + error
The error component of any actual score, or set of scores, represents unreli-ability of measurement. Unfortunately, unreliability is a fact of life for the types
exhibiT 7.6 Summary of Types of reliability
Compare scoreswithin T1 or T2
Compare scoresbetween T1 and T2
Internalconsistency
Test–retestObjective measure(test items)
Subjective measure(raters)
Interrater Intrarater
hen12680_ch07_310-368.indd 330 3/30/11 9:25 AM
CLARK, ANNETTE 1845BU
ChapTer Seven Measurement 331
of measures used in staffing. To help understand why this is the case, the various types or sources of error that can occur in a staffing context must be explored. These errors may be grouped under the categories of deficiency error and contami-nation error.9
Deficiency Error. Deficiency error occurs when there is failure to measure some portion or aspect of the attribute assessed. For example, if knowledge of mechani-cal principles involves gear ratios, among other things, and our test does not have any items (or an insufficient number of items) covering this aspect, the test is deficient. As another example, if an attribute of job performance is “planning and setting work priorities,” and the raters fail to rate people on that dimension during their performance appraisal, the performance measure is deficient.
Deficiency error can occur in several related ways. First, the attribute may have been inadequately defined in the first place. Thus, the test of knowledge of mechanical principles may fail to address familiarity with gear ratios because it was never included in the initial definition of mechanical principles. Or, the perfor-mance measure may fail to require raters to rate their employees on “planning and setting work priorities” because this attribute was never considered an important dimension of their work.
A second way that deficiency error occurs is in the construction of measures used to assess the attribute. Here, the attribute may be well defined and understood, but there is a failure to construct a measure that adequately gets at the totality of the attribute. This is akin to poor measurement by oversight, which happens when measures are constructed in a hurried, ad hoc fashion.
Deficiency error also occurs when the organization opts to use whatever mea-sures are available because of ease, cost considerations, sales pitches and promo-tional claims, and so forth. The measures so chosen may turn out to be deficient.
Contamination Error. Contamination error represents the occurrence of unwanted or undesirable influence on the measure and on individuals for whom the measure is being used. These influences muddy the scores and make them dif-ficult to interpret.
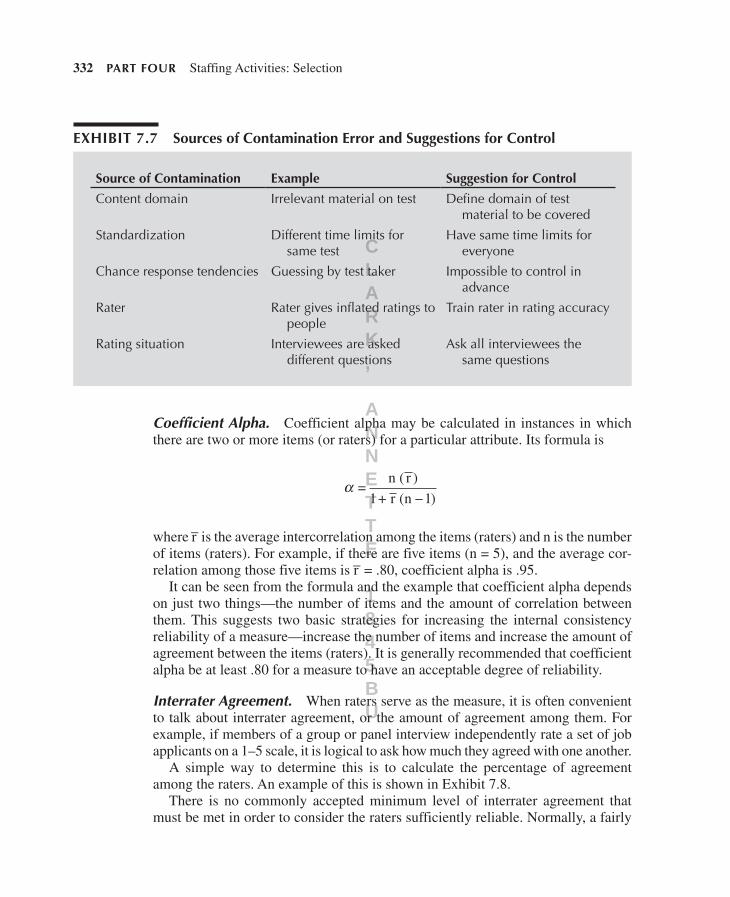
Sources of contamination abound, as do examples of them. Several of these sources and examples are shown in Exhibit 7.7, along with some suggestions for how they might be controlled. These examples show that contamination error is multifaceted, making it difficult to minimize and control.
Calculation of reliability estimatesNumerous procedures are available for calculating actual estimates of the degree of reliability of measurement.10 The first two of these (coefficient alpha and interrater agreement) assess reliability within a single time period. The other two procedures (test–retest and intrarater agreement) assess reliability between time periods.
hen12680_ch07_310-368.indd 331 3/30/11 9:25 AM
CLARK, ANNETTE 1845BU
332 parT FOur Staffing Activities: Selection
Coefficient Alpha. Coefficient alpha may be calculated in instances in which there are two or more items (or raters) for a particular attribute. Its formula is
α =+ −
n ( r )
r n1 1( )
where r– is the average intercorrelation among the items (raters) and n is the number of items (raters). For example, if there are five items (n = 5), and the average cor-relation among those five items is r– = .80, coefficient alpha is .95.
It can be seen from the formula and the example that coefficient alpha depends on just two things—the number of items and the amount of correlation between them. This suggests two basic strategies for increasing the internal consistency reliability of a measure—increase the number of items and increase the amount of agreement between the items (raters). It is generally recommended that coefficient alpha be at least .80 for a measure to have an acceptable degree of reliability.
Interrater Agreement. When raters serve as the measure, it is often convenient to talk about interrater agreement, or the amount of agreement among them. For example, if members of a group or panel interview independently rate a set of job applicants on a 1–5 scale, it is logical to ask how much they agreed with one another.
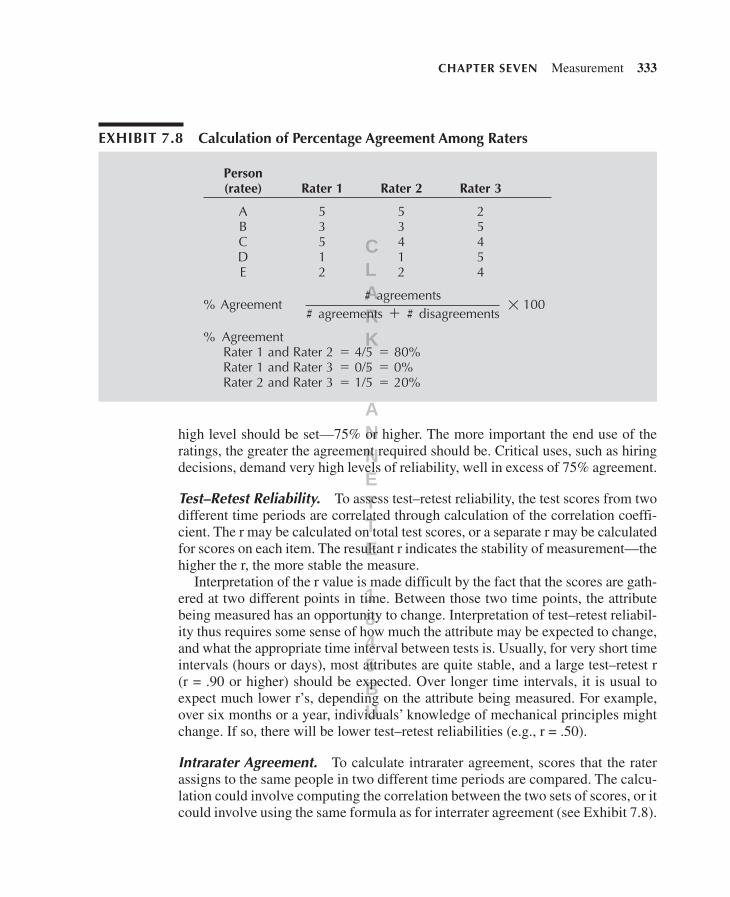
A simple way to determine this is to calculate the percentage of agreement among the raters. An example of this is shown in Exhibit 7.8.
There is no commonly accepted minimum level of interrater agreement that must be met in order to consider the raters sufficiently reliable. Normally, a fairly
Source of Contamination example Suggestion for Control
Content domain Irrelevant material on test Define domain of test material to be covered
Standardization Different time limits for same test
Have same time limits for everyone
Chance response tendencies Guessing by test taker Impossible to control in advance
Rater Rater gives inflated ratings to people
Train rater in rating accuracy
Rating situation Interviewees are asked different questions
Ask all interviewees the same questions
exhibiT 7.7 Sources of Contamination error and Suggestions for Control
hen12680_ch07_310-368.indd 332 3/30/11 9:25 AM
CLARK, ANNETTE 1845BU
ChapTer Seven Measurement 333
high level should be set—75% or higher. The more important the end use of the ratings, the greater the agreement required should be. Critical uses, such as hiring decisions, demand very high levels of reliability, well in excess of 75% agreement.
Test–Retest Reliability. To assess test–retest reliability, the test scores from two different time periods are correlated through calculation of the correlation coeffi-cient. The r may be calculated on total test scores, or a separate r may be calculated for scores on each item. The resultant r indicates the stability of measurement—the higher the r, the more stable the measure.
Interpretation of the r value is made difficult by the fact that the scores are gath-ered at two different points in time. Between those two time points, the attribute being measured has an opportunity to change. Interpretation of test–retest reliabil-ity thus requires some sense of how much the attribute may be expected to change, and what the appropriate time interval between tests is. Usually, for very short time intervals (hours or days), most attributes are quite stable, and a large test–retest r (r = .90 or higher) should be expected. Over longer time intervals, it is usual to expect much lower r’s, depending on the attribute being measured. For example, over six months or a year, individuals’ knowledge of mechanical principles might change. If so, there will be lower test–retest reliabilities (e.g., r = .50).
Intrarater Agreement. To calculate intrarater agreement, scores that the rater assigns to the same people in two different time periods are compared. The calcu-lation could involve computing the correlation between the two sets of scores, or it could involve using the same formula as for interrater agreement (see Exhibit 7.8).
exhibiT 7.8 Calculation of percentage agreement among raters
Person(ratee) Rater 1 Rater 2 Rater 3
A 5 5 2B 3 3 5C 5 4 4D 1 1 5E 2 2 4
# agreements001tnemeergA%
# agreements # disagreements
% AgreementRater 1 and Rater 2 4/5 80%Rater 1 and Rater 3 0/5 0%Rater 2 and Rater 3 1/5 20%
hen12680_ch07_310-368.indd 333 3/30/11 9:25 AM
CLARK, ANNETTE 1845BU
334 parT FOur Staffing Activities: Selection
Interpretation of intrarater agreement is made difficult by the time factor. For short time intervals between measures, a fairly high relationship is expected (e.g., r = .80, or percentage agreement = 90%). For longer time intervals, the level of reliability may reasonably be expected to be lower.
implications of reliabilityThe degree of reliability of a measure has two implications. The first of these per-tains to interpreting individuals’ scores on the measure and the standard error of measurement. The second implication pertains to the effect that reliability has on the measure’s validity.
Standard Error of Measurement. Measures yield scores, which in turn are used as critical inputs for decision making in staffing activities. For example, in Exhibit 7.1 a test of knowledge of mechanical principles was developed and administered to job applicants. The applicants’ scores were used as a basis for making hiring decisions.
The discussion of reliability suggests that measures and scores will usually have some amount of error in them. Hence, scores on the test of knowledge of mechani-cal principles most likely reflect both true knowledge and error. Since only a single score is obtained from each applicant, the critical issue is how accurately that par-ticular score indicates the applicant’s true level of knowledge of mechanical prin-ciples alone.
The standard error of measurement (SEM) addresses this issue. It provides a way to state, within limits, a person’s likely score on a measure. The formula for the SEM is
SEM SD rx xx
= −1
where SDx is the standard deviation of scores on the measure and rxx is an estimate of the measure’s reliability. For example, if SDx = 10 and rxx = .75 (based on coef-ficient alpha), SEM = 5.
With the SEM known, the range within which any individual’s true score is likely to fall can be estimated. This range is known as a confidence interval or limit. There is a 95% chance that a person’s true score lies within ±2 SEM of his or her actual score. Thus, if an applicant received a score of 22 on the test of knowl-edge of mechanical principles, the applicant’s true score is most likely to be within the range of 22 ± 2(5), or 12–32.
Recognition and use of the SEM allow for care in interpreting people’s scores, as well as differences between individuals in terms of their scores. For example, using the preceding data, if the test score for applicant 1 is 22 and the score for applicant 2 is 19, what should be made of the difference between the two applicants? Is applicant 1 truly more knowledgeable of mechanical principles than applicant 2?
hen12680_ch07_310-368.indd 334 3/30/11 9:25 AM
CLARK, ANNETTE 1845BU
ChapTer Seven Measurement 335
The answer is probably not. This is because of the SEM and the large amount of overlap between the two applicants’ intervals (12–32 for applicant 1, and 9–29 for applicant 2).
In short, there is not a one- to-one correspondence between actual scores and true scores. Most measures used in staffing are sufficiently unreliable, meaning that small differences in scores are probably due to error of measurement and should be ignored.
Relationship to Validity. The validity of a measure is defined as the degree to which it measures the attribute it is supposed to be measuring. For example, the validity of the test of knowledge of mechanical principles is the degree to which it measures that knowledge. There are specific ways to investigate validity, and these are discussed in the next section. Here, it simply needs to be recognized that the reliability with which an attribute is measured has direct implications for the validity of the measure.
The relationship between the reliability and the validity of a measure is
r rxy xx≤
where rxy is the validity of the measure and rxx is the reliability of the measure. For example, it had been assumed previously that the reliability of the test of knowl-edge of mechanical principles was r = .75. The validity of that test thus cannot exceed .75 86= .
Thus, the reliability of a measure places an upper limit on the possible validity of a measure. It should be emphasized that this is only an upper limit. A highly reliable measure is not necessarily valid. Reliability does not guarantee validity; it only makes validity possible.
validity of Measures
The validity of a measure is defined as the degree to which it measures the attribute it is intended to measure.11 Refer back to Exhibit 7.1, which involved the develop-ment of a test of knowledge of mechanical principles that was to be used in select-ing job applicants. The validity of this test is the degree to which it truly measures the attribute or construct “knowledge of mechanical principles.”
Judgments about the validity of a measure occur through the process of gath-ering data and evidence about the measure to assess how it was developed and whether accurate inferences can be made from scores on the measure. This process can be illustrated in terms of concepts pertaining to accuracy of measurement and accuracy of prediction. These concepts may then be used to demonstrate how vali-dation of measures occurs in staffing.
hen12680_ch07_310-368.indd 335 3/30/11 9:25 AM
CLARK, ANNETTE 1845BU
336 parT FOur Staffing Activities: Selection
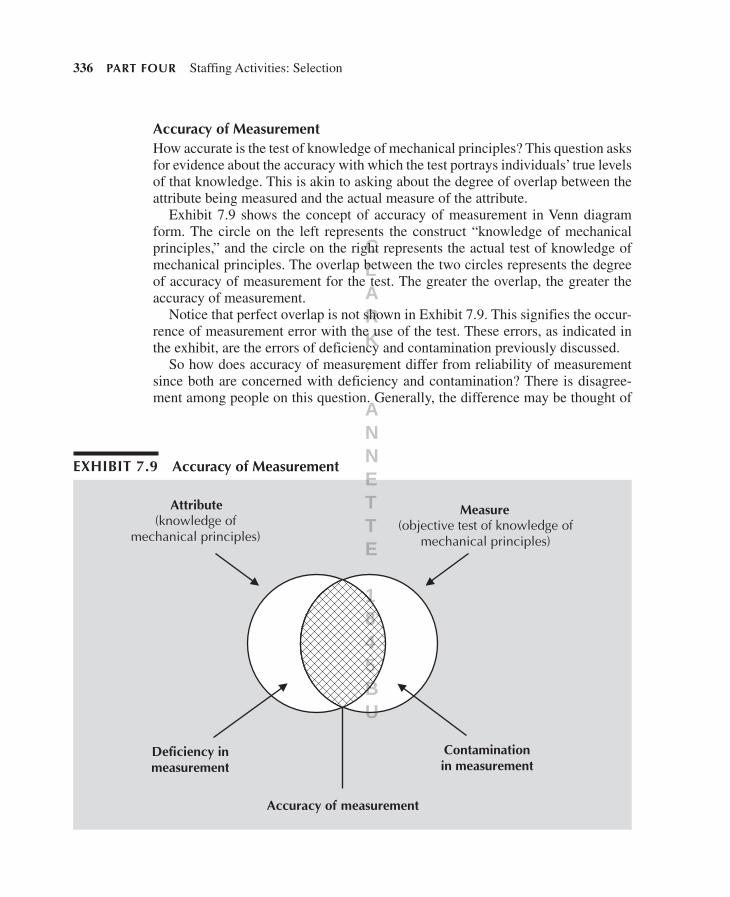
accuracy of MeasurementHow accurate is the test of knowledge of mechanical principles? This question asks for evidence about the accuracy with which the test portrays individuals’ true levels of that knowledge. This is akin to asking about the degree of overlap between the attribute being measured and the actual measure of the attribute.
Exhibit 7.9 shows the concept of accuracy of measurement in Venn diagram form. The circle on the left represents the construct “knowledge of mechanical principles,” and the circle on the right represents the actual test of knowledge of mechanical principles. The overlap between the two circles represents the degree of accuracy of measurement for the test. The greater the overlap, the greater the accuracy of measurement.
Notice that perfect overlap is not shown in Exhibit 7.9. This signifies the occur-rence of measurement error with the use of the test. These errors, as indicated in the exhibit, are the errors of deficiency and contamination previously discussed.
So how does accuracy of measurement differ from reliability of measurement since both are concerned with deficiency and contamination? There is disagree-ment among people on this question. Generally, the difference may be thought of
exhibiT 7.9 accuracy of Measurement
hen12680_ch07_310-368.indd 336 3/30/11 9:25 AM
CLARK, ANNETTE 1845BU
ChapTer Seven Measurement 337
as follows. Reliability refers to consistency among the scores on the test, as deter-mined by comparing scores as previously described. Accuracy of measurement goes beyond this to assess the extent to which the scores truly reflect the attribute being measured—the overlap shown in Exhibit 7.9. Accuracy requires reliabil-ity, but it also requires more by way of evidence. For example, accuracy requires knowing something about how the test was developed. Accuracy also requires some evidence concerning how test scores are influenced by other factors—for example, how do test scores change as a result of employees attending a training program devoted to providing instruction in mechanical principles? Accuracy thus demands greater evidence than reliability.
accuracy of predictionMeasures are often developed because they provide information about people that can be used to make predictions about them. In Exhibit 7.1, the knowledge test was to be used to help make hiring decisions, which are actually predictions about which people will be successful at a job. Knowing something about the accuracy with which a test predicts future job success requires examining the relationship between scores on the test and scores on some measure of job success for a group of people.
Accuracy of prediction is illustrated in the top half of Exhibit 7.10. Where there is an actual job success outcome (criterion) to predict, the test (predictor) will be used to predict the criterion. Each person is classified as high or low on the pre-dictor and high or low on the criterion, based on predictor and criterion scores. Individuals falling into cells A and C represent correct predictions, and individuals falling into cells B and D represent errors in prediction. Accuracy of prediction is the percentage of total correct predictions and can range from 0% to 100%.
The bottom half of Exhibit 7.10 shows an example of the determination of accu-racy of prediction using a selection example. The predictor is the test of knowledge of mechanical principles, and the criterion is an overall measure of job perfor-mance. Scores on the predictor and criterion measures are gathered for 100 job applicants and are dichotomized into high or low scores on each. Each individual is placed into one of the four cells. The accuracy of prediction for the test is 70%.
validation of Measures in Staffing
In staffing, there is concern with the validity of predictors in terms of both accu-racy of measurement and accuracy of prediction. It is important to have and use predictors that accurately represent the KSAOs to be measured, and those predic-tors need to be accurate in their predictions of job success. The validity of predic-tors is explored through the conduct of validation studies.
Two types of validation studies are typically conducted. The first of these is criterion- related validation, and the second is content validation. A third type of validation study, known as construct validation, involves components of reliability,
hen12680_ch07_310-368.indd 337 3/30/11 9:25 AM
CLARK, ANNETTE 1845BU
338 parT FOur Staffing Activities: Selection
criterion- related validation, and content validation. Each component is discussed separately in this book, and thus no further reference is made to construct validation.
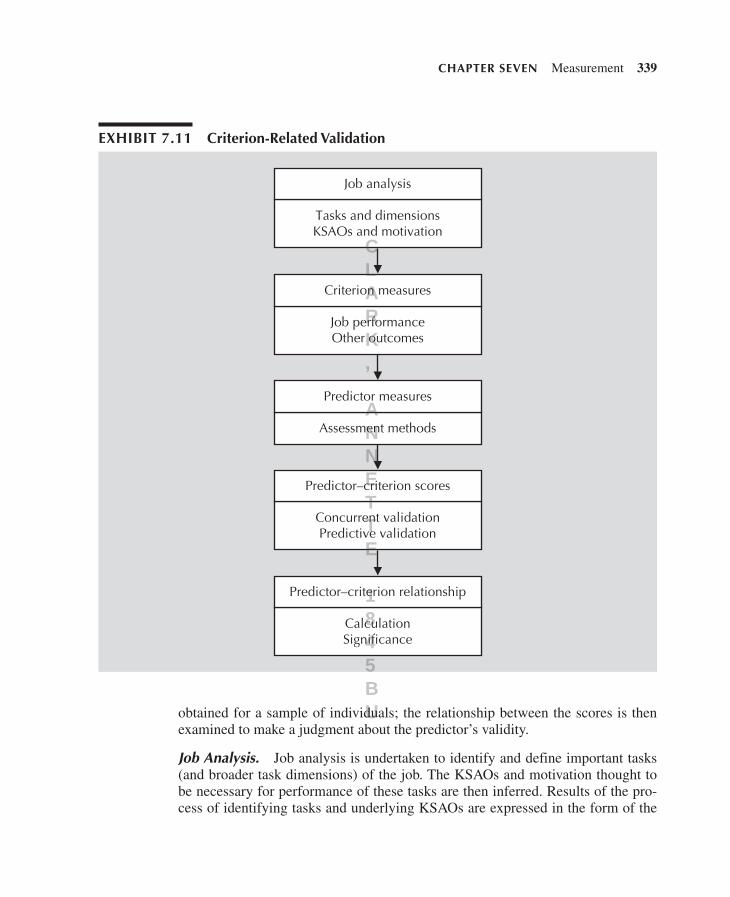
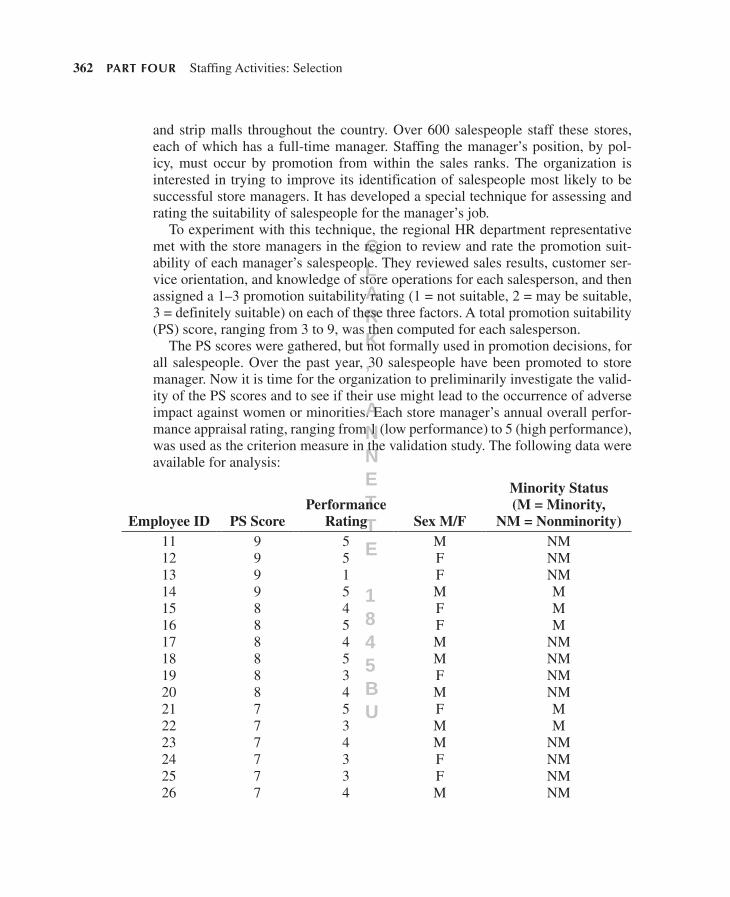
Criterion-related validationExhibit 7.11 shows the components of criterion- related validation and their usual sequencing.12 The process begins with job analysis. Results of job analysis are fed into criterion and predictor measures. Scores on the predictor and criterion are
exhibiT 7.10 accuracy of prediction
hen12680_ch07_310-368.indd 338 3/30/11 9:25 AM
CLARK, ANNETTE 1845BU
ChapTer Seven Measurement 339
obtained for a sample of individuals; the relationship between the scores is then examined to make a judgment about the predictor’s validity.
Job Analysis. Job analysis is undertaken to identify and define important tasks (and broader task dimensions) of the job. The KSAOs and motivation thought to be necessary for performance of these tasks are then inferred. Results of the pro-cess of identifying tasks and underlying KSAOs are expressed in the form of the
exhibiT 7.11 Criterion- related validation
Job analysis
Job performanceOther outcomes
Assessment methods
Concurrent validationPredictive validation
CalculationSignificance
Tasks and dimensionsKSAOs and motivation
Predictor–criterion relationship
Predictor–criterion scores
Predictor measures
Criterion measures
hen12680_ch07_310-368.indd 339 3/30/11 9:25 AM
CLARK, ANNETTE 1845BU
340 parT FOur Staffing Activities: Selection
job requirements matrix. The matrix is a task 3 KSAO matrix; it shows the tasks required and the relevant KSAOs for each task.
Criterion Measures. Measures of performance on tasks and task dimensions are needed. These may already be available as part of an ongoing performance appraisal system, or they may have to be developed. However these measures are gathered, it is critical that they be as free from measurement error as possible.
Criterion measures need not be restricted to performance measures. Others may be used, such as measures of attendance, retention, safety, and customer service. As with performance- based criterion measures, these alternative criterion mea-sures should also be as error- free as possible.
Predictor Measure. The predictor measure is the measure whose criterion-related validity is being investigated. Ideally, it taps into one or more of the KSAOs identified in job analysis. Also, it should be the type of measure most suitable to assess the KSAOs. Knowledge of mechanical principles, for example, is probably best assessed with some form of written, objective test.
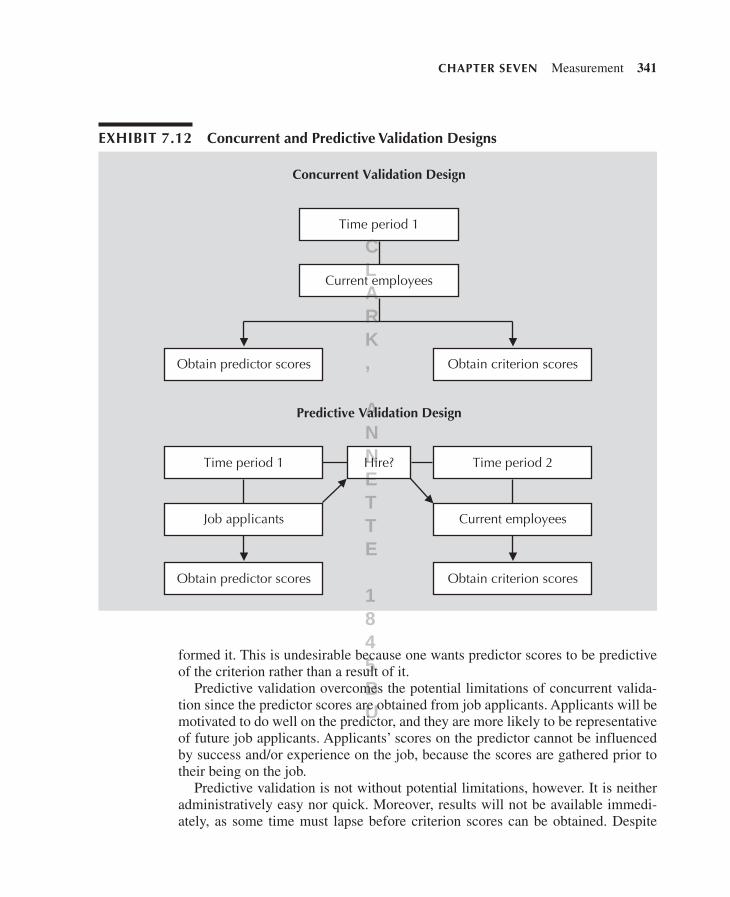
Predictor–Criterion Scores. Predictor and criterion scores must be gathered from a sample of current employees or job applicants. If current employees are used, a concurrent validation design is used. Alternately, if job applicants are used, a predictive validation design is used. The nature of these two designs is shown in Exhibit 7.12.
Concurrent validation definitely has some appeal. Administratively, it is conve-nient and can often be done quickly. Moreover, results of the validation study will be available soon after the predictor and criterion scores have been gathered.
Unfortunately, some serious problems can arise with use of a concurrent valida-tion design. One problem is that if the predictor is a test, current employees may not be motivated in the same way that job applicants would be in terms of the desire to perform well. Yet, it is future applicants for whom the test is intended to be used.
In a related vein, current employees may not be similar to, or representative of, future job applicants. Current employees may differ in terms of demographics such as age, race, sex, disability status, education level, and previous job experi-ence. Hence, it is by no means certain that the results of the study will general-ize to future job applicants. Also, some unsatisfactory employees will have been terminated, and some high performers may have been promoted. This leads to restriction of range on the criterion scores, which in turn will lower the correlation between the predictor and criterion scores.
Finally, current employees’ predictor scores may be influenced by the amount of experience and/or success they have had in their current job. For example, scores on the test of knowledge of mechanical principles may reflect not only that knowl-edge but also how long people have been on the job and how well they have per-
hen12680_ch07_310-368.indd 340 3/30/11 9:25 AM
CLARK, ANNETTE 1845BU
ChapTer Seven Measurement 341
formed it. This is undesirable because one wants predictor scores to be predictive of the criterion rather than a result of it.
Predictive validation overcomes the potential limitations of concurrent valida-tion since the predictor scores are obtained from job applicants. Applicants will be motivated to do well on the predictor, and they are more likely to be representative of future job applicants. Applicants’ scores on the predictor cannot be influenced by success and/or experience on the job, because the scores are gathered prior to their being on the job.
Predictive validation is not without potential limitations, however. It is neither administratively easy nor quick. Moreover, results will not be available immedi-ately, as some time must lapse before criterion scores can be obtained. Despite
exhibiT 7.12 Concurrent and predictive validation designs
Time period 1
Concurrent Validation Design
Current employees
Obtain predictor scores Obtain criterion scores
Predictive Validation Design
Time period 1
Job applicants
Obtain predictor scores
Time period 2
Current employees
Obtain criterion scores
Hire?
hen12680_ch07_310-368.indd 341 3/30/11 9:25 AM
CLARK, ANNETTE 1845BU
342 parT FOur Staffing Activities: Selection
these limitations, predictive validation is considered the more sound of the two designs.
Predictor–Criterion Relationship. Once predictor and criterion scores have been obtained, the correlation r, or some variation of it, must be calculated. The value of r is then referred to as the validity of the scores on the predictor. For exam-ple, if an r = .35 was found, the predictor would be referred to as having a validity of .35. Then, the practical and statistical significance of the r should be determined. Only if the r meets desired levels of practical and statistical significance should the predictor be considered valid and thus potentially usable in the selection system.
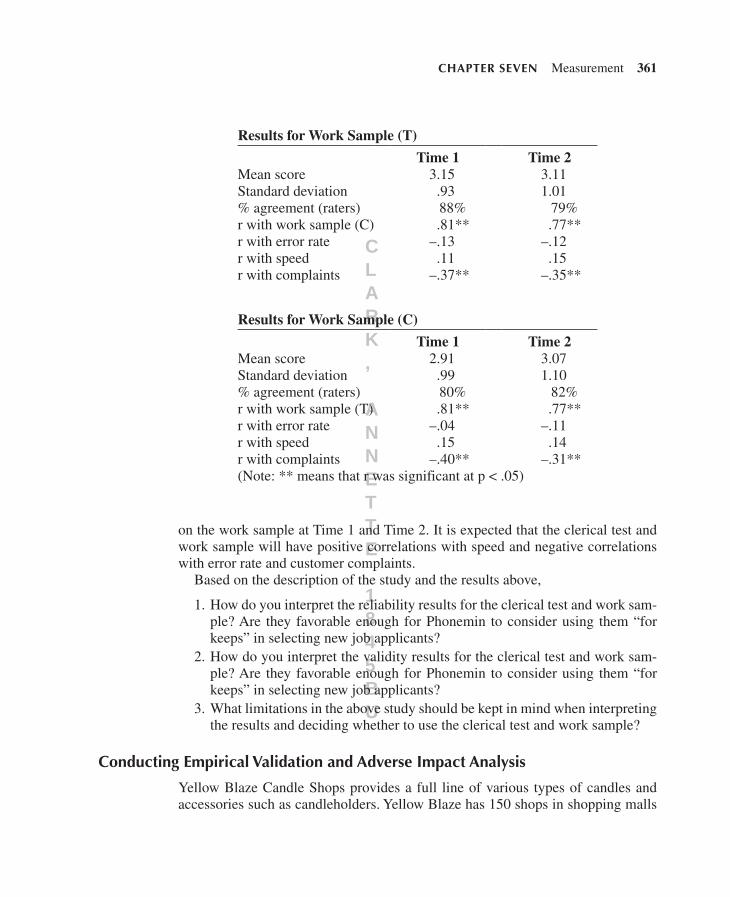
Illustrative Study. A state university civil service system covering 20 institu-tions sought to identify predictors of job performance for clerical employees. The clerical job existed within different schools (e.g., engineering, humanities) and nonacademic departments (e.g., payroll, data processing). The goal of the study was to have a valid clerical test in two parallel forms that could be administered to job applicants in one hour.
The starting point was to conduct a job analysis, the results of which would be used as the basis for constructing the clerical tests (predictors) and the job perfor-mance ratings (criteria). Subject matter experts (SMEs) used job observation and previous job descriptions to construct a task- based questionnaire that was admin-istered to clerical incumbents and their supervisors throughout the system. Task statements were rated in terms of importance, frequency, and essentialness (if it was essential for a newly hired employee to know how to do this task). Based on statistical analysis of the ratings’ means and standard deviations, 25 of the 188 task statements were retained as critical task statements. These critical task statements were the key input to the identification of key KSAOs and the dimension of job performance.
Analysis of the 25 critical task statements indicated there were five KSAO components of the job: knowledge of computer hardware and software, ability to follow instructions and prioritize tasks, knowledge and skill in responding to telephone and reception scenarios, knowledge of English language, and ability to file items in alphabetical order. A test was constructed to measure these KSAOs as follows:
• Computer hardware and software—17 questions• Prioritizing tasks—18 questions• Route and transfer calls—14 questions• Record messages—20 questions• Give information on the phone—20 questions• Correct sentences with errors—22 questions• Identify errors in sentences—71 questions
hen12680_ch07_310-368.indd 342 3/30/11 9:25 AM
CLARK, ANNETTE 1845BU
ChapTer Seven Measurement 343
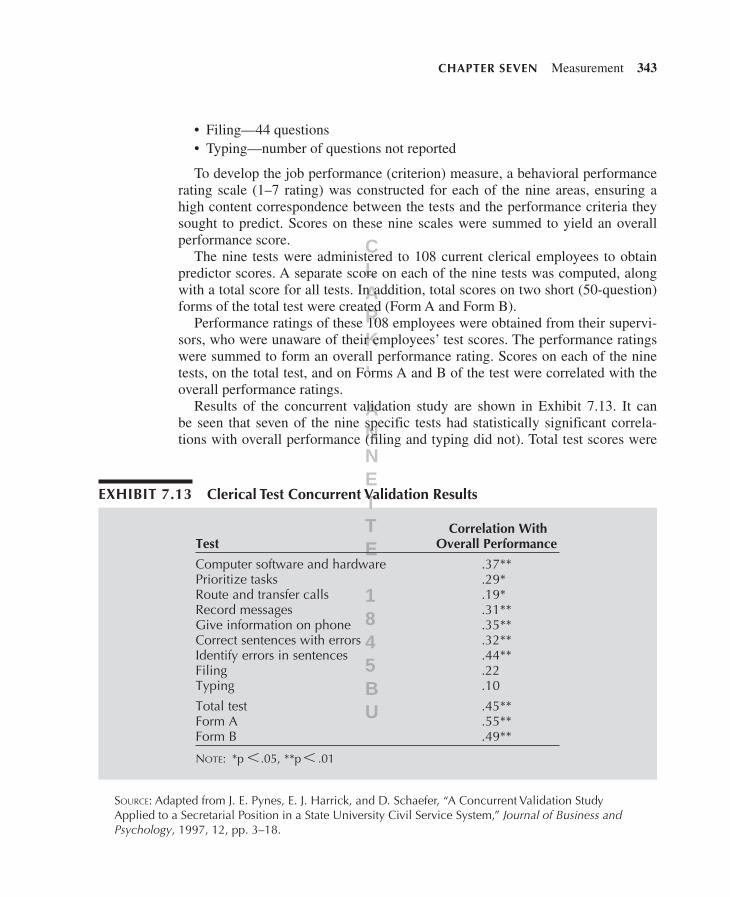
• Filing—44 questions• Typing—number of questions not reported
To develop the job performance (criterion) measure, a behavioral performance rating scale (1–7 rating) was constructed for each of the nine areas, ensuring a high content correspondence between the tests and the performance criteria they sought to predict. Scores on these nine scales were summed to yield an overall performance score.
The nine tests were administered to 108 current clerical employees to obtain predictor scores. A separate score on each of the nine tests was computed, along with a total score for all tests. In addition, total scores on two short (50-question) forms of the total test were created (Form A and Form B).
Performance ratings of these 108 employees were obtained from their supervi-sors, who were unaware of their employees’ test scores. The performance ratings were summed to form an overall performance rating. Scores on each of the nine tests, on the total test, and on Forms A and B of the test were correlated with the overall performance ratings.
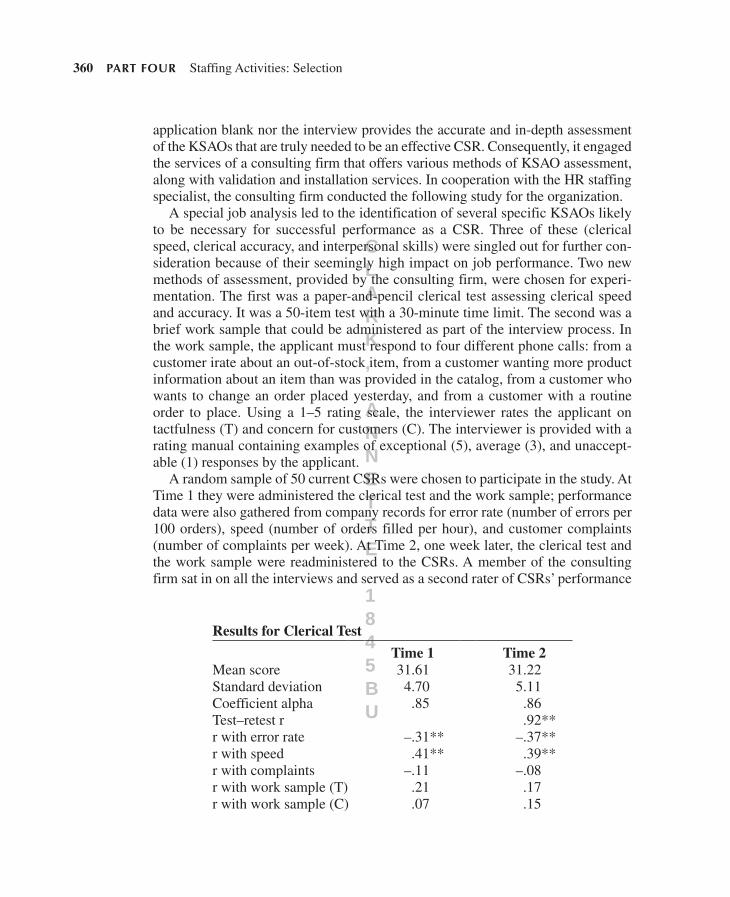
Results of the concurrent validation study are shown in Exhibit 7.13. It can be seen that seven of the nine specific tests had statistically significant correla-tions with overall performance (filing and typing did not). Total test scores were
exhibiT 7.13 Clerical Test Concurrent validation results
TestCorrelation With
Overall Performance
Computer software and hardwarePrioritize tasksRoute and transfer callsRecord messagesGive information on phoneCorrect sentences with errorsIdentify errors in sentencesFilingTyping
Total testForm AForm B
.37**
.29*
.19*
.31**
.35**
.32**
.44**
.22
.10
.45**
.55**
.49**
NOTE: *p .05, **p .01
Source: Adapted from J. E. Pynes, E. J. Harrick, and D. Schaefer, “A Concurrent Validation Study Applied to a Secretarial Position in a State University Civil Service System,” Journal of Business and Psychology, 1997, 12, pp. 3–18.
hen12680_ch07_310-368.indd 343 3/30/11 9:25 AM
CLARK, ANNETTE 1845BU
344 parT FOur Staffing Activities: Selection
significantly correlated with overall performance, as were scores on the two short forms of the total test. The sizes of the statistically significant correlations suggest favorable practical significance of the correlations as well.
Content validationContent validation differs from criterion- related validity in one important respect: no criterion measure is used in content validation. Thus, predictor scores cannot be correlated with criterion scores as a way of gathering evidence about a predictor’s validity. Rather, a judgment is made about the probable correlation, had there been a criterion measure. For this reason, content validation is frequently referred to as judgmental validation.13
Content validation is most appropriate, and most likely to be found, in two cir-cumstances: (1) when there are too few people to form a sample for purposes of criterion- related validation, and (2) when criterion measures are not available, or they are available but are of highly questionable quality. At an absolute minimum, an n = 30 is necessary for criterion- related validation.
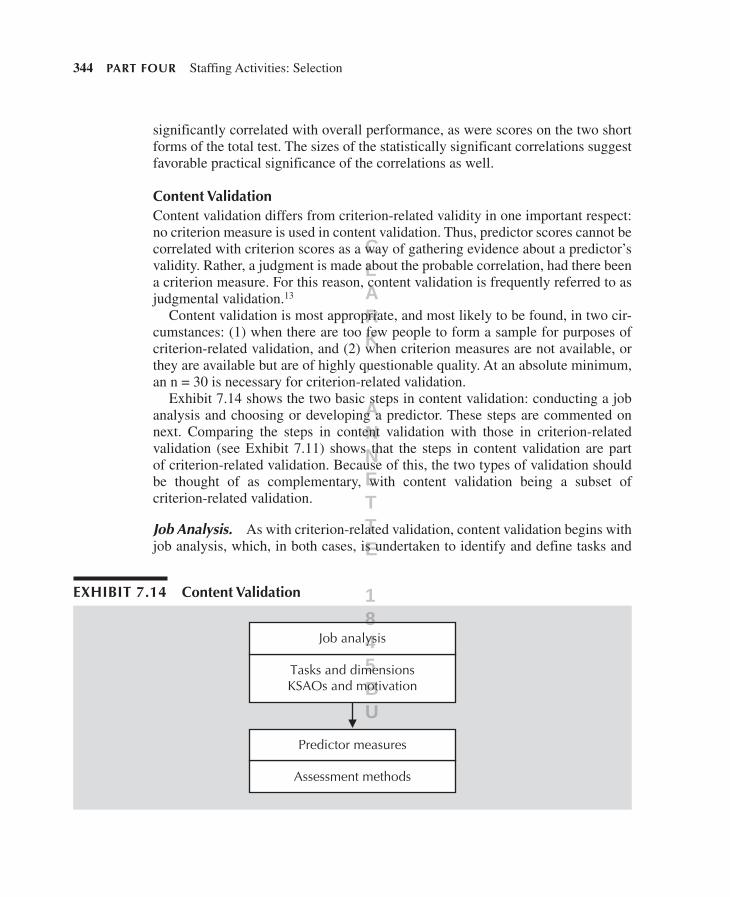
Exhibit 7.14 shows the two basic steps in content validation: conducting a job analysis and choosing or developing a predictor. These steps are commented on next. Comparing the steps in content validation with those in criterion- related validation (see Exhibit 7.11) shows that the steps in content validation are part of criterion- related validation. Because of this, the two types of validation should be thought of as complementary, with content validation being a subset of criterion- related validation.
Job Analysis. As with criterion- related validation, content validation begins with job analysis, which, in both cases, is undertaken to identify and define tasks and
exhibiT 7.14 Content validation
Job analysis
Tasks and dimensionsKSAOs and motivation
Predictor measures
Assessment methods
hen12680_ch07_310-368.indd 344 3/30/11 9:25 AM
CLARK, ANNETTE 1845BU
ChapTer Seven Measurement 345
task dimensions and to infer the necessary KSAOs and motivation for those tasks. Results are expressed in the job requirements matrix.
Predictor Measures. Sometimes the predictor will be one that has already been developed and is in use. An example here is a commercially available test, inter-viewing process, or biographical information questionnaire. Other times, such a measure will not be available. This occurs frequently in the case of job knowledge, which is usually very specific to the particular job involved in the validation.
Lacking a readily available or modifiable predictor means that the organiza-tion will have to construct its own predictors. At this point, the organization has built predictor construction into the predictor validation process. Now, content validation and the predictor development processes occur simultaneously. The organization becomes engaged in test construction, a topic beyond the scope of this book.14
A final note about content validation emphasizes the importance of continually paying attention to the need for reliability of measurement and standardization of the measurement process. Though these are always matters of concern in any type of validation effort, they are of paramount importance in content validation. The reason for this is that without an empirical correlation between the predictor and the criterion, only the likely r can be judged. It is important, in forming that judg-ment, to pay considerable attention to reliability and standardization.
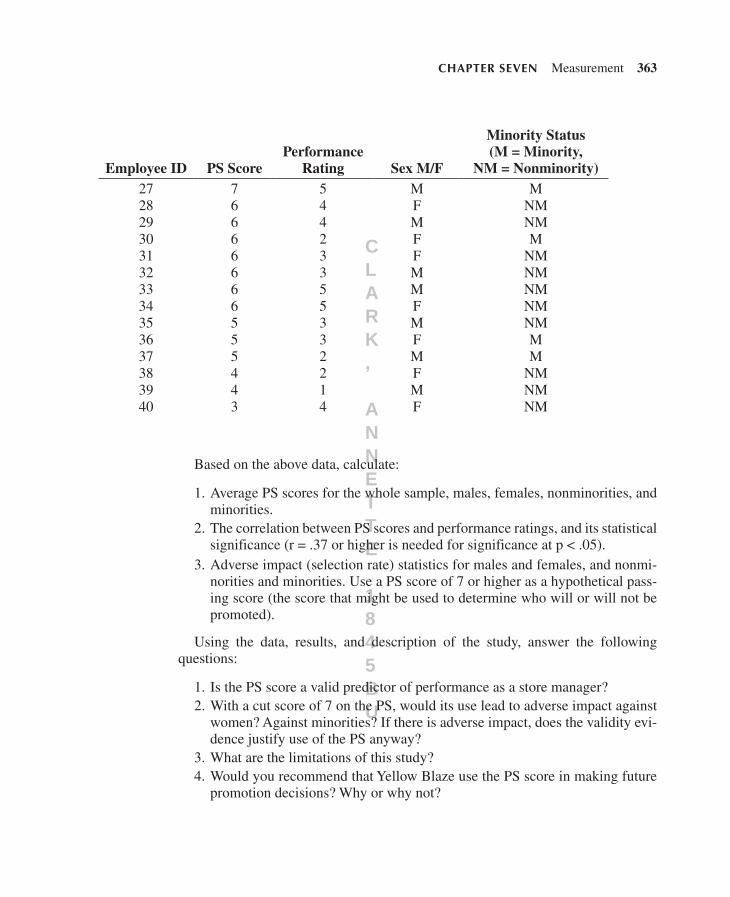
Illustrative Study. The Maryland Department of Transportation sought to develop a series of assessment methods for identifying supervisory potential among candidates for promotion to a first- level supervising position anywhere within the department. The content validation process and outputs are shown in Exhibit 7.15. As shown in the exhibit, job analysis was first conducted to identify and define a set of performance dimensions and then infer the KSAOs necessary for successful performance in those dimensions. Several SMEs met to develop a tentative set of task dimensions and underlying KSAOs. The underlying KSAOs were in essence general competencies required of all first- level supervisors, regardless of work unit within the department. Their results were sent to a panel of experienced human resource (HR) managers within the department for revision and finalization. Three assessment method specialists then set about developing a set of assessments that would (1) be efficiently administered at locations throughout the state, (2) be reli-ably scored by people at those locations, and (3) emphasize the interpersonal skills important for this job. As shown in Exhibit 7.15, five assessment methods were developed: multiple- choice in- basket exercise, structured panel interview, presen-tation exercise, writing sample, and training and experience evaluation exercise.
Candidates’ performance on the exercises was to be evaluated by specially cho-sen assessors at the location where the exercises were administered. To ensure that candidates’ performance was skillfully observed and reliably evaluated by the
hen12680_ch07_310-368.indd 345 3/30/11 9:25 AM
CLARK, ANNETTE 1845BU
346 parT FOur Staffing Activities: Selection
assessors, an intensive training program was developed. The program provided both a written user’s manual and specific skill training.
validity generalization
In the preceding discussions of validity and validation, an implicit premise is being made that validity is situation specific, and therefore validation of predictors must occur in each specific situation. All of the examples involve specific types of mea-sures, jobs, individuals, and so forth. Nothing is said about generalizing validity across those jobs and individuals. For example, if a predictor is valid for a particu-lar job in organization A, would it be valid for the same type of job in organiza-tion B? Or is validity specific to the particular job and organization?
job analysis: First- Level Supervisor—Maryland department of Transportation
Seven performance dimensions and task statements:Organizing work; assigning work; monitoring work; managing consequences; counseling, efficiency reviews, and discipline; setting an example; employee development
Fourteen KSAOs and definitions:Organizing; analysis and decision making; planning; communication (oral and written); delegation; work habits; carefulness; interpersonal skill; job knowledge; organizational knowledge; toughness; integrity; development of others; listening
predictor Measures: Five assessment Methods
Multiple-choice in- basket exercise(assume role of new supervisor and work through in- basket on desk)
Structured panel interview(predetermined questions about past experiences relevant to the KSAOs)
Presentation exercise(make presentation to a simulated work group about change in their work hours)
Writing sample(prepare a written reprimand for a fictitious employee)
Training and experience evaluation exercise(give examples of training and work achievements relevant to certain KSAOs)
exhibiT 7.15 Content validation Study
Source: Adapted from M. A. Cooper, G. Kaufman, and W. Hughes, “Measuring Supervisory Potential,” IPMA News, December 1996, pp. 8–18. Reprinted with permission of IPMA News, published by the International Personnel Management Association (IPMA; www.ipma-hr.org).
hen12680_ch07_310-368.indd 346 3/30/11 9:25 AM
CLARK, ANNETTE 1845BU
ChapTer Seven Measurement 347
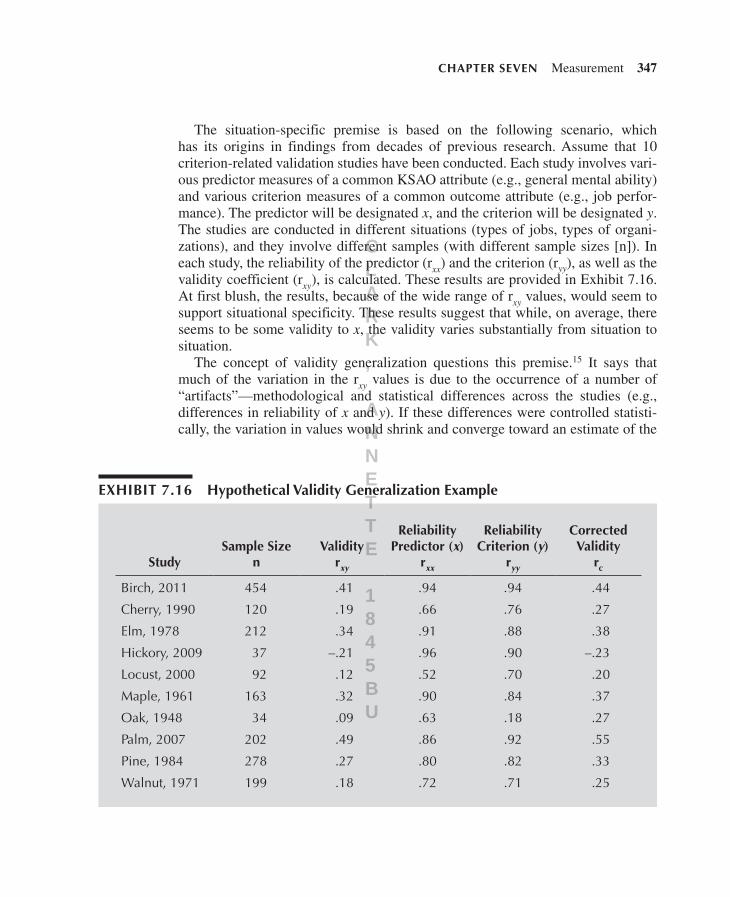
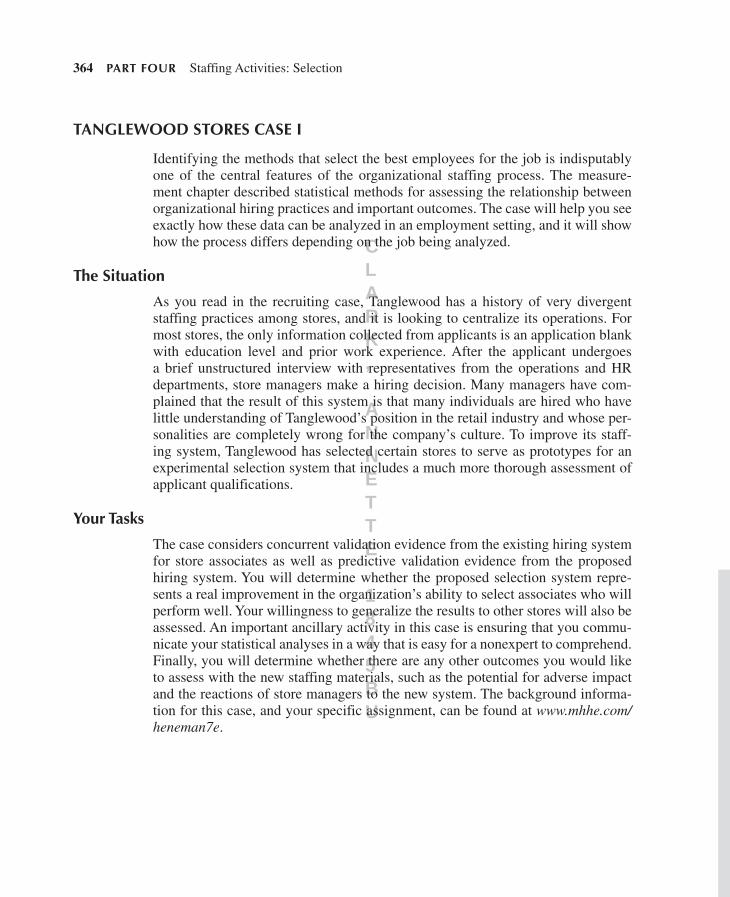
The situation- specific premise is based on the following scenario, which has its origins in findings from decades of previous research. Assume that 10 criterion- related validation studies have been conducted. Each study involves vari-ous predictor measures of a common KSAO attribute (e.g., general mental ability) and various criterion measures of a common outcome attribute (e.g., job perfor-mance). The predictor will be designated x, and the criterion will be designated y. The studies are conducted in different situations (types of jobs, types of organi-zations), and they involve different samples (with different sample sizes [n]). In each study, the reliability of the predictor (rxx) and the criterion (ryy), as well as the validity coefficient (rxy ), is calculated. These results are provided in Exhibit 7.16. At first blush, the results, because of the wide range of rxy values, would seem to support situational specificity. These results suggest that while, on average, there seems to be some validity to x, the validity varies substantially from situation to situation.
The concept of validity generalization questions this premise.15 It says that much of the variation in the rxy values is due to the occurrence of a number of “artifacts”—methodological and statistical differences across the studies (e.g., differences in reliability of x and y). If these differences were controlled statisti-cally, the variation in values would shrink and converge toward an estimate of the
exhibiT 7.16 hypothetical validity generalization example
StudySample Size
nvalidity
rxy
reliability predictor (x)
rxx
reliability Criterion (y)
ryy
Corrected validity
rc
Birch, 2011 454 .41 .94 .94 .44
Cherry, 1990 120 .19 .66 .76 .27
Elm, 1978 212 .34 .91 .88 .38
Hickory, 2009 37 –.21 .96 .90 –.23
Locust, 2000 92 .12 .52 .70 .20
Maple, 1961 163 .32 .90 .84 .37
Oak, 1948 34 .09 .63 .18 .27
Palm, 2007 202 .49 .86 .92 .55
Pine, 1984 278 .27 .80 .82 .33
Walnut, 1971 199 .18 .72 .71 .25
hen12680_ch07_310-368.indd 347 3/30/11 9:25 AM
CLARK, ANNETTE 1845BU
348 parT FOur Staffing Activities: Selection
true validity of x. If that true r is significant (practically and statistically), one can indeed generalize validity of x across situations. Validity thus is not viewed as situ-ation specific.
Indeed, the results in the exhibit reveal that the average (weighted by sample size) uncorrected validity is r–xy = .30, and the average (weighted by sample size) validity corrected for unreliability in the predictor and criterion is r–xy = .36. In this example, fully two- thirds (66.62%) of the variance in the correlations was due to study artifacts (differences in sample size and differences in reliability of the pre-dictor or the criterion). Put another way, the variability in the correlations is lower once they are corrected for artifacts, and the validities do generalize.
An enormous amount of evidence supporting the validity generalization prem-ise has accumulated. Some experts argue that validity generalization reduces or even eliminates the need for an organization to conduct its own validation study. If validity generalization shows that a selection measure has a statistically significant and practically meaningful correlation with job performance, the reasoning goes, why go to the considerable time and expense to reinvent the wheel (to conduct a validation study when evidence clearly supports use of the measure in the first place)? There are two caveats to keep in mind in accepting this logic. First, organi-zations or specific jobs (for which the selection measure in question is intended) can sometimes be unusual. To the extent that the organization or job was not reflected in the validity generalization effort, the results may be inapplicable to the specific organization or job. Second, validity generalization efforts, while undoubtedly offering more evidence than a single study, are not perfect. For example, validity generalization results can be susceptible to “publication bias,” where test vendors may report only statistically significant correlations. Although procedures exist for correcting this bias, they assume evidence and expertise usually not readily avail-able to an organization.16 Thus, as promising as validity generalization is, we think organizations, especially if they think the job in question differs from comparable organizations, may still wish to conduct validation studies of their own.
A particular form of validity generalization that has proved useful is meta- analysis. Returning to Exhibit 7.16, meta- analysis reveals that the average correlation between x and y (i.e., r–xy) is r–xy = .36, that most of the variability in the correlations is due to statistical artifacts (and not due to true substantive dif-ferences in validity across studies), and that the validity appears to generalize. Meta- analysis is very useful in comparing the relative validity of selection mea-sures, which is precisely what we do in Chapters 8 and 9.
Staffing Metrics and benchmarks
For some time now, HR as a business area has sought to prove its value through the use of metrics, or quantifiable measures that demonstrate the effectiveness (or ineffectiveness) of a particular practice or procedure. Staffing is no exception. For-tunately, many of the measurement processes described in this chapter represent
hen12680_ch07_310-368.indd 348 3/30/11 9:25 AM
CLARK, ANNETTE 1845BU
ChapTer Seven Measurement 349
excellent metrics. Unfortunately, most HR managers, including many in staffing, may have limited (or no) knowledge of job analysis, validation, and measurement. The reader of this book can “show his or her stuff ” by educating other organiza-tional members about these metrics in an accessible and nonthreatening way. The result may be a more rigorous staffing process, producing higher levels of validity, and kudos for you.
Many who work in staffing are likely more familiar with another type of met-ric, namely, those produced by benchmarking. Benchmarking is a process where organizations evaluate their practices (in this case, staffing practices) against those used by industry leaders. Some commonly used benchmarks include cost per hire, forecasted hiring, and vacancies filled. Traditionally, most benchmarking efforts have focused on quantity of employees hired and cost. That situation is beginning to change. For example, Reuters and Dell are tracking “quality of hire,” or the performance levels of those hired. Eventually, if enough organizations track such information, they can form a consortium so they can benchmark off one another’s metrics for both quantity and quality.17
More generally, the Society for Human Resource Management (SHRM) regu-larly offers conferences and mini- conferences on staffing that provide benchmarks of current organizational practices. At a recent SHRM conference, Robyn Corr, VP of global staffing for Starbucks, discussed the company’s approach to staffing, including how Starbucks hires over 300 employees every day.
Such benchmarks can be a useful means of measuring important aspects of staff-ing methods or the entire staffing process. However, they are no substitute for the other measurement principles described in this chapter, including reliability and validity. Reliability, validity, utility, and measurement principles are more endur-ing, and more fundamental, metrics of staffing effectiveness.
COLLeCTiOn OF aSSeSSMenT daTa
In staffing decisions, the process of measurement is put into practice by collecting assessment data on external or internal applicants. To this point in this chapter, we have discussed how selection measures can be evaluated. To be sure, thorough evaluation of selection measures is important. Selection decision makers must be knowledgeable about how to use the assessment data that have been collected; otherwise the potential value of the data will lie dormant. On the other hand, to put these somewhat theoretical concepts to use in practice, selection decision makers must know how to collect the assessment data. Otherwise, the decision maker may find himself or herself in the unenviable “big hat, no cattle” situation—knowing how to analyze and evaluate assessment data but not knowing where to find the data in the first place.
In collecting assessment data, if a predictor is purchased, support services are needed. Consulting firms and test publishers can provide support for scoring of
hen12680_ch07_310-368.indd 349 3/30/11 9:25 AM
CLARK, ANNETTE 1845BU
350 parT FOur Staffing Activities: Selection
tests. Also necessary is legal support to ensure compliance with laws and regula-tions. Validity studies are important to ensure the effectiveness of the measures. Training on how to administer the predictor is also needed.
Beyond these general principles, which apply no matter what assessment data are collected, there is other information that the selection decision maker must know about the tangible process of collecting assessment data. Collection of data with respect to testing procedures, tests and test manuals, and professional stan-dards is discussed.
Testing procedures
Regardless of whether paper- and-pencil or computerized tests are given, certain guidelines need to be kept in mind.
QualificationPredictors cannot always be purchased by any firm that wants to use them; many test publishers require the purchaser to have certain expertise to properly use the test. For example, they may want the user to hold a PhD in a field of study related to the test and its use. For smaller organizations, this means hiring the consulting services of a specialist to use a particular test.
SecurityCare must be taken to ensure that correct answers for predictors are not shared with job applicants in advance of administration of the predictor. Any person who has access to the predictor answers should be fully trained and should sign a predictor security agreement. Also, applicants should be instructed not to share information about the test with fellow applicants. Alternative forms of the test should be con-sidered if the security of the test is in question.
Not only should the predictor itself be kept secure, but also the results of the pre-dictor in order to ensure the privacy of the individual. The results of the predictor should be used only for the intended purposes and by persons qualified to interpret them. Though feedback can be given to the candidate concerning the results, the individual should not be given a copy of the predictor or the scoring key.
StandardizationFinally, it is imperative that all applicants be assessed with standardized procedures. This means that not only should the same or a psychometrically equivalent predic-tor be used, but individuals should take the test under the same circumstances. The purpose of the predictor should be explained to applicants, and they should be put at ease, held to the same time requirements to complete the predictor, and take the predictor in the same location.
hen12680_ch07_310-368.indd 350 3/30/11 9:25 AM
CLARK, ANNETTE 1845BU
ChapTer Seven Measurement 351
internet-based Test administrationIncreasingly, selection measures are being administered on the Internet. For example, job applicants for hourly positions at Kmart, Albertson’s, and the Sports Authority take an electronic assessment at in- store kiosks. The test vendor, Unicru, forwards the test scores on to selection decision makers. Some organizations may develop their own tests and administer them online.
In general, research suggests that web- based tests work as well as paper- and-pencil tests, as long as special care is taken to ensure that the actual applicant is the test taker and that the tests are validated in the same manner as other selection mea-sures. Some organizations, however, in their rush to use such tests, fail to validate them. The results can be disastrous. The Transportation Security Administration (TSA) has been criticized for its “inane” online test. Many questions on the test were obvious to a grade- school student. For example, one question was: Why is it important to screen bags for improvised explosive devices (IEDs)?
a. The IED batteries could leak and damage other passenger bags. b. The wires in the IED could cause a short to the aircraft wires. c. IEDs can cause loss of lives, property and aircraft. d. The ticking timer could worry other passengers.
Obviously, the correct answer is “c.” The TSA farmed out the test to a vendor with-out asking for validation evidence. The TSA’s justification was, “We administered the test the way we were told to [by the vendor].” Thus, Internet- based testing can work well and has many advantages, but organizations need to ensure that the tests are rigorously developed and validated.18
acquisition of Tests and Test Manuals
The process of acquiring tests and test manuals, whether digital versions or print versions, requires some start- up costs in terms of the time and effort required to contact test publishers. Once the selection decision maker is on an e-mail or mail-ing list, however, he or she can stay up to date on the latest developments.
Publishers of selection tests include Wonderlic (www.wonderlic.com), Consult-ing Psychologists Press (www.cpp-db.com), Institute for Personality and Ability Testing (www.ipat.com), Psychological Assessment Resources (www.parinc.com), Hogan Assessment Systems (www.hoganassessments.com), and Psychological Services, Inc. (www.psionline.com). All these organizations have information on their websites that describes the products available for purchase.
Most publishers provide sample copies of the tests and a user’s manual that selection decision makers may consult before purchasing the test. Test costs vary widely depending on the test and the number of times the test is given. One test that can be scored by the selection decision maker, for example, costs $100 for testing
hen12680_ch07_310-368.indd 351 3/30/11 9:25 AM
CLARK, ANNETTE 1845BU
352 parT FOur Staffing Activities: Selection
25 applicants and $200 for testing 100 applicants. Another test that comes with a scoring system and interpretive report costs from $25 each for testing 5 applicants to $17 each for testing 100 applicants. Discounts are available for testing larger numbers of applicants.
Any test worth using will be accompanied by a professional user’s manual (whether in print or online). This manual should describe the development and validation of the test, including validity evidence in selection contexts. A test man-ual should also include administration instructions, scoring instructions or infor-mation, interpretation information, and normative data. All of this information is crucial to make sure that the test is appropriate and that it is used in an appropriate (valid, legal) manner. Avoid using a test that has no professional manual, as it is unlikely to have been validated. Using a test without a proven track record is akin to hiring an applicant sight unseen. The Wonderlic Personnel Test User’s Manual is an excellent example of a professional user’s manual. It contains information about various forms of the Wonderlic Personnel Test (see Chapter 9), how to administer the test and interpret and use the scores, validity and fairness of the test, and vari-ous norms by age, race, gender, and so on. The SHRM has launched the SHRM Testing Center, whereby SHRM members can review and receive discounts on more than 200 web- based tests.19
professional Standards
Revised in 2003 by the Society for Industrial and Organizational Psychology (SIOP) and approved by the American Psychological Association (APA), the Prin-ciples for the Validation and Use of Personnel Selection Procedures is a guidebook that provides testing standards for use in selection decisions. It covers test choice, development, evaluation, and use of personnel selection procedures in employ-ment settings. Specific topics covered include the various ways selection measures should be validated, how to conduct validation studies, which sources can be used to determine validity, generalizing validation evidence from one source to another, test fairness and bias, how to understand worker requirements, data collection for validity studies, ways in which validity information can be analyzed, the appropri-ate uses of selection measures, and an administration guide.
Principles was developed by many of the world’s leading experts on selection, and therefore any selection decision maker would be well advised to consult this important document, which is written in practical, nontechnical language. This guidebook is free and can be ordered from SIOP by visiting its website (www.siop.org).
A related set of standards has been promulgated by the APA. Formulated by the Joint Committee on Testing Practices, The Rights and Responsibilities of Test Tak-ers: Guidelines and Expectations enumerates 10 rights and 10 responsibilities of test takers. One of the rights is for the applicant to be treated with courtesy, respect, and impartiality. Another right is to receive prior explanation for the purpose(s) of
hen12680_ch07_310-368.indd 352 3/30/11 9:25 AM
CLARK, ANNETTE 1845BU
ChapTer Seven Measurement 353
the testing. One responsibility is to follow the test instructions as given. In addition to enumerating test- taker rights and responsibilities, the document also provides guidelines for organizations administering the tests. For example, the standards stipulate that organizations should inform test takers about the purpose of the test. This document is available online at www.apa.org/science/programs/testing/rights.aspx. Organizations testing applicants should consult these guidelines to ensure that these rights are provided wherever possible.
LegaL iSSueS
Staffing laws and regulations, particularly EEO/AA laws and regulations, place great reliance on the use of measurement concepts and processes. Three key topics are determining adverse impact, standardization of measurement, and best prac-tices suggested by the EEOC.
determining adverse impact
In Chapter 2, adverse (disparate) impact was introduced as a way of determining whether staffing practices were having potentially illegal impacts on individuals because of race, sex, and so forth. Such a determination requires the compilation and analysis of statistical evidence, primarily applicant flow and applicant stock statistics.
applicant Flow StatisticsApplicant flow statistical analysis requires the calculation of selection rates (pro-portions or percentages of applicants hired) for groups and the subsequent com-parison of those rates to determine whether they are significantly different from one another. This may be illustrated by taking the example from Exhibit 2.5:
This example shows a sizable difference in selection rates between men and women (.50 as opposed to .11). Does this difference indicate adverse impact? The Uniform Guidelines on Employee Selection Procedures (UGESP) speak directly to this question. Several points need to be made regarding the determination of disparate impact analysis.
First, the UGESP require the organization to keep records that will permit cal-culation of such selection rates, also referred to as applicant flow statistics. These statistics are the primary vehicle by which compliance with the law (Civil Rights Act) is judged.
Applicants Hires Selection RateMen 50 25 .50 or 50%Women 45 5 .11 or 11%
hen12680_ch07_310-368.indd 353 3/30/11 9:25 AM
CLARK, ANNETTE 1845BU
354 parT FOur Staffing Activities: Selection
Second, the UGESP require calculation of selection rates (1) for each job category, (2) for both external and internal selection decisions, (3) for each step in the selection process, and (4) by race and sex of applicants. To meet this requirement, the organi-zation must keep detailed records of its staffing activities and decisions. Such record keeping should be built directly into the organization’s staffing system routines.
Third, comparisons of selection rates among groups in a job category for pur-poses of compliance determination should be based on the 80% rule in the UGESP, which states that “a selection rate for any race, sex or ethnic group which is less than four- fifths (4/5) (or eighty percent) of the rate for the group with the highest rate will generally be regarded by federal enforcement agencies as evidence of adverse impact, while a greater than four- fifths rate will generally not be regarded by federal enforcement agencies as evidence of adverse impact.”
If this rule is applied to the previous example, the group with the highest selec-tion rate is men (.50). The rate for women should be within 80% of this rate, or .40 (.50 3 .80 = .40). Since the actual rate for women is .11, this suggests the occur-rence of adverse impact.
Fourth, the 80% rule is truly only a guideline. Note the use of the word “gener-ally” in the rule with regard to differences in selection rates. Also, the 80% rule goes on to provide for other exceptions, based on sample size considerations and issues surrounding statistical and practical significance of difference in selection rates. Moreover, there are many other technical measurement and legal issues in determining whether adverse impact is occurring. Examples include deciding exactly who is considered an applicant, and whether it is meaningful to pool appli-cant counts for different minority groups into a “total minority” group. Best prac-tice recommendations for handling such issues are available.20
applicant Stock StatisticsApplicant stock statistics require the calculation of the percentages of women and minorities in two areas: (1) employed, and (2) available for employment in the population. These percentages are compared to identify disparities. This is referred to as utilization analysis.
To illustrate, the example from Exhibit 2.5 is shown here:
It can be seen that 10% of employees are minorities, whereas their availability is 30%. A comparison of these two percentages suggests an underutilization of minorities.
Utilization analysis of this sort is an integral part of not only compliance assess-ment but also affirmative action plans (AAPs). Indeed, utilization analysis is the starting point for the development of AAPs. This may be illustrated by reference to the Affirmative Action Programs Regulations.
The regulations require the organization to conduct a formal utilization analysis of its workforce. That analysis must be (1) conducted by job group, and (2) done separately for women and minorities. Though calculation of the numbers and per-centages of persons employed is relatively straightforward, determination of their availability is not. The regulations require that the availabilities take into account at least the following factors: (1) the percentage of women or minorities with req-uisite skills in the recruitment area, and (2) the percentage of women or minori-ties among those promotable, transferable, and trainable within the organization. Accurate measurement and/or estimation of availabilities that take into account these factors is difficult.
Despite these measurement problems, the regulations require comparison of the percentages of women and minorities employed with their availability. When the percentage of minorities or women in a job group is less than would reasonably be expected given their availability, underutilization exists and placement (hiring and promotion) goals must be set. Thus, the organization must exercise considerable discretion in the determination of adverse impact through the use of applicant stock statistics. It would be wise to seek technical and/or legal assistance for conducting utilization analysis (see also “Affirmative Action Plans” in Chapter 3).
Standardization
A lack of consistency in treatment of applicants is one of the major factors contrib-uting to the occurrence of discrimination in staffing. This is partly due to a lack of standardization in measurement, in terms of both what is measured and how it is evaluated or scored.
An example of inconsistency in what is measured is that the type of background information required of minority applicants may differ from that required of non-minority applicants. Minority applicants may be asked about credit ratings and criminal conviction records, while nonminority applicants are not. Or, the type of interview questions asked of male applicants may be different from those asked of female applicants.
Even if information is consistently gathered from all applicants, it may not be evaluated the same for all applicants. A male applicant who has a history of hold-ing several different jobs may be viewed as a career builder, while a female with the same history may be evaluated as an unstable job- hopper. In essence, different scoring keys are being used for men and women applicants.
Reducing, and hopefully eliminating, such inconsistency requires a straight-forward application of the three properties of standardized measures discussed
hen12680_ch07_310-368.indd 355 3/30/11 9:25 AM
CLARK, ANNETTE 1845BU
356 parT FOur Staffing Activities: Selection
previously. Through standardization of measurement comes consistent treatment of applicants, and with it, the possibility of lessened adverse impact.
best practices
Based on its long and in- depth involvement in measurement and selection pro-cedures, the EEOC provides guidance to employers in the form of several best practices for testing and selection.21 These practices apply to a wide range of tests and selection procedures, including cognitive and physical ability tests, sample job tasks, medical inquiries and physical exams, personality and integrity tests, criminal and credit background checks, performance appraisals, and English pro-ficiency tests. The best practices are the following:
• Employers should administer tests and other selection procedures with-out regard to race, color, national origin, sex, religion, age (40 or older), or disability.
• Employers should ensure that employment tests and other selection proce-dures are properly validated for the positions and purposes for which they are used. The test or selection procedure must be job- related and its results appro-priate for the employer’s purpose. While a test vendor’s documentation sup-porting the validity of a test may be helpful, the employer is still responsible for ensuring that its tests are valid under the UGESP (discussed in Chapter 9).
• If a selection procedure screens out a protected group, the employer should determine whether there is an equally effective alternative selection procedure that has less adverse impact and, if so, adopt the alternative procedure. For example, if the selection procedure is a test, the employer should determine whether another test would predict job performance but not disproportion-ately exclude the protected group.
• To ensure that a test or selection procedure remains predictive of success in a job, employers should keep abreast of changes in job requirements and should update the test specifications or selection procedures accordingly.
• Employers should ensure that tests and selection procedures are not adopted casually by managers who know little about these processes. A test or selec-tion procedure can be an effective management tool, but no test or selection procedure should be implemented without an understanding of its effective-ness and limitations for the organization, its appropriateness for a specific job, and whether it can be appropriately administered and scored.
Note that these best practices apply to virtually all selection procedures or tools, not just tests. They emphasize the need for fair administration of these tools, the importance of the procedures being job related, usage of alternative valid selection
hen12680_ch07_310-368.indd 356 3/30/11 9:25 AM
CLARK, ANNETTE 1845BU
ChapTer Seven Measurement 357
procedures that have less adverse impact, and the updating of job requirements (KSAOs) and selection tools. In addition, casual usage of selection tools by unin-formed managers is to be avoided.
SuMMary
Measurement, defined as the process of using rules to assign numbers to objects to represent quantities of an attribute of the objects, is an integral part of the founda-tion of staffing activities. Standardization of the measurement process is sought. This applies to each of the four levels of measurement: nominal, ordinal, interval, and ratio. Standardization is also sought for both objective and subjective measures.
Measures yield scores that represent the amount of the attribute being mea-sured. Scores are manipulated in various ways to aid in their interpretation. Typical manipulations involve central tendency and variability, percentiles, and standard scores. Scores are also correlated to learn about the strength and direction of the relationship between two attributes. The significance of the resultant correlation coefficient is then assessed.
The quality of measures involves issues of reliability and validity. Reliability refers to consistency of measurement, both at a moment in time and between time periods. Various procedures are used to estimate reliability, including coefficient alpha, interrater and intrarater agreement, and test–retest. Reliability places an upper limit on the validity of a measure.
Validity refers to accuracy of measurement and accuracy of prediction, as reflected by the scores obtained from a measure. Criterion- related and content validation studies are conducted to help learn about the validity of a measure. In criterion- related validation, scores on a predictor (KSAO) measure are correlated with scores on a criterion (HR outcome) measure. In content validation, there is no criterion measure, so judgments are made about the content of a predictor rela-tive to the HR outcome it is seeking to predict. Traditionally, results of validation studies were treated as situation specific, meaning that the organization ideally should conduct a new and separate validation study for any predictor in any situ-ation in which the predictor is to be used. Recently, however, studies have sug-gested that the validity of predictors may generalize across situations, meaning that the requirement of conducting costly and time- consuming validation studies in each specific situation could be relaxed. Staffing metrics such as cost per hire and benchmarks, representing how leading organizations staff positions, can be useful measures. But they are no substitutes for reliability and validity.
Various practical aspects of the collection of assessment data were described. Decisions about testing procedures and the acquisition of tests and test manu-als require the attention of organizational decision makers. The collection of
hen12680_ch07_310-368.indd 357 3/30/11 9:25 AM
CLARK, ANNETTE 1845BU
358 parT FOur Staffing Activities: Selection
assessment data and the acquisition of tests and test manuals vary depending on whether paper- and-pencil or computerized selection measures are utilized. Finally, organizations need to attend to professional standards that govern the proper use of the collection of assessment data.
Measurement is also said to be an integral part of an organization’s EEO/AA compliance activities. When adverse impact is found, changes in measurement practices may be legally necessary. These changes will involve movement toward standardization of measurement and the methods for determining adverse impact.
diSCuSSiOn QueSTiOnS
1. Imagine and describe a staffing system for a job in which no measures are used.
2. Describe how you might go about determining scores for applicants’ responses to (a) interview questions, (b) letters of recommendation, and (c) questions about previous work experience.
3. Give examples of when you would want the following for a written job knowledge test: (a) a low coefficient alpha (e.g., a = .35), and (b) a low test–retest reliability.
4. Assume you gave a general ability test, measuring both verbal and compu-tational skills, to a group of applicants for a specific job. Also assume that because of severe hiring pressures, you hired all of the applicants, regardless of their test scores. How would you investigate the criterion- related validity of the test?
5. Using the same example as in question four, how would you go about inves-tigating the content validity of the test?
6. What information does a selection decision maker need to collect in mak-ing staffing decisions? What are the ways in which this information can be collected?
eThiCaL iSSueS
1. Do individuals making staffing decisions have an ethical responsibility to know measurement issues? Why or why not?
2. Is it unethical for an employer to use a selection measure that has high empir-ical validity but lacks content validity? Explain.
hen12680_ch07_310-368.indd 358 3/30/11 9:25 AM
CLARK, ANNETTE 1845BU
ChapTer Seven Measurement 359
appLiCaTiOnS
evaluation of Two new assessment Methods for Selecting Telephone Customer Service representatives
The Phonemin Company is a distributor of men’s and women’s casual clothing. It sells exclusively through its merchandise catalog, which is published four times per year to coincide with seasonal changes in customers’ apparel tastes. Custom-ers may order merchandise from the catalog via mail or over the phone. Currently, 70% of orders are phone orders, and the organization expects this to increase to 85% within the next few years.
The success of the organization is obviously very dependent on the success of the telephone ordering system and the customer service representatives (CSRs) who staff the system. There are currently 185 CSRs; that number should increase to about 225 CSRs to handle the anticipated growth in phone order sales. Though the CSRs are trained to use standardized methods and procedures for handling phone orders, there are still seemingly large differences among them in their job performance. The CSRs’ performance is routinely measured in terms of error rate, speed of order taking, and customer complaints. The top 25% and lowest 25% of performers on each of these measures differ by a factor of at least three (e.g., the error rate of the bottom group is three times as high as that of the top group). Strategically, the organization knows that it could substantially enhance CSR performance (and ultimately sales) if it could improve its staffing “batting aver-age” by more accurately identifying and hiring new CSRs who are likely to be top performers.
The current staffing system for CSRs is straightforward. Applicants are recruited through a combination of employee referrals and newspaper ads. Because turnover among CSRs is so high (50% annually), recruitment is a continuous process at the organization. Applicants complete a standard application blank, which asks for information about education and previous work experience. The information is reviewed by the staffing specialist in the HR department. Only obvious misfits are rejected at this point; the others (95%) are asked to have an interview with the specialist. The interview lasts 20–30 minutes, and at the conclusion the applicant is either rejected or offered a job. Due to the tightness of the labor market and the constant presence of vacancies to be filled, 90% of the interviewees receive job offers. Most of those offers (95%) are accepted, and the new hires attend a one- week training program before being placed on the job.
The organization has decided to investigate fully the possibilities of increas-ing CSR effectiveness through sounder staffing practices. In particular, it is not pleased with its current methods of assessing job applicants; it feels that neither the
hen12680_ch07_310-368.indd 359 3/30/11 9:25 AM
CLARK, ANNETTE 1845BU
360 parT FOur Staffing Activities: Selection
application blank nor the interview provides the accurate and in- depth assessment of the KSAOs that are truly needed to be an effective CSR. Consequently, it engaged the services of a consulting firm that offers various methods of KSAO assessment, along with validation and installation services. In cooperation with the HR staffing specialist, the consulting firm conducted the following study for the organization.
A special job analysis led to the identification of several specific KSAOs likely to be necessary for successful performance as a CSR. Three of these (clerical speed, clerical accuracy, and interpersonal skills) were singled out for further con-sideration because of their seemingly high impact on job performance. Two new methods of assessment, provided by the consulting firm, were chosen for experi-mentation. The first was a paper- and-pencil clerical test assessing clerical speed and accuracy. It was a 50-item test with a 30-minute time limit. The second was a brief work sample that could be administered as part of the interview process. In the work sample, the applicant must respond to four different phone calls: from a customer irate about an out- of-stock item, from a customer wanting more product information about an item than was provided in the catalog, from a customer who wants to change an order placed yesterday, and from a customer with a routine order to place. Using a 1–5 rating scale, the interviewer rates the applicant on tactfulness (T) and concern for customers (C). The interviewer is provided with a rating manual containing examples of exceptional (5), average (3), and unaccept-able (1) responses by the applicant.
A random sample of 50 current CSRs were chosen to participate in the study. At Time 1 they were administered the clerical test and the work sample; performance data were also gathered from company records for error rate (number of errors per 100 orders), speed (number of orders filled per hour), and customer complaints (number of complaints per week). At Time 2, one week later, the clerical test and the work sample were readministered to the CSRs. A member of the consulting firm sat in on all the interviews and served as a second rater of CSRs’ performance
Results for Clerical Test
Time 1 Time 2Mean score 31.61 31.22Standard deviation 4.70 5.11Coefficient alpha .85 .86Test–retest r .92**r with error rate –.31** –.37**r with speed .41** .39**r with complaints –.11 –.08r with work sample (T) .21 .17r with work sample (C) .07 .15
hen12680_ch07_310-368.indd 360 3/30/11 9:25 AM
CLARK, ANNETTE 1845BU
ChapTer Seven Measurement 361
Results for Work Sample (T)
Time 1 Time 2Mean score 3.15 3.11Standard deviation .93 1.01% agreement (raters) 88% 79%r with work sample (C) .81** .77**r with error rate –.13 –.12r with speed .11 .15r with complaints –.37** –.35**
Results for Work Sample (C)
Time 1 Time 2Mean score 2.91 3.07Standard deviation .99 1.10% agreement (raters) 80% 82%r with work sample (T) .81** .77**r with error rate –.04 –.11r with speed .15 .14r with complaints –.40** –.31**(Note: ** means that r was significant at p < .05)
on the work sample at Time 1 and Time 2. It is expected that the clerical test and work sample will have positive correlations with speed and negative correlations with error rate and customer complaints.
Based on the description of the study and the results above,
1. How do you interpret the reliability results for the clerical test and work sam-ple? Are they favorable enough for Phonemin to consider using them “for keeps” in selecting new job applicants?
2. How do you interpret the validity results for the clerical test and work sam-ple? Are they favorable enough for Phonemin to consider using them “for keeps” in selecting new job applicants?
3. What limitations in the above study should be kept in mind when interpreting the results and deciding whether to use the clerical test and work sample?
Conducting empirical validation and adverse impact analysis
Yellow Blaze Candle Shops provides a full line of various types of candles and accessories such as candleholders. Yellow Blaze has 150 shops in shopping malls
hen12680_ch07_310-368.indd 361 3/30/11 9:25 AM
CLARK, ANNETTE 1845BU
362 parT FOur Staffing Activities: Selection
and strip malls throughout the country. Over 600 salespeople staff these stores, each of which has a full- time manager. Staffing the manager’s position, by pol-icy, must occur by promotion from within the sales ranks. The organization is interested in trying to improve its identification of salespeople most likely to be successful store managers. It has developed a special technique for assessing and rating the suitability of salespeople for the manager’s job.
To experiment with this technique, the regional HR department representative met with the store managers in the region to review and rate the promotion suit-ability of each manager’s salespeople. They reviewed sales results, customer ser-vice orientation, and knowledge of store operations for each salesperson, and then assigned a 1–3 promotion suitability rating (1 = not suitable, 2 = may be suitable, 3 = definitely suitable) on each of these three factors. A total promotion suitability (PS) score, ranging from 3 to 9, was then computed for each salesperson.
The PS scores were gathered, but not formally used in promotion decisions, for all salespeople. Over the past year, 30 salespeople have been promoted to store manager. Now it is time for the organization to preliminarily investigate the valid-ity of the PS scores and to see if their use might lead to the occurrence of adverse impact against women or minorities. Each store manager’s annual overall perfor-mance appraisal rating, ranging from 1 (low performance) to 5 (high performance), was used as the criterion measure in the validation study. The following data were available for analysis:
Employee ID PS ScorePerformance
Rating Sex M/F
Minority Status(M = Minority,
NM = Nonminority)11 9 5 M NM12 9 5 F NM13 9 1 F NM14 9 5 M M15 8 4 F M16 8 5 F M17 8 4 M NM18 8 5 M NM19 8 3 F NM20 8 4 M NM21 7 5 F M22 7 3 M M23 7 4 M NM24 7 3 F NM25 7 3 F NM26 7 4 M NM
hen12680_ch07_310-368.indd 362 3/30/11 9:25 AM
CLARK, ANNETTE 1845BU
ChapTer Seven Measurement 363
Based on the above data, calculate:
1. Average PS scores for the whole sample, males, females, nonminorities, and minorities.
2. The correlation between PS scores and performance ratings, and its statistical significance (r = .37 or higher is needed for significance at p < .05).
3. Adverse impact (selection rate) statistics for males and females, and nonmi-norities and minorities. Use a PS score of 7 or higher as a hypothetical pass-ing score (the score that might be used to determine who will or will not be promoted).
Using the data, results, and description of the study, answer the following questions:
1. Is the PS score a valid predictor of performance as a store manager? 2. With a cut score of 7 on the PS, would its use lead to adverse impact against
women? Against minorities? If there is adverse impact, does the validity evi-dence justify use of the PS anyway?
3. What are the limitations of this study? 4. Would you recommend that Yellow Blaze use the PS score in making future
promotion decisions? Why or why not?
Employee ID PS ScorePerformance
Rating Sex M/F
Minority Status(M = Minority,
NM = Nonminority)27 7 5 M M28 6 4 F NM29 6 4 M NM30 6 2 F M31 6 3 F NM32 6 3 M NM33 6 5 M NM34 6 5 F NM35 5 3 M NM36 5 3 F M37 5 2 M M38 4 2 F NM39 4 1 M NM40 3 4 F NM
hen12680_ch07_310-368.indd 363 3/30/11 9:25 AM
CLARK, ANNETTE 1845BU
364 parT FOur Staffing Activities: Selection
TangLeWOOd STOreS CaSe i
Identifying the methods that select the best employees for the job is indisputably one of the central features of the organizational staffing process. The measure-ment chapter described statistical methods for assessing the relationship between organizational hiring practices and important outcomes. The case will help you see exactly how these data can be analyzed in an employment setting, and it will show how the process differs depending on the job being analyzed.
The Situation
As you read in the recruiting case, Tanglewood has a history of very divergent staffing practices among stores, and it is looking to centralize its operations. For most stores, the only information collected from applicants is an application blank with education level and prior work experience. After the applicant undergoes a brief unstructured interview with representatives from the operations and HR departments, store managers make a hiring decision. Many managers have com-plained that the result of this system is that many individuals are hired who have little understanding of Tanglewood’s position in the retail industry and whose per-sonalities are completely wrong for the company’s culture. To improve its staff-ing system, Tanglewood has selected certain stores to serve as prototypes for an experimental selection system that includes a much more thorough assessment of applicant qualifications.
your Tasks
The case considers concurrent validation evidence from the existing hiring system for store associates as well as predictive validation evidence from the proposed hiring system. You will determine whether the proposed selection system repre-sents a real improvement in the organization’s ability to select associates who will perform well. Your willingness to generalize the results to other stores will also be assessed. An important ancillary activity in this case is ensuring that you commu-nicate your statistical analyses in a way that is easy for a nonexpert to comprehend. Finally, you will determine whether there are any other outcomes you would like to assess with the new staffing materials, such as the potential for adverse impact and the reactions of store managers to the new system. The background informa-tion for this case, and your specific assignment, can be found at www.mhhe.com/heneman7e.
hen12680_ch07_310-368.indd 364 3/30/11 9:25 AM
CLARK, ANNETTE 1845BU
ChapTer Seven Measurement 365
TangLeWOOd STOreS CaSe ii
adverse impact
One of the most significant equal employment opportunity concerns for any orga-nization is when a large class of employees gathers together to declare that they have been discriminated against. In this case, you will assess a complaint of adverse impact proposed by the nonwhite employees of Tanglewood in Northern California.
The SituationThis case revolves around analyzing data on the promotion pipeline at Tanglewood Stores and trying to decide if there is a glass ceiling in operation. As you saw in the introduction and planning case, Tanglewood’s top management is deeply con-cerned about diversity, and they want to ensure that the promotion system does not discriminate. They have provided you with background data that will help you assess the situation.
your TasksUsing the information in this chapter, you will assess the proportional representa-tion of women and minorities by analyzing concentration statistics and promotion rates. As in the measurement and validation case, an important activity in this case is ensuring that you communicate your statistical analyses in a way that is easy for management to comprehend. After making these assessments, you will provide specific recommendations to the organization regarding elements of planning, cul-ture change, and recruiting. The background information for this case, and your specific assignment, can be found at www.mhhe.com/heneman7e.
endnOTeS
1. E. F. Stone, Research Methods in Organizational Behavior (Santa Monica, CA: Goodyear, 1978), pp. 35–36.
2. F. G. Brown, Principles of Educational and Psychological Testing (Hinsdale, IL: Dryden, 1970), pp. 38–45.
3. Stone, Research Methods in Organizational Behavior, pp. 36–40. 4. W. H. Bommer, J. L. Johnson, G. A. Rich, P. M. Podsakoff, and S. B. McKenzie, “On the Inter-
changeability of Objective and Subjective Measures of Employee Performance: A Meta- Analysis,” Personnel Psychology, 1995, 48, pp. 587–606; R. L. Heneman, “The Relationship Between Supervisory Ratings and Results- Oriented Measures of Performance: A Meta- Analysis,” Per-sonnel Psychology, 1986, 39, pp. 811–826.
hen12680_ch07_310-368.indd 365 3/30/11 9:25 AM
CLARK, ANNETTE 1845BU
366 parT FOur Staffing Activities: Selection
5. This section draws on Brown, Principles of Educational and Psychological Testing, pp. 158–197; L. J. Cronbach, Essentials of Psychological Testing, fourth ed. (New York: Harper and Row, 1984), pp. 81–120; N. W. Schmitt and R. J. Klimoski, Research Methods in Human Resources Management (Cincinnati: South- Western, 1991), pp. 41–87.
6. J. T. McClave and P. G. Benson, Statistics for Business and Economics, third ed. (San Francisco: Dellan, 1985).
7. For an excellent review, see Schmitt and Klimoski, Research Methods in Human Resources Man-agement, pp. 88–114.
8. This section draws on E. G. Carmines and R. A. Zeller, Reliability and Validity Assessment (Bev-erly Hills, CA: Sage, 1979).
9. D. P. Schwab, “Construct Validity in Organization Behavior,” in B. Staw and L. L. Cummings (eds.), Research in Organizational Behavior (Greenwich, CT: JAI Press, 1980), pp. 3–43.
10. Carmines and Zeller, Reliability and Validity Assessment; J. M. Cortina, “What Is Coefficient Alpha? An Examination of Theory and Application,” Journal of Applied Psychology, 1993, 78, pp. 98–104; Schmitt and Klimoski, Research Methods in Human Resources Management, pp. 89–100.
11. This section draws on R. D. Arvey, “Constructs and Construct Validation,” Human Performance, 1992, 5, pp. 59–69; W. F. Cascio, Applied Psychology in Personnel Management, fourth ed. (Englewood Cliffs, NJ: Prentice- Hall, 1991), pp. 149–170; H. G. Heneman III, D. P. Schwab, J. A. Fossum, and L. Dyer, Personnel/Human Resource Management, fourth ed. (Homewood, IL: Irwin, 1989), pp. 300–329; N. Schmitt and F. J. Landy, “The Concept of Validity,” in N. Schmitt, W. C. Borman, and Associates, Personnel Selection in Organizations (San Francisco: Jossey- Bass, 1993), pp. 275–309; Schwab, “Construct Validity in Organization Behavior”; S. Messick, “Valid-ity of Psychological Assessment,” American Psychologist, Sept. 1995, pp. 741–749.
12. Heneman, Schwab, Fossum, and Dyer, Personnel/Human Resource Management, pp. 300–310. 13. I. L. Goldstein, S. Zedeck, and B. Schneider, “An Exploration of the Job Analysis- Content Valid-
ity Process,” in Schmitt, Borman, and Associates, Personnel Selection in Organizations, pp. 3–34; Heneman, Schwab, Fossum, and Dyer, Personnel/Human Resource Management, pp. 311–315; D. A. Joiner, Content Valid Testing for Supervisory and Management Jobs: A Practical/Common Sense Approach (Alexandria, VA: International Personnel Management Association, 1987); P. R. Sackett and R. D. Arvey, “Selection in Small N Settings,” in Schmitt, Borman, and Associates, Personnel Selection in Organizations, pp. 418–447.
14. R. S. Barrett, “Content Validation Form,” Public Personnel Management, 1992, 21, pp. 41–52; E. E. Ghiselli, J. P. Campbell, and S. Zedeck, Measurement Theory for the Behavioral Sciences (San Francisco: W. H. Freeman, 1981).
15. F. Schmidt and J. Hunter, “History, Development, Evolution, and Impact of Validity Generaliza-tion and Meta- Analysis Methods, 1975–2001,” in K. R. Murphy (ed.), Validity Generalization: A Critical Review (Mahwah, NJ: Erlbaum, 2003), pp. 31–65; K. R. Murphy, “Synthetic Validity: A Great Idea Whose Time Never Came,” Industrial and Organizational Psychology, 2010, 3(3), pp. 356–359; K. R. Murphy, “Validity, Validation and Values,” Academy of Management Annals, 2009, 3, pp. 421–461.
16. M. A. McDaniel, H. R. Rothstein, and D. L. Whetzel, “Publication Bias: A Case Study of Four Test Vendors,” Personnel Psychology, 2006, 59, pp. 927–953.
17. C. Winkler, “Quality Check: Better Metrics Improve HR’s Ability to Measure—and Manage—the Quality of Hires,” HR Magazine, May 2007, pp. 93–98; Society for Human Resource Man-agement, SHRM Human Capital Benchmarking Study (Alexandria, VA: author, 2005).
18. J. A. Naglieri, F. Drasgow, M. Schmit, L. Handler, A. Prifitera, A. Margolis, and R. Velasquez, “Psychological Testing on the Internet,” American Psychologist, Apr. 2004, 59, pp. 150–162;
hen12680_ch07_310-368.indd 366 3/30/11 9:25 AM
CLARK, ANNETTE 1845BU
ChapTer Seven Measurement 367
R. E. Ployhart, J. A. Weekley, B. C. Holtz, and C. Kemp, “Web-Based and Paper- and-Pencil Testing of Applicants in a Proctored Setting: Are Personality, Biodata, and Situational Judgment Tests Comparable?” Personnel Psychology, 2003, 56, pp. 733–752; S. Power, “Federal Official Faults TSA Screener Testing as ‘Inane,’” Wall Street Journal, Oct. 9, 2003, pp. B1–B2.
19. See the Society for Human Resource Management Testing Center (www.shrm.org/TemplatesTools/AssessmentResources/SHRMTestingCenter/Pages/index.aspx).
20. D. B. Cohen, M. G. Aamodt, and E. M. Dunleavy, “Technical Advisory Committee Report on Best Practices in Adverse Impact Analysis,” Center for Corporate Equality, 2010 (www.cceq.org), accessed 10/5/10.