34
THAICOM Public Company Limited GS & SCBS Thailand Corporate Day June 19, 2015
| Date post: | 02-May-2018 |
| Category: |
Documents |
| Upload: | truongxuyen |
| View: | 215 times |
| Download: | 1 times |

THAICOM Public Company Limited
GS & SCBS Thailand Corporate DayJune 19, 2015

2
Agenda
• Thaicom…Who We Are
• Financial Highlights
• Industry Outlook & Moving Forward
3
Who We Are
4
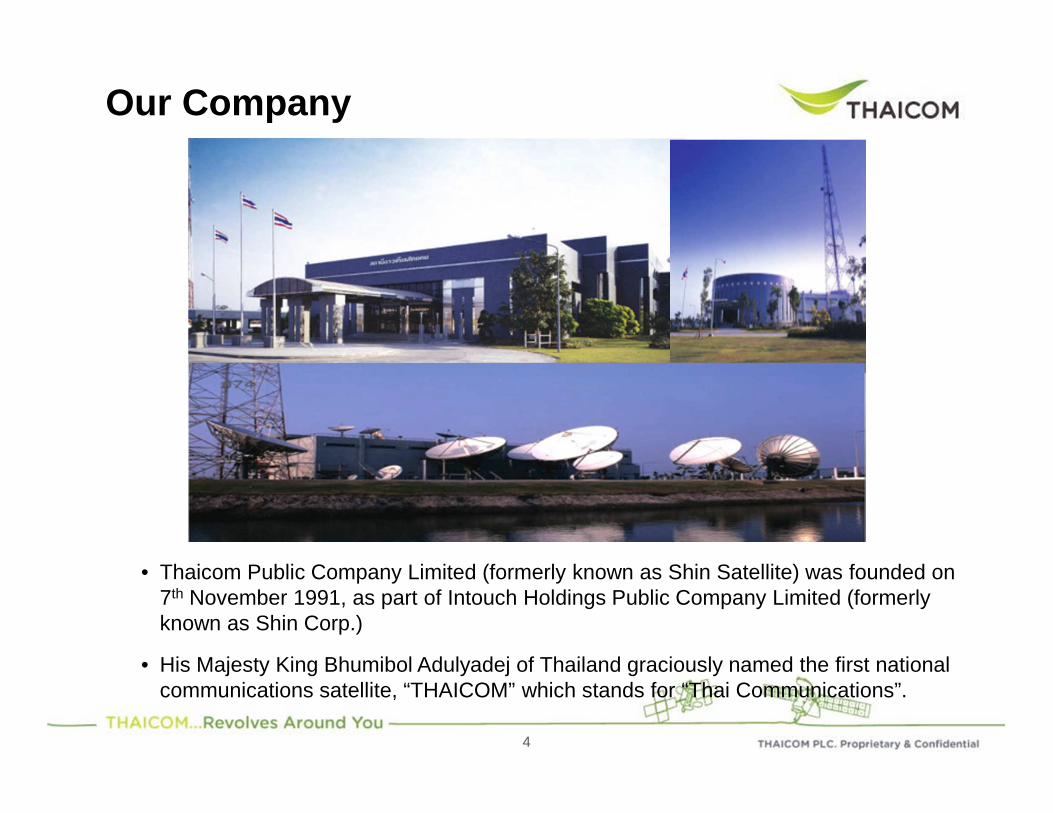
Our Company
• Thaicom Public Company Limited (formerly known as Shin Satellite) was founded on 7th November 1991, as part of Intouch Holdings Public Company Limited (formerly known as Shin Corp.)
• His Majesty King Bhumibol Adulyadej of Thailand graciously named the first national communications satellite, “THAICOM” which stands for “Thai Communications”.

5
Shareholding StructureAspen Holdings Ltd. (Temasek Holdings)
41.62%
IPSTAR Global Service Ltd. 100.00%
Spacecode Llc. 70.00%
IPSTAR New Zealand Co., Ltd. 100.00%
1) Holding Company
2) Listed Company on the Stock Exchange of Thailand
* As of 2 April 2015
IPSTAR Japan Co., Ltd. 100.00%
IPSTAR International Pte Ltd. 100.00%
STAR Nucleus Co., Ltd. 100.00%
IPSTAR Co., Ltd. 100.00%
IPSTAR Australia Pty Ltd. 100.00%
TC Broadcasting co., Ltd. 99.99%
International Satellite Co., Ltd. 100.00%
Intouch Holdings Plc. 1),2)
Advanced Info Service Plc .2)
Thaicom Plc. 2)
ITV Plc.
I.T. Applications and Services Co., Ltd.
Satellite Services
Shenington Investments Pte Ltd. 51.00%
Lao Telecom Co., Ltd. 49.00% DTV Service Co., Ltd. 99. 99%
CS LoxInfo Plc. 2) 42.07%
Cambodian DTV Network Ltd. 100.00%
AD Venture Public Co., Ltd. 99.99%
Teleinfo Media Plc. 99.99%
Telephone Network services Internet Services and Media
40.45%
Orion Satellite Systems Pty Ltd. 100.00%
41.14% 52.92% 99.99%
6
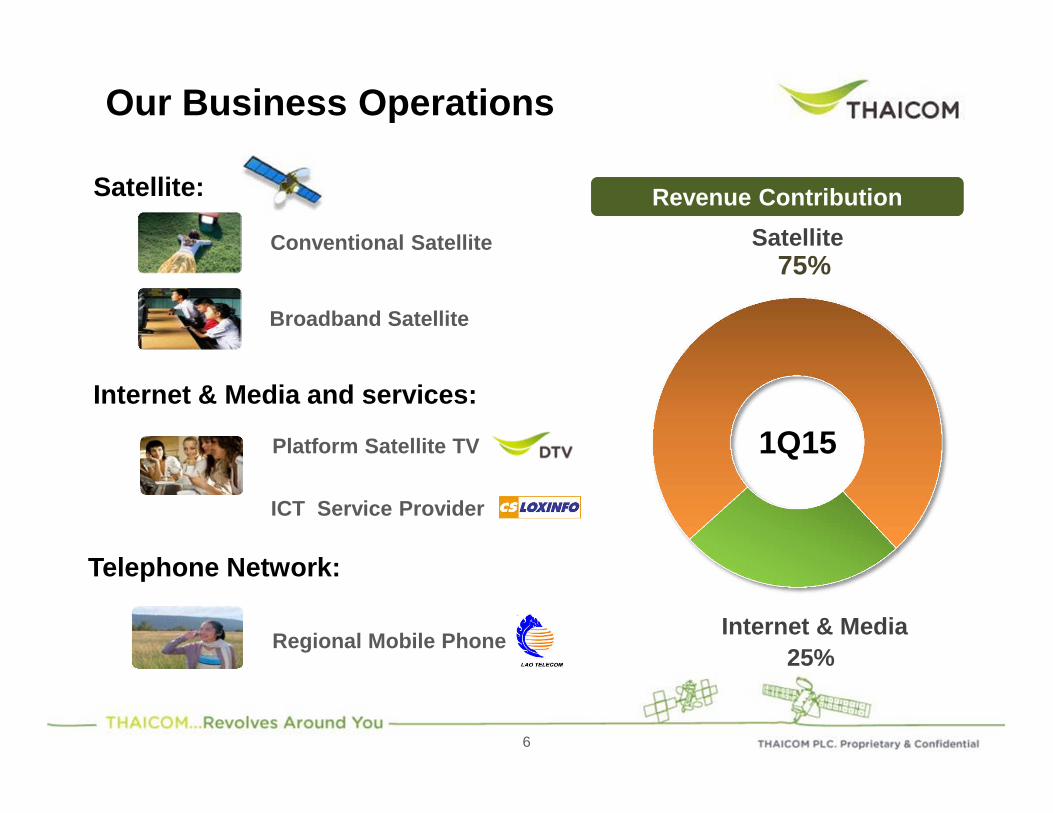
Our Business Operations
Broadband Satellite
Conventional Satellite
Regional Mobile Phone
Platform Satellite TV
Satellite:
Telephone Network:
Internet & Media and services:
Revenue ContributionRevenue Contribution
Satellite75%
Internet & Media25%
1Q15
ICT Service Provider

7
THAICOM 4 (IPSTAR)
Our Satellite Fleet
Concession License
Launched 2005 2006 2014 2014 Target 1H’16
Type of Satellite Broadband Conventional Conventional
Fee20.5%
(Sep 2016 = 22.5% onwards)5.25%
Contract Life (Yr) 30 yr (2021) 20 yr (2032)
Satellite Life (Yr) 15 14 18 18 18
Utilization rate* 57% ~100% ~67% ~50%
THAICOM 1ALaunched: 1993De-orbited: 2010
THAICOM 2Launched: 1994De-orbited: 2010
THAICOM 3Launched: 1997De-orbited: 2006
THAICOM 5 THAICOM 6 THAICOM 7
UpcomingIn-orbitDe-orbited
*As of March 31, 2015
THAICOM 8

8
Our Capacity
3,439
2,819
2,539
2,175
1,5751,411
992 968
633 612436
331 330
ViaSat Eutelsat EchoStar/Hughes
Intelsat SES InmarSat Thaicom2016
Thaicom2014
Telesat Yahsat JSAT ABS ChinaSatCom
Satellite Operators' Bandwidth Capacity (Estimated)
Est
imat
ed C
apac
ityE
quiv
alen
t (T
PE
)
Note:* Thaicom's capacity Y2014 includes THAICOM 4 , THAICOM 5, THAICOM 6 and THAICOM 7 satellites** Thaicom's capacity Y2016 includes THAICOM 4 , THAICOM 5, THAICOM 6, THAICOM 7 and THAICOM 8 satellites*** Other satellite operators' capacities (estimated) are as of July 2014**** TPE = 36MHz transponder equivalent
Largest Satellite Operator in Asia Pacific (7 th Globally)Largest Satellite Operator in Asia Pacific (7 th Globally)

9
TC4 (Ku)
TC5 (C,Ku)
Our Satellite Footprints
50.5E 78.5E 120E119.5ECoverage Area
TC4
TC5
Remarks: *TPE = 36 MHz transponder equivalents
TC6 (C,Ku)
TC7 (C)
TC6
TC7
TC8
TC4 TC5 TC6 TC7 TC8
119.5°E 78.5°E 78.5°E 120°E 78.5°EC Ku C Ku C Ku C Ku C Ku
Indochina - - -
SEA - - - - - - -
South Asia - - - - - -
North Asia - - - - - - - -
Australasia - - - - - - -
ME, Africa - - - - - - -
Total TPE* 881 40 33 14 24
TC8 (Ku)
Broadband Satellite Capacity
=TC4 = 881 TPE*
TC5 = 40 TPE*

10
Covering More than
120 COUNTRIES
Hosting
738 (110 HD)SATELLITE TV CHANNELS
Asia’s “Hot Bird” for Satellite TV
No.1 in Thailand and Indochina
A key player in South AsiaSource : Thaicom PLC, 1Q15
17.5 Million viewers or
73% of total TV HOUSEHOLDS
Source : Nielsen
Our Broadcast Services
Number of Satellite TV channels on Thaicom @78.5E
416 442567 592 628
1123
74 110 110
2011 2012 2013 2014 Q1 2015
SD channel HD channel
1Q15

11
PRESENCE in10+ COUNTRIES in Asia Pacific
5,000 small-cell 3G sites in Japan
17,000 corporate/banking and mobile backhaul sites in India
80,000 broadband users in Australia and New Zealand
37,000 schools and government project sites in Thailand and Malaysia
The World’s first High Throughput Satellite (HTS)
Our Broadband Services

12
Financial Highlights
900
1,100
1,300
1,500
1,700
1,900
- 5
10 15 20 25 30 35 40 45
4-Jan
-124-M
ar-12
4-May-12
4-Jul-
124-S
ep-12
4-Nov-12
4-Jan
-134-M
ar-13
4-May-13
4-Jul-
134-S
ep-13
4-Nov-13
4-Jan
-144-M
ar-14
4-May-14
4-Jul-
144-S
ep-14
4-Nov-14
4-Jan
-154-M
ar-15
4-May-15
THCOM SET Index
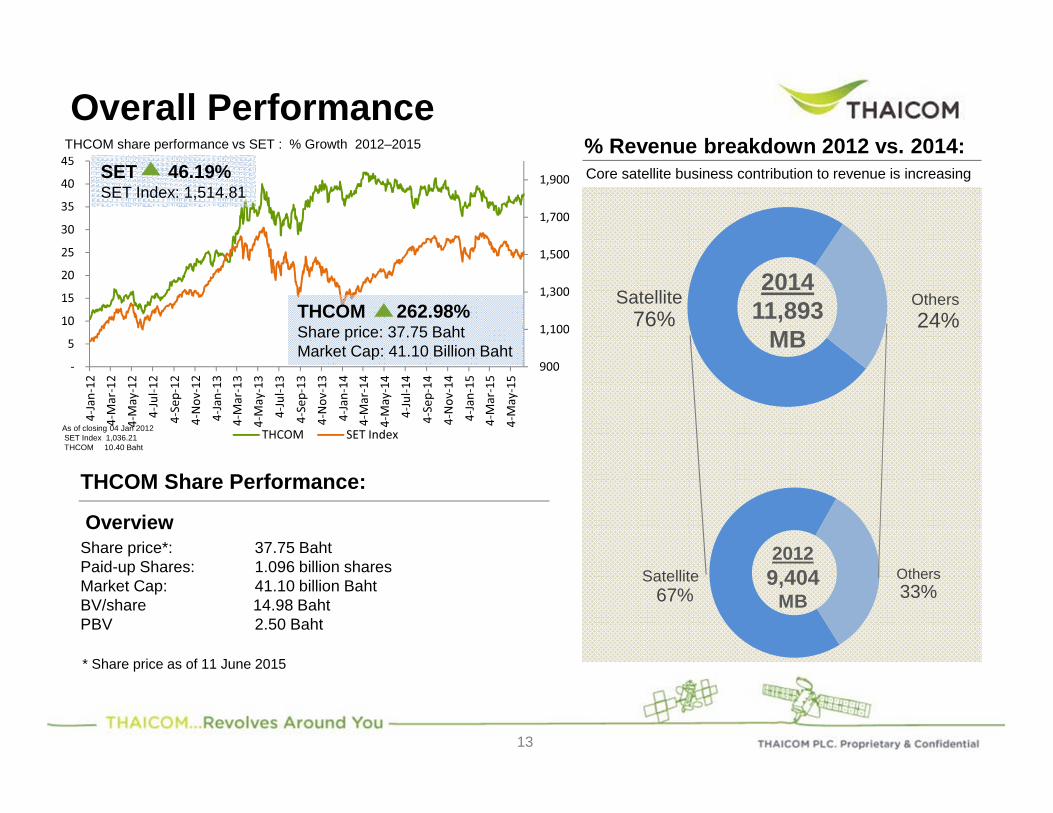
Overall PerformanceTHCOM share performance vs SET : % Growth 2012–2015
THCOM Share Performance:
Overview
* Share price as of 11 June 2015
Core satellite business contribution to revenue is increasing
% Revenue breakdown 2012 vs. 2014:
Satellite76%
Others24%
201411,893
MB
Share price*: 37.75 Baht Paid-up Shares: 1.096 billion shares Market Cap: 41.10 billion Baht BV/share 14.98 Baht PBV 2.50 Baht
Satellite67%
Others33%
20129,404
MB
SET 46.19%SET Index: 1,514.81
THCOM 262.98%Share price: 37.75 BahtMarket Cap: 41.10 Billion Baht
As of closing 04 Jan 2012 SET Index 1,036.21 THCOM 10.40 Baht
13

14
Others
Revenue Breakdown by Country
oIndonesiaoMalaysiaoPhilippineoKoreaoNew ZealandoCambodiaoVietnamoSouth AsiaoMiddle East/Africa & Pacific
Thailand62%
Australia11%
Other8%
Myanmar8%
Japan6%
India3%
China2%
1Q153,074MB

15
6,309 6,964 8,784
2,309
3,095 3,028 3,109
765
9,404 9,992 11,893
3,074
2012 2013 2014 1Q15
other
Satellite Revenue
174 1,128
1,601
540 371
231
545 1,128
1,832
540
6%
11%
15%18%
0%2%4%6%8%10%12%14%16%18%20%
2012 2013 2014 1Q15
Net profit
Net profit Margin
Consolidated Sales & Services RevenuesUnit: MB
Bottom Line Grew Significantly from Satellite Performance
Revenue grew continuously with CAGR of 8% (2012-2014).
Normalized Net profit and marginUnit: MB
* Excludes Impairment of M-fone and Watta total 371 MB** Excludes Impairment of TMC of 231 MB
Drastically improved in Normalized Net Profit and Margin with CAGR of 50% (2012-2104).
**
*

16
6,279 6,964
8,784
2,309
2012 2013 2014 1Q15
BroadbandConventional
3,328 3,373
4,577
1,191
53%
48%
52% 52%
30%
35%
40%
45%
50%
55%
0
1,000
2,000
3,000
4,000
5,000
6,000
2012 2013 2014 1Q15
Satellite EBITDA
EBITDA Margin
Satellite RevenuesUnit: MB
Satellite EBITDAUnit: MB
Strong Satellite Performances with Improving Margin
EBITDA grew with CAGR of 11% (2012-2014).
FY2013, EBITDA Margin dropped to 48% due to cost of interim satellite.
Revenues continuously grew with CAGR of 12% (2012-2014).
46%
54% 51%
49%
49%
51%
55%45%

17
Asset, 27,437
Cash,3,819
Interest bearing debt,
10,497
Liabilities, 3,955
Equity, 16,804
Financial Position Remains Strong
Unit: MB
* Restated
Unit: MB
1. Interest-bearing Debt / Equity2. Excludes Cash and Current Investment3. Excludes Interest-Bearing Debt4. Cash and Current Investment(B/E)
D/E Ratio at 0.62x 1 Strong cash from operation
2
4
3
Consolidated CF 1Q14* 1Q15
CF from Operating 1,042 867
CF from Investing (442) (132)
CF from Financing (351) (590)
Ending Cash 2,530 2,915

18
0.40 0.45
0.65
56%62%
70%
0%
10%
20%
30%
40%
50%
60%
70%
80%
-
0.10
0.20
0.30
0.40
0.50
0.60
0.70
0.80
0.90
1.00
2012 2013 2014
DPS (Baht) Dividend Payout ratio
Delivering Consistent Dividend Growth
Dividend payout policy is NOT less than 40% of stand-alone Net Profit.
Dividend paid for the past 3 years exceeded the policy with payout ratio of 56%, 62%, and 70% respectively.

19
Industry Outlook & Moving Forward

20
0
200
400
600
800
1000
1200
2015 2016 2017 2018 2019 2020 2021 2022 2023 2024 2025
Global Ultra HD via Satellite ChannelsChannels
�Nearly 1,000 Ultra HD channels in 2025
�Over 180 channels are from Asia Pacific
�CAGR 52% from 2015 to 2025
Source: NSR
Higher Bandwidth Required for Broadcast Services
Audio-Video Adoption in USA Households
52% CAGR 2015-2025
�Ultra HD to reach 70% of USA households by 2019
Source: http://dusil.com/, Visual Unity
Global Industry Trend

21
Global Industry TrendExponential Growth of Broadband Demand
� Annual global IP traffic will pass
the zettabyte threshold (1,000 exabytes) by 2016
� Video content to account for
79% of total IP traffic in 2018
Video Content
Source: Cisco VNI
0
200
400
600
800
1,000
1,200
2013 2014 2015 2016 2017 2018 2019 2020 2021 2022 2023
Gbp
s
Distribution DTHContribution & OUTV Telephony & CarrierEnterprise Data Broadband AccessCommercial Mobility Gov/Mil
Enterprise Data
Broadband Access
Global HTS Bandwidth Demand by Application
� Over 1,000 Gbps bandwidth demand for Global HTS in 2023
� With 6.6 million satellite broadband subscribers in 2023
Global IP Traffic
Source: NSR
Remark: HTS – High Throughput Satellite

22
Domestic Industry Trend
� Ku-band channels to grow
160% in the next 15 years
� By 2030, all channels will be HD
Source : Thaicom PLC (2010-Q1’15); Value Partner (2015-2030)
Source : Nielsen
Source: NSR and Thaicom PLC, (Thailand Q1’15)
198283
73
0
200
400
600
800
1000
352 412
217
138
412650
911
198
356
490
824866
911
2010 2015 2020 2025 2030
4%CAGR, 2015-2030
17%CAGR, 2010-2015
Forecasted Ku-band channel in Thailand
SD
HD
Ku-band channel on THAICOM @78.5E
HD
SD
CABSAT Households
from 16.0 M to 17.5 M
15.1MSatellite homes
2.4MCablehomes
73%
8%
24%
40%
41%
South Asia
Thailand
Western Europe
North America
East Asia
DTH HD channel DTH Total channel
DTH HD Channel Penetration, 2015
Thaicom 21%
Increased CABSAT Households with Strong HD Growth
Remark: CABSAT – Cable and Satellite
23
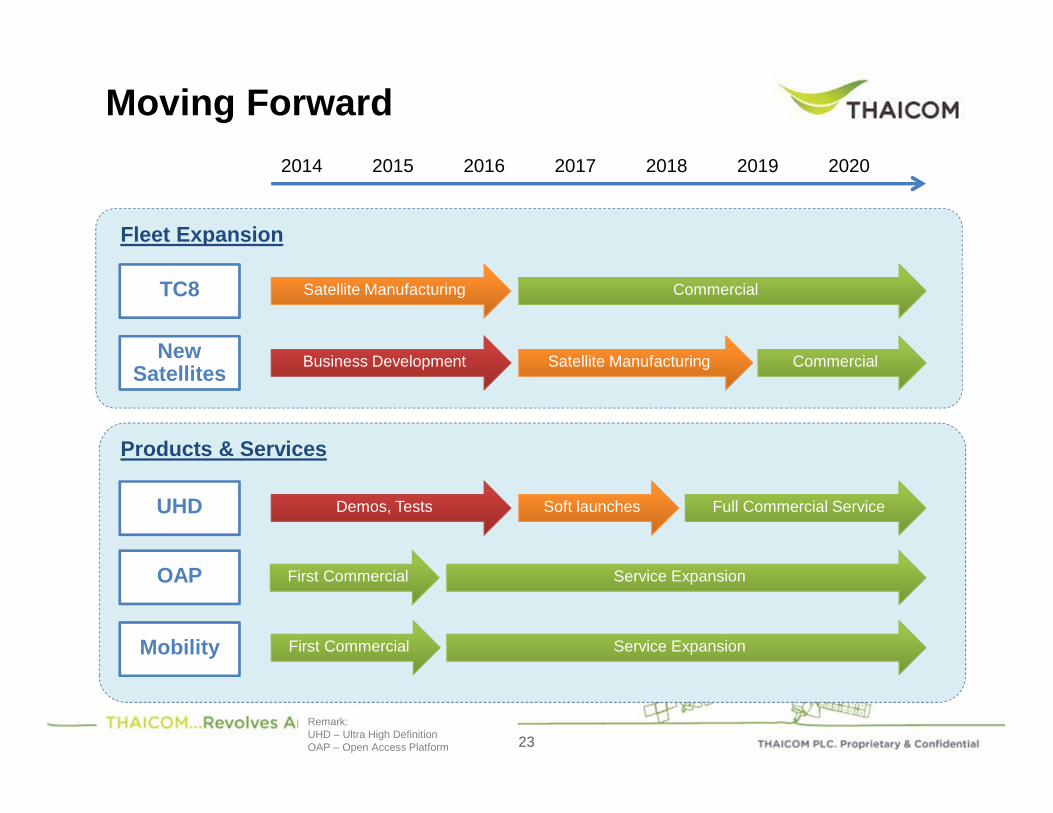
Moving Forward
2014 2015 2016 2017 2018 2019 2020
Fleet Expansion
TC8
New Satellites
Satellite Manufacturing Commercial
Business Development CommercialSatellite Manufacturing
Products & Services
UHD Demos, Tests Full Commercial ServiceSoft launches
OAP First Commercial Service Expansion
Mobility First Commercial Service Expansion
Remark: UHD – Ultra High DefinitionOAP – Open Access Platform
24
Thank You
25
Appendix

26
Myanmar China Nepal India Pakistan
Sweden
Somaliland
Egypt Thailand
Malaysia Indonesia Australia New Zealand
Philippines
Cambodia
Laos
Vietnam
Japan Korea
Israel
Maldives
Our Customers in 20+ Countries

Our Services: Broadcast
27

28
Conventional SatelliteKey Market Segments

29
Broadcast Service Diagram
TV Station/Teleport-Production-Compression-Uplink, etc.
Repeater Station (Analogue & Digital TV)
Direct-to-Home (DTH)
Cable TV
THAICOM (Conventional)

Our Services: Broadband
30
31
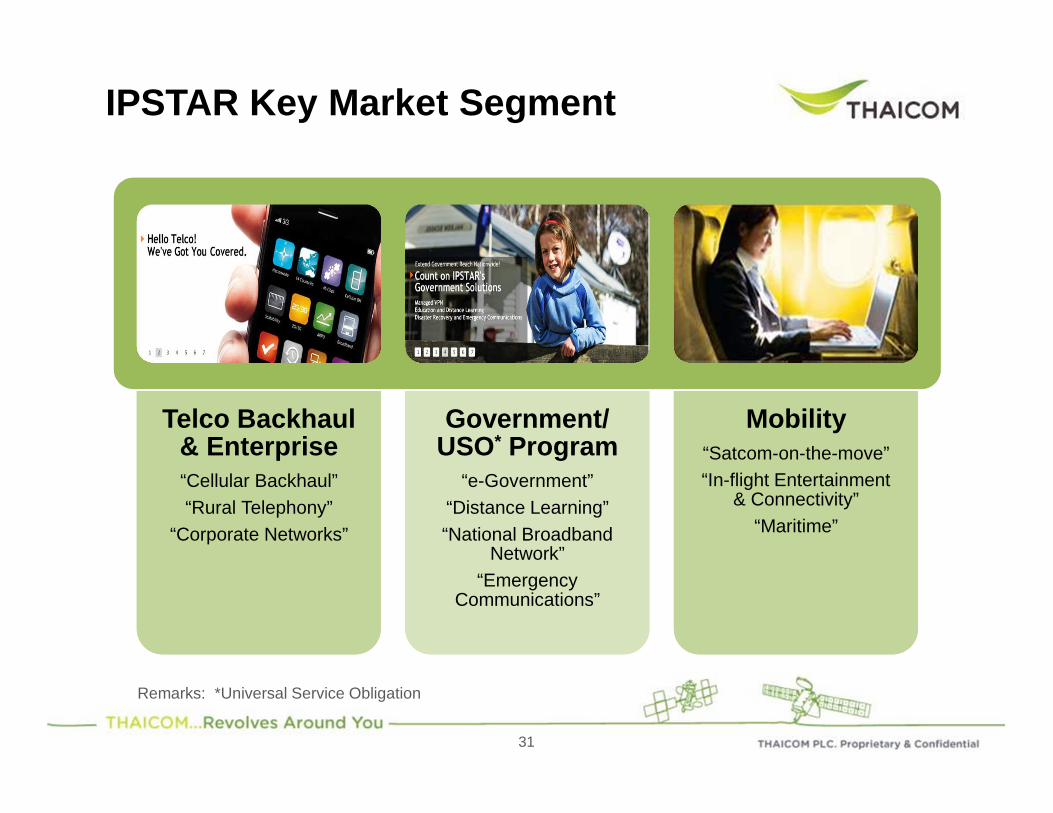
IPSTAR Key Market Segment
Telco Backhaul & Enterprise“Cellular Backhaul”“Rural Telephony”
“Corporate Networks”
Telco Backhaul & Enterprise“Cellular Backhaul”“Rural Telephony”
“Corporate Networks”
Government/ USO* Program
“e-Government”“Distance Learning”“National Broadband
Network”“Emergency
Communications”
Government/ USO* Program
“e-Government”“Distance Learning”“National Broadband
Network”“Emergency
Communications”
Mobility“Satcom-on-the-move”“In-flight Entertainment
& Connectivity”“Maritime”
Mobility“Satcom-on-the-move”“In-flight Entertainment
& Connectivity”“Maritime”
Remarks: *Universal Service Obligation
32
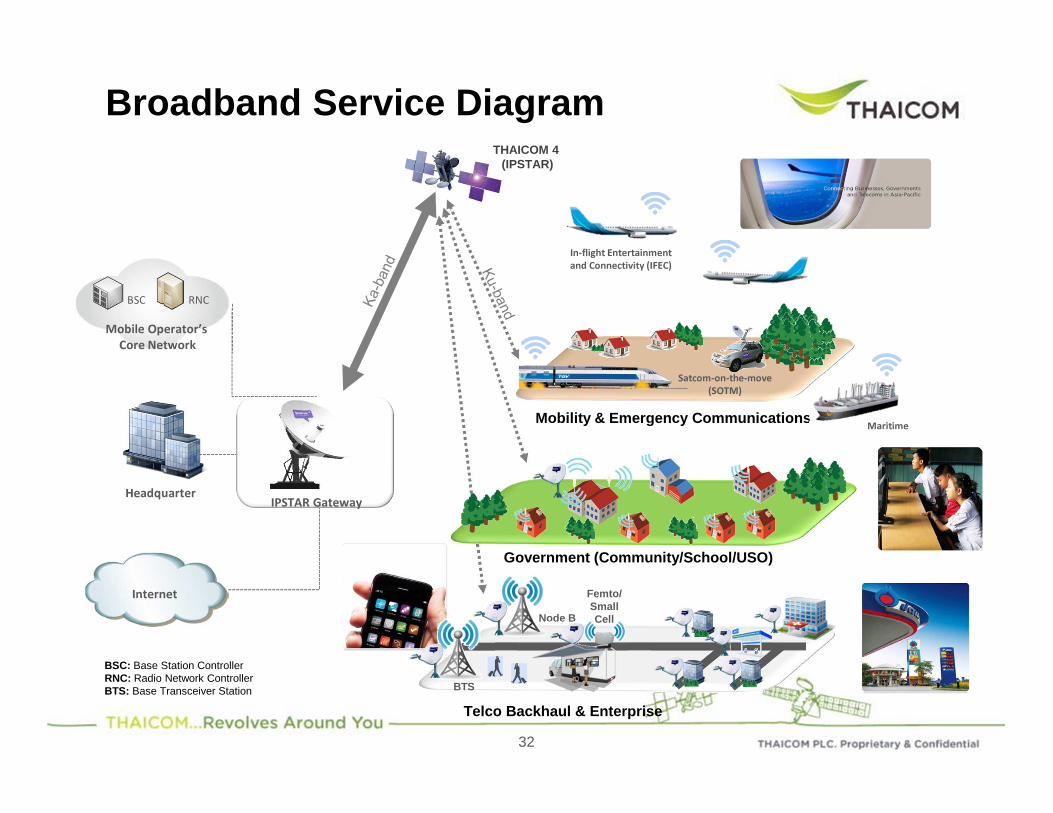
Broadband Service Diagram
BSC RNC
Mobile Operator’s Core Network
IPSTAR GatewayHeadquarter
Internet
THAICOM 4 (IPSTAR)
BSC: Base Station ControllerRNC: Radio Network ControllerBTS: Base Transceiver Station
Mobility & Emergency Communications
Government (Community/School/USO)
In-flight Entertainment and Connectivity (IFEC)
Telco Backhaul & Enterprise
Node B
Femto/SmallCell
Maritime
Satcom-on-the-move (SOTM)
BTS

33
“Best CEO Award”for Listed Companies 2014
by Investment Analysts Association (IAA)
A- with Stable Outlook
A-
Awards & Distinctions: Thailand
Excellent CG Scoring
2014
“ESG 100 Award”2014
by Thaipat Institute
33
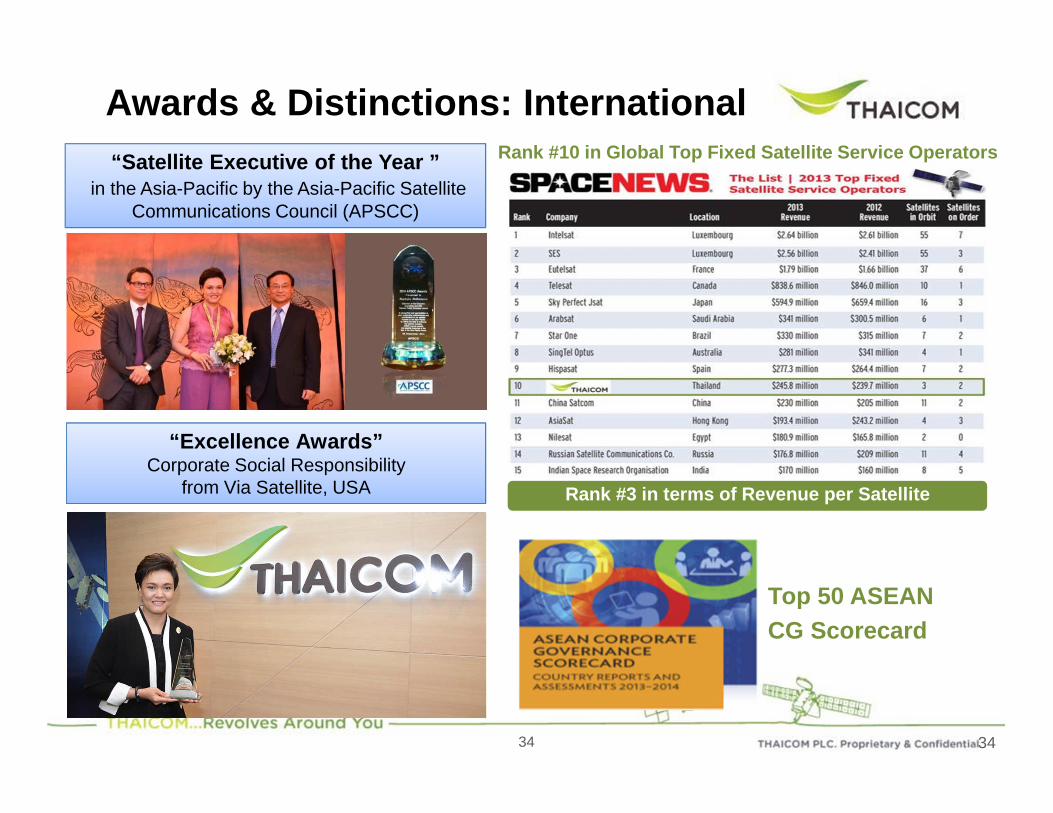
34
“Satellite Executive of the Year ” in the Asia-Pacific by the Asia-Pacific Satellite
Communications Council (APSCC)
“Excellence Awards”Corporate Social Responsibility
from Via Satellite, USA
Awards & Distinctions: InternationalRank #10 in Global Top Fixed Satellite Service Operators
Rank #3 in terms of Revenue per Satellite
Top 50 ASEAN CG Scorecard
34


