+ All Categories
Home > Documents > Thalamic Tumor

Thalamic Tumor

Date post: 02-Jun-2018
Category:
Upload: xcavier
View: 231 times
Download: 0 times
Share this document with a friend
16
Journal of Theoretical Biology 233 (2005) 271–286 Analysis of the electroencephalographic activity associated with thalamic tumors S.C. O’Connor a,b, , P.A. Robinson a,b a School of Physics, University of Sydney, Broadway, Sydney, NSW 2006, Australia b Brain Dynamics Center, Westmead Hospital, Westmead, NSW 2145, Australia Received 14 June 2004; accepted 7 October 2004 Available online 30 November 2004 Abstract A physiologically based model of corticothalamic dynamics is used to investigate the electroencephalographic (EEG) activity associated with tumors of the thala mus. Tumor activity is mode led by introducing localized two-dimensi onal spatial non- uniformities into the model parameters, and calculating the resulting activity via the coupling of spatial eigenmodes. The model is able to reproduce various qualitative features typical of waking eyes-closed EEGs in the presence of a thalamic tumor, such as the app earance of abn ormal pea ks at the ta (E3Hz) and spindl e (E12Hz) frequenci es, the attenuation of normal eyes-c losed background rhythms, and the onset of epileptic activity, as well as the relatively normal EEGs often observed. The results indicate that the abnormal activity at theta and spindle frequencies arises when a small portion of the brain is forced into an over-inhibited state due to the tumor, in which there is an increase in the ring of (inhibitory) thalamic reticular neurons. The effect is heightened when there is a concurrent decrease in the ring of (excitatory) thalamic relay neurons, which are in any case inhibited by the reticular ones. This is likely due to a decrease in the responsiveness of the peritumoral region to cholinergic inputs from the brainstem, and a corresponding depolarization of thalamic reticular neurons, and hyperpolarization of thalamic relay neurons, similar to the mechanism active during slow-wave sleep. The results indicate that disruption of normal thalamic activity is essential to generate these spectral peaks. Furthermore, the present work indicates that high-voltage and epileptiform EEGs are caused by a tumor-induced local over-excitation of the thalamus, which propagates to the cortex. Experimental ndings relating to local over- inhibition and over-excitation are discussed. It is also conrmed that increasing the size of the tumor leads to greater abnormalities in the observable EEG. The usefulness of EEG for localizing the tumor is investigated. r 2004 Elsevier Ltd. All rights reserved. Keywords:  Thalamic tumor; EEG; Pathological theta or delta; Continuum model 1. Introd uctio n The disruption to normal brain function induced by a tumor of the thalamus can be detected by electroence- phal ograms (EEGs), whic h measure elect rical activ ity via electrodes on the head. A typical feature of waking EEG in the presence of thalamic tumors, is unusually large activity near 3 Hz (Gibbs and Gibbs, 1964;  Hirose et al., 1975;  Janati and Hester, 1986;  Newmark et al., 1983). This frequency is variously called ‘delta’ or ‘theta’ in thalamic literature; in the present work we refer to it as th e theta fr eque ncy. Ot he r EEG corr el ates of  thalamic tumor include the focal attenuation of normal backgr ound rhythms (Jan ati and Hes ter , 198 6;  New- mark et al., 1983), epileptiform discharges ( Cheek and Taveras, 1966;  Jana ti and Hester, 1986 ;  Hirose et al., 1975;  O’Brien et al., 1997), non-reactive alpha (Janati and Hes ter, 1986), an d diff use (Hirose et al., 1975; Newmark et al., 1983) or focal (Scarff and Rahm, 1941) backgr ound slowin g. There have also been repor ts of 12–14 Hz ‘spindl es’ during wakin g EEG (Hirose et al., ARTICLE IN PRESS www.elsevier.com/locate/yjtbi 002 2-51 93/$- see front matte r r 2004 Elsevier Ltd. All rights reserved. doi:10.1016/j.jtbi.2004.10.009 Corresponding author. School of Physics, CUDOS, University of Sydney, Sydney NSW 2006, Australia. Te l.: +612 93515635 ; fax: +61 2 9351 7726. E-mail address :  [email protected] (S.C. O’Connor).
Transcript

8/10/2019 Thalamic Tumor

http://slidepdf.com/reader/full/thalamic-tumor 1/16

Journal of Theoretical Biology 233 (2005) 271–286

Analysis of the electroencephalographic activity associated with

thalamic tumors

S.C. O’Connora,b,, P.A. Robinsona,b

aSchool of Physics, University of Sydney, Broadway, Sydney, NSW 2006, AustraliabBrain Dynamics Center, Westmead Hospital, Westmead, NSW 2145, Australia

Received 14 June 2004; accepted 7 October 2004

Available online 30 November 2004

Abstract

A physiologically based model of corticothalamic dynamics is used to investigate the electroencephalographic (EEG) activity

associated with tumors of the thalamus. Tumor activity is modeled by introducing localized two-dimensional spatial non-

uniformities into the model parameters, and calculating the resulting activity via the coupling of spatial eigenmodes. The model is

able to reproduce various qualitative features typical of waking eyes-closed EEGs in the presence of a thalamic tumor, such as the

appearance of abnormal peaks at theta (E3Hz) and spindle (E12Hz) frequencies, the attenuation of normal eyes-closed

background rhythms, and the onset of epileptic activity, as well as the relatively normal EEGs often observed. The results indicate

that the abnormal activity at theta and spindle frequencies arises when a small portion of the brain is forced into an over-inhibited

state due to the tumor, in which there is an increase in the firing of (inhibitory) thalamic reticular neurons. The effect is heightened

when there is a concurrent decrease in the firing of (excitatory) thalamic relay neurons, which are in any case inhibited by the

reticular ones. This is likely due to a decrease in the responsiveness of the peritumoral region to cholinergic inputs from the

brainstem, and a corresponding depolarization of thalamic reticular neurons, and hyperpolarization of thalamic relay neurons,

similar to the mechanism active during slow-wave sleep. The results indicate that disruption of normal thalamic activity is essential

to generate these spectral peaks. Furthermore, the present work indicates that high-voltage and epileptiform EEGs are caused by a

tumor-induced local over-excitation of the thalamus, which propagates to the cortex. Experimental findings relating to local over-

inhibition and over-excitation are discussed. It is also confirmed that increasing the size of the tumor leads to greater abnormalities

in the observable EEG. The usefulness of EEG for localizing the tumor is investigated.

r 2004 Elsevier Ltd. All rights reserved.

Keywords:  Thalamic tumor; EEG; Pathological theta or delta; Continuum model

1. Introduction

The disruption to normal brain function induced by a

tumor of the thalamus can be detected by electroence-phalograms (EEGs), which measure electrical activity

via electrodes on the head. A typical feature of waking

EEG in the presence of thalamic tumors, is unusually

large activity near 3 Hz (Gibbs and Gibbs, 1964; Hirose

et al., 1975;   Janati and Hester, 1986;   Newmark et al.,

1983). This frequency is variously called ‘delta’ or ‘theta’

in thalamic literature; in the present work we refer to it

as the theta frequency. Other EEG correlates of thalamic tumor include the focal attenuation of normal

background rhythms (Janati and Hester, 1986;   New-

mark et al., 1983), epileptiform discharges (Cheek and

Taveras, 1966;   Janati and Hester, 1986;   Hirose et al.,

1975;  O’Brien et al., 1997), non-reactive alpha (Janati

and Hester, 1986), and diffuse (Hirose et al., 1975;

Newmark et al., 1983) or focal (Scarff and Rahm, 1941)

background slowing. There have also been reports of 

12–14 Hz ‘spindles’ during waking EEG (Hirose et al.,

ARTICLE IN PRESS

www.elsevier.com/locate/yjtbi

0022-5193/$- see front matter r 2004 Elsevier Ltd. All rights reserved.

doi:10.1016/j.jtbi.2004.10.009

Corresponding author. School of Physics, CUDOS, University of 

Sydney, Sydney NSW 2006, Australia. Tel.: +612 93515635; fax:

+61 2 9351 7726.

E-mail address:  [email protected] (S.C. O’Connor).

8/10/2019 Thalamic Tumor

http://slidepdf.com/reader/full/thalamic-tumor 2/16

1975;   Janati and Hester, 1986), whereas spindling in

healthy brains is only seen during sleep (Steriade, 2000).

Furthermore, there has been a report of dissociation

between the cerebral hemispheres during sleep (Kanno

et al., 1977), whereby one hemisphere lags behind the

other in cycling through the normal sleep stages.

Thus, there is a wide range of reported abnormalEEG phenomena associated with thalamic tumors.

However, around 10–30% (Cheek and Taveras, 1966;

Hirose et al., 1975) of subjects exhibit normal EEGs in

the presence of such tumors. Hence, a model of thalamic

tumors would need to account for a large variety of 

observed phenomena, ranging from normal EEGs,

through to rarely observed, highly abnormal features

such as EEG spindling during waking.

A model of corticothalamic dynamics has recently

been generalized to include spatial non-uniformities in

the parameters via the coupling of spatial eigenmodes

(O’Connor and Robinson, 2004c;   Robinson et al.,

2003). This model has been successful in predicting the

form of individual EEG spectra, including the spectral

peaks such as the alpha rhythm (Robinson et al., 2001a).

Indeed, a key advantage of the model is its ability to unify

large-scale cortical activity of many different types into a

single framework. For example, the model has predicted

trends seen in various states of arousal (Robinson et al.,

2001a), certain seizure onsets and dynamics (Robinson

et al., 2002), and evoked response potentials (Rennie et al.,

2002). In the spatial domain, it has successfully addressed

coherence and correlations (Robinson, 2003), as well as

unifying on-going and evoked activity recorded from the

scalp and cortex (O’Connor et al., 2002;   O’Connor andRobinson, 2003, 2004b).

Thalamic tumors represent relatively small-scale non-

uniformities in brain activity, typically projecting to a

cortical area less than 5 cm in width. We have shown

previously (O’Connor and Robinson, 2004c) that such

non-uniformities cannot be adequately addressed using

a uniform model. Thus, in the present work, we use the

spatially non-uniform analysis to investigate thalamic

tumors. The aim of the present work is to provide

insight into the physiological and anatomical mechan-

isms responsible for the range of observed EEG features

associated with thalamic tumors.Tumor tissue is electrically inactive regardless of the

type of tumor (Scarff and Rahm, 1941), which implies

that the morphological details of the tumor are likely to

be unimportant in determining its influence on EEG

recordings. Furthermore, a study on gliomas reported

that EEG findings were unrelated to the malignancy of 

the glioma (Newmark et al., 1983), or to the histology of 

the tumor (Newmark et al., 1983). Thus, in this study we

do not attempt to model the morphology of the tumor,

nor to investigate tumors of different types separately,

since these factors do not influence the electrical activity

of the brain.

In Section 2, we provide the necessary theoretical

background by outlining the non-uniform version of the

model in which the parameters can vary across the

brain, and the ensuing spectrum is calculated from the

resulting coupled spatial eigenmodes; thus, a localized

parameter variation can affect the spectrum at distant

sites on the cortex. We also review a reduced three-dimensional parameter space in which activity and

stability in the model can be easily visualized. In Section

3, we examine the pathophysiology of tumors and their

influence on surrounding tissue to determine an appro-

priate method of modeling them. In Section 4, we model

two-dimensional (2D) tumor-like non-uniformities, and

investigate the effects of varying the tumor size. In

Section 5, we study thalamic tumors superimposed on

realistic front-to-back parameter non-uniformities, as

determined by previous work fitting the non-uniform

model to the EEG spectra of 98 normal subjects

(O’Connor and Robinson, 2004c).

2. Non-uniform model

In this section, we summarize the corticothalamic

model, which has been recently generalized to incorpo-

rate spatial non-uniformities via coupling of eigen-

modes. The full details and justification of the model can

be found elsewhere (Robinson et al., 2003). The cortex is

modeled as a continuous, bounded sheet. Precise

boundary conditions prove not to be very important in

determining activity in this model (O’Connor and

Robinson, 2004a;   Robinson et al., 2001b;   Robinson,2003), and the detailed geometry of cortical convolu-

tions is ignored. The corticothalamic connectivity

assumed in the model is shown in   Fig. 1, and involves

three components: the specific nuclei, labeled   s, which

relay subthalamic input   fn   to the cortex, and feed

cortical signals back to the cortex; the thalamic reticular

nucleus, labeled   r, which inhibits the relay nuclei; and

the cortex, which contains both excitatory (e) and

inhibitory (i ) neurons, receives projections from the

relay nuclei, projects to both the reticular and relay

nuclei, and is densely connected to itself. Note the four

feedback loops: the intracortical loop, involving ex-citatory and inhibitory cortical neurons; the ‘direct’

corticothalamic loop which involves the cortex and the

relay nuclei; the ‘indirect’ corticothalamic loop which

involves the cortex, reticular nucleus, and relay nuclei;

and the intrathalamic loop which contains the thalamic

reticular nucleus and the relay nuclei.

Measured large-scale cortical potentials are propor-

tional to the mean cellular membrane currents, which

are in turn proportional to the firing rates  fe;i :  Cortical

excitatory neurons generate most of the measurable

potential on the scalp, because they are larger than

inhibitory neurons and better aligned to generate

ARTICLE IN PRESS

S.C. O’Connor, P.A. Robinson / Journal of Theoretical Biology 233 (2005) 271–286 272

8/10/2019 Thalamic Tumor

http://slidepdf.com/reader/full/thalamic-tumor 3/16

observable signals (Nunez, 1995; O’Connor and Robin-

son, 2003). Thus, in the absence of skull volume

conduction, the power spectrum on the head is wellapproximated by the squared modulus of the signal  fe;to within a constant of proportionality. The effects on

the spectrum of conduction through the cerebrospinal

fluid, skull, and scalp, have been studied in the context

of this model (O’Connor et al., 2002;   Robinson et al.,

2001a); they filter out high-wavenumber activity,   k 

\15 m1,   (O’Connor et al., 2002;   Robinson et al.,

2001a) and hence high-frequency activity (via the

dispersion relation). Thus, at the frequencies of interest

in the present work,o20 Hz, the effects are minimal and

are not considered further.

In our continuum treatment of the cortex the firingrate of signals emitted by excitatory or inhibitory

neurons, which depend on individual cell body poten-

tials, are averaged to give mean values of the outgoing

pulse field   faðr; tÞ;   where   a ¼  e; i :   The mean rate of 

generation of neuronal pulse density depends on the

mean local cell-body potential via a smooth sigmoidal

function that increases from 0 to its maximum value as

the potential increases from  1  to  1: We approximate

the sigmoidal function here by a linear function on the

assumption that deviations from the steady state are

small in normal, non-seizure states. This approximation

has been found to yield excellent agreement with

observed frequency spectra and other phenomena

(O’Connor et al., 2002;   O’Connor and Robinson,

2003, 2004b, c;   Rennie et al., 2002;   Robinson et al.,

2001a, 2002, 2003; Robinson, 2003).

The local mean cell body potential of neurons of type

a in the cortex is a function of inputs from other cortical

neurons, and from excitatory subcortical neurons.Incoming activity is received in the dendritic tree and

filtered as it spreads along the dendrites to the cell body.

The quantity   Lab   is a dendritic low-pass filter function

which accounts for the temporal delay and smearing of 

an incoming signal from a neuron of type  b  ¼  e; i ; s as it

travels along the dendritic tree to the cell body of a

neuron of type  a ¼  e; i :   It can be written (Rennie et al.,

1999)

Labðr;oÞ ¼  1

½1  io=aabðrÞ½1  io=babðrÞ;   (1)

where bab and aab are the inverse rise and decay times of the dendritic potential, respectively.

Outgoing pulses from each neuron propagate along

its axonal tree at a velocity   v(r)E1 0 m s1. This

propagation can be described by damped wave equa-

tions for the fields fa (Rennie et al., 1999). After Fourier

transforming in time, one finds,

Daðr;oÞfaðr;oÞ ¼X

b

J abðr;oÞfbðr;oÞ;   (2)

where

Daðr;oÞ ¼ ½1  io=gaðrÞ2  r2ar 2;   (3)

J abðr;oÞ ¼ Labðr;oÞG abðrÞeiotabðrÞ;   (4)

gaðrÞ ¼ vðrÞ=ra   is a measure of the damping,   ra   is the

mean range of axons   a, the gain   G ab   represents the

scaled response strength in neurons a due to a unit signal

incident from neurons of type   b, and   tab   represents a

pure delay—as in signal transmission between the cortex

and the thalamus, for example—and appears as an

exponent due to the temporal Fourier transform. Note

that (2) makes explicit the approximately one-to-one

mapping between locations in the cortex and thalamus,

particularly the specific nuclei of the thalamus.

Using (2) and the connectivities shown in Fig. 1, thewave equation for excitatory cortical neurons follows as

Deðr;oÞfeðr;oÞ ¼ J eeðr;oÞfeðr;oÞ þ J ei ðr;oÞfi ðr;oÞ

þ J esðr;oÞfsðr;oÞ:   ð5Þ

The analogous equations for cortical inhibitory, specific

relay, and reticular neurons can also be deduced from

(2), and the quantities fi ; fs; and fr can be eliminated to

give the transfer function of a stimulus   fn   to   fe

(Robinson et al., 2003). This is of the form

Aðr;oÞfeðr;oÞ ¼ B ðr;oÞfnðr;oÞ;   (6)

ARTICLE IN PRESS

φe, φ

i

φs

φn

φr

φe

reticularnucleus

cortex

relaynuclei

ee,ei

es

rs re

srse

sn

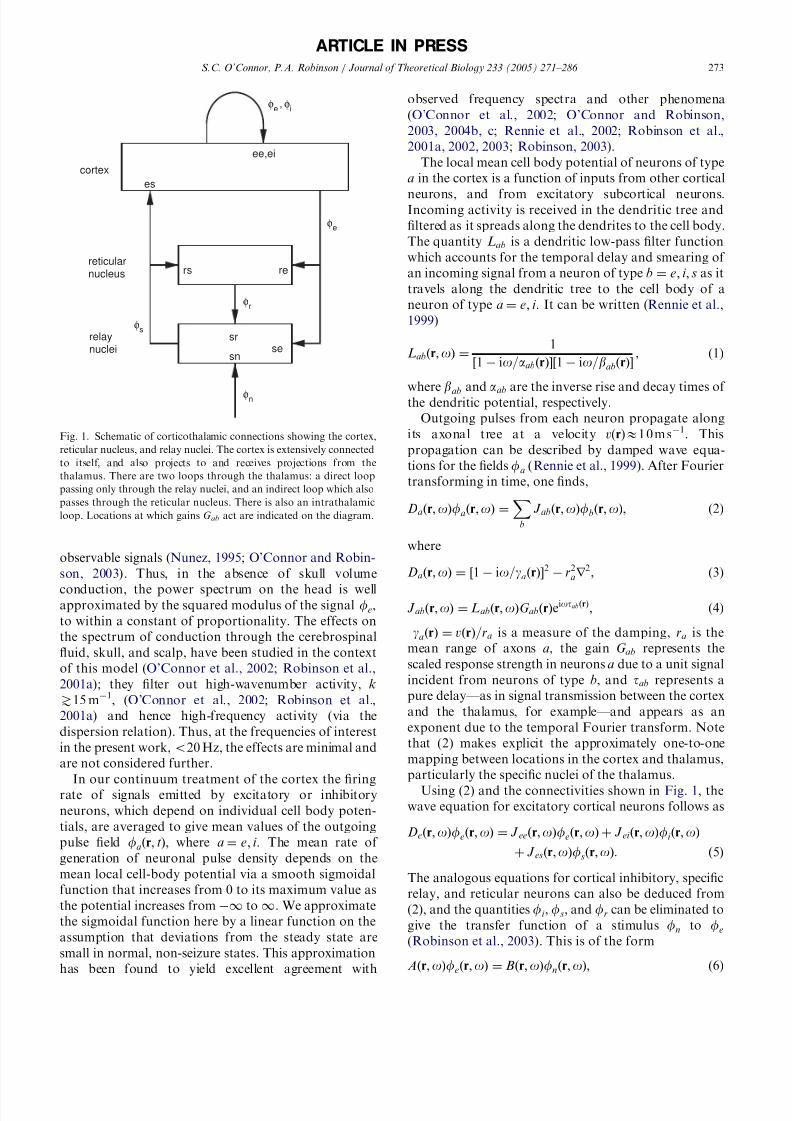
Fig. 1. Schematic of corticothalamic connections showing the cortex,

reticular nucleus, and relay nuclei. The cortex is extensively connected

to itself, and also projects to and receives projections from the

thalamus. There are two loops through the thalamus: a direct loop

passing only through the relay nuclei, and an indirect loop which also

passes through the reticular nucleus. There is also an intrathalamic

loop. Locations at which gains  G ab  act are indicated on the diagram.

S.C. O’Connor, P.A. Robinson / Journal of Theoretical Biology 233 (2005) 271–286    273

8/10/2019 Thalamic Tumor

http://slidepdf.com/reader/full/thalamic-tumor 4/16

where

Aðr;oÞ ¼  ð1  io=geÞ2

r2e

r 2

  J eeð1  J srJ rsÞðJ se þ J srJ reÞ

r2e ð1  J ei Þð1  J srJ rsÞ

  ;   ð7Þ

B ðr;oÞ ¼  J esJ sn

r2e ð1  J ei Þð1  J srJ rsÞ

:   (8)

The uniform case previously studied is a special case.

Activity in this model is relatively insensitive to precise

boundary conditions (O’Connor and Robinson, 2004a;

Robinson et al., 2001b;   Robinson, 2003), so we

investigate a simple cortical geometry in the first

instance. Taking the Fourier transform in space, and

applying periodic boundary conditions on a rectangular

cortex of size  l x l  y, the expression (6) becomes

XK

Aðk  K;oÞfeðK;oÞ ¼X

KB ðk  K;oÞfnðK;oÞ;

(9)

where   k   and   K   range over the values   kmj ; Kmj  ¼

ð2pm=l x; 2p j =l  yÞ;  and  m  and   j  are integers. Only a finite

number of modes can be included in the calculation, and

most of the activity can actually be captured using a

relatively small number of modes (Robinson et al.,

2003); thus we choose   M max   such that   jmj;   j j jpM max:Eq. (9) can be written as a matrix equation  AUe  ¼  BUn;or Ue  ¼  A1BUn  ¼  MUn;  where the size of each matrix

depends on the number of modes   M max   retained after

truncation [for the 2D cortex studied here,  A  and  B  are(2M max+1)2 (2M max+1)2 matrices and   Ue   is a

(2M max+1)2 1 column matrix] (Robinson et al.,

2003). We have shown previously (Robinson et al.,

2003) that the power spectrum at a given  r   is given by

P ðr;oÞ ¼ jfnðoÞ2jXm;n

exp½iðkm   knÞ  rðMMyÞmn   (10)

for spatially white noise, where   m   and   n   label matrix

elements. By averaging (10) over position, the mean

power can be written

P ðoÞ ¼ jfnðoÞ2jTrðMMyÞ;   (11)

where   fn   is independent of   o   if the noise is also

temporally white.

 2.1. Reduced parameter space

In this section, we give a brief overview of stability in

the model as it pertains to the present work. In previous

work using the uniform model (i.e. with spatially

uniform parameters) to analyse normal arousal

states and epileptic seizures, we found that stability

boundaries in parameter space occur approximately

where (Robinson et al., 2002)

0 ¼ ð1  io=geÞ2  x   yð1  G srsÞ

1  G srsL2 eiot0 ;   (12)

x ¼  G ee=ð1  G ei Þ;   (13)

 y ¼  G ese þ G esre

ð1  G srsÞð1  G ei Þ;   (14)

is satisfied, where for brevity we have written   G srs ¼

G srG rs;   G ese  ¼ G esG se;   and   G esre ¼  G esG srG re;   and   t0  ¼

2tes  ¼ 2tse  ¼  2tre   is the corticothalamic loop propaga-

tion delay. The quantities  x  and  y  relate to cortical and

corticothalamic activity, respectively, and

z ¼ G srsab=ða þ bÞ2;   (15)

parametrizes intrathalamic activity; thus, the system can

be approximately parametrized in a reduced three-

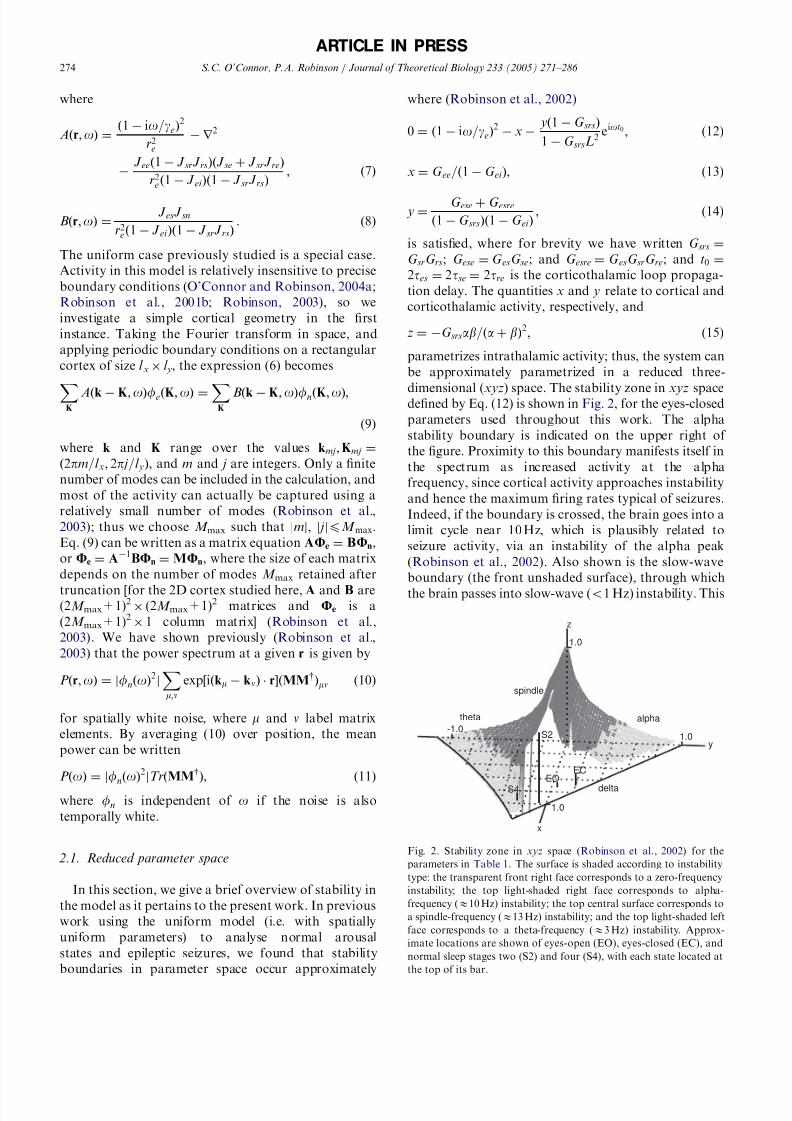
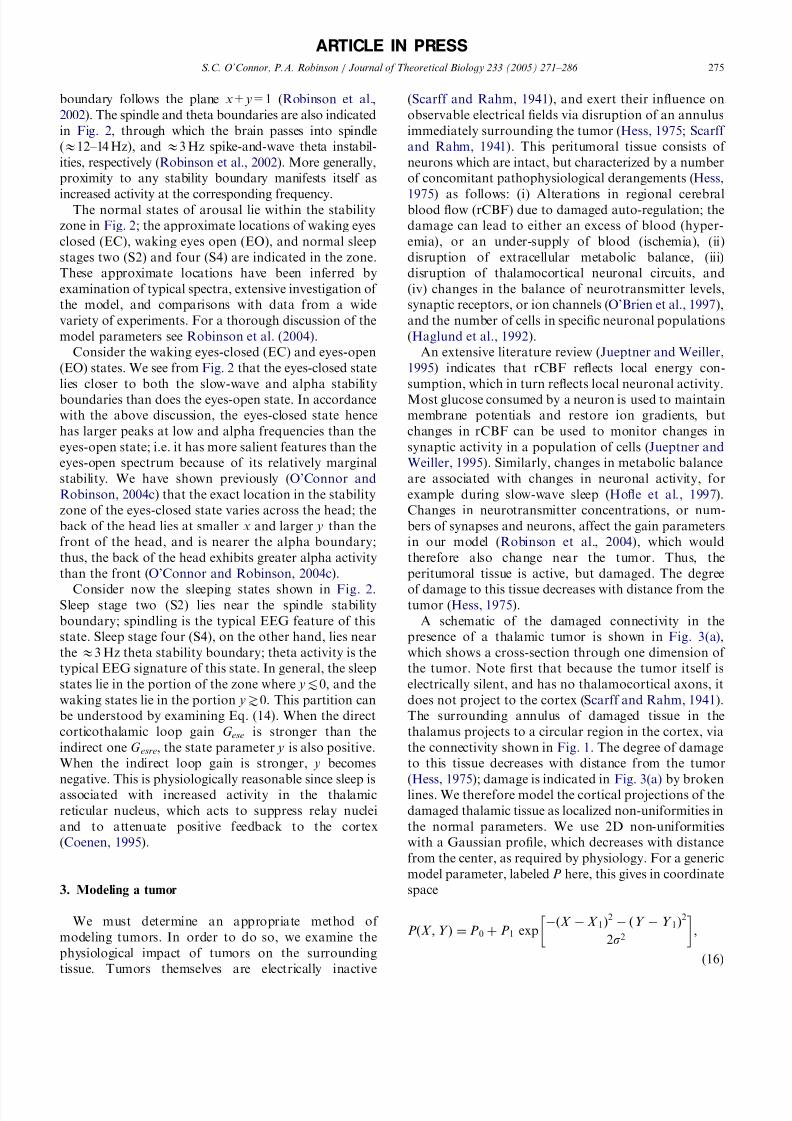
dimensional (xyz) space. The stability zone in  xyz  spacedefined by Eq. (12) is shown in Fig. 2, for the eyes-closed

parameters used throughout this work. The alpha

stability boundary is indicated on the upper right of 

the figure. Proximity to this boundary manifests itself in

the spectrum as increased activity at the alpha

frequency, since cortical activity approaches instability

and hence the maximum firing rates typical of seizures.

Indeed, if the boundary is crossed, the brain goes into a

limit cycle near 10 Hz, which is plausibly related to

seizure activity, via an instability of the alpha peak

(Robinson et al., 2002). Also shown is the slow-wave

boundary (the front unshaded surface), through which

the brain passes into slow-wave (o1 Hz) instability. This

ARTICLE IN PRESS

EO EC

S2

S4

z

1.0

y1.0

-1.0

x

1.0

theta

spindle

alpha

delta

Fig. 2. Stability zone in   xyz   space (Robinson et al., 2002)   for the

parameters in Table 1.  The surface is shaded according to instability

type: the transparent front right face corresponds to a zero-frequency

instability; the top light-shaded right face corresponds to alpha-

frequency (E10 Hz) instability; the top central surface corresponds to

a spindle-frequency (E13 Hz) instability; and the top light-shaded left

face corresponds to a theta-frequency (E3 Hz) instability. Approx-

imate locations are shown of eyes-open (EO), eyes-closed (EC), and

normal sleep stages two (S2) and four (S4), with each state located at

the top of its bar.

S.C. O’Connor, P.A. Robinson / Journal of Theoretical Biology 233 (2005) 271–286 274

8/10/2019 Thalamic Tumor

http://slidepdf.com/reader/full/thalamic-tumor 5/16

boundary follows the plane   x+ y=1 (Robinson et al.,

2002). The spindle and theta boundaries are also indicated

in   Fig. 2,   through which the brain passes into spindle

(E12–14 Hz), and  E3 Hz spike-and-wave theta instabil-

ities, respectively (Robinson et al., 2002). More generally,

proximity to any stability boundary manifests itself as

increased activity at the corresponding frequency.The normal states of arousal lie within the stability

zone in Fig. 2; the approximate locations of waking eyes

closed (EC), waking eyes open (EO), and normal sleep

stages two (S2) and four (S4) are indicated in the zone.

These approximate locations have been inferred by

examination of typical spectra, extensive investigation of 

the model, and comparisons with data from a wide

variety of experiments. For a thorough discussion of the

model parameters see Robinson et al. (2004).

Consider the waking eyes-closed (EC) and eyes-open

(EO) states. We see from Fig. 2 that the eyes-closed state

lies closer to both the slow-wave and alpha stability

boundaries than does the eyes-open state. In accordance

with the above discussion, the eyes-closed state hence

has larger peaks at low and alpha frequencies than the

eyes-open state; i.e. it has more salient features than the

eyes-open spectrum because of its relatively marginal

stability. We have shown previously (O’Connor and

Robinson, 2004c) that the exact location in the stability

zone of the eyes-closed state varies across the head; the

back of the head lies at smaller  x  and larger  y  than the

front of the head, and is nearer the alpha boundary;

thus, the back of the head exhibits greater alpha activity

than the front (O’Connor and Robinson, 2004c).

Consider now the sleeping states shown in   Fig. 2.Sleep stage two (S2) lies near the spindle stability

boundary; spindling is the typical EEG feature of this

state. Sleep stage four (S4), on the other hand, lies near

the E3 Hz theta stability boundary; theta activity is the

typical EEG signature of this state. In general, the sleep

states lie in the portion of the zone where  yt0; and the

waking states lie in the portion  y\0: This partition can

be understood by examining Eq. (14). When the direct

corticothalamic loop gain   G ese   is stronger than the

indirect one  G esre, the state parameter  y  is also positive.

When the indirect loop gain is stronger,   y   becomes

negative. This is physiologically reasonable since sleep isassociated with increased activity in the thalamic

reticular nucleus, which acts to suppress relay nuclei

and to attenuate positive feedback to the cortex

(Coenen, 1995).

3. Modeling a tumor

We must determine an appropriate method of 

modeling tumors. In order to do so, we examine the

physiological impact of tumors on the surrounding

tissue. Tumors themselves are electrically inactive

(Scarff and Rahm, 1941), and exert their influence on

observable electrical fields via disruption of an annulus

immediately surrounding the tumor (Hess, 1975; Scarff 

and Rahm, 1941). This peritumoral tissue consists of 

neurons which are intact, but characterized by a number

of concomitant pathophysiological derangements (Hess,

1975) as follows: (i) Alterations in regional cerebralblood flow (rCBF) due to damaged auto-regulation; the

damage can lead to either an excess of blood (hyper-

emia), or an under-supply of blood (ischemia), (ii)

disruption of extracellular metabolic balance, (iii)

disruption of thalamocortical neuronal circuits, and

(iv) changes in the balance of neurotransmitter levels,

synaptic receptors, or ion channels (O’Brien et al., 1997),

and the number of cells in specific neuronal populations

(Haglund et al., 1992).

An extensive literature review (Jueptner and Weiller,

1995) indicates that rCBF reflects local energy con-

sumption, which in turn reflects local neuronal activity.

Most glucose consumed by a neuron is used to maintain

membrane potentials and restore ion gradients, but

changes in rCBF can be used to monitor changes in

synaptic activity in a population of cells (Jueptner and

Weiller, 1995). Similarly, changes in metabolic balance

are associated with changes in neuronal activity, for

example during slow-wave sleep (Hofle et al., 1997).

Changes in neurotransmitter concentrations, or num-

bers of synapses and neurons, affect the gain parameters

in our model (Robinson et al., 2004), which would

therefore also change near the tumor. Thus, the

peritumoral tissue is active, but damaged. The degree

of damage to this tissue decreases with distance from thetumor (Hess, 1975).

A schematic of the damaged connectivity in the

presence of a thalamic tumor is shown in   Fig. 3(a),

which shows a cross-section through one dimension of 

the tumor. Note first that because the tumor itself is

electrically silent, and has no thalamocortical axons, it

does not project to the cortex (Scarff and Rahm, 1941).

The surrounding annulus of damaged tissue in the

thalamus projects to a circular region in the cortex, via

the connectivity shown in Fig. 1. The degree of damage

to this tissue decreases with distance from the tumor

(Hess, 1975); damage is indicated in Fig. 3(a) by brokenlines. We therefore model the cortical projections of the

damaged thalamic tissue as localized non-uniformities in

the normal parameters. We use 2D non-uniformities

with a Gaussian profile, which decreases with distance

from the center, as required by physiology. For a generic

model parameter, labeled P  here, this gives in coordinate

space

P ðX ; Y Þ ¼ P 0 þ  P 1  exp  ðX   X 1Þ2 ðY   Y 1Þ2

2s2

;

(16)

ARTICLE IN PRESS

S.C. O’Connor, P.A. Robinson / Journal of Theoretical Biology 233 (2005) 271–286    275

8/10/2019 Thalamic Tumor

http://slidepdf.com/reader/full/thalamic-tumor 6/16

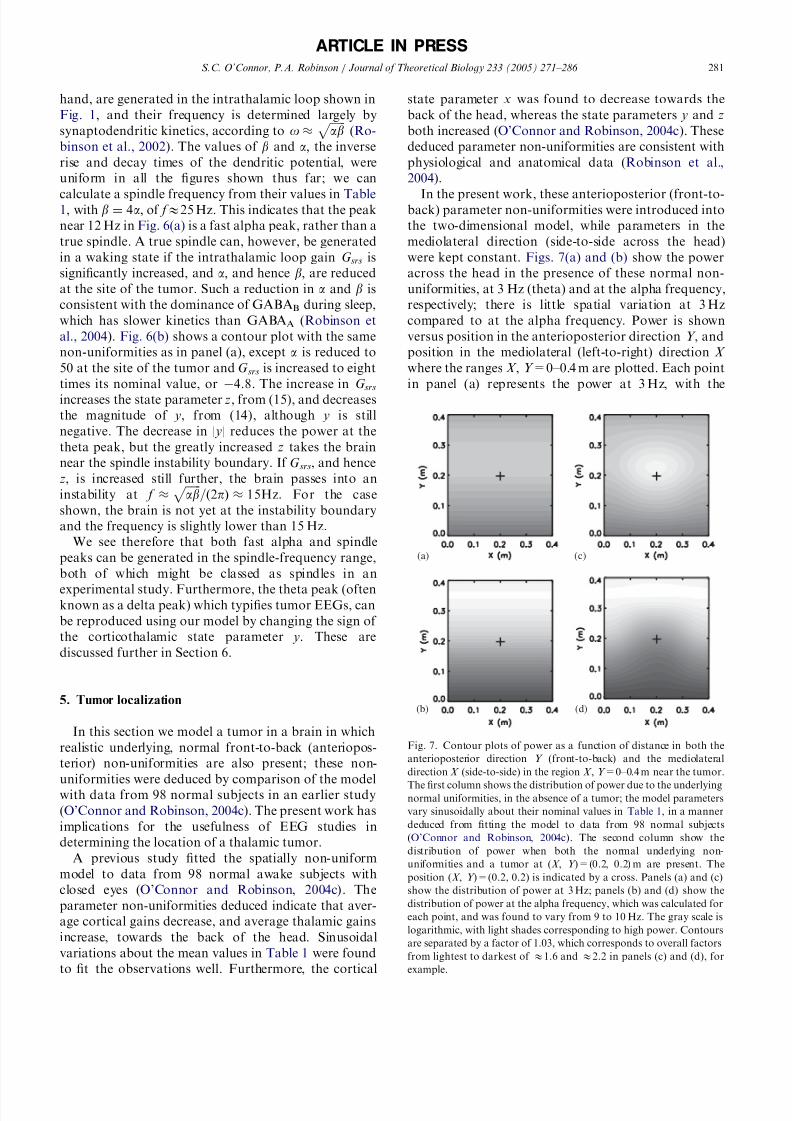
where   P (X ,   Y ) takes a value   P 0+P 1   at the tumor

centroid or ‘focus’ (X 1,   Y 1), and the Gaussian has a

characteristic width of  s:  In the present work, we take

the background, or nominal value  P 0 of each parameter

to be that for a waking, eyes-closed state; the parameters

have been extensively studied using the spatially uniform

model, and are consistent with anatomical and physio-

logical data (Robinson et al., 2004). Position in the two

dimensions is labeled with  X  and  Y  to avoid confusion

with the state parameters  x,  y, and  z.In the following, we take as the linear dimension of 

the brain   l x=l  y=0.8 m, the approximate circumference

of the brain, which was determined by scaling the head

circumference to account for cortical convolutions

(Nunez, 1981). We take the front of the head to

correspond to   Y   ¼ 0 m;   and the back to   Y   ¼ 0:4 m:   If 

we consider a thalamic tumor that affects an area of 

cortex with width s; the fraction of the cortex affected is

of order pð2s=l xÞ2; where we assume most of the affected

area lies within 2s of the tumor center. For  s  ¼  0:03 m;the tumor affects less than 2% of the cortex, and for

s ¼  0:05 m;  the tumor affects around 5% of the cortex.

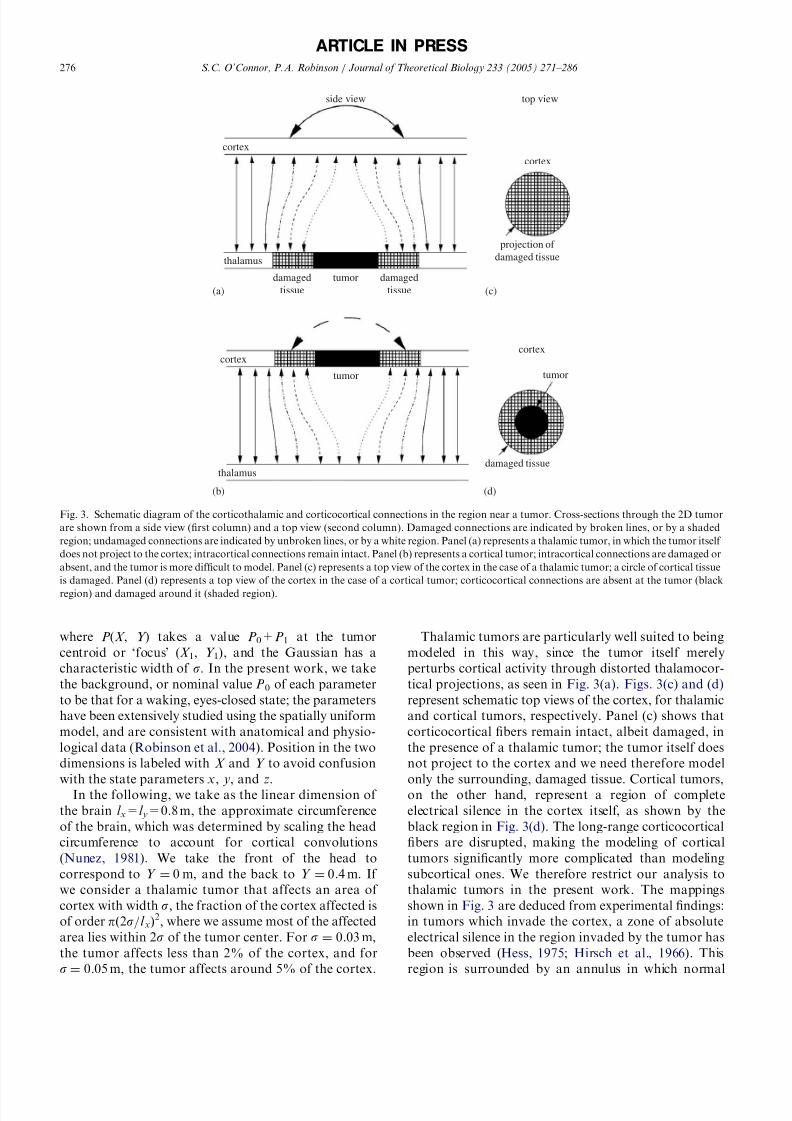
Thalamic tumors are particularly well suited to being

modeled in this way, since the tumor itself merely

perturbs cortical activity through distorted thalamocor-

tical projections, as seen in  Fig. 3(a).  Figs. 3(c) and (d)

represent schematic top views of the cortex, for thalamic

and cortical tumors, respectively. Panel (c) shows that

corticocortical fibers remain intact, albeit damaged, in

the presence of a thalamic tumor; the tumor itself does

not project to the cortex and we need therefore model

only the surrounding, damaged tissue. Cortical tumors,on the other hand, represent a region of complete

electrical silence in the cortex itself, as shown by the

black region in Fig. 3(d). The long-range corticocortical

fibers are disrupted, making the modeling of cortical

tumors significantly more complicated than modeling

subcortical ones. We therefore restrict our analysis to

thalamic tumors in the present work. The mappings

shown in Fig. 3 are deduced from experimental findings:

in tumors which invade the cortex, a zone of absolute

electrical silence in the region invaded by the tumor has

been observed (Hess, 1975;   Hirsch et al., 1966). This

region is surrounded by an annulus in which normal

ARTICLE IN PRESS

side view top view

cortex

thalamus

damaged

tissue

damaged

tissue

tumor

projection of 

damaged tissue

cortex

cortex

thalamus

tumor

cortex

tumor

damaged tissue

(a) (c)

(b) (d)

Fig. 3. Schematic diagram of the corticothalamic and corticocortical connections in the region near a tumor. Cross-sections through the 2D tumor

are shown from a side view (first column) and a top view (second column). Damaged connections are indicated by broken lines, or by a shaded

region; undamaged connections are indicated by unbroken lines, or by a white region. Panel (a) represents a thalamic tumor, in which the tumor itself 

does not project to the cortex; intracortical connections remain intact. Panel (b) represents a cortical tumor; intracortical connections are damaged or

absent, and the tumor is more difficult to model. Panel (c) represents a top view of the cortex in the case of a thalamic tumor; a circle of cortical tissue

is damaged. Panel (d) represents a top view of the cortex in the case of a cortical tumor; corticocortical connections are absent at the tumor (black

region) and damaged around it (shaded region).

S.C. O’Connor, P.A. Robinson / Journal of Theoretical Biology 233 (2005) 271–286 276

8/10/2019 Thalamic Tumor

http://slidepdf.com/reader/full/thalamic-tumor 7/16

electrical activity is disrupted (Hess, 1975; Hirsch et al.,

1966), due to damaged brain tissue adjacent to the

tumor (Scarff and Rahm, 1941). These features are seen

in   Fig. 3(d). Significantly, the inner zone of absolute

electrical silence is not observed in subcortical tumors

(Hess, 1975;   Hirsch et al., 1966), in accord with

the schematic in   Fig. 3(c)   and the mapping shown inFig. 3(a).

4. Involvement of the cortex and thalamus

In this section, we show how the pathological

observations typical of EEGs in the presence of a

tumor, outlined in Section 1, can be reproduced by our

model, as can normal EEGs in the presence of a tumor.

We concentrate on waking EEGs, for which the most

amount of data are available. The nominal model

parameters are shown in   Table 1, and were found byfitting the model to data recorded from 98 normal

subjects in the waking, eyes-closed state (O’Connor and

Robinson, 2004c). We model a tumor by introducing

small parameter non-uniformities with Gaussian pro-

files, of the form (16). Initially, we study the reduced

three-dimensional xyz  parameter space, which provides

a means of easily visualizing the range of effects. We

also study the effects of varying the tumor size.

4.1. Purely cortical effects

Fig. 4 shows the effect on the spectrum of introducingGaussian non-uniformities into the state parameters  x,

 y, and  z, given by Eqs. (13)–(15), respectively.  Fig. 4(a)

shows the variation in   x   across the head, representing

purely cortical non-uniformities. Note that we are not

modeling cortical tumors, for reasons discussed in

Section 3, but rather cortical effects of thalamic tumors;

for example possible changes in the local base cortical

activity and hence gains, due to damaged thalamocor-

tical afferents.

The tumor is two-dimensional, and a cross-section

through its center along the line   Y =0.2 m is shown in

Fig. 4. The background level of  x    0:75 is typical of the

waking, eyes-closed state (O’Connor and Robinson,

2004c; Robinson et al., 2004). The Gaussian patch non-uniformity in  x is obtained here by introducing a patch

non-uniformity into the cortical gain parameter  G ee; it is

centered at (X ,  Y )=(0.2, 0.2) m and has a width of  s ¼

0:03 m:  Recall from Section 3 that such a tumor affects

less than 2% of the cortical area. The region of the brain

surrounding the tumor is shown, from   X =0–0.4 m,

representing half of the brain, which extends to

X =0.8 m, as discussed in Section 3. The state parameter

x is always positive, from (13), so it falls to its minimum

value at (0.2, 0.2) m in   Fig. 4(a). All parameters other

than  G ee  are held uniform at their nominal eyes-closed

value, shown in Table 1.

Fig. 4(b) shows two spectra predicted from the model

for the non-uniformity in panel (a): the solid line

represents the local spectrum at the tumor focus, from

(10), and the dotted line represents the mean spectrum

across the head, from (11). We see that the patch

reduction in x  gives a slight focal reduction in power at

all frequencies. The reduction is not evident at most

other sites, as seen by inspecting Fig. 4(c), which shows

the cortical power as a function of both frequency and

position. Again, for ease of illustration, only a 1D slice

through the 2D spectrum is shown, through the tumor

center. The dashed lines are at the tumor focus plus and

minus one characteristic width  s  of the Gaussian.Note that introducing a patch non-uniformity with

positive amplitude into  x, scales the whole spectrum to

higher power near the patch focus, opposite to the

behavior in   Fig. 4(a). However, thalamic tumors have

been associated with a hypometabolic cortical region

adjacent to the tumor, even if the tumor did not directly

involve the cortex (Newmark et al., 1983). Hence, an

increase in the state parameter  x   is an unlikely correlate

of thalamic tumors, and is not investigated in full here.

4.2. Purely thalamic effects

Let us turn our attention to variations in the purely

thalamic state parameter  z, given by Eq. (15). Again, we

show our results over  X =0–0.4 m, the part of the brain

near the tumor focus (X , Y )=(0.2, 0.2) m. In the present

work, the ratio  b=a ¼  4 is held constant, and  z depends

only on the intrathalamic gain  G srs. Non-uniformities in

z  therefore correspond to non-uniformities in this gain.

A Gaussian patch non-uniformity was introduced into

G srs, and hence   z, and is represented in   Fig. 4(d); all

other parameters are at their nominal eyes-closed values,

shown in  Table 1. The background value of   z   0:1 is

typical of the waking, eyes-closed state (O’Connor and

ARTICLE IN PRESS

Table 1

Nominal model parameters for the waking eyes-closed state

Parameter Value Unit

G ee   7.5 —  G ei    9.1 —  

G ese   6.1 —  

G esre   3.8 —  

G srs   0.6 —  

G sn   1.1 —  

re   0.08 m

ge   180 s1

a   80 s1

t0   0.085 s

These mean values were obtained by fitting the model to data recorded

from 98 normal awake subjects with closed eyes (O’Connor and

Robinson, 2004c), and are consistent with physiology and anatomy

(Robinson et al., 2004).

S.C. O’Connor, P.A. Robinson / Journal of Theoretical Biology 233 (2005) 271–286    277

8/10/2019 Thalamic Tumor

http://slidepdf.com/reader/full/thalamic-tumor 8/16

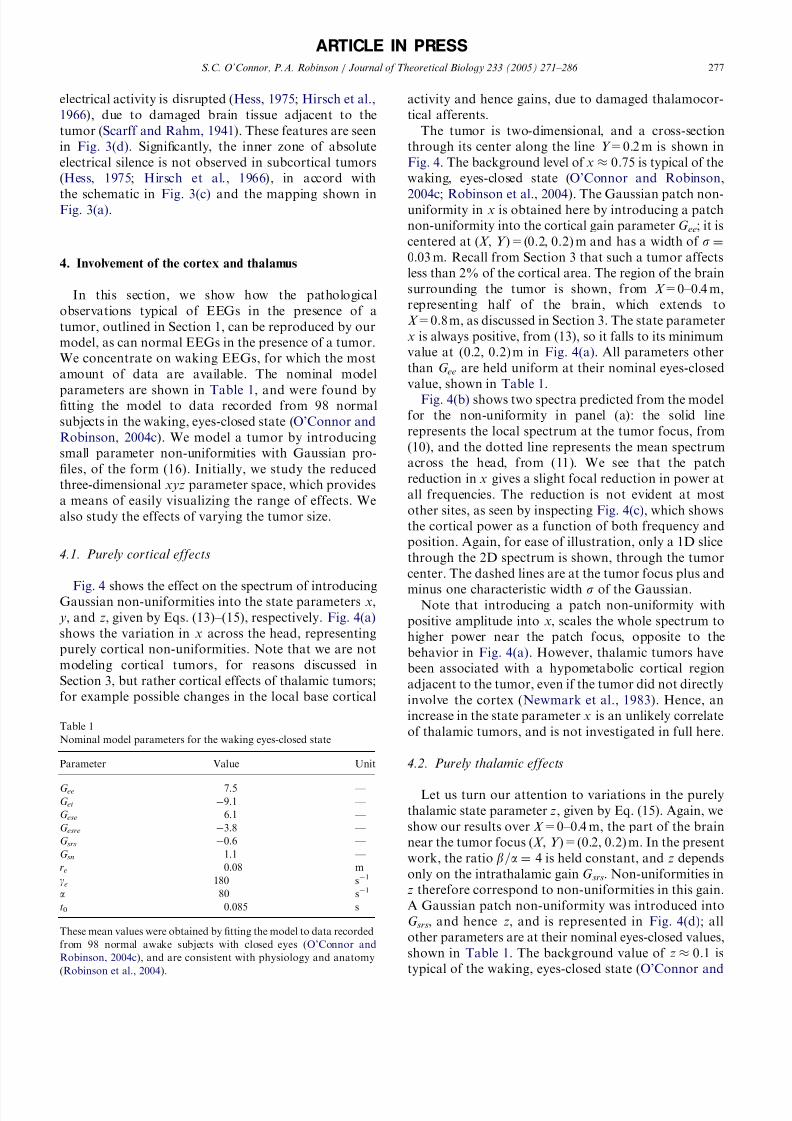
Robinson, 2004c;   Robinson et al., 2004). Similarly to

panel (a), the Gaussian has a centroid at (X ,  Y )=(0.2,

0.2) m and a width of 0.03 m, and a one-dimensional

cross-section through the tumor center is shown. The

quantity   z   is always positive, from (15), and so the

minimum of  z ¼  0 at the tumor center is the minimum

possible value for  z. A one-dimensional cross-section of 

the local predicted spectrum at (0.2, 0.2) m is represented

by the solid line in  Fig. 4(e), and the mean spectrum is

represented by the dotted line in the same panel. We see

that there is little effect on the spectrum as a result of the

patch reduction in  z, which is already small for waking,

eyes-closed states. Similarly, the grayscale plot in   Fig.

4(f) shows little effect.

If the sign of the Gaussian is reversed, and  z  reaches a

maximum at (X ,   Y )=(0.2, 0.2) m, then at the tumor

focus the alpha peak diminishes and the beta peak

grows, compared to the mean spectrum. This effect is

slight for small variations in  z.

4.3. Corticothalamic effects

Consider now a non-uniformity in the corticothalamic

state parameter   y, given by (14).  Fig. 4(g)  represents a

ARTICLE IN PRESS

(a) (b) (c)

(d) (e) (f)

(g) (h) (i)

(j) (k) (l)

Fig. 4. Effects on the spectrum of localized Gaussian non-uniformities in the state parameters x, y, and z, centered at (X , Y )=(0.2, 0.2) m. The first

column shows a 1D cross-section at Y =0.2 m of the variation of the parameter across the head in the region X =0–0.4 m near the tumor; the second

column shows the spectrum; and the third column shows the power as a function of both frequency and distance  X . The dotted line in each panel of 

the second column is the mean spectrum, and the solid line is the local spectrum at the tumor center. The grayscale in the final column is logarithmic,

with contours separated by a factor of 1.5, and light shades corresponding to high power; the dashed lines represent one characteristic width  s  of the

Gaussian from the tumor focus. Panels (a)–(c) correspond to purely cortical non-uniformities in  x; panels (d)–(f) correspond to purely thalamic non-

uniformities in   z; panels (g)–(i) correspond to a non-uniformity in the corticothalamic state parameter   y; panels (j)–(1) correspond to a non-

uniformity in y  with larger width (s ¼  0:05m).

S.C. O’Connor, P.A. Robinson / Journal of Theoretical Biology 233 (2005) 271–286 278

8/10/2019 Thalamic Tumor

http://slidepdf.com/reader/full/thalamic-tumor 9/16

one-dimensional cross-section through  Y =0.2 m of the

variation of  y over the head where, as above, the patch is

a Gaussian localized at (X ,   Y )=(0.2, 0.2) m, with a

width of 0.03m, and the results are shown over

X =0–0.4 m. The background value of  y    0:15 is typical

of the waking, eyes-closed state (O’Connor and Robin-

son, 2004c;   Robinson et al., 2004). We reduce   y   to avalue of   1:1 at the patch center in   Fig. 4(g), by

reducing G ese and increasing |G esre|; these parameters are

studied individually later in this subsection.  Fig. 4(h)

shows the local spectrum at the tumor focus (solid line),

and the mean spectrum across the head (dotted line) for

the non-uniformity shown in panel (g). The local

spectrum differs in several important ways from the

mean spectrum: the background activity is attenuated at

low frequencies, and at alpha and beta frequencies; there

is an additional peak in the theta range near 3 Hz (often

called the delta range); and, the alpha peak is shifted to a

higher frequency. These effects are quite localized, as

seen from the grayscale plot in  Fig. 4(i).

We now increase the size of the tumor, as seen in Fig.

4(j), where that the affected cortical area has a width of 

0.05 m, which affects around 5% of the cortex. Fig. 4(h)

shows that there is a peak near 12 Hz, which lies in the

spindle frequency range. The amplitude of the theta

peak near 3 Hz also increases as the size of the tumor

increases.   Figs. 4(k) and (l)   show the large peak near

3 Hz, the attenuation of background frequencies, and

the peak in the spindle range, near 12 Hz. With reference

to the discussion in Section 2.1, we note that a localized

change in the sign of  y  would take that local portion of 

the brain into a region of the stability zone in   Fig. 2which is normally associated with sleep states; hence the

appearance of the typical sleep peaks near 3 and 12 Hz.

We explore the possibility that the    12Hz rhythm is

‘fast alpha’, rather than a spindle, in conjunction with

Fig. 6 below. This is also discussed thoroughly in

Section 6.

Consider first the effects on the spectrum of changing

the sign of the Gaussian patch, so that   y   takes amaximum at the patch focus. From  Fig. 2, we see that

increasing  y   takes the brain nearer both the alpha and

slow-wave stability boundaries; indeed, in such a case we

see a corresponding increase in the power at alpha and

low frequencies. If the increase in   y   takes the brain

outside the stability boundaries in Fig. 2 then the brain

becomes unstable at those frequencies. This mechanism

could account for the epileptiform discharges sometimes

observed in the EEGs of subjects with a thalamic tumor

(Cheek and Taveras, 1966;   Hirose et al., 1975;   Janati

and Hester, 1986;   Robinson et al., 2002), and is

discussed further in Section 6.

From (14) the sign of  y  depends only on the relative

magnitudes of   G ese   and   G esre, since   G srs   and   G ei   are

always negative. We now examine the effects of  G ese and

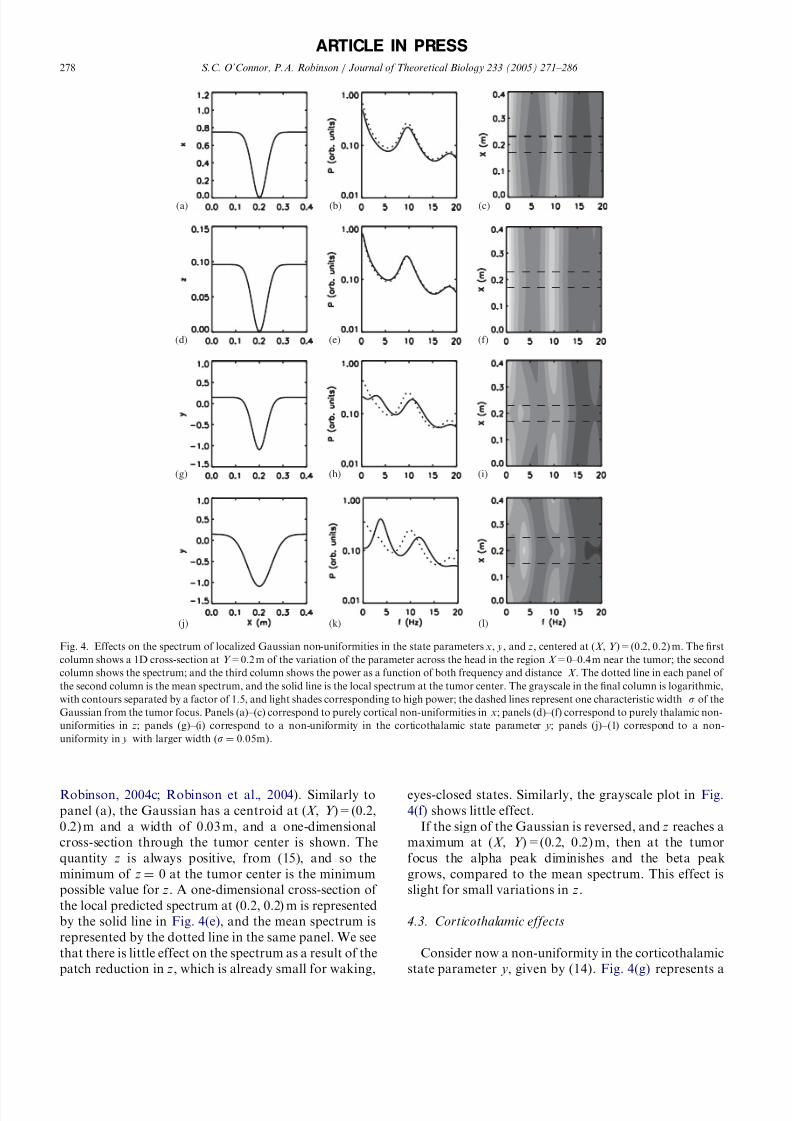
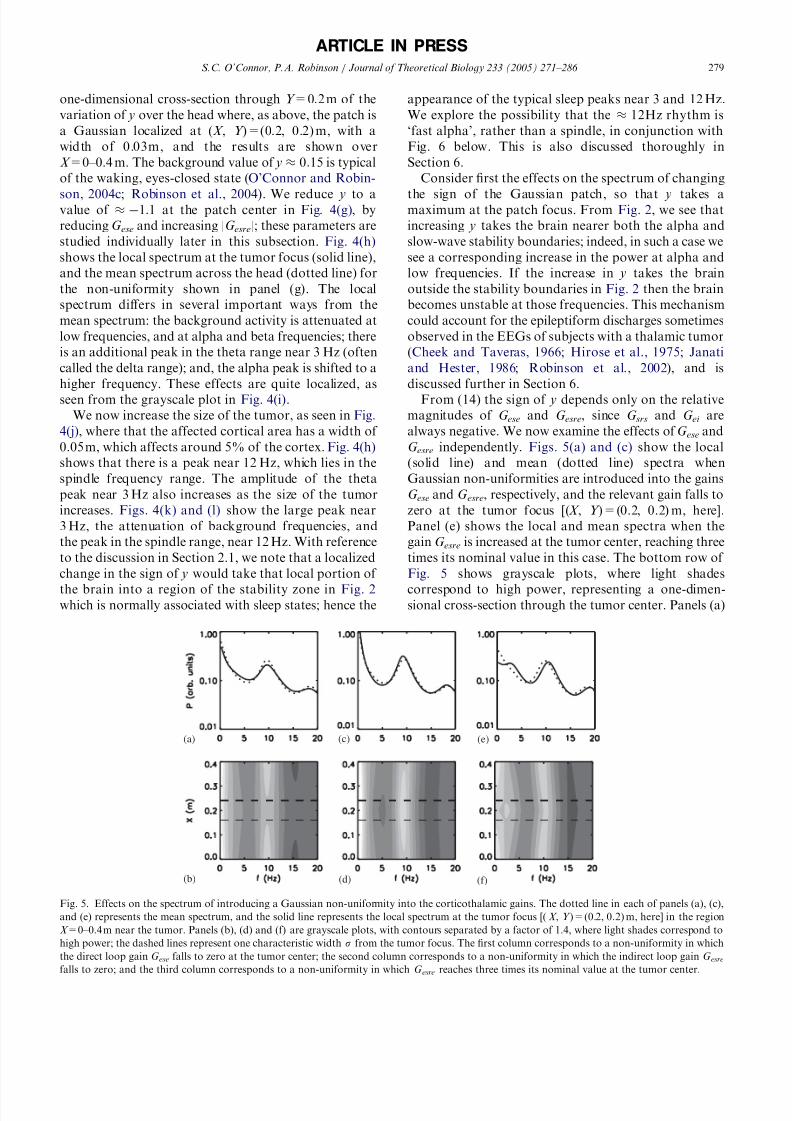
G esre   independently.   Figs. 5(a) and (c)   show the local

(solid line) and mean (dotted line) spectra when

Gaussian non-uniformities are introduced into the gains

G ese and  G esre, respectively, and the relevant gain falls to

zero at the tumor focus [(X ,   Y )=(0.2, 0.2) m, here].

Panel (e) shows the local and mean spectra when the

gain G esre is increased at the tumor center, reaching three

times its nominal value in this case. The bottom row of 

Fig. 5   shows grayscale plots, where light shades

correspond to high power, representing a one-dimen-sional cross-section through the tumor center. Panels (a)

ARTICLE IN PRESS

(a)

(b)

(c)   (e)

(d)   (f)

Fig. 5. Effects on the spectrum of introducing a Gaussian non-uniformity into the corticothalamic gains. The dotted line in each of panels (a), (c),

and (e) represents the mean spectrum, and the solid line represents the local spectrum at the tumor focus [( X ,  Y )=(0.2, 0.2) m, here] in the region

X =0–0.4 m near the tumor. Panels (b), (d) and (f) are grayscale plots, with contours separated by a factor of 1.4, where light shades correspond to

high power; the dashed lines represent one characteristic width  s  from the tumor focus. The first column corresponds to a non-uniformity in which

the direct loop gain  G ese falls to zero at the tumor center; the second column corresponds to a non-uniformity in which the indirect loop gain  G esrefalls to zero; and the third column corresponds to a non-uniformity in which  G esre   reaches three times its nominal value at the tumor center.

S.C. O’Connor, P.A. Robinson / Journal of Theoretical Biology 233 (2005) 271–286    279

8/10/2019 Thalamic Tumor

http://slidepdf.com/reader/full/thalamic-tumor 10/16

and (b) show that the reduction in G ese and hence y, and

consequently increased distance from the slow-wave and

alpha stability boundaries indicated in  Fig. 2, produces

a focal attenuation of background activity, similar to

that in Figs. 4(h) and (k). In panels (c) and (d), we see

the opposite effect: the reduction in |G esre| and hence

increase in   y, and consequently increased proximity tothe slow-wave and alpha stability boundaries indicated

in   Fig. 2, produces a focal increase of background

rhythms. Furthermore, there is a slight downward shift

of the alpha peak frequency in panel (c), or ‘background

slowing’, due to disruption of the propagation delay in

the corticothalamic pathway. In panels (e) and (f), there

is a focal theta (E3 Hz) peak, and a focal shift in the

alpha peak towards the spindle frequency. We thus see

that reducing   G ese  attenuates the background peaks by

flattening the spectrum, and increasing |G esre| introduces

the abnormal theta peak. The latter effect is due to the

sign change of the state parameter   y   and consequent

localized over-inhibited state.

The spectral effects of non-uniformities in the

parameters   G ei   and   G srs   are more complicated, since

they affect more than one of the state parameters  x,  y,

and z. In general, decreasing |G ei | increases both x and y,

and hence gives higher power at spectral peaks.

Decreasing |G srs| increases  y  but decreases  z, from Eqs.

(14) and (15), so its effect depends on the location in the

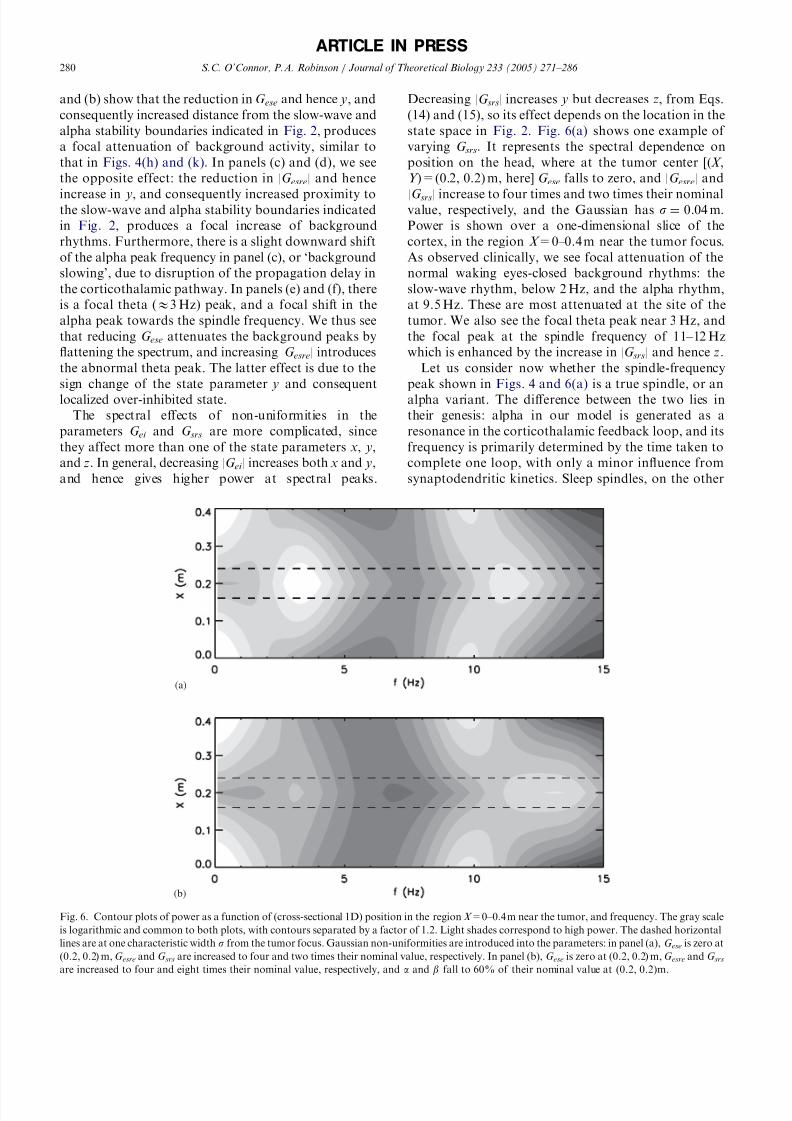
state space in   Fig. 2.   Fig. 6(a)   shows one example of 

varying   G srs. It represents the spectral dependence on

position on the head, where at the tumor center [(X ,

Y )=(0.2, 0.2) m, here] G ese falls to zero, and |G esre| and

|G srs| increase to four times and two times their nominalvalue, respectively, and the Gaussian has   s ¼  0:04 m:Power is shown over a one-dimensional slice of the

cortex, in the region  X =0–0.4 m near the tumor focus.

As observed clinically, we see focal attenuation of the

normal waking eyes-closed background rhythms: the

slow-wave rhythm, below 2 Hz, and the alpha rhythm,

at 9.5 Hz. These are most attenuated at the site of the

tumor. We also see the focal theta peak near 3 Hz, and

the focal peak at the spindle frequency of 11–12 Hz

which is enhanced by the increase in |G srs| and hence  z.

Let us consider now whether the spindle-frequency

peak shown in Figs. 4 and 6(a)  is a true spindle, or an

alpha variant. The difference between the two lies in

their genesis: alpha in our model is generated as a

resonance in the corticothalamic feedback loop, and its

frequency is primarily determined by the time taken to

complete one loop, with only a minor influence from

synaptodendritic kinetics. Sleep spindles, on the other

ARTICLE IN PRESS

(a)

(b)

Fig. 6. Contour plots of power as a function of (cross-sectional 1D) position in the region X =0–0.4 m near the tumor, and frequency. The gray scale

is logarithmic and common to both plots, with contours separated by a factor of 1.2. Light shades correspond to high power. The dashed horizontal

lines are at one characteristic width s  from the tumor focus. Gaussian non-uniformities are introduced into the parameters: in panel (a),  G ese is zero at

(0.2, 0.2) m, G esre and G srs are increased to four and two times their nominal value, respectively. In panel (b),  G ese is zero at (0.2, 0.2) m, G esre and G srsare increased to four and eight times their nominal value, respectively, and  a  and  b  fall to 60% of their nominal value at (0.2, 0.2)m.

S.C. O’Connor, P.A. Robinson / Journal of Theoretical Biology 233 (2005) 271–286 280

8/10/2019 Thalamic Tumor

http://slidepdf.com/reader/full/thalamic-tumor 11/16

hand, are generated in the intrathalamic loop shown in

Fig. 1, and their frequency is determined largely by

synaptodendritic kinetics, according to  o  ffiffiffiffiffiffiab

p   (Ro-

binson et al., 2002). The values of  b  and  a;  the inverse

rise and decay times of the dendritic potential, were

uniform in all the figures shown thus far; we can

calculate a spindle frequency from their values in Table1, with b  ¼  4a; of  f E25 Hz. This indicates that the peak

near 12 Hz in Fig. 6(a) is a fast alpha peak, rather than a

true spindle. A true spindle can, however, be generated

in a waking state if the intrathalamic loop gain   G srs   is

significantly increased, and  a;  and hence  b;  are reduced

at the site of the tumor. Such a reduction in  a  and  b   is

consistent with the dominance of GABAB during sleep,

which has slower kinetics than GABAA   (Robinson et

al., 2004). Fig. 6(b) shows a contour plot with the same

non-uniformities as in panel (a), except  a   is reduced to

50 at the site of the tumor and  G srs is increased to eight

times its nominal value, or   4.8. The increase in   G srsincreases the state parameter  z, from (15), and decreases

the magnitude of   y, from (14), although   y   is still

negative. The decrease in | y| reduces the power at the

theta peak, but the greatly increased   z   takes the brain

near the spindle instability boundary. If  G srs, and hence

z, is increased still further, the brain passes into an

instability at   f    ffiffiffiffiffiffiab

p   =ð2pÞ  15Hz:   For the case

shown, the brain is not yet at the instability boundary

and the frequency is slightly lower than 15 Hz.

We see therefore that both fast alpha and spindle

peaks can be generated in the spindle-frequency range,

both of which might be classed as spindles in an

experimental study. Furthermore, the theta peak (oftenknown as a delta peak) which typifies tumor EEGs, can

be reproduced using our model by changing the sign of 

the corticothalamic state parameter   y. These are

discussed further in Section 6.

5. Tumor localization

In this section we model a tumor in a brain in which

realistic underlying, normal front-to-back (anteriopos-

terior) non-uniformities are also present; these non-

uniformities were deduced by comparison of the modelwith data from 98 normal subjects in an earlier study

(O’Connor and Robinson, 2004c). The present work has

implications for the usefulness of EEG studies in

determining the location of a thalamic tumor.

A previous study fitted the spatially non-uniform

model to data from 98 normal awake subjects with

closed eyes (O’Connor and Robinson, 2004c). The

parameter non-uniformities deduced indicate that aver-

age cortical gains decrease, and average thalamic gains

increase, towards the back of the head. Sinusoidal

variations about the mean values in Table 1 were found

to fit the observations well. Furthermore, the cortical

state parameter   x   was found to decrease towards the

back of the head, whereas the state parameters  y  and  z

both increased (O’Connor and Robinson, 2004c). These

deduced parameter non-uniformities are consistent with

physiological and anatomical data (Robinson et al.,

2004).

In the present work, these anterioposterior (front-to-back) parameter non-uniformities were introduced into

the two-dimensional model, while parameters in the

mediolateral direction (side-to-side across the head)

were kept constant.   Figs. 7(a) and (b)   show the power

across the head in the presence of these normal non-

uniformities, at 3 Hz (theta) and at the alpha frequency,

respectively; there is little spatial variation at 3 Hz

compared to at the alpha frequency. Power is shown

versus position in the anterioposterior direction  Y , and

position in the mediolateral (left-to-right) direction   X 

where the ranges  X ,  Y =0–0.4 m are plotted. Each point

in panel (a) represents the power at 3 Hz, with the

ARTICLE IN PRESS

(a) (c)

(b) (d)

Fig. 7. Contour plots of power as a function of distance in both the

anterioposterior direction   Y   (front-to-back) and the mediolateral

direction X  (side-to-side) in the region  X ,  Y =0–0.4 m near the tumor.

The first column shows the distribution of power due to the underlyingnormal uniformities, in the absence of a tumor; the model parameters

vary sinusoidally about their nominal values in  Table 1, in a manner

deduced from fitting the model to data from 98 normal subjects

(O’Connor and Robinson, 2004c). The second column show the

distribution of power when both the normal underlying non-

uniformities and a tumor at (X ,   Y )=(0.2, 0.2) m are present. The

position (X ,  Y )=(0.2, 0.2) is indicated by a cross. Panels (a) and (c)

show the distribution of power at 3 Hz; panels (b) and (d) show the

distribution of power at the alpha frequency, which was calculated for

each point, and was found to vary from 9 to 10 Hz. The gray scale is

logarithmic, with light shades corresponding to high power. Contours

are separated by a factor of 1.03, which corresponds to overall factors

from lightest to darkest of  E1.6 and E2.2 in panels (c) and (d), for

example.

S.C. O’Connor, P.A. Robinson / Journal of Theoretical Biology 233 (2005) 271–286    281

8/10/2019 Thalamic Tumor

http://slidepdf.com/reader/full/thalamic-tumor 12/16

frequency fixed since there is no peak near this

frequency for the normal eyes-closed state. There is a

definite alpha peak, on the other hand, the frequency of 

which varies across the head (Markand, 1990; O’Connor

and Robinson, 2004c). To avoid introducing artifact

related to the differing alpha frequency across the head,

we show the power at the alpha peak frequency at eachpoint in Fig. 7(b), which was found to vary from E9 Hz

at the front of the head to E10 Hz at the back of the

head, in agreement with previous studies (Markand,

1990; O’Connor and Robinson, 2004c; Robinson et al.,

2003). Note that the plots at a single frequency do not

differ significantly from those at the (variable) peak

frequency, provided the width in frequency of the

spectral peak is larger than the change in peak frequency

across the head. However, for very narrow peaks, the

two-dimensional spatial plot at a single frequency can be

quite misleading if the peak moves from above to below

the chosen frequency as the scalp is traversed; in this

case it is more informative to plot the power at the

(variable) peak frequency instead.

A two-dimensional thalamic tumor with   s ¼  0:03 m

whose center maps to (X ,  Y )=(0.2, 0.2) m, where local

 yo0, was then superimposed on the normal background

non-uniformities. The results are shown in Figs. 7(c) and

(d), at 3 Hz, and the (differing) alpha frequency,

respectively.   Fig. 7(c)   shows that a theta peak is

introduced into the waking spectrum by the over-

inhibited state of the peritumoral region, as discussed

in Section 6. This theta peak is not centered above the

patch focus at (0.2, 0.2) m, indicated by the cross, but is

shifted slightly towards the back of the head by theunderlying ‘normal’ eyes-closed non-uniformities. Thus,

the EEG cannot necessarily be used directly to exactly

locate the tumor, where ‘direct’ localization assumes a

direct correspondence between the location of the peak

and the location of the underlying tumor.   Fig. 7(d)

shows the spatial distribution of power at the alpha

frequency. There is a general increase towards the back

of the head, as for normal eyes-closed EEG; however,

the alpha peak is attenuated due to the tumor near the

center of the head. These competing effects mean that

near the tumor the peak alpha power is at the sides of 

the head. Power at the alpha frequency would be of littledirect localizing value for the tumor, since the effects of 

the tumor are hidden somewhat by the significant

underlying variation of power at the alpha frequency.

The EEG would best be used in conjunction with fitting

to the model predictions, thereby enabling the tumor to

be localized. Thus we see that, in agreement with clinical

observations (Hess, 1975), the EEG alone is often of 

little localizing value, at least if used without the

deeper insights provided by modeling. Our results

indicate that activity at the theta frequency is of better

direct localizing value than activity at the alpha

frequency.

6. Discussion

We have successfully explained the range of EEG

features associated with thalamic tumors using a unified

framework. In a key advance, we have demonstrated via

modeling that the theta peak (sometimes known as a

delta peak) can be accounted for by an over-inhibitionof the peritumoral region of brain, due to a disruption of 

signal propagation through the corticothalamic path-

ways. This finding not only explains theta-peak genera-

tion in the presence of thalamic tumors, but can likely be

generalized to explain theta generation in other brain

disorders too, since the present results are not specifi-

cally dependent on properties of the tumor, such as

pathophysiology or malignancy, but on non-uniformi-

ties in corticothalamic gains. Furthermore, we have used

the same model to explain other qualitative features of 

thalamic tumor EEGs, including background peak

attenuation, background slowing of the alpha rhythm,

high-voltage bursts and the onset of unstable (probably

epileptiform) discharges, and spindle-frequency activity

during waking. The model is based closely on physiol-

ogy, and is thus able to provide insight into the

physiological mechanisms responsible for generating

these features. Note that each of the features can be

reproduced only by the parameter combinations dis-

cussed, enabling specific conclusions to be drawn from

these results. These conclusions and insights are

discussed in paragraphs (i)–(v) below. Much of the

attraction and power of the present approach lies in the

ability of the model to unify the above features into a

single framework. Furthermore, the same model hasbeen used successfully to explain a wide range of other

phenomena, and we can thus have confidence that the

model accurately represents activity in the brain.

(i) Background attenuation is the phenomenon where-

by at the focus of the tumor the usual waking eyes-

closed background peaks are diminished compared

to elsewhere on the cortex. These background peaks

are the slow-wave peak, which occurs below 1 Hz,

the alpha peak at around 7–12 Hz, and the beta

peak at around 15–25 Hz. In the context of the

model, these peaks are attenuated when either of the state parameters  x  or  y  is slightly reduced, since

this takes the part of the brain near the tumor

further from the slow-wave and alpha stability

boundaries. Hence, from the discussion in Section

2.1, there is less power at the slow-wave and alpha

frequencies in the region near the tumor. From Eqs.

(13) and (14), the parameters which most strongly

affect   x   and   y   are   G ee   or   G ei ,   G ese, and   G esre. The

corticothalamic gains  G ese  and  G esre   strongly affect

the amplitude of the background peaks, as seen in

Fig. 5, whereas the cortical gain has an effect which

is independent of frequency, as in   Fig. 4(b). This

ARTICLE IN PRESS

S.C. O’Connor, P.A. Robinson / Journal of Theoretical Biology 233 (2005) 271–286 282

8/10/2019 Thalamic Tumor

http://slidepdf.com/reader/full/thalamic-tumor 13/16

finding is consistent with a previous result which

showed that focal attenuation of background

rhythms is correlated with involvement of the

thalamus (Newmark et al., 1983).

(ii) Background ‘slowing’ is the phenomenon whereby

the peaks of the background rhythms are shifted to

lower frequencies. Published tumor data rarelyindicate the degree of slowing, although the shift

is generally small (Scarff and Rahm, 1941) and

related studies indicate that it is of order 1 Hz

(Schaffler et al., 1982). An effect of this magnitude

can be seen in the case of a focal reduction in |G esre|,

as in   Fig. 5(c).   A similar effect can be found by

simply decreasing the corticothalamic loop propa-

gation time   t0  by 10–20% at the tumor, since this

delay is the dominant factor in determining the

alpha frequency in the model. If the loop time is

decreased further, the background frequencies are

further reduced. Similarly, if there are tumor-

induced local reductions in  a  and  b;  which describe

the synaptodendritic dynamics, then the alpha peak

is similarly slightly slowed. Note that background

slowing is common in neurological diseases (Walc-

zak and Jayakar, 1997), and thus need not be due to

tumor-specific physiology, which is consistent with

the fact that it does not feature prominently in these

results, and is often not reported at all in published

work.

(iii) Epileptiform discharges and high-voltage bursts of 

activity are reported in 10–30% of patients with a

thalamic tumor (Cheek and Taveras, 1966;  Hirose

et al., 1975; Janati and Hester, 1986; O’Brien et al.,1997). As discussed in Section 2.1, high-voltage

activity occurs with proximity to the stability

boundaries indicated in   Fig. 2. Similarly, epilepti-

form discharges likely occur when a stability

boundary is crossed, and the frequency of the

activity depends on the boundary. Thus, from Eqs.

(13) and (14), activity of this type occurs when  G eseor   G ee   is increased, or when |G esre| o r |G ei | is

decreased; that is, when the excitatory activity is

increased, and the inhibitory activity is decreased.

Thus, when a thalamic tumor leads to a local over-

excitation of the thalamus, cortical excitability issimilarly upregulated, and high-voltage or epilepti-

form activity can ensue. Such an increase in

thalamic activity in the presence of a tumor is likely

related to ‘luxury perfusion’, or hyperemia, the

increase in peritumoral cerebral blood flow some-

times observed in the presence of a tumor (Hess,

1975). Indeed, tumor-induced epileptiform activity

is primarily due to low-grade tumors (O’Brien et al.,

1997), which are rarely associated with pathological

evidence of ischemia (O’Brien et al., 1997).

Furthermore, several studies have found that

cerebral tumors may induce local changes in

neurotransmitter levels, and that tumor-induced

epilepsy is associated with increased local concen-

trations of excitatory neurotransmitters, such as

glutamine (the precursor to glutamate), and de-

creased concentrations of inhibitory ones such as

gamma-aminobutyric acid, GABA (Haglund

et al., 1992; O’Brien et al., 1997; Recht and Glantz,1997).

(iv) The appearance of a theta peak near 3 Hz is a highly

typical signature of thalamic tumor. From   Figs. 2

and 4, theta activity occurs for negative values of 

the corticothalamic state parameter   y, which

effectively puts this portion of the brain into an

over-inhibited state, in which the inhibitory effect of 

the thalamic reticular neurons is stronger than the

excitatory effect of the thalamic relay neurons.

There is an increase in power near 3 Hz when G ese is

reduced; however, for the parameters near our

(physiologically realistic) nominal ones, this forms a

peak only when |G esre| increases simultaneously. On

the other hand, an increase in |G esre| alone is

sufficient to generate a theta peak. Physiologically,

both effects are likely to occur together, since

increased firing of the reticular neurons will inhibit

the relay neurons; a similar effect is observed during

sleep (Braun et al., 1997; Hofle et al., 1997; Maquet

et al., 1997). Thus, the present work indicates that

involvement of the corticothalamic feedback path-

ways is essential to produce pathological theta. This

result confirms previous studies which found that

rhythmic theta activity was related to thalamic

dysfunction (Daly et al., 1975;  Hirose et al., 1975),rather than an alternative proposal that irregular

theta activity might be related to deafferentation of 

the cortex (Gloor et al., 1977). Note that patholo-

gical theta is observed in a number of brain

disorders, such as attention-deficit hyperactivity

disorder (ADHD) which could also be investigated

using this model (Rowe and Robinson, 2004; Rowe

et al., 2004), and is likely caused by a similar

mechanism; for example, the stimulants which are

often used to treat ADHD may act by bringing the

affected patch of the brain out of its over-inhibited

state.(v) Peaks in the spindle frequency range, between the

alpha and beta frequencies, have been reported in

the presence of thalamic tumors (Hirose et al., 1975;

Janati and Hester, 1986), although the phenomenon

is rare. These peaks are often called ‘sleep spindles’

and are a typical feature of normal sleep, as is a

theta (or ‘delta’) enhancement (Steriade, 2000).

Indeed, the present work indicates that both a theta

peak and spindle-frequency activity can arise when

the tumor shifts the nearby brain to an over-

inhibited state, as discussed in the previous para-

graph. As discussed in conjunction with Fig. 6, the

ARTICLE IN PRESS

S.C. O’Connor, P.A. Robinson / Journal of Theoretical Biology 233 (2005) 271–286    283

8/10/2019 Thalamic Tumor

http://slidepdf.com/reader/full/thalamic-tumor 14/16

8/10/2019 Thalamic Tumor

http://slidepdf.com/reader/full/thalamic-tumor 15/16

of the tumor is not considered, since a study of gliomas

reported that EEG findings are unrelated to the

malignancy of the tumor (Newmark et al., 1983).

However, malignancy is associated with tumor growth

rate, and we have shown that size is related to EEG

abnormality. Thus, we confirm that an EEG recording

that becomes increasingly abnormal over time could beindicative of tumor malignancy (Hess, 1975).

In all cases shown in this work, the tumor was located

at (0.2, 0.2) m. We found that varying the position of the

tumor across the head does not affect the outcome; that

is, in the absence of underlying parameter non-

uniformities, the strongest effect is always at the tumor

center, with decreasing effect as distance from the center

increases. However, as shown in   Fig. 7, underlying

normal non-uniformities can shift the activity.   Fig. 7

shows an example in which the variation across the head

of activity at 3 Hz can help locate the thalamic tumor;

note, however, that the strongest activity at this

frequency does not occur directly over the tumor, but

is typically slightly shifted towards the back of the head

due to the underlying normal front-to-back parameter

non-uniformities. Activity at the alpha frequency,

however, from   Fig. 7(d), is of little localizing value, if 

we assume a direct correspondence between EEG peak

location and tumor location. This is consistent with

previous findings that the EEG is of localizing value in

40–50% of patients with a tumor of the thalamus

(Cheek and Taveras, 1966;   Hirose et al., 1975), with

some EEGs providing false localizing signs. The total

contrast in   Fig. 7   indicates that the highest power is

approximately twice that of the lowest power at thefrequencies investigated, so the topographical variations

should be reasonably easily detected. We have not yet

investigated side-to-side (mediolateral) non-uniformities

in normal brains; such non-uniformities might also shift

the peaks from the tumor focus, and thus further

contribute to the false localizations. However, using our

model, tumors could be better localized by improving

the inversion process to account for the underlying

background parameter non-uniformities, as well as

fitting the model to determine the parameter non-

uniformities due to the tumor.

Tumors are electrically inactive (Scarff and Rahm,1941), and so they can be modeled by investigating their

influence on signal transmission through various path-

ways in the peritumoral tissue; the morphology of the

thalamic tumors themselves is not important. The model

can reproduce a wide range of EEG features associated

with thalamic tumors, and the present work indicates

that different EEG features are due primarily to

variations in the pathophysiology of the tumor, in

particular whether it results in an excess or deficit of 

blood supply, and its size; it was confirmed that

increasing the size of the tumor led to greater

abnormalities in the observable EEG.

The results of the present study indicate that the

abnormal theta and spindle-frequency peaks near 3 and

12 Hz, respectively, are due to a local over-inhibition

resulting from increased activity of the inhibitory

reticular thalamic neurons in the peritumoral tissue.

This is likely accompanied by a decrease in the

excitability of thalamic relay neurons, and an overallreduction in thalamic blood flow near the tumor. Brain

tumors have been shown to induce changes in local

neurotransmitter balance and synaptic receptors: we

postulate that these tumors induce a reduction in the

responsiveness of the peritumoral neurons to cholinergic

input from the brainstem, and a corresponding depolar-

ization of thalamic reticular neurons, and hyperpolar-

ization of thalamic relay neurons, similar to the

mechanism active during sleep. That is, a small portion

of the brain is forced into an over-inhibited sleep-like

state due to the tumor. Involvement of the thalamus is

essential to generate these abnormal spectral peaks. This

is the opposite mechanism to that which produces high-

voltage and epileptiform activity, which we propose are

associated with a local over-excitation due to increased

activity of thalamic relay neurons and decreased activity

of reticular ones. This over-excitation propagates to the

cortex, and is likely related to a luxury perfusion of 

blood, rather than a deficit, and may be related to

increased sensitivity to cholinergic inputs. This conclu-

sion is consistent with findings that epileptiform activity

is uncorrelated with theta activity in the presence of 

tumors (Newmark et al., 1983; O’Brien et al., 1997).

Acknowledgements

The authors thank C.R. Rennie for helpful comments.

This work was supported by the Australian Research

Council, an Australian Postgraduate Award, and a

Westmead Millenium Foundation Stipend Enhance-

ment Award.

References

Braun, A.R., Balkin, T.J., Wesensten, N.J., Carson, R.E., Varga, M.,Baldwin, P., Selbie, S., Belenky, G., Herscovitch, P., 1997.

Regional cerebral blood flow throughout the sleep-wake cycle.

An H152  O PET study. Brain 120, 1173–1197.

Cheek, W.R., Taveras, J.M., 1966. Thalamic tumors. J. Neurosurg. 24,

505–513.

Coenen, A.M.L., 1995. Neuronal activities underlying the electro-

encephalogram and evoked potentials of sleeping and waking:

implications for information processing. Neurosci. Biobehav. Rev.

19, 447–463.

Daly, D.D., Goldensohn, E.S., Hess, R., 1975. Genesis of abnormal

activity. In: Hess, R. (Ed.), Handbook of Electroencephalography

and Clinical Neurophysiology. Elsevier, Amsterdam.

Gibbs, F.A., Gibbs, E.L., 1964. Atlas of Electroencephalography, vol.

3. Addison-Wesley, Reading, MA.

ARTICLE IN PRESS

S.C. O’Connor, P.A. Robinson / Journal of Theoretical Biology 233 (2005) 271–286    285

8/10/2019 Thalamic Tumor

http://slidepdf.com/reader/full/thalamic-tumor 16/16

Gloor, P., Ball, G., Schaul, N., 1977. Brain lesions produced delta

waves in the EEG. Neurology 27, 326–333.

Haglund, M.M., Berger, M.S., Kunkel, D.D., Franck, J.E., Ghatan,

S., Ojemann, G.A., 1992. Changes in gamma-aminobutyric acid

and somatostatin in epileptic cortex associated with low-grade

gliomas. J. Neurosurg. 77, 209–216.

Hess, R. (Ed.), 1975. Handbook of Electroencephalography and

Clinical Neurophysiology 14C: Brain Tumors and other SpaceOccupying Processes. Elsevier, Amsterdam.

Hirose, G., Lombroso, C.T., Eisenberg, H., 1975. Thalamic tumours in

childhood. Arch. Neurol. 32, 740–744.

Hirsch, J.F., Buisson-Ferey, J., Sachs, M., Hirsch, J.C., Scherrer, H.,

1966. Electrocortogramme et activite ´ s unitaires lors de processus

expansifs chez l’homme. Electroencephal. Clin. Neurophys. 21,

417–428.

Hofle, N., Paus, T., Reutens, D., Fiset, P., Gotman, J., Evans, A.C.,

Jones, B.E., 1997. Regional cerebral blood flow changes as a

function of delta and spindle activity during slow wave sleep in

humans. J. Neurosci. 17, 4800–4808.

Janati, A., Hester, R.L., 1986. Spindle activity in the waking

electroencephalogram: report of a case with hemispheric glioblas-

toma. Clin. Electroencephal. 17, 1–5.

Jueptner, M., Weiller, C., 1995. Review: does measurement of regionalcerebral blood flow reflect synaptic activity?—implications for PET

and fMRI. Neuroimage 2, 148–156.

Kanno, O., Hosaka, H., Yamaguchi, T., 1977. Dissociation of sleep

stages between the two hemispheres in a case with unilateral

thalamic tumor. Folia Psychiatr. Neurol. 31, 69–75.

Kiefer, J.C., Baghdoyan, H.A., Becker, L., Lydic, R., 1994. Halothane

decreases pontine acetylcholine release and increases EEG spindles.

Neuroreport 5, 577–580.

Maquet, P., Degueldre, C., Delfiore, G., Aerts, J., Pe ´ ters, J.-M.,

Luxen, A., Franck, G., 1997. Functional neuroanatomy of slow

wave sleep. J. Neurosci. 17, 2807–2812.

Markand, O.N., 1990. Alpha rhythms. Clin. Neurophys. 7, 163–189.

Newmark, M.E., Theodore, W.H., Sato, S., De La Paz, R., Patronas,

N., Brooks, R., Jabbari, B., Di Chiro, G., 1983. EEG, transmission

computed tomography, and positron emission tomography withfluorodeoxyglucose   18F : their use in adults with gliomas. Arch.

Neurol. 40, 607–610.

Nunez, P.L., 1981. Electric Fields of the Brain: The Neurophysics of 

EEG. Oxford, New York.

Nunez, P.L., 1995. Neocortical Dynamics and Human EEG Rhythms.

New York, Oxford.

O’Brien, T.J., Kazami, N.J., Cascino, G.D., 1997. Localization-related

epilepsies due to specific lesions. In: Engel, J., Pedley, T.A. (Eds.),

Epilepsy: A Comprehensive Textbook, vol. III. Lippincott-Raven,

PA, pp. 2433–2446.

O’Connor, S.C., Robinson, P.A., 2003. Wave-number spectrum of 

electrocorticographic signals. Phys. Rev. E 67, 051912.

O’Connor, S.C., Robinson, P.A., 2004a. Wavenumber spectra of the

EEG, ECoG, and ERP. Neurocomputing 58-60C, 1181–1186.

O’Connor, S.C., Robinson, P.A., 2004b. Unifying and interpreting thespectral wavenumber content of EEGs, ECoGs, and ERPs. J.

Theor. Biol. 231/3, 397–412.

O’Connor, S.C., Robinson, P.A., 2004c. Spatially uniform and

nonuniform analyses of EEG dynamics, with application to the

topography of the alpha rhythm. Phys. Rev. E 70, 011911.

O’Connor, S.C., Robinson, P.A., Chiang, A.K.I., 2002. Wave-number

spectrum of electroencephalographic signals. Phys. Rev. E 66,

061905.

Recht, L.D., Glantz, M., 1997. Neoplastic diseases. In: Engel, J.,

Pedley, T.A. (Eds.), Epilepsy: A Comprehensive Textbook, vol. III.Lippincott-Raven, PA, pp. 2579–2585.

Rennie, C.J., Robinson, P.A., Wright, J.J., 1999. Effects of local

feedback on dispersion of electrical waves in the cerebral cortex.

Phys. Rev. E 59, 3320–3329.

Rennie, C.J., Robinson, P.A., Wright, J.J., 2002. Unified neurophy-

sical model of EEG spectra and evoked potentials. Biol. Cybernet.

86, 457–471.

Robinson, P.A., 2003. Neurophysical theory of coherence and

correlations of electroencephalographic and electrocorticographic

signals. J. Theor. Biol. 222, 163–175.

Robinson, P.A., Rennie, C.J., Wright, J.J., Bahramali, H., Gordon, E.,

Rowe, D.L., 2001a. Prediction of electroencephalographic spectra

from neurophysiology. Phys. Rev. E 63, 021903.

Robinson, P.A., Loxley, P.N., O’Connor, S.C., Rennie, C.J., 2001b.

Modal analysis of corticothalamic dynamics, electroencephalo-graphic spectra, and evoked potentials. Phys. Rev. E 63, 041909.

Robinson, P.A., Rennie, C.J., Rowe, D.L., 2002. Dynamics of large-

scale brain activity in normal arousal states and epileptic seizure.

Phys. Rev. E 65, 041924.

Robinson, P.A., Whitehouse, R.W., Rennie, C.J., 2003. Nonuniform

corticothalamic continuum model of electroencephalographic

spectra with application to split alpha peaks. Phys. Rev. E 68,

021922.

Robinson, P.A., Rennie, C.J., Rowe, D.L., O’Connor, S.C., 2004.

Estimation of neurophysiological parameters on multiple spatial

and temporal scales by EEG means: consistency and complemen-

tarity vs independent measures. Hum. Brain Mapp. 23, 53–72.

Rowe, D.L., Robinson, P.A., 2004. Stimulant drug action in attention

deficit hyperactivity disorder (ADHD): inference of neurophysio-

logical mechanisms via quantitative modelling. Clin. Neurophy-siol., submitted for publication.

Rowe, D.L., Robinson, P.A., Lazzaro, I., Williams, L.M., 2004.

Biophysical modelling of tonic measures of cortical activity (EEG)

in Attention Deficit Hyperactivity Disorder (ADHD). Int. J.

Neurosci., submitted for publication.

Scarff, J.E., Rahm Jr., W.E., 1941. The human electro-corticogram: a

report of spontaneous electrical potentials obtained from the

exposed human brain. J. Neurophysiol. 4, 418–426.

Schaffler, L., Imbach, P., Rudeberg, A., Vassella, F., Karbowski, K.,

1982. Conventional and spectral EEG analysis in children

treated with cytotoxic agents. Eur. J. Cancer Clin. Oncol. 18,

827–832.

Steriade, M., 2000. Corticothalamic resonance, states of vigilance, and

mentation. Neuroscience 101, 243–276.

Walczak, T.S., Jayakar, P., 1997. Interictal EEG. In: Engel, J., Pedley,T.A. (Eds.), Epilepsy: A Comprehensive Textbook, vol. 1.

Lippincott-Raven, PA, pp. 831–848.

ARTICLE IN PRESS

S.C. O’Connor, P.A. Robinson / Journal of Theoretical Biology 233 (2005) 271–286 286


Recommended