308 VOLUME 19 | NUMBER 2 | FEBRUARY 2016 nature neurOSCIenCe
a r t I C l e S
In the conventional pathway of mammalian early vision, information from the retina is conveyed by the dorsal lateral geniculate nucleus (dLGN) of the thalamus to L4 of V1 and, after computations in the cortical circuit, is communicated to the rest of the brain1 (that is, mainly dLGN→ L4→ L2/3→L5→). Since the discovery of orienta-tion selectivity in V1 neurons2, how the mammalian nervous system computes the orientation of visual stimuli has been a flagship question in neuroscience.
Providing the principal thalamic inputs to V1 (Supplementary Fig. 1)3, dLGN has long been thought to convey only untuned inputs to cortex. Orientation selectivity is therefore considered to be a feature computed in cortex, beginning at the first stage of thalamocorti-cal interaction4–6. In the classical feedforward model of Hubel and Wiesel7, cortical orientation selectivity is generated by the conver-gence of untuned dLGN inputs with offset receptive fields onto a L4 simple cell. Although such an arrangement has not been directly observed, existing experimental evidence is consistent with its basic premise that thalamic inputs to the main thalamorecipient L4 lack orientation tuning8.
In mouse, some dLGN neurons encode information about the orientation and/or direction of moving stimuli9–12. This is not sur-prising, given the prevalence of direction-selective ganglion cells in mouse retina13. But do the tuned thalamic neurons send their axons to the main thalamorecipient L4 of V1, where they may contribute to the cortical representation of orientation? A recent report14 suggests that mouse dLGN provides tuned inputs to L1, but not L4, upholding the longstanding belief that orientation and direction selectivity in the bulk of V1 neurons arise predominantly from the convergence of untuned thalamic inputs15.
We used the calcium indicator GCaMP6s16 and in vivo functional calcium imaging to measure the orientation and motion direction tuning properties of ~28,000 thalamic boutons, as well as ~1,200 L4,
~1,300 L2/3 and ~1,600 L5 neurons in V1 of head-fixed awake mice. We found that large proportions of thalamic inputs to cortical layers 1–4 were tuned and, on the population level, had strong biases toward specific orientations and directions. These biases overlapped with the biases observed in V1’s L4 population, although cortical neurons had overall sharper tuning and a greater diversity of preferred orientations and directions than thalamic boutons. Our results contradict the long-standing belief that thalamus only provides untuned representations to L4 of V1 and imply that at least some of the orientation and direc-tion tuning observed in V1 is inherited from thalamic inputs that are individually tuned for orientation and motion direction.
RESULTSIn vivo imaging of thalamic boutons in V1 of awake miceTo characterize the orientation tuning properties of thalamocortical afferents in V1, we transfected dLGN neurons in wild-type mice with the calcium indicator GCaMP6s and measured changes in two-photon fluorescence of the GCaMP6s+ axons in V1 when visual stimuli were presented to the contralateral eye (Fig. 1a,b). Because thalamic axons ramify not only in L4, but also in the supragranular layers (L1 and L2/3)17 (Fig. 1c and Supplementary Fig. 2), we imaged axons ranging from 0 to 400 µm below pia (Fig. 1d–f). We habituated awake mice to head fixation to minimize movement during imaging; residual motion was corrected by an iterative cross-correlation–based registration algorithm18 (Online Methods and Supplementary Fig. 3). During presentation of square gratings drifting in one of eight directions (presented in a pseudorandom sequence), individual micron-sized varicosities along the axonal arborizations exhibited local visually evoked increases in fluorescence (Supplementary Videos 1 and 2), indicating that they were putative presynaptic boutons19–21. Of 34,120 boutons (21 mice) chosen for analysis, ~90% were determined to be from distinct cells through correlation coefficient analysis20
Janelia Research Campus, Howard Hughes Medical Institute, Ashburn, Virginia, USA. Correspondence should be addressed to N.J. ([email protected]).
Received 19 July; accepted 6 November; published online 21 December 2015; doi:10.1038/nn.4196
Thalamus provides layer 4 of primary visual cortex with orientation- and direction-tuned inputsWenzhi Sun, Zhongchao Tan, Brett D Mensh & Na Ji
Understanding the functions of a brain region requires knowing the neural representations of its myriad inputs, local neurons and outputs. Primary visual cortex (V1) has long been thought to compute visual orientation from untuned thalamic inputs, but very few thalamic inputs have been measured in any mammal. We determined the response properties of ~28,000 thalamic boutons and ~4,000 cortical neurons in layers 1–5 of awake mouse V1. Using adaptive optics that allows accurate measurement of bouton activity deep in cortex, we found that around half of the boutons in the main thalamorecipient L4 carried orientation-tuned information and that their orientation and direction biases were also dominant in the L4 neuron population, suggesting that these neurons may inherit their selectivity from tuned thalamic inputs. Cortical neurons in all layers exhibited sharper tuning than thalamic boutons and a greater diversity of preferred orientations. Our results provide data-rich constraints for refining mechanistic models of cortical computation.
nature neurOSCIenCe VOLUME 19 | NUMBER 2 | FEBRUARY 2016 309
a r t I C l e S
(Supplementary Fig. 4). We classified the visually responsive boutons (those with ∆F/F >10%) according to their orientation selectivity to drifting-grating stimuli (Fig. 1g–i). For each bouton that had a sig-nificant response-anisotropy by ANOVA (P < 0.05), we calculated its orientation tuning curve from its averaged calcium transient (∆F/F; Fig. 1j–l) across ten sets of trials (Fig. 1m–o). Only boutons whose tuning curves were well-fit by a bimodal Gaussian function22 (Online Methods) were considered to be orientation selective (OS).
Tuning curves of boutons are sensitive to the optical aberrations caused by the differences in refractive indices between the immersion medium (for example, water) and the cranial window and/or brain tissue23 (Fig. 2a). These refractive-index differences distort the wavefront of the laser used for two-photon excitation and leads to the degradation of image resolution by enlarged focal volume and the loss of signal via reduced focal intensity (Fig. 2b). The consequent deterio-ration of image quality is particularly severe for smaller structures (for example, boutons) and larger aberration (for example, thick cranial window). With a 340-µm-thick cranial window, 70% of all boutons (n = 1,056, 3 mice) appeared to be non-responsive to visual stimuli and only 7% satisfied OS criteria. With a thinner cranial window of 170-µm thickness, we found that 31% of boutons satisfied OS criteria (of total n = 1,302, 5 mice), which was still substantially fewer than 48% OS boutons as determined when the same boutons (n = 1,477, 5 mice) were imaged after aberration correction by adaptive optics (AO; Fig. 2c). These discrepancies can be understood by compar-ing the calcium transients of individual boutons: aberration reduced calcium transient magnitude from boutons of interest (Fig. 2d), but increased contamination from other active boutons in the enlarged
focus, and can therefore artifactually reduce tuning and cause shifts of preferred orientations24,25 (Fig. 2e). These artifacts were also observed on the population level, as indicated by the distributions of global orientation-selectivity index (without AO, median = 0.21; with AO, median = 0.26; see below for definition; Fig. 2f) and preferred orientation (Fig. 2g; same 170-µm window data as in Fig. 2c). Thus, to accurately characterize the response properties of the thalamic boutons, we used adaptive optics to remove cranial-window aberra-tions for all experiments.
Across all depths, we observed an approximately equal mix of non-orientation–selective (48%, n = 13,424, 21 mice; for example, top three traces in Fig. 1j–l) and OS (52%, n = 14,478, 21 mice; for example, bottom six traces in Fig. 1j–l) boutons. The observation that both the supragranular and granular afferents carry orientation-tuned infor-mation contradicts the prevailing view that L4 geniculate inputs are not orientation tuned.
In vivo imaging of cortical neurons in V1 of awake miceTo delineate the progression of neural representations of orientation and direction in V1, we followed the canonical circuit L4→L2/3→L5 and selectively labeled the excitatory neurons in L4 (Scnn1a-Tg3-Cre)26, L2/3 (Thy1-GCaMP6 GP4.3)27 and L5 (Rbp4-Cre)21 of V1 with GCaMP6s. We characterized the tuning properties of these neurons by measuring their somatic calcium responses to drifting gratings in head-fixed awake mice (Fig. 3). Using the same criteria as for boutons, we found that 83% of visually responsive L4 (n = 1,239, 3 mice), 83% of responsive L2/3 (n = 1,279, 6 mice) and 60% of responsive L5 (n = 1,637, 5 mice) neurons were OS.
d g
e
f
h
i
j
k
l
m
n
o
200 µm
350 µm
40 µm
∆F/F
a
b
c
dLGNV1
AAV GCaMP6
Not OS
100%
Figure 1 In vivo calcium imaging of thalamic axons in V1. (a) In vivo imaging of GCaMP6s+ thalamic axons in V1 of head-fixed awake mouse. (b) GCaMP6s+ neurons (green) in dLGN outlined by retinal ganglion cell axons (red). Scale bar represents 100 µm. (c) GCaMP6s+ axons in V1. Scale bar represents 50 µm. (d–f) In vivo images of GCaMP6s+ thalamic axons at 40 µm (d), 200 µm (e) and 350 µm (f) below pia in V1. Scale bar represents 10 µm. (g–i) Varicosities (putative boutons) from d–f color-coded by their preferred orientation. Gray indicates boutons with visual response, but no orientation selectivity (OS). (j–l) Example ∆F/F calcium transients (ten trial average) for boutons from d–f. (m–o) Tuning curves for the bottom six boutons in j–l. Dark gray shadow (j–l) and error bars (m–o) represent s.e.m. Representative images from 21 mice are shown.
310 VOLUME 19 | NUMBER 2 | FEBRUARY 2016 nature neurOSCIenCe
a r t I C l e S
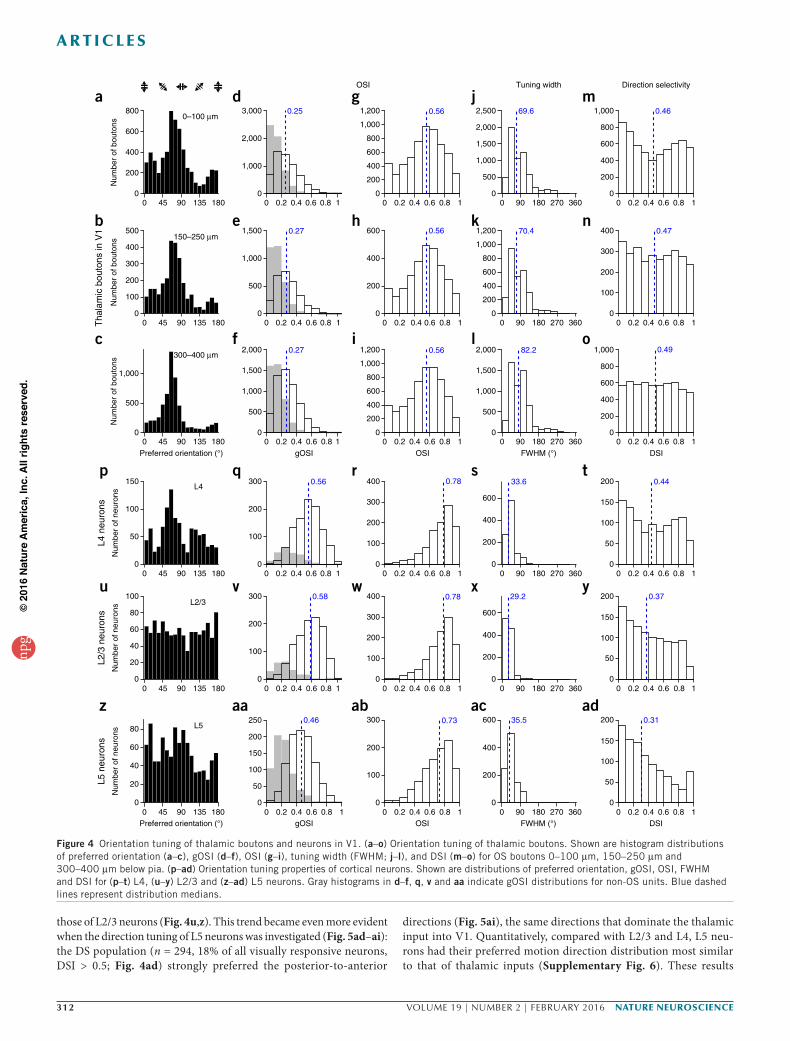
Orientation tuning of thalamic boutons in V1We separately characterized the orientation tuning properties of thalamic boutons in L1 (depth below pia: 0–100 µm, n = 11,697, 19 mice, 50% OS), L2/3 (150–250 µm, n = 6,076, 17 mice, 47% OS) and L4 (300–400 µm, n = 10,129, 14 mice, 55% OS) of V1 (Fig. 4 and Online Methods). Although the full range of preferred ori-entation angles were observed, tuned inputs to L1 through L4 were strongly biased toward the vertical orientation. In the more superficial laminae, especially L1, we also observed a sizable frac-tion of boutons preferring the horizontal orientation (Fig. 4a–c). This pattern of anisotropy is consistent with the view that the orientation selectivity in dLGN neurons originates from dLGN- projecting direction-selective retinal ganglion cells12, which prefer the cardinal directions13.
We quantified orientation selectivity of each bouton two ways to enhance inferential robustness when comparing across populations. The global orientation-selectivity index (gOSI), defined as
R e
Rk
i kk
kk
( )
( )
q
q
q2∑∑
with R(θ) being the measured response at orientation θ (ref. 28), yielded median values of 0.25–0.27 for OS boutons (Fig. 4d–f). As expected, for visually responsive boutons that had been classi-fied as non-selective (by the method described above), gOSIs were
lower (medians 0.12–0.13; Fig. 4d–f). Another orientation-selectivity index (OSI), defined as
R R
R Rpref ortho
pref ortho
−+
with Rpref and Rortho being the responses at the preferred and orthogo-nal orientations, respectively, yielded median values of 0.56 (Fig. 4g–i) across the OS bouton population in all three depth strata. Another measure of tuning-curve sharpness, full-width at half-maximum (FWHM), had medians of ~70° for axons in L1 and L2/3 and ~82° for axons in L4 (Fig. 4j–l).
Direction tuning of thalamic boutons in V1Some of the orientation-tuned boutons also showed differential responses to the two motion directions for drifting gratings of their preferred ori-entation (for example, bottom three traces in Fig. 1j–l). To characterize the preferred motion direction of the thalamic inputs, we calculated the direction-selectivity index (DSI) for each OS bouton defined as
R R
R Rpref oppo
pref oppo
−+
where Rpref and Roppo are the responses at the preferred motion direc-tion and its opposite, respectively. Using this index, we classified the
d2
4
3
1
No AO
AO
5
Calcium transiente
2
0 500 1,000
0100200300400
∆F/F
(%
)
0 90 180 270 360
0
50
100
4
0 500 1,000
0
200
400
600
∆F/F
(%
)0 90 180 270 360
0
20
40
60
80
Tuning curve
3
0 500 1,000
0
100
200
300
∆F/F
(%
)
0 90 180 270 360
0
50
100
150
200 No AOAO
0
100
2001
0 500 1,000
∆F/F
(%
)
0 90 180 270 360
0
25
50
Frame (number)
0 500 1,000
0
∆F/F
(%
)
500
1,000
5
0 90 180 270 360
0
20
40
60
Orientation (°) Preferred orientation (°)
0 45 90 135 180
Num
ber
of b
outo
ns
0
50
100
150
2000 45 90 135 180
Num
ber
of b
outo
ns
0
10
20
30
40
50
60
70ggOSI
0 0.5 1
Cum
ulat
ive
perc
enta
ge
0
0.2
0.4
0.6
0.8
1f
0.25 0.75
No AOAO
No AO
AO
Objective
Light cone
Skull
Cranial window
Water
Brain
a
170-µm windowwith correction
170-µm windoww/o correction
340-µm windoww/o correction
b
2×4×
NOS
Per
cent
age
of b
outo
ns
0
20
40
60
80
100
OS
NR
c
170-µm windowwith correction
170-µm windoww/o correction
340-µm windoww/o correction
Figure 2 Adaptive optics is essential for tuning curve characterization. (a) Excitation light aberrated by refractive index differences between water and cranial window or brain. (b) Axial images of a 2-µm bead below a 340-µm window, a 170-µm window or a 170-µm window with adaptive optics (AO) correction. Images taken without AO have 4× and 2× gain for better visibility. Scale bar represents 2 µm. (c) Percentages of non-responsive (NR), not OS (NOS) and OS boutons at 300–350-µm depth under the conditions in b. (d) Images of GCaMP6s+ axons at 170-µm depth measured without and with AO. Images are saturated to improve visibility of dim features. Scale bar represents 10 µm. (e) Calcium transients and tuning curves for ROIs labeled in d measured without (red) and with (black) AO. Error bars represent s.e.m. (f) Cumulative distributions of gOSI for boutons at 300–350-µm depth measured without and with AO. (g) Their preferred orientation distributions measured without and with AO. Data in f and g are the same as in c, boutons imaged under 170-µm window without and with AO correction and analyzed with independent ROI selections. Cranial window thickness in d–g is 170 µm. Numeric aperture of the microscope objective is 1.05.
nature neurOSCIenCe VOLUME 19 | NUMBER 2 | FEBRUARY 2016 311
a r t I C l e S
OS boutons into two populations: those with DSI < 0.5 were defined as being axis selective (AS; equivalent to OS but not motion-direction selective; Fig. 5a), and those with DSI > 0.5 (threefold or stronger response to gratings drifting in the preferred direction than its opposite) were defined as being direction selective (DS; Fig. 5b). With this criterion, across all depths, around half of the orientation-tuned thalamic inputs were AS and half were DS (median DSIs of boutons were 0.46–0.49 across cortical depths; Fig. 4m–o).
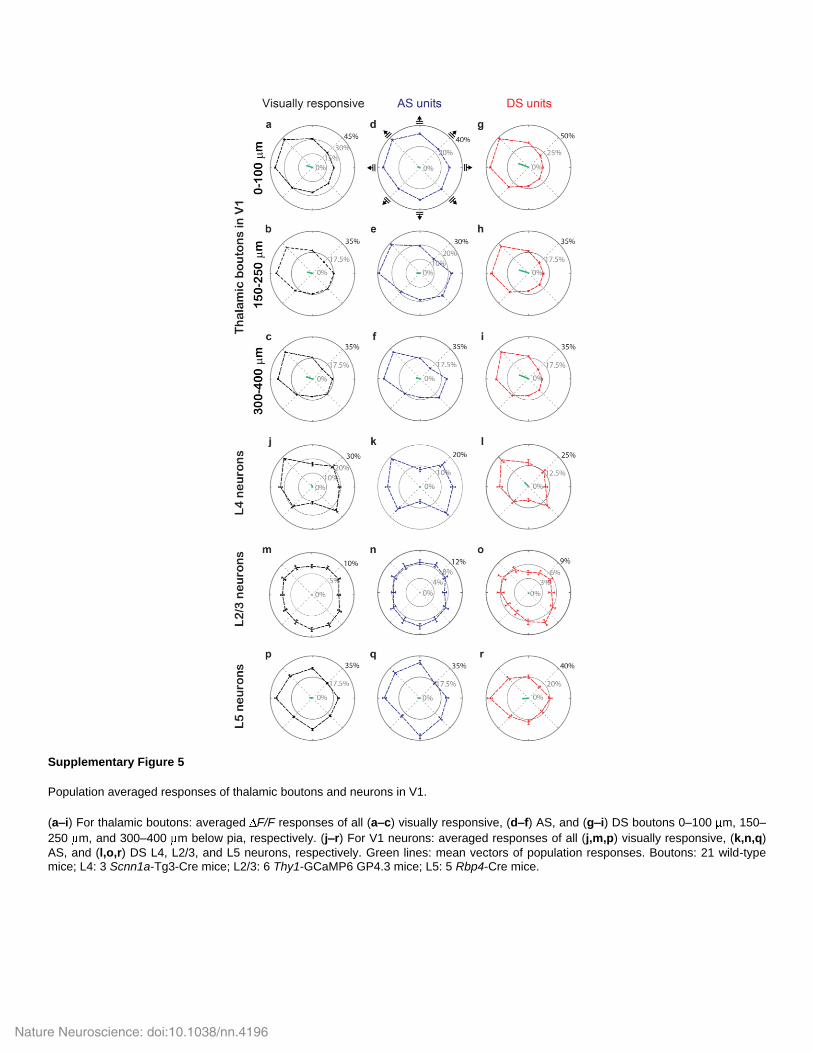
For both AS and DS boutons, their respective gOSI and OSI distributions were similar across depths (Fig. 5c–h). DS boutons had a larger proportion of units with very broad orientation tuning (FWHM > 120°; Fig. 5i–k), yet high direction selectivity. We found that the population of AS inputs to L1 selected for both horizontally and vertically moving gratings (Fig. 5l), but with increasing projection depth, the vertical motion bias faded away; AS inputs at L4 over-whelmingly preferred near-horizontal movement (Fig. 5m,n). The DS inputs across L1 through L4 strongly and consistently preferred the posterior-to-anterior motion direction (Fig. 5o–q). This direction bias can even be seen from the population responses of thalamic boutons, calculated by averaging the calcium transients of all responsive boutons, with their mean vectors aligned along the posterior-to- anterior direction at all layers (Supplementary Fig. 5).
Orientation and direction tuning of L4 neurons in V1Geniculate afferents densely form synapses with neurons in the prin-cipal thalamorecipient L4. We therefore asked whether L4 neurons share the orientation and direction biases of the thalamic inputs. Compared with their thalamic inputs, neurons in L4 were more OS (median gOSI = 0.56, median OSI = 0.78; Fig. 4q,r), with correspond-ingly narrower tuning widths (median FWHM = 33.6°; Fig. 4s)9. The near-vertical orientations that dominated the preferred-orientation distribution of the thalamic inputs were also the most prominent orientation preference of OS L4 neurons (Fig. 4p).
Furthermore, after dividing the OS L4 neurons into AS (n = 571, 46% of all visually responsive neurons) and DS (n = 452, 37% of all visually responsive neurons) populations using the same DSI criterion (Figs. 4t and 5r–u), we found that the biases in the pre-ferred motion axis and direction distributions of the thalamic inputs persisted in L4 neurons. The horizontal motion axis, which domi-nated the AS thalamic inputs, also featured prominently in the AS L4 neurons (Fig. 5v). Although a much more diverse set of direc-tions were preferred by DS L4 neurons, the posterior-to-anterior motion direction strongly favored by the DS thalamic inputs was still represented prominently (Fig. 5w). These observations sug-gest that the OS and DS thalamic inputs contribute to the tuning in L4 neurons. At the same time, evidence also exists for de novo generation of orientation and direction selectivities. Although the anteroinferior-posterosuperior motion axis was preferred by few thalamic boutons (Fig. 5n), it was represented more prominently in the motion-axis distribution of AS L4 neurons (Fig. 5v). Many L4 neurons selected for motion directions that were absent from the inputs (Fig. 5w).
Orientation and direction tuning of L2/3 neurons in V1In the canonical cortical circuit, the major projection of L4 neurons is to L2/3 neurons. We observed that the OS population of L2/3 excita-tory neurons were slightly more tuned (median gOSI = 0.58, median OSI = 0.78, median FWHM = 29.2°; Fig. 4v–x) than L4 neurons. However, compared with thalamic boutons and L4 neurons, the pre-ferred orientations of the L2/3 population were much more evenly dis-tributed (Fig. 4u). More uniform distributions were also observed for the preferred motion axis and direction of the AS (n = 656, 52% of all visually responsive neurons, DSI < 0.5; Fig. 4y) and DS (n = 401, 31% of all visually responsive neurons, DSI > 0.5; Fig. 4y) L2/3 neurons (Fig. 5x–aa), respectively, with neither the horizontal motion axis nor the posterior-to-anterior motion direction dominating the distribu-tions (Fig. 5ab,ac). The observed sharper tuning in L2/3 means less overlap in their representations for different orientations. This feature, along with the near-uniform distribution of preferred orientations, is consistent with the hypothesis that L2/3 principal cells adopt a sparse coding strategy, where a visual stimulus of a particular orientation only elicits responses from a small subset of L2/3 neurons29.
Orientation and direction tuning of L5 neurons in V1We next characterized the response properties of the main cortical out-put layer, L5. Compared with L4 and L2/3 neurons, in addition to having a smaller percentage of OS neurons (60% versus 83% in L4 and L2/3), L5 neurons also had substantially lower OSI and broader tuning width (median gOSI = 0.46, median OSI = 0.73, median FWHM = 35.5°), although they were still more sharply tuned than the thalamic inputs (Fig. 4aa–ac). Compared with L2/3 neurons, we found that the pre-ferred orientations of L5 neurons were not as evenly distributed as
1
2
3
4
5
6
7
8
∆F/F
b c
50%
1
2
3
4
5
6
7
8 100%
ih
∆F/F
100%
1
2
3
4
5
6
7
8
∆F/F
fe
1
2
3
4
5
6
7
8
a
370 µm
L4
12
3
56
7
8
4
g
455 µm
L5
12
3
4
5
67
8
dL2/3
180 µm
Figure 3 Characterization of tuning properties of L4, L2/3 and L5 neurons in V1. (a) An example in vivo image of L4 neurons. Numbers label example somata. (b,c) Calcium transients ∆F/F (b) and tuning curves (c) of the somata in a. Light gray background in b indicates 6-s drifting grating (topmost labels) presentation. Dark gray shade in b and error bars in c represent s.e.m. (d–i) Example in vivo images, calcium transients and tuning curves of L2/3 (d–f) and L5 neurons (g–i). Scale bars represent 25 µm. Representative results from three Scnn1a-Tg3-Cre (L4), six Thy1-GCaMP6 GP4.3 (L2/3) and five Rbp4-Cre (L5) mice.
312 VOLUME 19 | NUMBER 2 | FEBRUARY 2016 nature neurOSCIenCe
a r t I C l e S
those of L2/3 neurons (Fig. 4u,z). This trend became even more evident when the direction tuning of L5 neurons was investigated (Fig. 5ad–ai): the DS population (n = 294, 18% of all visually responsive neurons, DSI > 0.5; Fig. 4ad) strongly preferred the posterior-to-anterior
directions (Fig. 5ai), the same directions that dominate the thalamic input into V1. Quantitatively, compared with L2/3 and L4, L5 neu-rons had their preferred motion direction distribution most similar to that of thalamic inputs (Supplementary Fig. 6). These results
Figure 4 Orientation tuning of thalamic boutons and neurons in V1. (a–o) Orientation tuning of thalamic boutons. Shown are histogram distributions of preferred orientation (a–c), gOSI (d–f), OSI (g–i), tuning width (FWHM; j–l), and DSI (m–o) for OS boutons 0–100 µm, 150–250 µm and 300–400 µm below pia. (p–ad) Orientation tuning properties of cortical neurons. Shown are distributions of preferred orientation, gOSI, OSI, FWHM and DSI for (p–t) L4, (u–y) L2/3 and (z–ad) L5 neurons. Gray histograms in d–f, q, v and aa indicate gOSI distributions for non-OS units. Blue dashed lines represent distribution medians.
nature neurOSCIenCe VOLUME 19 | NUMBER 2 | FEBRUARY 2016 313
a r t I C l e S
are consistent with the notion that there are direct synaptic connec-tions between thalamic afferents and L5 neurons in mouse V1, in agreement with previous electrophysiological studies30–36, where
inputs from primary thalamic nuclei were found to drive L5 neurons of the corresponding primary sensory cortex monosynaptically. They also support the emerging view that L5 neurons integrate thalamic
00
0.2 0.4 0.6 0.8 1
200
400
600
800
fT
hala
mic
bou
tons
in V
1
DSI = 0.13gOSI = 0.46
DSI = 0.06gOSI = 0.46
DSI = 0.15gOSI = 0.68
DSI = 0.08gOSI = 0.70
DSI = 0.08gOSI = 0.44
DSI = 0.15gOSI = 0.32
aAS
DSI = 0.91gOSI = 0.22
DSI = 0.69gOSI = 0.43
DSI = 0.82gOSI = 0.37
DSI = 0.93gOSI = 0.27
DSI = 0.98gOSI = 0.07
b
A P
S
I
DSI = 0.72gOSI = 0.09
DS
0 90 180 270 3600
500
1,000
i o
400
200
0
600
l
Num
ber
of b
outo
ns
c1,200
0 0.2 0.4 0.6 0.8 10
200
400
600
800
1,0000–100 µm
0 0.2 0.4 0.6 0.8 10
100
200
300
400g
0 90 180 270 3600
200
400
600j
200
100
0
p300
m300
200
100
d
0 0.2 0.4 0.6 0.8 1
600
0
200
400
150–250 µmN
umbe
r of
bou
tons
0 0.2 0.4 0.6 0.8 10
200
400
600
800
OSI
h
0 90 180 270 3600
200
400
600
800
1,000
1,200
FWHM (°)
k
2000
400600
q800
n800
600400
200
e1,200
0
200
400
600
800
1,000
gOSI
0 0.2 0.4 0.6 0.8 1
300–400 µm
Num
ber
of b
outo
ns
0 0.2 0.4 0.6 0.8 10
50
100
150
200t
L4 n
euro
ns DSI = 0.86gOSI = 0.66
DSI = 0.67gOSI = 0.62
DSI = 0.03gOSI = 0.79
DSI = 0.02gOSI = 0.79
r
0 90 180 270 3600
100
200
300
u
20
40
w60
0
vs
0 0.2 0.4 0.6 0.8 10
50
100
150L4
Num
ber
of n
euro
ns
0 0.2 0.4 0.6 0.8 10
50
100
150
200
250z
L2/3
neu
rons
x
DSI = 0.70gOSI = 0.42
DSI = 0.91gOSI = 0.46
DSI = 0.13gOSI = 0.76
DSI = 0.20gOSI = 0.65
400
0 90 180 270 3600
100
200
300
aa ac24
16
aby
0 0.2 0.4 0.6 0.8 1
200
0
50
100
150
L2/3
Num
ber
of n
euro
ns
0
50
100
150
200
250
0 0.2 0.4 0.6 0.8 1
OSI
af
L5 n
euro
ns DSI = 0.08gOSI = 0.70
DSI = 0.97gOSI = 0.59
DSI = 0.13gOSI = 0.78
DSI = 0.81gOSI = 0.60
ad
0 90 180 270 3600
100
200
300
400
FWHM (°)
ag ai30
20
10
ah75
50
0
50
100
150
200
ae
0 0.2 0.4 0.6 0.8 1
gOSI
L5
Num
ber
of n
euro
ns
100
400300
200
8060
40
60
40
0
25
Figure 5 Direction tuning of thalamic boutons and neurons in V1. (a–k) Direction tuning of thalamic boutons. Example polar-plot tuning curves of AS (a) and DS (b) boutons. A, P, S and I in b indicate anterior, posterior, superior and inferior directions, respectively. Bottom right, DSI and gOSI. gOSI (c–e), OSI (f–h) and tuning curve FWHM (i–k) distributions for AS (blue) and DS (red) boutons 0–100 µm, 150–250 µm and 300–400 µm below pia are shown. (l–n) Circular histograms of preferred motion axis for AS units (bar orientation indicates preferred motion axis; bar length represents number of units). Bars reflected for displaying axis selectivity (faded and full-color bars represent the same data) are shown. (o–q) Circular histograms of preferred motion direction for DS units (bar direction indicates motion direction). (r–ai) Direction tuning of cortical neurons. Example tuning curves, distributions of gOSI, OSI, FWHM and preferred motion axis for AS, and preferred motion direction for DS (r–w) L4, (x–ac) L2/3 and (ad–ai) L5 neurons are shown. Green arrows indicate the anteroinferior-posterosuperior motion axis.
314 VOLUME 19 | NUMBER 2 | FEBRUARY 2016 nature neurOSCIenCe
a r t I C l e S
and intracortical inputs from the entire cortical column to generate feedforward output29.
DISCUSSIONUsing in vivo two-photon imaging, we carried out comprehensive characterization of orientation and direction representations along the canonical dLGN→L4→L2/3→L5 pathway. Imaging is particularly powerful in this context because it enables us to interrogate the circuit on the level of individual synapses, as we demonstrated on the thalamic boutons in V1. The ability to directly monitor activities at hundreds of sites simultaneously allowed us to measure the tuning properties of tens of thousands of thalamic boutons and thousands of cortical neu-rons in the input and output layers, a data-rich approach that should be generally applicable to questions of circuit computation.
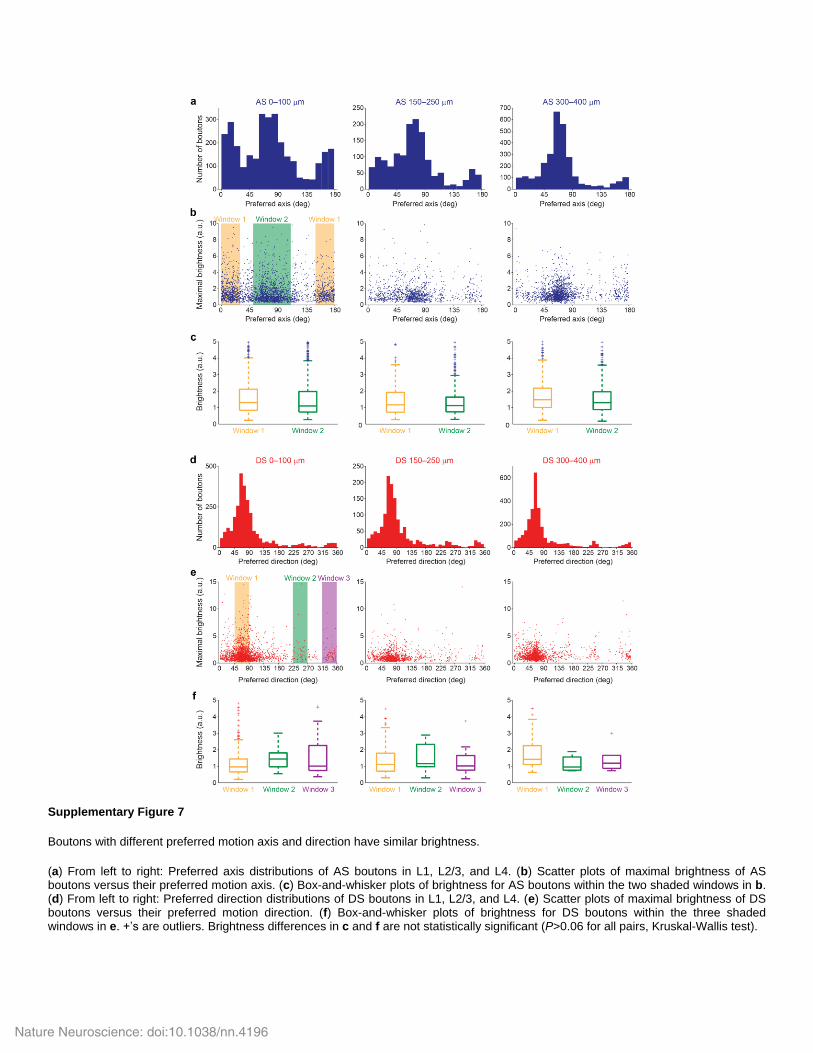
It is important to consider potential limitations of the imaging approach. Because the recorded calcium transients correlate with spik-ing activity, but not necessarily linearly to spike rate, tuning curves are susceptible to distortions by local calcium dynamics. Where comparisons can be made, the largely consistent tuning properties between our imaging data and results obtained by electrophysiol-ogy12,37 (Supplementary Table 1) suggest that distortion is not con-sequential in our system. In addition, a small amount of distortion should not affect the calculation of preferred orientations and direc-tions. Another potential limitation is that, when applied at depth, optical imaging suffers from aberration and scattering38. Even with aberration correction, in vivo bouton images in L4 are noisier than those in L1 (Supplementary Videos 1 and 2). Thus, if a subpopulation of boutons with a particular functional characteristic (for example, AS boutons that prefer the vertical motion axis; Fig. 5l–n) were also characterized by a considerably lower fluorescence brightness than the rest of the population, the population distributions of the response properties would be skewed by the increasing difficulty in detecting these dim features at depth. We compared the average brightness of boutons in the same depth range and found that, across all depths, there was no significant brightness difference (P > 0.06 for all pairs, Kruskal-Wallis test) for boutons preferring different motion axes and/or directions (Supplementary Fig. 7). Thus, the notable orienta-tion and direction anisotropies observed in thalamic boutons indeed reflect the biases of the tuned thalamic inputs into V1.
dLGN is the only thalamic nucleus known to project to L4 of V1. To characterize its projections into V1, we sought to transfect as many dLGN neurons as possible, which sometimes led to spillover expression of GCaMP6s in nearby thalamic nuclei. The only other visual thalamic nucleus that also projects to V1 is the lateral posterior thalamic nucleus (LP), whose projections are confined to L1 of V1 (ref. 39). We investigated whether the measured tuning properties of thalamic boutons in V1 are affected by GCaMP6s expression levels in LP and found little variation in orientation tuning in either L1 or L4 of mice with different amounts of LP expression (Supplementary Fig. 8). This suggests that the thalamic inputs that we characterized primarily originate from dLGN.
We describe here the first in vivo imaging study, to the best of our knowledge, of axons in L4 of any cortical area. Although previous studies found varying degrees of orientation tuning in mouse dLGN (~10–50% of all responsive neurons)9–12, these experiments only measured the tuning properties of neurons in dLGN, rather than their projections in V1, and whether the tuned information is sent to the main thalamorecipient L4 in V1 remained an outstanding question. Using retrograde tracing and anatomical hypotheses, a recent study suggested that the tuned pathway is confined to the superficial layers of the cortex, representing a circuit that is segregated from the
geniculocortical pathway carrying untuned input into deeper lay-ers14. This is consistent with the long-standing and dominant belief that orientation selectivity in dLGN, if indeed it exists, does not pro-vide selectivity to the bulk of V1. By direct functional characteriza-tion of thalamic boutons in L4, we reached the contrary conclusion: the tuned and non-tuned inputs are conveyed to and intermixed in all layers that we investigated, with about half of all boutons exhibiting significant orientation tuning and half of these exhibiting direction selectivity.
Our finding that tuned inputs are conveyed to L4 of primary visual cortex suggests a refinement of mechanistic models that assume the mammalian primary visual cortex to be entirely responsible for com-puting these features from untuned inputs. Comparing the orientation and direction preferences of the LGN inputs and L4 excitatory neu-rons, we found that the dominant geniculate orientation and motion direction biases are preferred by a large fraction of L4 neurons, but there are also L4 neurons with tuning preferences that are largely absent in the thalamic input. Taken together, our results suggest that multiple mechanisms7,40,41 are at work in the thalamocortical transformation of orientation and direction selectivity in mouse V1, where cortical tuning may be constructed from untuned thalamic inputs, directly inherited from OS and DS thalamic neurons, or result from a complex interaction of both tuned and untuned inputs42. Our population-level analyses cannot distinguish among these scenarios. To resolve how the tuned thalamic inputs contribute to the orienta-tion tuning of individual L4 neurons, we need direct measurements of input-output relationships on the single neuron level. The first step would be to find the postsynaptic targets of these tuned axons, whereas a definitive experiment would be to measure the tuning prop-erties of all the thalamocortical synapses of a single L4 neuron.
Given previous whole-cell recording studies5,42, the OS and DS dLGN neurons that are highly nonlinear in their spatial summation10,12,43 are unlikely to contribute directly to V1 simple cells5,44. Instead, they may contribute to the cortical selectivities through alternative pathways, for example, by synapsing onto non-simple-cell population37 or by providing the orientation and direction biases to shape the cortical circuit during development45. More generally, although varying degrees of orientation and direction selectivity have been observed in dLGN of rabbit43, cat46,47 and monkey48, the extent to which our results will generalize across mammalian species remains largely an empirical question.
METhODSMethods and any associated references are available in the online version of the paper.
Note: Any Supplementary Information and Source Data files are available in the online version of the paper.
AcknowledgmenTSWe thank M. Cembrowski, Y. Dan, R. Egnor, A. Kerlin, J. Magee, G. Murphy, S. Sternson, M. Stryker and K. Svoboda for comments on the manuscript. A. Hu for help with histology. This work was supported by Howard Hughes Medical Institute.
AUTHoR conTRIBUTIonSN.J. initiated and oversaw the project, W.S. and N.J. designed the experiments, Z.T. collected calcium imaging data on L4 neurons, and W.S. collected all other data. All of the authors contributed to data analysis and presentation. W.S., B.D.M. and N.J. wrote the paper.
comPeTIng FInAncIAl InTeReSTSThe authors declare no competing financial interests.
Reprints and permissions information is available online at http://www.nature.com/reprints/index.html.
4. Reid, R.C. & Alonso, J.-M. Specificity of monosynaptic connections from thalamus to visual cortex. Nature 378, 281–284 (1995).
5. Lien, A.D. & Scanziani, M. Tuned thalamic excitation is amplified by visual cortical circuits. Nat. Neurosci. 16, 1315–1323 (2013).
6. Li, Y.-T., Ibrahim, L.A., Liu, B.-H., Zhang, L.I. & Tao, H.W. Linear transformation of thalamocortical input by intracortical excitation. Nat. Neurosci. 16, 1324–1330 (2013).
7. Hubel, D.H. & Wiesel, T.N. Receptive fields, binocular interaction and functional architecture in the cat’s visual cortex. J. Physiol. (Lond.) 160, 106–154 (1962).
8. Chapman, B., Zahs, K.R. & Stryker, M.P. Relation of cortical cell orientation selectivity to alignment of receptive fields of the geniculocortical afferents that arborize within a single orientation column in ferret visual cortex. J. Neurosci. 11, 1347–1358 (1991).
9. Marshel, J.H., Kaye, A.P., Nauhaus, I. & Callaway, E.M. Anterior-posterior direction opponency in the superficial mouse lateral geniculate nucleus. Neuron 76, 713–720 (2012).
10. Piscopo, D.M., El-Danaf, R.N., Huberman, A.D. & Niell, C.M. Diverse visual features encoded in mouse lateral geniculate nucleus. J. Neurosci. 33, 4642–4656 (2013).
11. Scholl, B., Tan, A.Y.Y., Corey, J. & Priebe, N.J. Emergence of orientation selectivity in the mammalian visual pathway. J. Neurosci. 33, 10616–10624 (2013).
12. Zhao, X., Chen, H., Liu, X. & Cang, J. Orientation-selective responses in the mouse lateral geniculate nucleus. J. Neurosci. 33, 12751–12763 (2013).
13. Vaney, D.I., Sivyer, B. & Taylor, W.R. Direction selectivity in the retina: symmetry and asymmetry in structure and function. Nat. Rev. Neurosci. 13, 194–208 (2012).
14. Cruz-Martín, A. et al. A dedicated circuit links direction-selective retinal ganglion cells to the primary visual cortex. Nature 507, 358–361 (2014).
15. Niell, C.M. Cell types, circuits, and receptive fields in the mouse visual cortex. Annu. Rev. Neurosci. 38, 413–431 (2015).
16. Chen, T.-W. et al. Ultrasensitive fluorescent proteins for imaging neuronal activity. Nature 499, 295–300 (2013).
17. Antonini, A., Fagiolini, M. & Stryker, M.P. Anatomical correlates of functional plasticity in mouse visual cortex. J. Neurosci. 19, 4388–4406 (1999).
18. Guizar-Sicairos, M., Thurman, S.T. & Fienup, J.R. Efficient subpixel image registration algorithms. Opt. Lett. 33, 156–158 (2008).
19. De Paola, V. et al. Cell type–specific structural plasticity of axonal branches and boutons in the adult neocortex. Neuron 49, 861–875 (2006).
20. Petreanu, L. et al. Activity in motor-sensory projections reveals distributed coding in somatosensation. Nature 489, 299–303 (2012).
21. Glickfeld, L.L., Andermann, M.L., Bonin, V. & Reid, R.C. Cortico-cortical projections in mouse visual cortex are functionally target specific. Nat. Neurosci. 16, 219–226 (2013).
22. Carandini, M. & Ferster, D. Membrane potential and firing rate in cat primary visual cortex. J. Neurosci. 20, 470–484 (2000).
23. Ji, N., Sato, T.R. & Betzig, E. Characterization and adaptive optical correction of aberrations during in vivo imaging in the mouse cortex. Proc. Natl. Acad. Sci. USA 109, 22–27 (2011).
24. Wang, C. et al. Multiplexed aberration measurement for deep tissue imaging in vivo. Nat. Methods 11, 1037–1040 (2014).
25. Wang, K. et al. Direct wavefront sensing for high-resolution in vivo imaging in scattering tissue. Nature Comm. 6, 7276 (2015).
26. Madisen, L. et al. A robust and high-throughput Cre reporting and characterization system for the whole mouse brain. Nat. Neurosci. 13, 133–140 (2010).
27. Dana, H. et al. Thy1-GCaMP6 transgenic mice for neuronal population imaging in vivo. PLoS One 9, e108697 (2014).
28. Ringach, D.L., Shapley, R.M. & Hawken, M.J. Orientation selectivity in macaque V1: diversity and laminar dependence. J. Neurosci. 22, 5639–5651 (2002).
29. Harris, K.D. & Mrsic-Flogel, T.D. Cortical connectivity and sensory coding. Nature 503, 51–58 (2013).
30. Bullier, J. & Henry, G.H. Laminar distribution of first-order neurons and afferent terminals in cat striate cortex. J. Neurophysiol. 42, 1271–1281 (1979).
31. Martin, K.A. & Whitteridge, D. Form, function and intracortical projections of spiny neurones in the striate visual cortex of the cat. J. Physiol. (Lond.) 353, 463–504 (1984).
32. Armstrong-James, M., Fox, K. & Das-Gupta, A. Flow of excitation within rat barrel cortex on striking a single vibrissa. J. Neurophysiol. 68, 1345–1358 (1992).
33. de Kock, C.P.J., Bruno, R.M., Spors, H. & Sakmann, B. Layer- and cell type–specific suprathreshold stimulus representation in rat primary somatosensory cortex. J. Physiol. (Lond.) 581, 139–154 (2007).
34. Constantinople, C.M. & Bruno, R.M. Deep cortical layers are activated directly by thalamus. Science 340, 1591–1594 (2013).
35. Sun, Y.J., Kim, Y.-J., Ibrahim, L.A., Tao, H.W. & Zhang, L.I. Synaptic mechanisms underlying functional dichotomy between intrinsic-bursting and regular-spiking neurons in auditory cortical layer 5. J. Neurosci. 33, 5326–5339 (2013).
36. Petreanu, L., Mao, T., Sternson, S.M. & Svoboda, K. The subcellular organization of neocortical excitatory connections. Nature 457, 1142–1145 (2009).
37. Niell, C.M. & Stryker, M.P. Highly selective receptive fields in mouse visual cortex. J. Neurosci. 28, 7520–7536 (2008).
38. Ji, N. The practical and fundamental limits of optical imaging in mammalian brains. Neuron 83, 1242–1245 (2014).
39. Oh, S.W. et al. A mesoscale connectome of the mouse brain. Nature 508, 207–214 (2014).
40. Kuhlmann, L. & Vidyasagar, T.R. A computational study of how orientation bias in the lateral geniculate nucleus can give rise to orientation selectivity in primary visual cortex. Front. Sys. Neurosci. 5, 81 (2011).
41. Priebe, N.J. & Ferster, D. Mechanisms of neuronal computation in mammalian visual cortex. Neuron 75, 194–208 (2012).
42. Miller, L.M., Escabí, M.A., Read, H.L. & Schreiner, C.E. Functional convergence of response properties in the auditory thalamocortical system. Neuron 32, 151–160 (2001).
43. Hei, X. et al. Directional selective neurons in the awake LGN: response properties and modulation by brain state. J. Neurophysiol. 112, 362–373 (2014).
44. Li, Y.-T., Liu, B.-H., Chou, X.-L., Zhang, L.I. & Tao, H.W. Strengthening of direction selectivity by broadly tuned and spatiotemporally slightly offset inhibition in mouse visual cortex. Cereb. Cortex 25, 2466–2477 (2014).
45. Rochefort, N.L. et al. Development of direction selectivity in mouse cortical neurons. Neuron 71, 425–432 (2011).
46. Vidyasagar, T.R. & Urbas, J.V. Orientation sensitivity of cat LGN neurones with and without inputs from visual cortical areas 17 and 18. Exp. Brain Res. 46, 157–169 (1982).
48. Smith, E.L. III, Chino, Y.M., Ridder, W.H. III, Kitagawa, K. & Langston, A. Orientation bias of neurons in the lateral geniculate nucleus of macaque monkeys. Vis. Neurosci. 5, 525–545 (1990).
ONLINE METhODSAll experimental protocols were conducted according to the National Institutes of Health guidelines for animal research and were approved by the Institutional Animal Care and Use Committee at Janelia Research Campus, Howard Hughes Medical Institute. Data collection and analysis were not performed blind to the conditions of the experiments.
mice. Wild-type male mice were used for in vivo functional imaging of visual tha-lamic axons (older than P60, C57BL/6J). Scnn1a-Tg3-Cre mice (Jax no. 009613), Thy1-GCaMP6 GP4.3 mice and Rbp4-Cre mice (MMRRC no. 031125-UCD) of both sexes (older than P60) were used for in vivo functional imaging of L4, L2/3 and L5 neurons, respectively. Sample sizes (number of mice, cells and/or boutons) for each experiment are stated in main text.
Virus injections. Mice were anesthetized with isoflurane (1–2% by volume in O2) and given the analgesic buprenorphine (SC, 0.3 mg per kg of body weight). Virus injection was performed using a glass pipette beveled at 45° with a 15–20-µm opening and back-filled with mineral oil. A fitted plunger controlled by a hydrau-lic manipulator (Narashige, MO10) was inserted into the pipette and used to load and inject the viral solution. To prevent virus leakage before reaching the injection site, the tip of glass pipette was filled with ~1 nl saline right before injection. To prevent backflow during withdrawal, the pipette was kept in the brain for over 10 min and then the plunger was withdrawn (~1 nl in volume) before the pipette was pulled up.
To demonstrate the projection pattern of visual thalamic axons in V1, 20 nl of AAV2/1.CAG.FLEX.tdTomato.WPRE.bGH-containing solution (~7 × 10¹² infectious units per ml) was injected into V1 of Scnn1a-Tg3-Cre mice to label L4 neurons (left hemisphere, 3.4 mm posterior to Bregma; 2.7 mm lateral from midline; 0.3 mm below pia), and 20 nl of AAV2/1.hSynapsin.EGFP.WPRE.bGH-containing solution (~3 × 10¹³ infectious units per ml) was injected into dLGN (left hemisphere, 2.1 mm posterior to Bregma; 2.3 mm lateral from midline; 2.5 mm below pia).
For calcium imaging with GCaMP6s, 20~30 nl of AAV2/1-syn-GCaMP6s-WPRE-SV40-containing solution (~2 × 10¹³ infectious units per ml) was slowly injected into dLGN for axon imaging, and 20 nl of AAV1-syn- flex-GCaMP6s-WPRE-SV40-containing solution (~2.4 × 10¹³ infectious units per ml) was injected per injection site into V1 for cortical L4 (Scnn1a-Tg3-Cre mice: three injection sites in left hemisphere centered at 3.4 mm posterior to Bregma; 2.7 mm lateral from midline; 0.3 mm below pia; injection sites are ~250 µm apart) or cortical L5 (Rbp4-Cre mice: 0.4 mm below pia) neuron imaging20.
Although the injection sites in the visual thalamus were always within dLGN, there were sometimes spill-over expressions in neighboring ventral LGN (vLGN), intergeniculate leaflet (IGL) and LP. vLGN and IGL do not project to V1 (ref. 49); compared to dLGN, projections from LP to V1 are much sparser and limited to L1 (refs. 39,50). Therefore, the vast majority of the thalamic axons we observed in V1 originated from dLGN.
cranial window implant. Craniotomy was carried out at the same time of virus injection for calcium imaging experiments. Using aseptic technique, a 2.5 mm diameter craniotomy was made over the left V1 (center: 3.4 mm posterior to Bregma; 2.7 mm lateral from midline) of the anaesthetized mice. Dura was left intact. 2 µl of red fluorescent bead solution (2-µm diameter; 1:500 in saline; Life Technologies, F-8826) was deposited on dura surface for correcting aberration induced by both cranial window and microscope. A glass window made of either a single coverslip (Fisher Scientific no. 1.5) or two coverslips bonded with ultra-violet cured optical adhesives (Norland Optical Adhesives 61) was embedded in the craniotomy and sealed in place with dental acrylic. A titanium head-post was attached to the skull with cyanoacrylate glue and dental acrylic20.
Visual stimulation. Visual stimuli were presented by back projection on a screen made of Teflon film using a custom-modified DLP projector. The screen was positioned 17 cm from the right eye, covering 75° × 75° degrees of visual space and oriented at ~40° to the long axis of the animal. The projector was modified to provide equilength and linear frames at 360 Hz (designed by A. Leonardo,
Janelia Research Campus, and Lightspeed Design, model WXGA-360). Its lamp housing was replaced by a holder for liquid light guide, through which visible light (450–495 nm) generated by a LED light source (SugarCUBE) was delivered to the screen. The maximal luminance measured at the location of animal eyes was 437 nW mm−2.
Visual stimuli were generated using custom-written codes. To measure orientation-tuning, full-field square gratings were presented in 8 (for boutons, L4 and L5 neurons) or 12 (for L2/3 neurons) directions in a pseudorandom sequence for 12 s each, during which time each stimulus was static for the first and last 3 s and moving during the middle 6 s. Gratings had 100% contrast, 0.07 cycles per degree, and drifted at 26 degrees per s (that is, a temporal frequency of ~2 Hz). A total of ten trials were presented in each measurement.
Two-photon imaging. Imaging was performed with an adaptive-optical two-photon fluorescence microscope51 2–4 weeks after virus injection, when most neurons in dLGN and cortex exhibited cytosolic-only expression52 of GCaMP6s (Figs. 1b and 3). Mice were head-fixed and awake during the imaging period. To habituate the mice to experimental handling, 1 week after sur-gery, each mouse was head-fixed onto the sample stage with its body restrained under a half-cylindrical cover, which reduces struggling and prevents substantial body movements such as running. The habituation procedure was repeated 3–4 times for each animal, and each time for 15–60 min. Each experiment session lasted between 45 min to 3 h. Multiple sections (imaging planes) may be imaged within the same mouse. GCaMP6s was excited at 900 nm with a Ti:Sapphire laser (Ultra II, Coherent) that was focused by either a Nikon 16×, 0.8 NA or an Olympus 25×, 1.05 NA objective. Emitted fluorescence photons reflected off a dichroic long-pass beamsplitter (FF665-Di02-25×36; Semrock) and were detected by a photomultiplier tube (H7422PA-40, Hamamatsu).
Images of axons were acquired from the brain surface down to 400 µm below pia using home-made LabVIEW software. Laser power measured post objective varied between 20 and 175 mW, with higher power used at deeper depth. Out of 28 image sections for boutons 300–400 µm below pia, three image sections were taken with 175 mW; one image section were taken with 156 mW; while all others were taken at power less than 140 mW. Typical time for mapping the orientation selectivity of a single image section is ~15 min. We did not observe photobleach-ing or photodamage, even when we imaged a single plane at 350 µm depth with 156 mW post-objective power for 45 min (for example, ROI6; Supplementary Fig. 3d). Images of L4, L2/3 and L5 neurons were taken at 280–410 µm, 60–280 µm and 410–540 µm below pia, respectively, at post-objective power of 20–90 mW. Imaging areas for both axons and neurons are within 3.4 ± 0.6 mm posterior to Bregma and 2.7 ± 0.6 mm lateral from midline. Typical images had 300 × 300 pixels, at 0.3–0.35 µm per pixel and ~2-Hz frame rate for axons, and 1–1.6 µm per pixel and 3–4 Hz frame rate for cell bodies. The optical aberration introduced by the cranial window and microscope was corrected following previously described adaptive optical procedure23 using red fluorescent beads deposited between the cranial window and the brain.
Brain histology and confocal imaging. To validate the injection site, after each calcium imaging experiment, Cholera Toxin Subunit B (CTB) conjugated with Alexa-594 (1 µg in 2 µl saline) was injected into right eye of the mouse to allow anterograde labeling of retinal ganglion cell axons in visual thalamus. 24–48 h later, mice were deeply anaesthetized with isoflurane and transcardially perfused with PBS and then 4% paraformaldehyde (wt/vol). Brains were removed and post fixed overnight in paraformaldehyde. Coronal brain slices were cut to 100 µm thickness using a Leica microtome (V1200S, Leica).
To retrogradely label the neurons projecting to V1, ~100 nl of Fluoro-Gold (5% diluted in distilled water) was injected into V1. 1 week later, the brain was harvested and coronal brain slices were cut to 100-µm thickness. All brain slices were mounted in Vector Shield mounting solution.
Fluorescence images of these sectioned brains were acquired on a laser scanning confocal microscope (Zeiss LSM 710) equipped with 405-, 488- and 561-nm excitation lasers. Images were collected using the following Plan-Apochromat objectives: 10×/0.45 NA (optical section step of 2 µm), 20×/0.8 NA (optical section step of 1.0 µm), 40×/1.3 NA oil immersion (optical section step of 0.5 µm), and 63×/1.4 NA oil immersion (optical section step of 0.5 µm).
Image processing and analysis. The time-lapse calcium imaging stacks were analyzed with custom programs written in MATLAB (Mathworks). Lateral motion present in head-fixed awake mice was corrected using a cross-correlation- based registration algorithm18, where cross-correlation was calculated to determine frame shift in x and y directions. Because of the extremely low signal of GCaMP6s sans activity (Supplementary Fig. 3a), the mean projec-tion of the whole stack was used as the registration reference. Iterating this registration procedure led to the continuous decrease of ∆ ∆x yk kk
2 2+( )∑ , where ∆xk and ∆yk represent the horizontal and vertical shifts of frame k relative to the reference image, respectively. Typically, seven iterations were sufficient for axon data (Supplementary Fig. 3b).
Cortical neurons were outlined by hand as regions of interest (ROIs). To identify potential boutons, we used the mean projection of the registered stack, and outlined varicosities of 1–3 µm in diameter (Supplementary Fig. 3c). We then calculated the fluorescence time courses of the ROIs. For each ROI, we used the mode from the fluorescence intensity histogram as the baseline fluo-rescence F0, and calculate its calcium transient as ∆F/F (%) = (F−F0)/F0 × 100 (Supplementary Fig. 3d). The final calcium transient to each visual stimulus (for example, Fig. 1j–l) was the average of ten trials. A ROI was considered responsive if its maximal ∆F/F during the presentation of visual stimuli was above 10%. Of 33,263 boutons outlined from 21 wild-type mice, 27,902 (84%) were visually responsive; Of 1,511 L4 neurons outlined from 3 Scnn1a-Tg3-Cre mice, 1,239 (82%) were visually responsive; of 2,608 L2/3 neurons outlined from 6 Thy1-GCaMP6 GP4.3 mice, 1,279 (49%) were visually responsive; of 1,677 L5 neurons outlined from 5 Rbp4-Cre mice, 1,554 (93%) were visually responsive. No statistical methods were used to predetermine sample sizes, but our sample sizes are similar to or larger than those generally employed in the field.
Tuning curve analysis. The response R of each ROI to a visual stimulus was defined as the average ∆F/F across the 6-s window of drifting gratings. The dis-tribution of R was assumed to be normal and variances were assumed to be equal across grating angle θ but this was not formally tested. For ROIs with significantly different responses across the drifting directions (one-way ANOVA, P < 0.05),
we fit their normalized response tuning curves to grating drifting angle θ (Fig. 1m–o) with a bimodal Gaussian function22
R R R e R eq
q q
s
q q
( ) = + +−
−( )−
− +
offset pref
ang
oppo
angpref pref2
22
180(( )222s
Here θpref is the preferred orientation, Roffset is a constant offset, and Rpref and Roppo are the responses at θpref and θpref – 180 degree, respectively. ang(x) = min(x, x – 360, x + 360) wraps angular values onto the interval 0° to 180°. The tuning width for the preferred orientation is calculated as the full width at half maximum (FWHM) of the Gaussian function 2 2 2ln s .
To determine the goodness of fit, we calculated the fitting error E as well as the coefficient of determination R2
E R R= ( ) − ( )( )∑θ
measured fittedq q 2
R22
21 1= −
( ) − ( )( )− ( ) −( )
∑∑
q
q
q q
q
R Rnn
R R
measured fitted
measured
where Rmeasured(θ) and Rfitted(θ) are the measured and fitted responses at θ, respec-tively. R is the mean of Rmeasured(θ). Only ROIs with E < 0.4 and R2 0 6> . were defined as OS. Applying a more stringent definition, with E < 0.2 and R2 0 8> . , reduced the number of OS units but did not affect the conclusions of this work. Image registration and tuning curve analysis routines are available upon request.
A Supplementary methods checklist is available.
49. Harrington, M.E. The ventral lateral geniculate nucleus and the intergeniculate leaflet: interrelated structures in the visual and circadian systems. Neurosci. Biobehav. Rev. 21, 705–727 (1997).
50. Sanderson, K.J., Dreher, B. & Gayer, N. Prosencephalic connections of striate and extrastriate areas of rat visual cortex. Exp. Brain Res. 85, 324–334 (1991).
51. Ji, N., Milkie, D.E. & Betzig, E. Adaptive optics via pupil segmentation for high-resolution imaging in biological tissues. Nat. Methods 7, 141–147 (2010).
52. Tian, L. et al. Imaging neural activity in worms, flies and mice with improved GCaMP calcium indicators. Nat. Methods 6, 875–881 (2009).
dLGN provides the main thalamic inputs to mouse primary visual cortex (V1).
(a) Neurons in V1 labeled with injected Fluoro-Gold™ (FG). Scale bar: 100 m. (b) FG Injection site. Scale bar: 2 mm. (c) Visual
thalamus with retrograde-label FG (black) injected in V1 and anterograde-label Cholera Toxin Subunit B/Alexa 594 (red) introduced to the contralateral eye. dLGN and vLGN: dorsal and ventral lateral geniculate nucleus; LP: lateral posterior thalamic nucleus. Scale bar:
100 m. Representative images from 4 mice.
Nature Neuroscience: doi:10.1038/nn.4196
Supplementary Figure 2
Thalamic axons project to L1 through L4 of mouse V1.
(a) GFP labels visual thalamic neurons and tdTomato labels L4 neurons in Scnn1a-Tg3-Cre mice. (b) GFP+ neurons in dLGN. d, dorsal;
m, medial. Scale bar: 100 m. (c) GFP+ thalamic axons and tdTomato
+ L4 neurons in a V1 section from pia (top) to white matter
(bottom). Scale bar: 50 m. (d) Enlarged views of GFP+ axons of areas i–iv in c. Scale bar: 10 m. (e) In widetype mice with
GCaMP6s+ thalamic axons, the same projection pattern was observed from pia (top) to white matter (bottom). Scale bars: 50 m. (f)
Enlarged views of GCaMP6s+ axons of areas i–iv in e. Scale bar: 10 m. We found no GFP
+ or GCaMP6s
+ cell bodies in V1.
Representative images from 3 mice (GFP and tdTomato) and 21 mice (GCaMP6s).
Nature Neuroscience: doi:10.1038/nn.4196
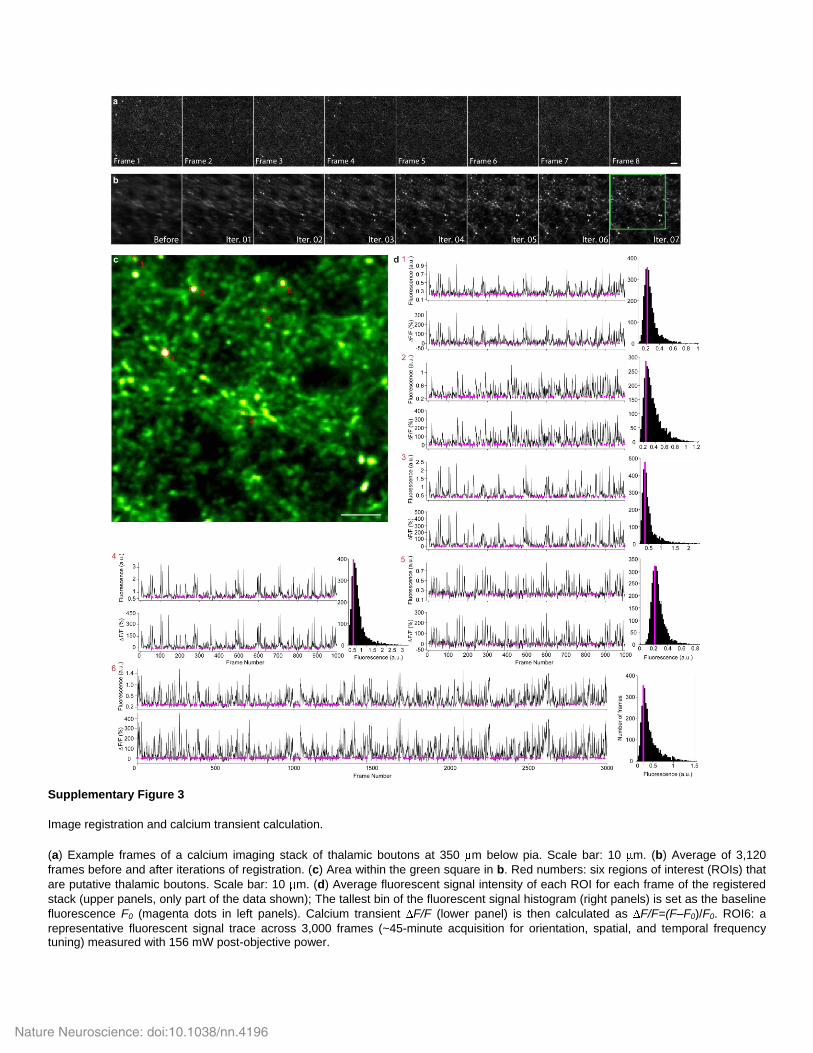
Supplementary Figure 3
Image registration and calcium transient calculation.
(a) Example frames of a calcium imaging stack of thalamic boutons at 350 m below pia. Scale bar: 10 m. (b) Average of 3,120
frames before and after iterations of registration. (c) Area within the green square in b. Red numbers: six regions of interest (ROIs) that
are putative thalamic boutons. Scale bar: 10 m. (d) Average fluorescent signal intensity of each ROI for each frame of the registered
stack (upper panels, only part of the data shown); The tallest bin of the fluorescent signal histogram (right panels) is set as the baseline
fluorescence F0 (magenta dots in left panels). Calcium transient F/F (lower panel) is then calculated as F/F=(F–F0)/F0. ROI6: a
representative fluorescent signal trace across 3,000 frames (~45-minute acquisition for orientation, spatial, and temporal frequency tuning) measured with 156 mW post-objective power.
Nature Neuroscience: doi:10.1038/nn.4196
Supplementary Figure 4
Estimation of the number of independent boutons.
(a) Boutons on the same axon have (b) highly correlated calcium transients. Scale bar: 5 m. (c) Distribution of correlation coefficient R
between boutons visually identified as being on the same axon (76 boutons, 24 axons). Mean: 0.81; s.d.: 0.08. Red dashed line at 0.57: 3 s.d. below the mean; Blue dashed line at 0.65: 2 s.d. below the mean. Correlation coefficients were computed over the entire imaging
session. (d) Boutons in one field of view and (e) the matrix of their correlation coefficients. Scale bar: 10 m. (f) Distribution of
correlation coefficients for all fields of view (34,120 boutons, 87 fields of view). (g) Assuming boutons with R less than (upper panel) 0.65 or (lower panel) 0.57 to be from different cells, the percentage of independent boutons for each image section. Superficial image sections have more boutons from the same axons, because of the higher occurrence of horizontally elaborating axon terminals in L1.
Nature Neuroscience: doi:10.1038/nn.4196
Supplementary Figure 5
Population averaged responses of thalamic boutons and neurons in V1.
(a–i) For thalamic boutons: averaged F/F responses of all (a–c) visually responsive, (d–f) AS, and (g–i) DS boutons 0–100 m, 150–
250 m, and 300–400 m below pia, respectively. (j–r) For V1 neurons: averaged responses of all (j,m,p) visually responsive, (k,n,q)
AS, and (l,o,r) DS L4, L2/3, and L5 neurons, respectively. Green lines: mean vectors of population responses. Boutons: 21 wild-type mice; L4: 3 Scnn1a-Tg3-Cre mice; L2/3: 6 Thy1-GCaMP6 GP4.3 mice; L5: 5 Rbp4-Cre mice.
Nature Neuroscience: doi:10.1038/nn.4196
Supplementary Figure 6
Distributions of preferred motion axis and direction for thalamic boutons, L4, L2/3, and L5 neurons and their statistical distances.
(a) From top to bottom: distributions of preferred motion axis for AS thalamic boutons in L1, L2/3, L4, as well as AS L4, L2/3, and L5 neurons. (b) From top to bottom: distributions of preferred motion direction for DS thalamic boutons in L1, L2/3, L4, as well as DS L4, L2/3, and L5 neurons. a and b: same data as in Fig. 3, plotted in linear histogram. (c) Cumulative distributions of the preferred axis for the AS units. (d) Statistical distances between pairs of distributions in c quantified via Kolmogorov-Smirnov distance. 0 indicates identical distributions. (e) Cumulative distributions of the preferred direction for the DS units. (f) Kolmogorov-Smirnov distances between pairs of distributions in e, with smaller distance indicating more similar distributions.
Nature Neuroscience: doi:10.1038/nn.4196
Supplementary Figure 7
Boutons with different preferred motion axis and direction have similar brightness.
(a) From left to right: Preferred axis distributions of AS boutons in L1, L2/3, and L4. (b) Scatter plots of maximal brightness of AS boutons versus their preferred motion axis. (c) Box-and-whisker plots of brightness for AS boutons within the two shaded windows in b. (d) From left to right: Preferred direction distributions of DS boutons in L1, L2/3, and L4. (e) Scatter plots of maximal brightness of DS boutons versus their preferred motion direction. (f) Box-and-whisker plots of brightness for DS boutons within the three shaded windows in e. +’s are outliers. Brightness differences in c and f are not statistically significant (P>0.06 for all pairs, Kruskal-Wallis test).
Nature Neuroscience: doi:10.1038/nn.4196
Supplementary Figure 8
Orientation tuning of thalamic boutons from mice with different GCaMP6s expression levels in lateral posterior thalamic nucleus.
(a–c) GCaMP6s expression in visual thalamus of three mice: left to right, decreasing levels of expression in lateral posterior thalamic nucleus. (d–f) Orientation tuning of L1 thalamic boutons measured in vivo from Mouse 1, 2, and 3, respectively: upper left, in vivo image; upper right, boutons color-coded by their preferred orientation; lower left, distribution of preferred orientation; lower right, distribution of tuning width. (g–i) Orientation tuning of L4 thalamic boutons characterized in vivo from Mouse 1, 2, and 3, respectively.
Tuning property(b) This study (calcium imaging of thalamic boutons or neurons in V1)
Previous studies (extracellular recording in dLGN or V1)
Percentage of visually responsive boutons/neurons that are OS
~50% 48%‐63%, depending on definition(c)
Tuning FWHM of OS thalamic boutons/neurons
70‐82 75.4(c)
gOSI of OS thalamic boutons/neurons
0.26 0.19(c)
OSI of OS thalamic boutons/neurons
0.56 0.41(c)
Percentage of visually responsive L4 neurons that are OS
83% 80%(d,e)
Tuning FWHM of OS L4 neurons 33.6 ~56(d) gOSI of OS L4 neurons Median=0.56, Mean=0.55 Mean ~0.57(d)
OSI of OS L4 neurons Median=0.78, Mean=0.74 Mean ~0.86(d)
Percentage of visually responsive L2/3 neurons that are OS
83% 80%(d,e)
Tuning FWHM of OS L2/3 neurons
29.2
~44 – 56(d)
gOSI of OS L2/3 neurons Median=0.58, Mean=0.57 Mean ~0.56(d)
OSI of OS L2/3 neurons Median=0.78, Mean=0.74 Mean ~0.87(d)
Percentage of visually responsive L5 neurons that are OS
63% 74%(d,e)
Tuning FWHM of OS L5 neurons 35.5 ~74(d) gOSI of OS L5 neurons Median=0.46, Mean=0.47 Mean ~0.35(d)
OSI of OS L5 neurons Median=0.73, Mean=0.69 Mean ~0.6(d) (a)Duetotheirlargesamplesizes,datafromZhaoetal.,2015(Reference12)andNielletal.,2008(Reference35)werechosenforcomparison.(b)Medianvaluesareusedunlessstatedotherwise.(c)Zhaoetal.,2015(d)Nielletal.,2008(e)CalculatedfromFigure9ofNielletal.,2008as(linearoriented+nonlinearoriented)/(1‐nonresponsive).