45
The 14th German Corporate Conference Frankfurt - January 2015 Dr Stefan Schulte CEO Stefan J. Rueter Head of Finance & Investor Relations
| Date post: | 04-Jun-2018 |
| Category: |
Documents |
| Upload: | trinhthien |
| View: | 215 times |
| Download: | 0 times |

The 14th German Corporate Conference Frankfurt - January 2015 Dr Stefan Schulte CEO Stefan J. Rueter Head of Finance & Investor Relations

Slide 2
Fraport @ The 14th German Corporate Conference January 2015
This document has been prepared by Fraport solely for use in this presentation. The information contained in this document has not been independently verified. No representation or warranty – whether express or implied – is made as to, and no reliance should be placed on, the fairness, accuracy, completeness or correctness of the information or opinions contained therein. Neither the company nor any of its affiliates, advisors or representatives shall have any liability whatsoever (in negligence or otherwise) for any loss arising from any use of this document or its content or otherwise arising in connection with this document. This document does not constitute an offer or invitation to purchase or subscribe for any shares and neither this document nor any part of it shall form the basis of, or be relied upon in connection with, any contract or commitment whatsoever. This document contains forward-looking statements that are based on current estimates and assumptions made by the management of Fraport to the best of its knowledge. Such forward-looking statements are subject to risks and uncertainties, the non-occurrence or occurrence of which could cause the actual results – including the financial condition and profitability of Fraport – to differ materially from or be more negative than those expressed or implied by such forward-looking statements. This also applies to the forward looking estimates and forecasts derived from third-party studies. Consequently, neither the company nor its management can give any assurance regarding the future accuracy of the opinions set forth in this document or the actual occurrence of the predicted developments. By accepting this document, you agree with the foregoing.
Disclaimer
Slide 3
Fraport @ The 14th German Corporate Conference January 2015
Agenda
2014 & 2015 in a Nutshell
Traffic Insight
Terminal 3
External Activities
Outlook
Backup (Financials 9M 2014)
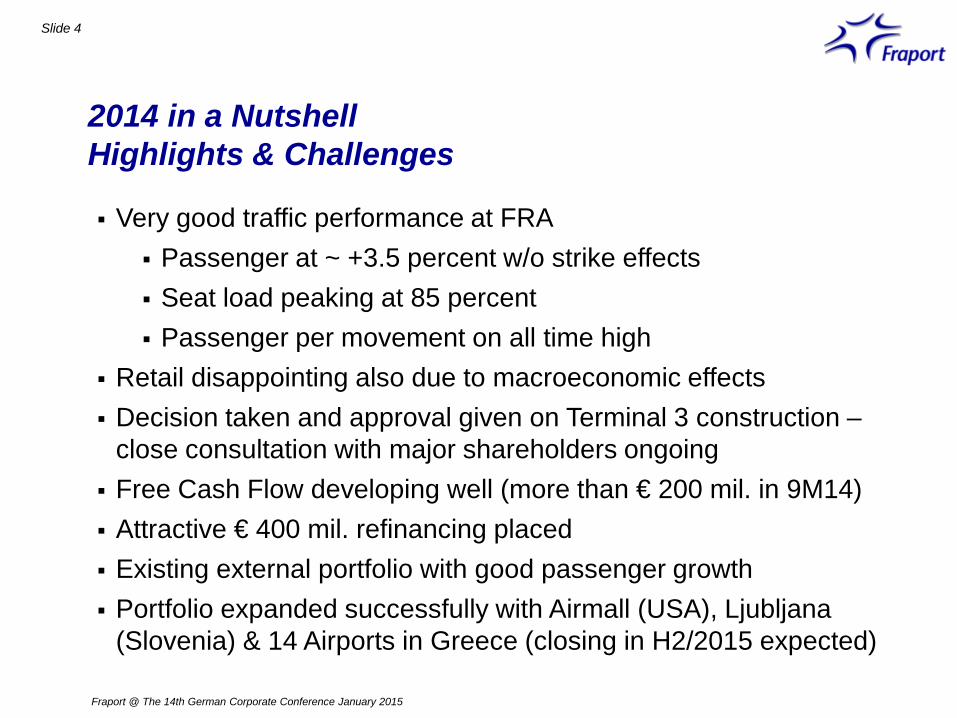
2014 in a Nutshell Highlights & Challenges
Fraport @ The 14th German Corporate Conference January 2015
Slide 4
Very good traffic performance at FRA Passenger at ~ +3.5 percent w/o strike effects Seat load peaking at 85 percent Passenger per movement on all time high
Retail disappointing also due to macroeconomic effects Decision taken and approval given on Terminal 3 construction –
close consultation with major shareholders ongoing Free Cash Flow developing well (more than € 200 mil. in 9M14) Attractive € 400 mil. refinancing placed Existing external portfolio with good passenger growth Portfolio expanded successfully with Airmall (USA), Ljubljana
(Slovenia) & 14 Airports in Greece (closing in H2/2015 expected)
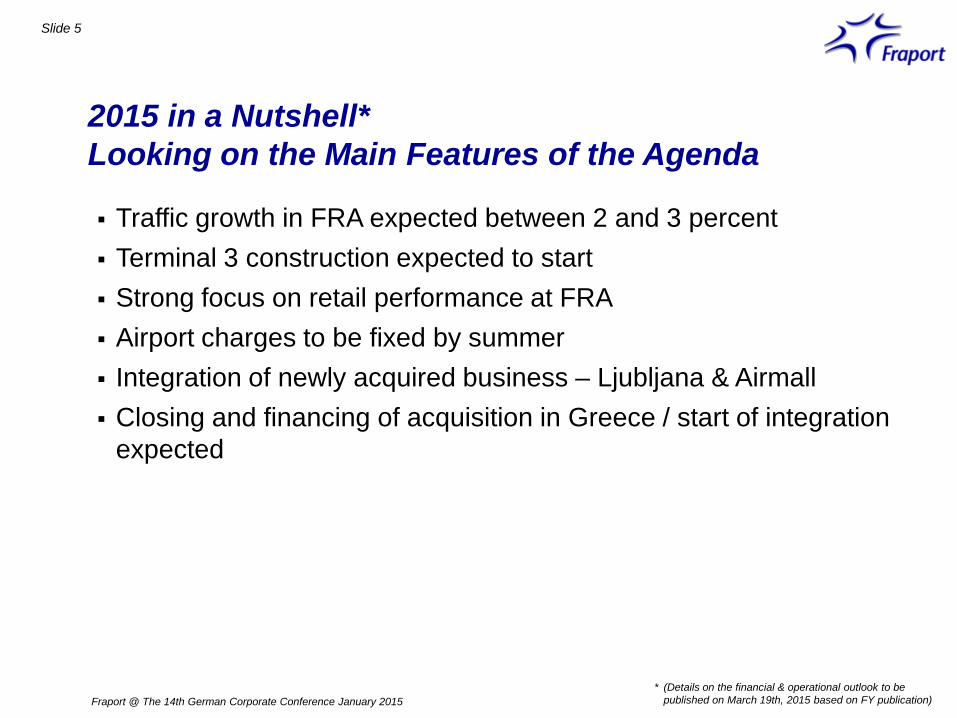
2015 in a Nutshell* Looking on the Main Features of the Agenda
Fraport @ The 14th German Corporate Conference January 2015
Slide 5
Traffic growth in FRA expected between 2 and 3 percent Terminal 3 construction expected to start Strong focus on retail performance at FRA Airport charges to be fixed by summer Integration of newly acquired business – Ljubljana & Airmall Closing and financing of acquisition in Greece / start of integration
expected
* (Details on the financial & operational outlook to be published on March 19th, 2015 based on FY publication)

Slide 6
Fraport @ The 14th German Corporate Conference January 2015
Agenda
2014 & 2015 in a Nutshell
Traffic Insight
Terminal 3
External Activities
Outlook
Backup (Financials 9M 2014)

Slide 7
Fraport @ The 14th German Corporate Conference January 2015
Traffic Insight Frankfurt Airport Traffic Statistics
Passengers*
Movements
MTOW
Cargo**
58,037
472,692
28,416
2,095
December 2014 FY 2014
59,566
469,026
28,958
2,132
4,015
32,954
2,137
173
-2.0
-5.2
-1.1
-1.5
+2.6
-0.8
+1.9
+1.8
∆ % ∆ %
in `000
in `000 tons
60%
65%
70%
75%
80%
85%
90%
Jan Feb Mar Apr May Jun Jul Aug Sep Oct Nov Dec
Seat load factor
2014 2013
FY 2013
in `000 tons
Passenger per movement
120 125 130 135
Passenger guidance FY2014: 2-3% upside
+3,9%
Dec 2014
Dec 2013
* Source ACI, commercial traffic only ** Freight & Mail

Slide 8
Fraport @ The 14th German Corporate Conference January 2015
Traffic Insight Frankfurt Airport Traffic Shares 12M2014
Frankfurt Airport North America
14%
+1% ∆
Latin America
4%
-4% ∆
Africa
4%
-5% ∆
Middle East
5%
+3% ∆
Far East
11%
-1% ∆
Western Europe
42%
+5% ∆
Domestic
11%
+2% ∆
Eastern Europe
9%
+6% ∆
Continental
62%
+5% ∆
Intercontinental
38%
-1% ∆ Traffic Share
∆ Delta absolute vs. previous year in %
Slide 9
Fraport @ The 14th German Corporate Conference January 2015
IATA Code
Airport
Share
Dec 2014
∆ previous
year
YTD 2014
∆ previous
year
FY
2013
CAGR 2010-2013
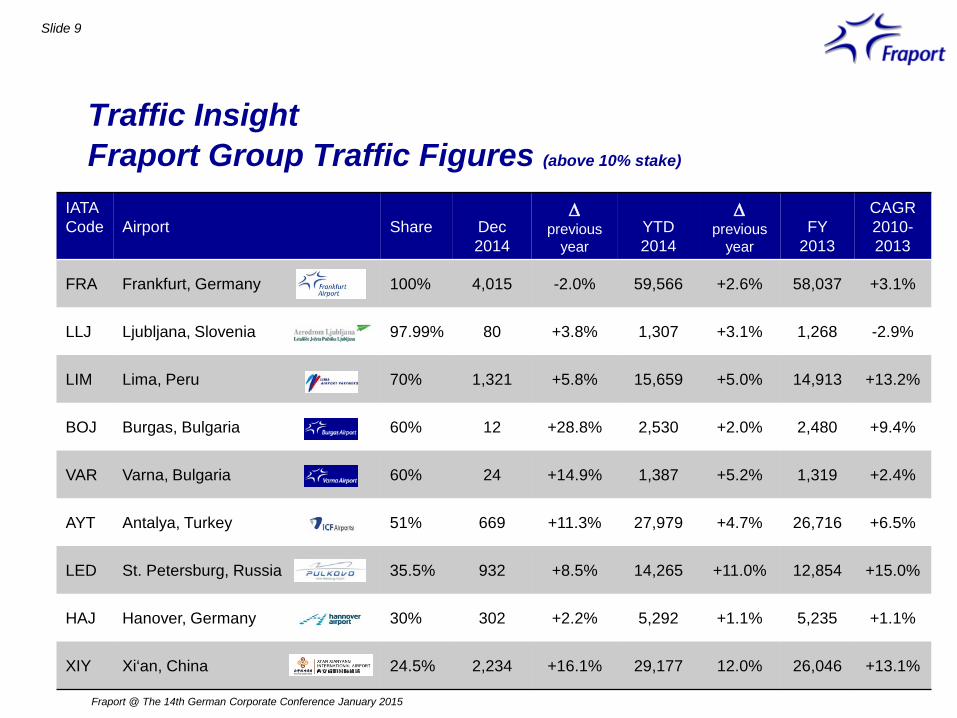
FRA Frankfurt, Germany 100% 4,015 -2.0% 59,566 +2.6% 58,037 +3.1%
LLJ Ljubljana, Slovenia 97.99% 80 +3.8% 1,307 +3.1% 1,268 -2.9%
LIM Lima, Peru 70% 1,321 +5.8% 15,659 +5.0% 14,913 +13.2%
BOJ Burgas, Bulgaria 60% 12 +28.8% 2,530 +2.0% 2,480 +9.4%
VAR Varna, Bulgaria 60% 24 +14.9% 1,387 +5.2% 1,319 +2.4%
AYT Antalya, Turkey 51% 669 +11.3% 27,979 +4.7% 26,716 +6.5%
LED St. Petersburg, Russia 35.5% 932 +8.5% 14,265 +11.0% 12,854 +15.0%
HAJ Hanover, Germany 30% 302 +2.2% 5,292 +1.1% 5,235 +1.1%
XIY Xi‘an, China 24.5% 2,234 +16.1% 29,177 12.0% 26,046 +13.1%
Traffic Insight Fraport Group Traffic Figures (above 10% stake)

Traffic Insight Frankfurt Airport Winter Flight Schedule 2014 / 2015
Fraport @ The 14th German Corporate Conference January 2015
Slide 10
Plus 2.2% seat offering upside - Intercont stronger with +3% LUFTHANSA movements decreasing due to SCORE program LUFTHANSA seat offering still increasing due to aircraft size Other airlines with increase in movements and seats
(e.g. Air Europe with larger aircraft, Qatar with A350 in 2015) New Airlines from summer schedule continuing
(like China Southern)

Slide 11
Fraport @ The 14th German Corporate Conference January 2015
Agenda
2014 & 2015 in a Nutshell
Traffic Insight
Terminal 3
External Activities
Outlook
Backup (Financials 9M 2014)
> 60
> 65
> 70
> 75
> 80
58
> 60 > 65
> 70
> 75
> 80
45.0
50.0
55.0
60.0
65.0
70.0
75.0
80.0
85.0
90.0
2011 2012 2013 2014 2015 2016 2017 2018 2019 2020 2021 2022 2023 2024 2025 2026 2027 2028 2029 2030
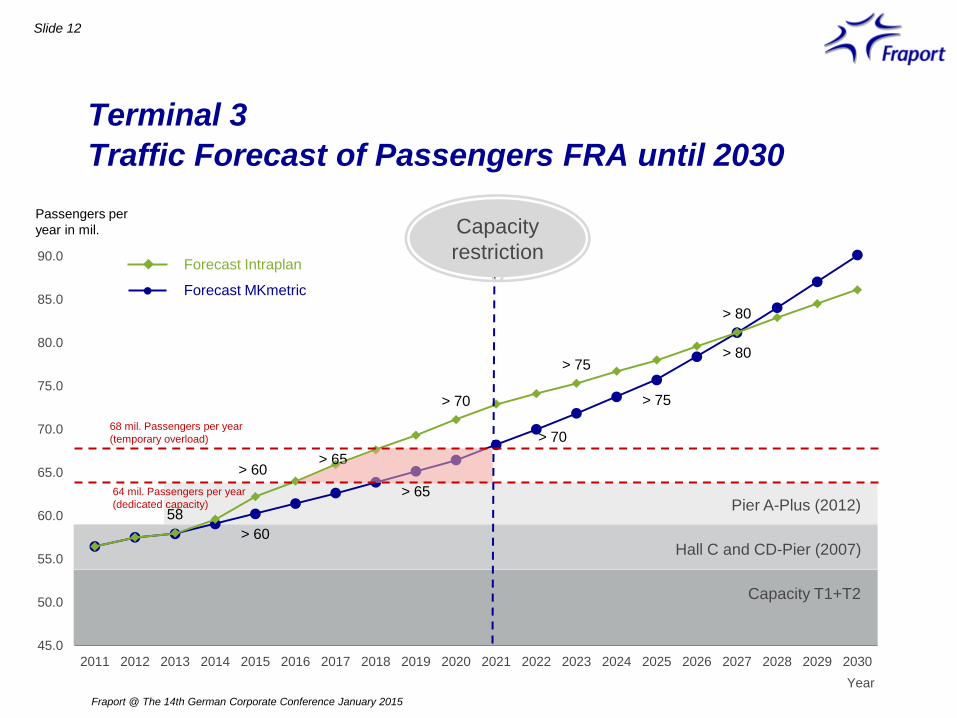
Terminal 3 Traffic Forecast of Passengers FRA until 2030
Slide 12
Fraport @ The 14th German Corporate Conference January 2015
64 mil. Passengers per year (dedicated capacity)
68 mil. Passengers per year (temporary overload)
Capacity T1+T2
Hall C and CD-Pier (2007)
Pier A-Plus (2012)
Year
Passengers per year in mil.
Forecast MKmetric
Forecast Intraplan
Capacity restriction

Terminal 3 Facts
Slide 13
Fraport @ The 14th German Corporate Conference January 2015
− Terminal capacities restricted from 2016/18 depending on traffic-growth, critical at the latest from 2021
− 68 mil. passengers possible in a temporary overload situation
− Given the restricted space in the northern airport area no construction alternatives possible on time and on budget
− Construction expected to start in 2015
− Additional dedicated capacity of 14 mil. to launch in winter schedule 2021
− Capex budget € 2.5 to 3.0 bn. in total − Capex peak around 2020 expected,
capex ongoing beyond inauguration − Detailed capex profile to be published
in our FY 2014 publication
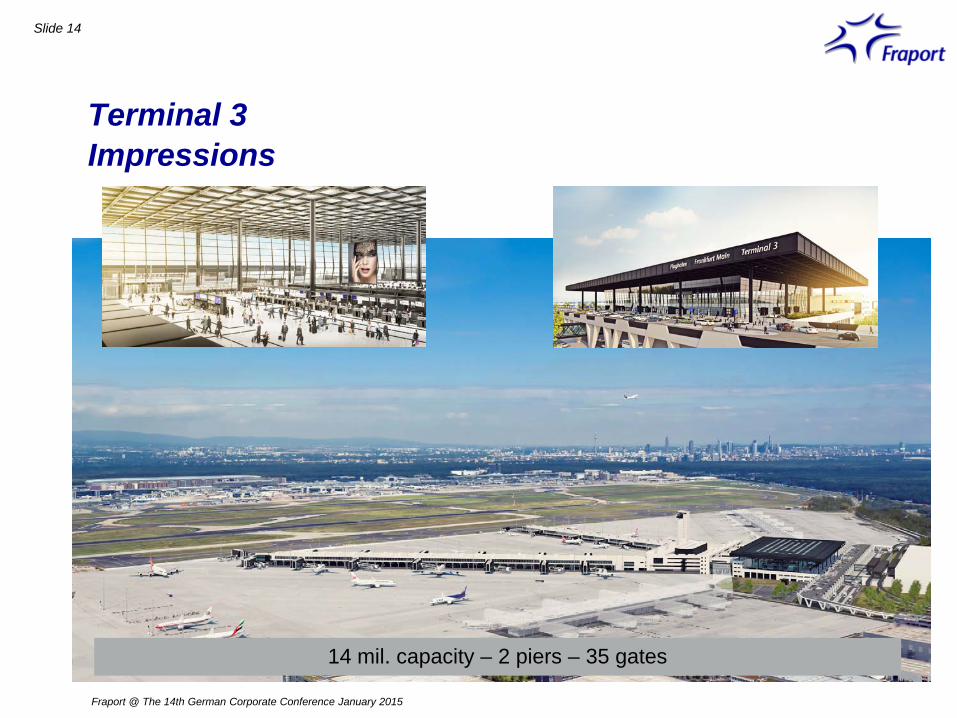
Terminal 3 Impressions
Slide 14
Fraport @ The 14th German Corporate Conference January 2015
14 mil. capacity – 2 piers – 35 gates

Slide 15
Fraport @ The 14th German Corporate Conference January 2015
Agenda
2014 & 2015 in a Nutshell
Traffic Insight
Terminal 3
External Activities
Outlook
Backup (Financials 9M 2014)
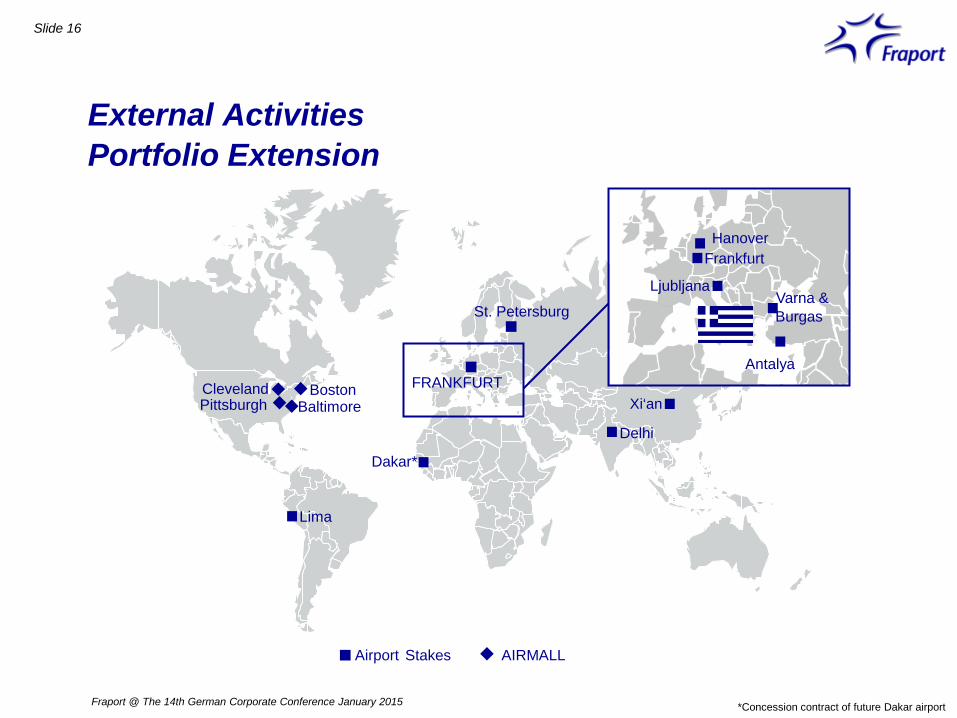
External Activities Portfolio Extension
Slide 16
*Concession contract of future Dakar airport
Lima
Dakar*
FRANKFURT
St. Petersburg
Xi‘an
Delhi
Airport Stakes AIRMALL
Antalya
Hanover Frankfurt
Varna & Burgas
Boston Baltimore
Cleveland Pittsburgh
Fraport @ The 14th German Corporate Conference January 2015
Ljubljana
Slide 17
Fraport @ The 14th German Corporate Conference January 2015
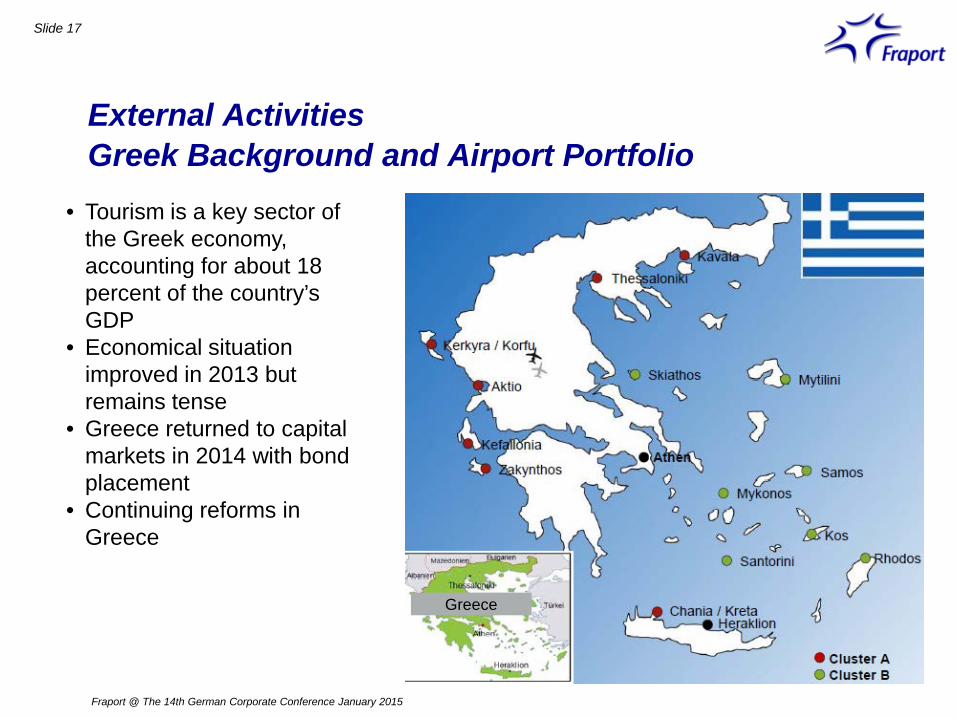
External Activities Greek Background and Airport Portfolio
Greece
• Tourism is a key sector of the Greek economy, accounting for about 18 percent of the country’s GDP
• Economical situation improved in 2013 but remains tense
• Greece returned to capital markets in 2014 with bond placement
• Continuing reforms in Greece

Slide 18
Fraport @ The 14th German Corporate Conference January 2015
External Activities Greek Airports in Detail
2013 Cluster B Total
Islands
Rhodes Kos Santorini Mykonos Mytilini Samos Skiathos
PAX (Mio.) 4.2 2.0 0.9 0.6 0.4 0.3 0.3 8.7
International 85% 91% 55% 60% 27% 60% 91% 79%
ATM 32,441 16,307 7,792 5,986 5,350 4,480 2,285 74.641 Runway (#) 1 1 1 1 1 1 1 7 Terminal (sqm) 49,150 5,905 3,710 8,500 2,500 8,850 6,400 85,015
Gates (#) 16 4 4 6 5 4 3 42
2013 Cluster A Mainland Island Total
Mainland Islands
Thessaloniki Aktio Kavala Kerkyra / Corfu Chania / Crete Zakinthos Kefallonia
Passengers (mil.) 4.2 0.3 0.2 2.1 2.1 1.0 0.4 4.7 5.6 10.4
International 65% 98% 69% 90% 84% 97% 92% - - 79%
ATM 39,681 3,054 2,804 16,258 15,022 7,388 3,946 45,539 42,614 88,153 Runway (#) 2 1 1 1 1 1 1 4 4 8 Terminal (sqm) 27,339 7,500 6,800 26,000 13,900 25,000 6,800 41,639 71,700 113,339
Gates (#) 24 5 6 7 8 8 3 35 26 61
3.1%CAGR 2003-2014
Very high share of international traffic
Growth in 2014 of 16.0% until 9M
Slide 19
Fraport @ The 14th German Corporate Conference January 2015
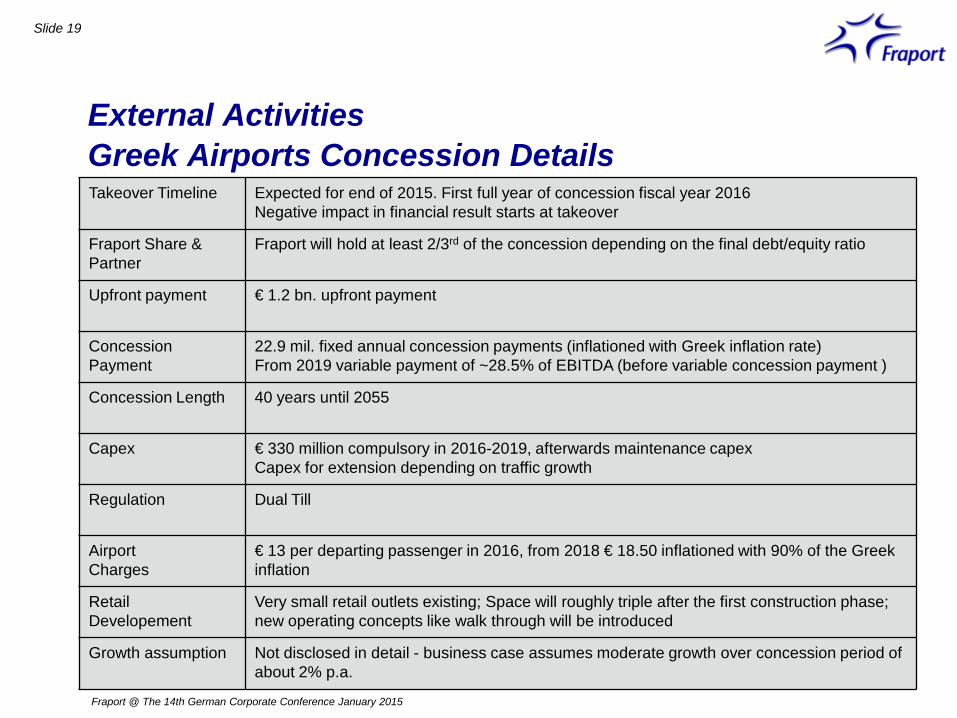
External Activities Greek Airports Concession Details Takeover Timeline Expected for end of 2015. First full year of concession fiscal year 2016
Negative impact in financial result starts at takeover
Fraport Share & Partner
Fraport will hold at least 2/3rd of the concession depending on the final debt/equity ratio
Upfront payment € 1.2 bn. upfront payment
Concession Payment
22.9 mil. fixed annual concession payments (inflationed with Greek inflation rate) From 2019 variable payment of ~28.5% of EBITDA (before variable concession payment )
Concession Length 40 years until 2055
Capex € 330 million compulsory in 2016-2019, afterwards maintenance capex Capex for extension depending on traffic growth
Regulation Dual Till
Airport Charges
€ 13 per departing passenger in 2016, from 2018 € 18.50 inflationed with 90% of the Greek inflation
Retail Developement
Very small retail outlets existing; Space will roughly triple after the first construction phase; new operating concepts like walk through will be introduced
Growth assumption Not disclosed in detail - business case assumes moderate growth over concession period of about 2% p.a.
Slide 20
Fraport @ The 14th German Corporate Conference January 2015
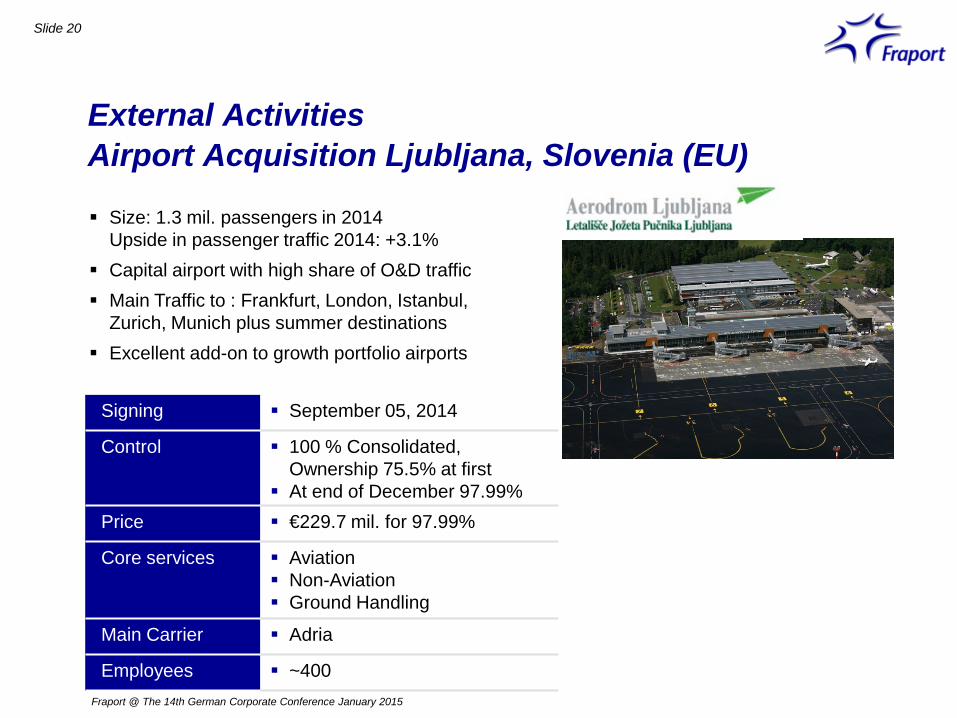
External Activities Airport Acquisition Ljubljana, Slovenia (EU) Size: 1.3 mil. passengers in 2014
Upside in passenger traffic 2014: +3.1% Capital airport with high share of O&D traffic Main Traffic to : Frankfurt, London, Istanbul,
Zurich, Munich plus summer destinations Excellent add-on to growth portfolio airports
Signing September 05, 2014
Control 100 % Consolidated, Ownership 75.5% at first
At end of December 97.99% Price €229.7 mil. for 97.99%
Core services Aviation Non-Aviation Ground Handling
Main Carrier Adria
Employees ~400

Slide 21
Fraport @ The 14th German Corporate Conference January 2015
External Activities Airport Acquisition Ljubljana, Slovenia (EU) Total Purchase price of € 229.7 mil. will be taken
from Fraports’ liquid funds Low capex profile as infrastructure in very good
shape, capacity optimization through our know-how
Company is debt free Very stable cash flows & dividend payments
expected
50%
20%
30%
Revenue EBITDA Net Profit
Key Financials 2013 Revenue Split 2013* 31
11 5
Ground Handling
Non-aeronautical
Airport Services
€ mil.
* Differences due to rounded figures possible

Slide 22
Fraport @ The 14th German Corporate Conference January 2015
External Activities Airmall Retail Acquisition USA
Signing / Closing July 23 / August 1, 2014
Control Consolidated, 100% owned
Core services Retail Property Development Leasing Operations Management Branding and Marketing
Founded 1991
Employees 28
Core segment Retail is expanded to the largest aviation market in the world
Visible and continuous contribution to EBITDA Stable cash flows guarantee start of payback period
immediately after takeover Unlocking of further growth potential by Fraport
Group network expertise
Slide 23
Fraport @ The 14th German Corporate Conference January 2015
External Activities Airmall Retail in Detail
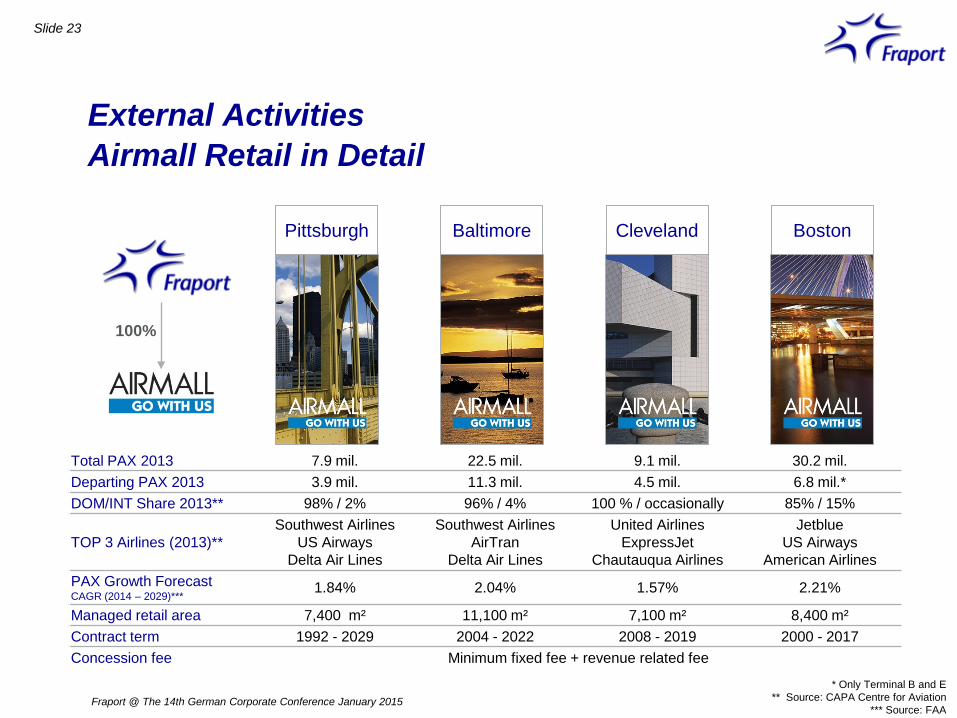
Total PAX 2013 7.9 mil. 22.5 mil. 9.1 mil. 30.2 mil. Departing PAX 2013 3.9 mil. 11.3 mil. 4.5 mil. 6.8 mil.* DOM/INT Share 2013** 98% / 2% 96% / 4% 100 % / occasionally 85% / 15%
TOP 3 Airlines (2013)** Southwest Airlines
US Airways Delta Air Lines
Southwest Airlines AirTran
Delta Air Lines
United Airlines ExpressJet
Chautauqua Airlines
Jetblue US Airways
American Airlines PAX Growth Forecast CAGR (2014 – 2029)***
1.84% 2.04% 1.57% 2.21%
Managed retail area 7,400 m² 11,100 m² 7,100 m² 8,400 m² Contract term 1992 - 2029 2004 - 2022 2008 - 2019 2000 - 2017 Concession fee Minimum fixed fee + revenue related fee
Pittsburgh Baltimore Cleveland Boston
100%
* Only Terminal B and E ** Source: CAPA Centre for Aviation
*** Source: FAA

Subtenants Passengers
Slide 24
Fraport @ The 14th German Corporate Conference January 2015
External Activities Airmall Business Model and Financials
55.0%
18.0%
16.0%
6.0% 4.0% 1.0%
EBITDA
Key Financials 2013 Revenue Split 2013*
News & Gift
Retail
Food & Beverage
Net Revenuess less concession fee
USD 9 million*
USD 14 million*
* Figures refer to US GAAP accounting
Services
Duty Free
Advertising
Business Model
Airport Authorities
Concession fee Rent Sales

Slide 25
Fraport @ The 14th German Corporate Conference January 2015
Agenda
2014 & 2015 in a Nutshell
Traffic Insight
Terminal 3
External Activities
Outlook
Backup (Financials 9M 2014)
Slide 26
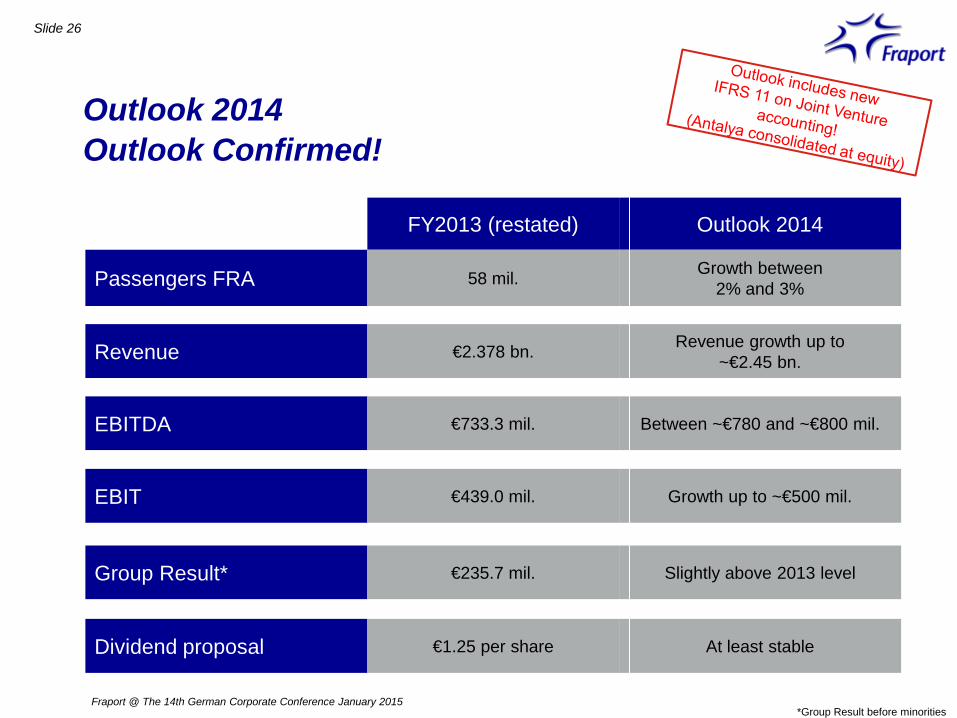
Outlook 2014 Outlook Confirmed!
FY2013 (restated) Outlook 2014
Passengers FRA 58 mil. Growth between 2% and 3%
Revenue €2.378 bn. Revenue growth up to ~€2.45 bn.
EBITDA €733.3 mil. Between ~€780 and ~€800 mil.
EBIT €439.0 mil. Growth up to ~€500 mil.
Group Result* €235.7 mil. Slightly above 2013 level
Dividend proposal €1.25 per share At least stable
Fraport @ The 14th German Corporate Conference January 2015 *Group Result before minorities

Thank you for your Attention! www.meet-ir.com

Slide 28
Fraport @ The 14th German Corporate Conference January 2015
Agenda
2014 & 2015 in a Nutshell
Traffic Insight
Terminal 3
External Activities
Outlook
Backup (Financials 9M 2014)

Group P&L 9M 2014
Traffic Growth translated in Financials
Slide 29
€ mil. 9M 14 9M 13 %
Revenue -excl. IFRIC 12
1,797 1,789
1,801 1,749
-0.2 2.3
EBITDA 621 584 6.4 EBIT 396 367 7.8 EBT 325 307 5.7 Group result 220 216 1.7 EPS in € 2.22 2.19 1.4
34.6% 32.4% 22.0% 20.4%
0%
25%
50%
EBITDA margin +2.2PP
•Top-line affected by less IFRIC 12 income, w/o EBITDA effect
•Underlying revenue up due to traffic performance
•Positive effects also from FRA pricing
•Lower opex a.o. from mild winter
•Solid increase in EBITDA and margin
•Negative financial result from market valuation of derivatives
•Group result and EPS up
Comments
9M 2014 9M 2013 9M 2014 9M 2013
EBIT margin +1.6PP
Fraport @ The 14th German Corporate Conference January 2015 Percent change based on unrounded figures

Group P&L 9M 2014
Good EBITDA Performance
Slide 30
EBITDA 9M 2013
Other revenue
Organic cost of materials
Personnel expenses
EBITDA 9M 2014
Organic revenue
Other opex
584 +20 -26
621 € mil.
+€37 mil.
-44
+44
IFRIC 12 revenue
IFRIC 12 cost of
materials
+40 +2 +2
30.8%
45.3%
4.5%
19.4% Aviation
Retail & Real Estate
External Activities & Services
Segment share in Group EBITDA 9M 2013
31.8%
42.5%
5.7%
20.0% Aviation
Retail & Real Estate
External Activities & Services
Segment share in Group EBITDA 9M 2014
Ground Handling
Ground Handling
Fraport @ The 14th German Corporate Conference January 2015 Due to roundings differences can occur, when summing up to Group EBITDA.

• Less interest income due to lower rates • Interest expenses flat on PY • At equity result key drivers:
• Good Antalya performance • No impact from negative Pulkovo result in
Fraport P&L as book value is 0 • Other result down due to market valuation of
derivatives
Group P&L 9M 2014
Group result up, despite Taxes & Financial result
Slide 31
Group result 9M 2013
EBITDA D&A Financial result
Taxes Group result 9M 2014
216 +37
-11 220 -9
-14
€ mil. +€4 mil.
€2.22 €2.19
EPS 9M 2013
EPS 9M 2014
+€0.03
€ mil 9M 14 9M 13 %
Interest income 27 34 -20.1
Interest expenses -135 -136 -0.7
At equity result 45 34 33.2
Other result -8 8 -
Financial result -71 -60 -
Split of financial result Comments
Fraport @ The 14th German Corporate Conference January 2015 Due to roundings differences can occur, when summing up to Group result.
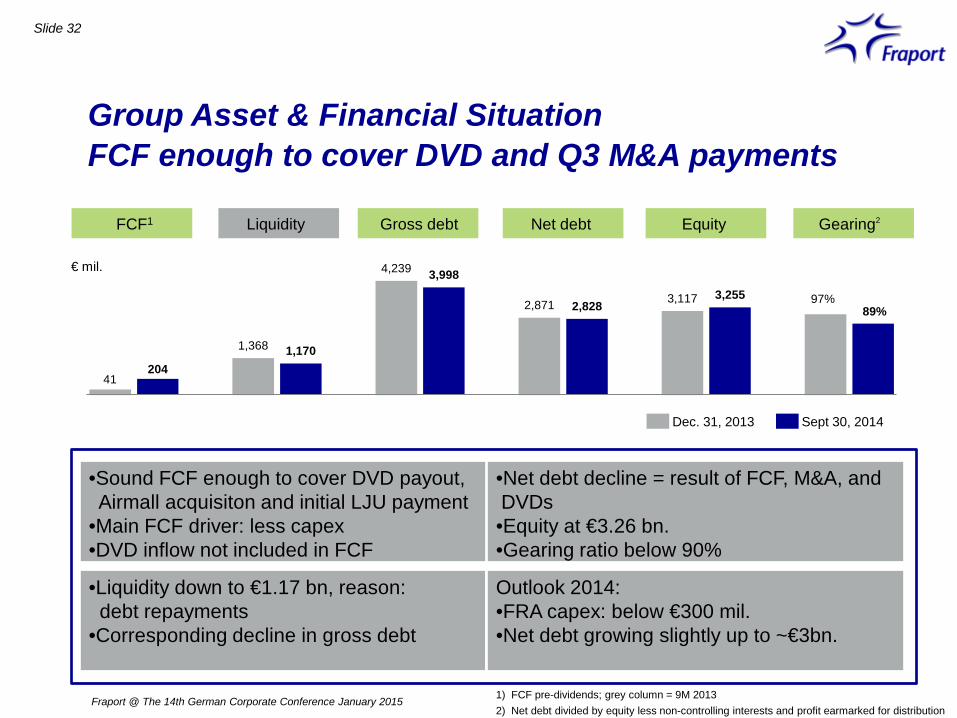
Slide 32
41 204
1,368 1,170
4,239 3,998
2,871 2,828 3,117 3,255 97% 89%
Group Asset & Financial Situation FCF enough to cover DVD and Q3 M&A payments
Sept 30, 2014 Dec. 31, 2013
€ mil.
2 Liquidity Gross debt Net debt Equity Gearing
•Sound FCF enough to cover DVD payout, Airmall acquisiton and initial LJU payment •Main FCF driver: less capex •DVD inflow not included in FCF
•Net debt decline = result of FCF, M&A, and DVDs •Equity at €3.26 bn. •Gearing ratio below 90%
•Liquidity down to €1.17 bn, reason: debt repayments •Corresponding decline in gross debt
Outlook 2014: •FRA capex: below €300 mil. •Net debt growing slightly up to ~€3bn.
Fraport @ The 14th German Corporate Conference January 2015 1) FCF pre-dividends; grey column = 9M 2013 2) Net debt divided by equity less non-controlling interests and profit earmarked for distribution
FCF1
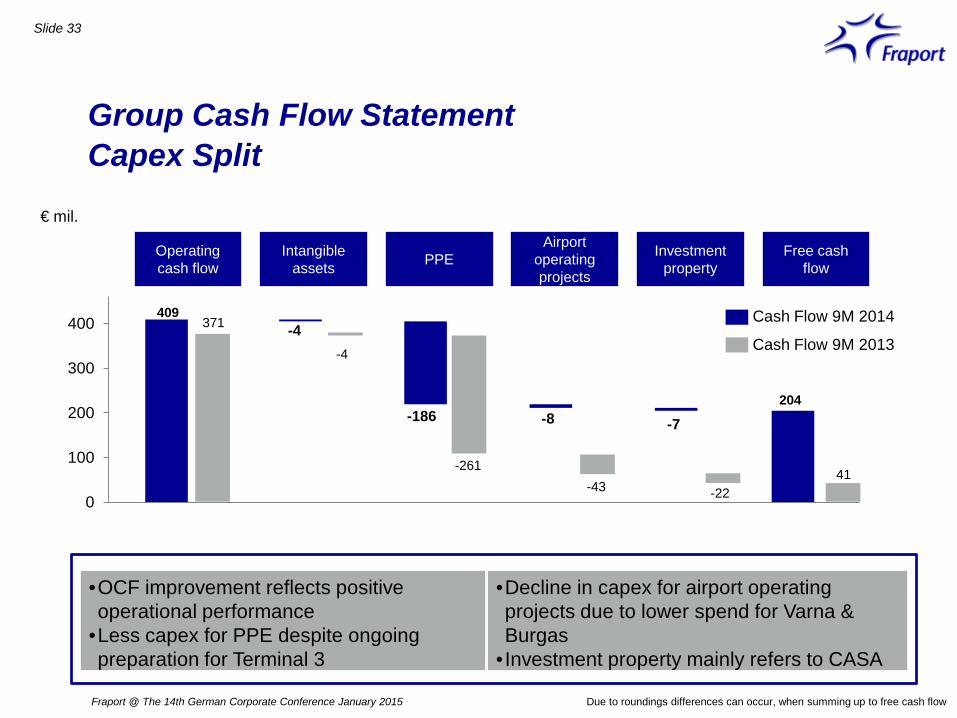
Slide 33
Group Cash Flow Statement Capex Split
€ mil.
PPE Investment property
Free cash flow
Operating cash flow
Intangible assets
Airport operating projects
Cash Flow 9M 2014
Cash Flow 9M 2013
409
204
0
100
200
300
400 371
-4
-261 -43
41 -22
-4
-186 -8 -7
•Decline in capex for airport operating projects due to lower spend for Varna & Burgas
• Investment property mainly refers to CASA
Fraport @ The 14th German Corporate Conference January 2015
•OCF improvement reflects positive operational performance
•Less capex for PPE despite ongoing preparation for Terminal 3
Due to roundings differences can occur, when summing up to free cash flow

Segment Aviation Growing Operations
Slide 34
€ mil. 9M 14 9M 13 %
Revenue Airport charges Security serv. Other
673 558
83 33
642 530
75 37
4.9 5.3
10.8 -12.6
EBITDA 198 180 9.9 EBIT 110 94 17.3 Employees 6,070 6,239 -2.7
29.4% 28.0%
16.3% 14.6%
0%
20%
40%
EBITDA margin +1.4PP
9M 2014 9M 2013 9M 2014 9M 2013
EBIT margin +1.7PP
•Revenue increase due to FRA traffic & higher aviation charges as of Jan. 1, 2014
•Security rev. helped by price effects
•Tailwind in EBITDA from less costs for winter services & energy supply
•Strong EBIT increase
Comments
55.3%
16.5%
5.0% 4.6%
1.4% 12.3%
4.9%
Passenger charges
Security services Other
Revenue split 9M 2014
Landing ch.
Parking ch.
Security ch.
Fraport @ The 14th German Corporate Conference January 2015 Percent change based on unrounded figures
Emission ch.

Segment Retail & Real Estate
Poor Retail Sales dampened 9M Results
Slide 35
€ mil. 9M 14 9M 13 %
Revenue
Retail Real Estate Parking Other
335 141 133
58 3
347 145 134
57 11
-3.3 -2.7 -0.7 1.8
-72.6
EBITDA 264 265 -0.2 EBIT 202 204 -0.7 Employees 615 599 2.7
78.9% 76.3% 60.3% 58.7%
0%
30%
60%
90%
EBITDA margin +2.6PP
EBIT margin +1.6PP
•Dowturn in revenue due to weak performance in retail and other revenue
•Real Estate down due to lower need for utilities from mild winter
•Offsetting effects on cost side
•EBITDA and EBIT down on PY
Comments
39.8%
42.1%
17.2%
0.9%
Retail
Real Estate
Other
Revenue split 9M 2014
Parking
Fraport @ The 14th German Corporate Conference January 2015 Percent change based on unrounded figures
9M 2014 9M 2013 9M 2014 9M 2013
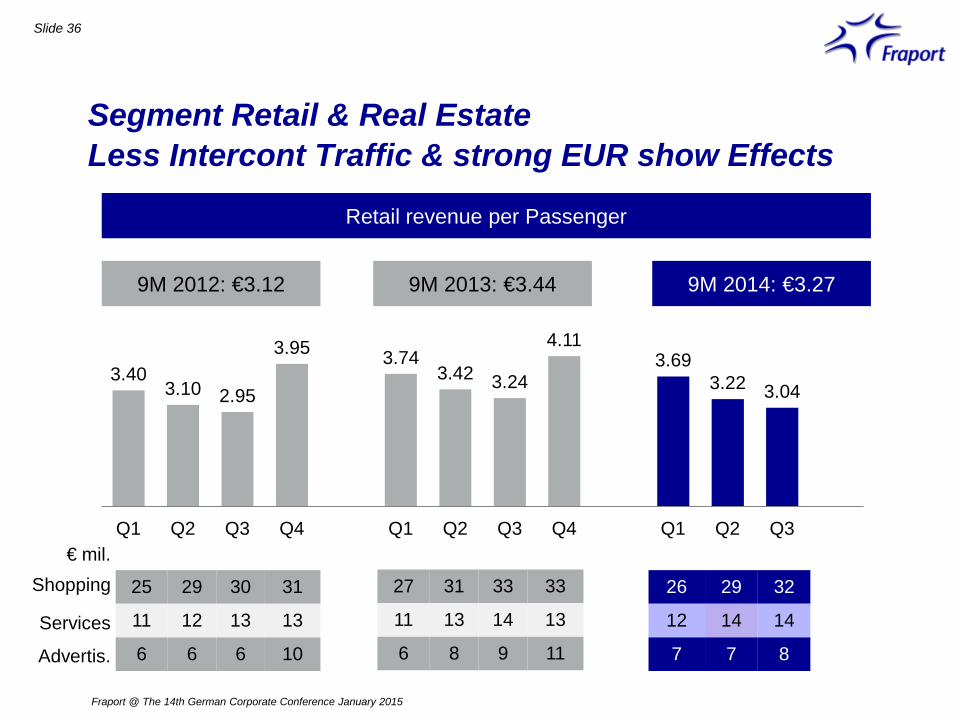
Segment Retail & Real Estate
Less Intercont Traffic & strong EUR show Effects
Slide 36
25 29 30 31
11 12 13 13
6 6 6 10
3.40 3.10 2.95
3.95 3.74 3.42 3.24
4.11 3.69
3.22 3.04
Q1 Q2 Q3 Q4 Q1 Q2 Q3 Q4 Q1 Q2 Q3
Retail revenue per Passenger
9M 2012: €3.12 9M 2013: €3.44 9M 2014: €3.27
27 31 33 33
11 13 14 13
6 8 9 11
26 29 32 33
12 14 14 13
7 7 8 11
€ mil.
Shopping
Services
Advertis.
Fraport @ The 14th German Corporate Conference January 2015

Segment Ground Handling Operational Increase, EBIT positive
Slide 37
€ mil. 9M 14 9M 13 %
Revenue Ground Handl. Infrastructure
496 287 209
490 289 201
1.3 -0.8 4.2
EBITDA 35 26 33.3
EBIT 7 -3 >100
Employees 8,954 8,962 -0.1
7.1% 5.4%
1.5% -%
0%
5%
10%
EBITDA margin +1.7PP
EBIT margin +1.5PP
•Growing revenue due to infrastructure services helped by price effects
•Despite wage increase EBITDA up, reason: optimized staff mix
•EBIT increased into positive
Comments
57.8%
42.2% Ground Handling
Revenue split 9M 2014
Central Infrastructure
Fraport @ The 14th German Corporate Conference January 2015 Percent change based on unrounded figures
9M 2014 9M 2013 9M 2014 9M 2013

Segment External Activities & Services Sound underlying Operations lift up EBITDA
Slide 38
€ mil. 9M 14 9M 13 %
Revenue -excl. IFRIC 12
293 285
323 271
-9.3 5.3
EBITDA 124 113 10.0
EBIT 77 73 6.1
Employees 4,687 4,848 -3.3
42.5% 35.0%
26.3% 22.5%
0%
25%
50%
EBITDA margin +7.5PP
EBIT margin +3.8PP
•Ongoing growth in Lima
•Good summer season in Varna & Burgas
•Airmall consolidated as of Aug. 1
•Higher D&A from Terminal inaugurations in Varna & Burgas
Comments
53.1%
18.8%
2.9%
25.2%
Lima
Revenue split 9M 2014
Others
Twin Star
Fraport @ The 14th German Corporate Conference January 2015 Percent change based on unrounded figures
9M 2014 9M 2013 9M 2014 9M 2013
Airmall

External Activities Antalya with good Traffic in 2014, but Russia weakening
Fraport @ The 14th German Corporate Conference January 2015
Slide 39
18.3
20.7 20.7 22.1 23.4
10
12
14
16
18
20
22
24
26
2010 2011 2012 2013 2014
Passengers 9M in mil
CAGR 2010-2014
6.3%
33%
25%
30%
Russia
Germany
UK
Sweden
Ukraine
Belgium
Other
− Very good traffic development in Antalya, both in 2014 and in recent years
− Russian share with +13% upside in 9M2014, Germany only +3%
− Russia weakening since September 2014 (-8% in Sep 14 vs.13)
− Outlook 2015: Russian traffic challenging
Influence of Russian Traffic
2-4% each
Share of international passengers 9M2014

External Activities
Lima Airport*
Slide 40
€ mil. 9M 14 9M 13 %
Revenue Airport charges Retail -excl. IFRIC 12
156 82 25
149
155 81 25
145
0.6 1.2 1.9 3.0
EBITDA Margin Underlying margin
57 36.5% 38.1%
54 34.9% 37.2%
5.4 - -
EBIT Margin Underlying margin
46 29.5% 30.8%
44 28.3% 30.2%
5.0 - -
Net result 22 19 18.6
Fraport @ The 14th German Corporate Conference January 2015 * Figures refer to IFRS accounting, not local GAAP, percent changes based on unrounded figures

External Activities
Twin Star – Varna & Burgas Airport
Slide 41
€ mil. 9M 14 9M 13 %
Revenue Airport charges Retail -excl. IFRIC 12
55 32
8 54
89 29
5 47
-38.3 11.4 75.5 14.2
EBITDA Margin Underlying margin
35 64.0% 65.4%
30 33.7% 63.9%
16.9 - -
EBIT Margin Underlying margin
27 48.5% 49.6%
25 27.5% 52.0%
9.0 - -
Net result 19 19 2.7
Fraport @ The 14th German Corporate Conference January 2015 Percent change based on unrounded figures

Slide 42
€ mil. 9M 14 9M 13 %
Revenue Airport charges Retail
272 155 106
264 147 105
3.3 5.0 1.1
EBITDA Margin
241 88.4%
231 87.7%
4.2 -
EBIT Margin
167 61.2%
157 59.7%
6.0 -
Net result 85 70 22.3
External Activities
Antalya Airport – Figures before Consolidation
Fraport @ The 14th German Corporate Conference January 2015 Percent change based on unrounded figures

Slide 43
Outlook Cash Flow 2014 Further Improvement of FCF expected
-200
0
200
400
600
€ mil.
Operating Cash Flow Capex FRA
Capex External
Act.
Investment property
Free Cash Flow Dividend Change in
Net debt
Cash Flow 2013 INCL. IFRS 11
2014 Projection
Growth in line with
operations, balance sheet
dilutions possible
Below 2013 Below 2013
~stable
Improvement At least stable
Impact on net debt could be
stable/positive
454 -360
-54 -23 17 -115 -98
Fraport @ The 14th German Corporate Conference January 2015
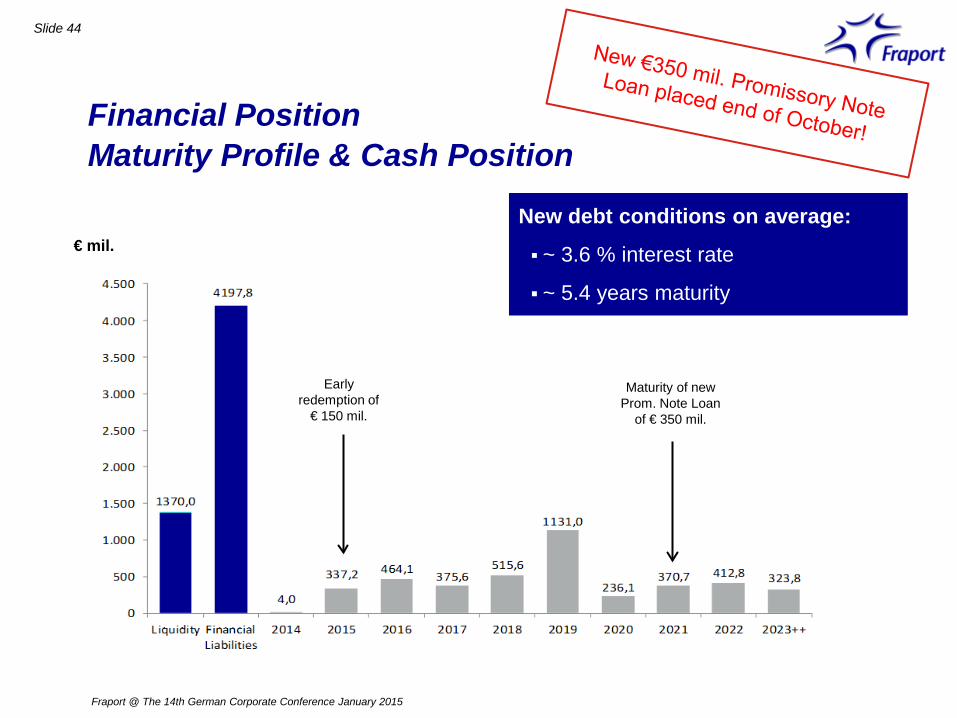
Financial Position Maturity Profile & Cash Position
Slide 44
€ mil. New debt conditions on average:
~ 3.6 % interest rate
~ 5.4 years maturity
Early redemption of
€ 150 mil.
Maturity of new Prom. Note Loan
of € 350 mil.
Fraport @ The 14th German Corporate Conference January 2015

Investor Relations Team Contact Details
Fraport AG Frankfurt Airport Services Worldwide 60547 Frankfurt am Main www.meet-ir.com +49 69 690 – 74842
Stefan J. Rüter Head of Finance & Investor Relations
+49 69 690-74840 [email protected]
Svenja Ebeling Investor Relations Assistant +49 69 690-74842
Marc Poeschmann Manager Investor Relations
+49 69 690-74845 [email protected]
Florian Fuchs Manager Investor Relations & Financial Reporting
+49 69 690-74844 [email protected]
Tanja Nagel Manager Investor Relations & Financial Reporting
+49 69 690-74846 [email protected]
Fraport @ The 14th German Corporate Conference January 2015


