California THE 1985-86 BUDGET: I\ I PERSPECTIVES AND ISSUES Report of the Legislative Analyst to the Joint Legislative Budget Committee HON. DAVID ROBERTI President pro Tempore of the Senate HON. WILLIE L. BROWN, JR. Speaker of the Assembiy Members of the Committee SENATE Walter W. Stiern, Chairman Alfred E. Alquist Robert G. Beverly William Campbell Bill Greene Milton Marks Nicholas C. Petris WILLIAM G. HAMM Legislative Analyst ASSEMBLY Richard Robinson, Vice Chairman Art Agnos Ernest L. Konnyu William Leonard John Vasconcellos Maxine Waters Phillip D. Wyman
Transcript
California~egislature
THE 1985-86 BUDGET:I\ IPERSPECTIVES
AND ISSUES
Report of theLegislative Analystto theJoint Legislative
Budget CommitteeHON. DAVID ROBERTI
President pro Temporeof the Senate
HON. WILLIE L. BROWN, JR.
Speaker of the Assembiy
Members of the Committee
SENATEWalter W. Stiern, ChairmanAlfred E. AlquistRobert G. BeverlyWilliam CampbellBill GreeneMilton MarksNicholas C. Petris
WILLIAM G. HAMMLegislative Analyst
ASSEMBLYRichard Robinson, Vice ChairmanArt AgnosErnest L. KonnyuWilliam LeonardJohn VasconcellosMaxine WatersPhillip D. Wyman
Joseph RaddingSusanne RagenRaymond M. ReinhardSarah L. ReusswigMichael Martin ReynaHenry Sepulveda, Jr.Jeffrey P. ShellitoAllan SolaresPamela SpratlenMark D. TaylorTitus S. ToyamaRobert TurnagePaul WarrenCarol WilkinsKate WilliamsMargaret Zentner
Maria PonceSenita Robinson-TaylorIgnacio SalinasKelly SmithJim StahleyJ'Ann WicksKathi Willia.'lls
Carol BinghamHadley Johnson, Jr.Peter W. Schaafsma
Nancy Rose AntonNicholas BartschPhyllis BramsonCraig BreedloveJocelyn BurtonMarilyn E. BybeeAnn CarberryGerald ConcklinCraig CornettChi-Ming Dana CurryWilDaviesJohn DeckerLyle DefenbaughRobert B. EgelSusan P. EhrlichRichard Figueroa, Jr.
Helen Blanas
Victoria AlbertJoanne CallawayJudy CashnerNancy ConcklinMarilyn J. DavisTanya ElkinsMargaret GipeHelen Kiehn
STAFFWilliam G. Hamm-Legislative AnalystJohn L. Vickerman-Chief Deputy
Thomas J. Dooley-DeputyKenneth A. Carter-Deputy
Principal Program AnalystsHal Geiogue Elizabeth G. HillWayne Keithley Daniel P. RabovskyCheryl Stewart Mac Taylor
Gerald Beavers-Principal Capital Outlay AnalystJon David Vasche-Senior Economist
Program AnalystsJudy A. FitzgeraldMichael GenestJarvio GreviousRandy HodginsRichard J. HoldenJoan KeeganRichard KellerCharles LiebermanR. Stuart MarshallDavid Maxwell-JollyPaula A. MishimaRobert MiyashiroKaren NeuwaldMichael NussbaumHarry OsborneRick Pratt
Program Technicianphillip R. Dyer
Administrative AssistantsJean Fernlund Cheryl Firenze
Support StaffNona KimmelKathie LambertFrank E. MarezLenora MartinezRosetta L. MorrisElizabeth T. O'NeillCarol Perrin
CONTENTSPage
TABLES ;...................... v
CHARTS.................................................. vii
INTRODUCTION 1
PART ONE
STATE FINANCES IN 1985...................... 5Ji'iscal Situation Facing the
Legislature 7General Fund Condition
Improves in 1983-84 and1984-85.............................................. 9
General Fund Condition for1985-86.............................................. 10
The Long-Term Fiscal Outlook 13General Fund Income 13General Fund Expenditure
Growth 14General Fund Condition 15
PART TWO
PERSPECTIVES ON THE 1985-86BUDGET 19
Expenditures in 1985-86...................... 21Total State Spending Plan 21Tax Expenditures 28Controlling Expenditures 29Major Components of the State
Budget.............................................. 31Reserve for Economic
Regulation of Financial Services ..Comparable Worth .
Page
586061
~88919198
99103
103
106
113115
115127139145
145
159
168
174180187
TABLESFiscol Situotion Focing the Legis/oture Page
1. Trend in General Fund Revenues, Expenditures and the Surplus, 1976-77through 1985-86 8
2. Change in General Fund Condition, 1983--84 and 1984-85 9
The Long-Term Fiscol Outlook
3. Condition of the General Fund, 1985-86 through 1987-88.......................................... 14
Expenditures
4. Total State Spending Plan, 1983--84 through 1985-86.................................................... 215. Annual Change in General Fund Expenditures, 1973-74 through 1981Hl6............ 236. Federal Fund Expenditures as a Percent of Total State Expenditures, 1976-77
through 1985-86 247. Federal Funds Changes, by Program, 1984-85 and 1985-86 258. Estimated Total State and Local Government Expenditures, 1982-83 through
1984-85 289. State Tax Expenditures, 1985-86 29
10. Impact of Article XIII B on the State, 1983--84 through 1985-86 3011. Proposed and Actual General Fund Expenditures, 1974-75 through 1984-85........ 3112. General Fund and Special Fund Expenditures, by Function, 1983--84 through
1985-86 3213. Major General Fund-Supported Local Assistance Programs, Providing Aid to
Individuals, 1983--84 through 1985-86 3514. Major General Fund-Supported Local Assistance Programs, Providing Aid to
Local Governments, 1983--84 through 1985-86............................................................ 3615. General Fund Cost-of-Living Increases, 1984-85 and 1985-86.................................... 3816. Expenditures for Health, Welfare and Education as a Percent of Total General
Fund Expenditures, 1985-86 4117. Estimated General Fund Program Changes, 1984-85 and 1981Hl6 42
Revenues
18. Revenue Summary, General Fund and Special Funds, 1983--84 through 1985-86 4619. Department of Finance's Economic Outlook for California and the Nation,
1984 through 1986 4920. Accuracy of Economic Forecasts for California in 1984 5121. Trends in Factors Influencing National Inflation, 1980 through 1986...................... 5422. The Economic Outlook for 1985 5723. The Department of Finance's Track Record for Forecasting Revenues in
1983--84 and 1984-85 5924. Discrepancies Between Estimated and Actual General Fund Revenues
Attributable to Economic and Technical Factors, 1973-74 through 1983--84...... 6025. State Revenue Collections, 1983--84 through 1985-86.................................................... 6226. Estimates of Income Tax "Elasticity" and Its Determinants, 1983 through 1986.. 6527. Historical Trends in Taxable Sales in California, 1968 through 1986........................ 6728. Effects of Tax Law Changes on Inheritance, Gift and Estate Tax Revenues,
1980-81 through 1985-86 7229. Legislative Analyst's Revenue Estimates Using Department of Finance
Economic Assumptions, 1984-85 and 1985-86 76
v
Page30. Alternative Economic Outlooks Prepared by the Department of Finance, 1985
and 1986................................................................................................................................ 7731. Revenue Effects of Alternative Department of Finance Economic Forecasts,
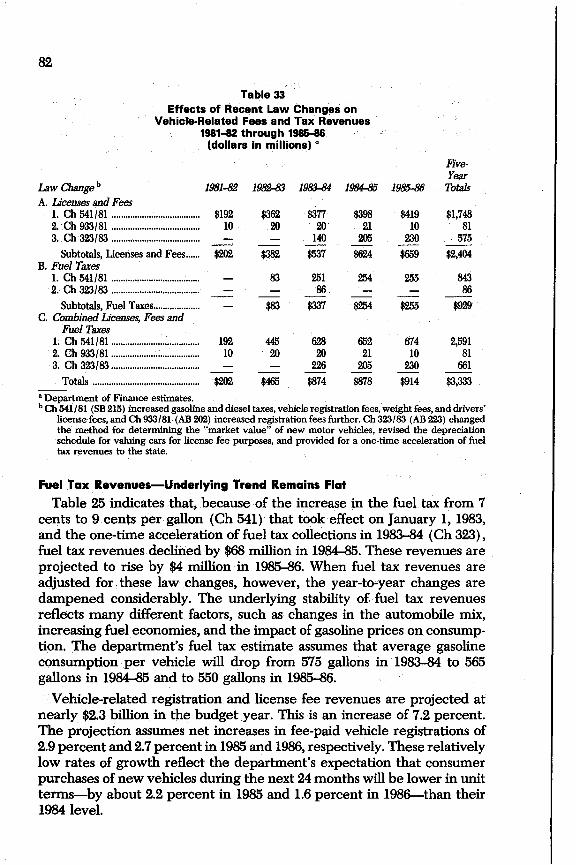
19~ and 1985-86 7832. Summary of Special Fund Revenues, 1985-86................................................................ 8033. Effects of Recent Law Changes on Vehicle-Related Fees and Tax Revenues,
1981-82 through 1985-86 8234. Proposed Distribution of Special Fund Revenues From the Four Major
Sources, 1985-86............ 8535. Long·Term Revenue Projections, 1985-86 through 1987-88 90
State and Local Borrowing36. General Obligation Bonds of the State of California, As of December 31, 1984 .. 9237. General Fund Debt Service, 1982-83 through 1985-86................................................ 9338. Selected Bond Fund Expenditures, 1983-84 through 1985-86.................................... 9439. State Agency Revenue Bonds, As of December 31, 1984 95
The State's Work Force40. The State Work Force, by Function, 1983-84 through 1985-86 10341. Trends in California Employment and Population, 1965-Q6 through 1985-86
(selected years) 107
Revenue Issues42. Apportionment Factors and Income Subject to Taxation Under the Unitary
Method, Water's Edge Versus Worldwide Combination 12043. State Transportation Program Fund Condition, 1985-86 through 1989-90 12944. Transportation Planning and Development Account, Sales Tax Revenue
Transfers, 1985-86 through 1989-90 13245. Transportation Funding, Potential Revenue Generated by Various Options,
1985-86 through 1989-90 13546. Revenue Impact for Various TP and D Funding Options, 1985-86 through 1989-90 137
Expenditure Issues47. State Personnel-Years, 1977-78 through 1985-86............................................................ 14548. Changes in Personnel-Years for 19~, Between January 10, 1984 and January
10, 1985 15149. Adjusted Net Salaries and Wages, 1984-85 and 1985-86.............................................. 15550. Funding for Salaries and Benefits That Should be Reduced If the Legislature
Approves Proposed Personnel Reductions 15651. Personnel-Years Replaced or Avoided in 1985-86 As a Result of New Contract
Proposals 16052. Estimates of Ten-Year Funding Shortfalls for California's Infrastructure,
Compiled by the Governor's Task Force on Infrastructure Review.................... 17053. Percent of Women in the State Work Force, by Major Job Categories, 1975,
1981, and 1984...................................................................................................................... 190
vi
CHARTSFi.elll Situlltilln Flleing the Legi.lllture Page
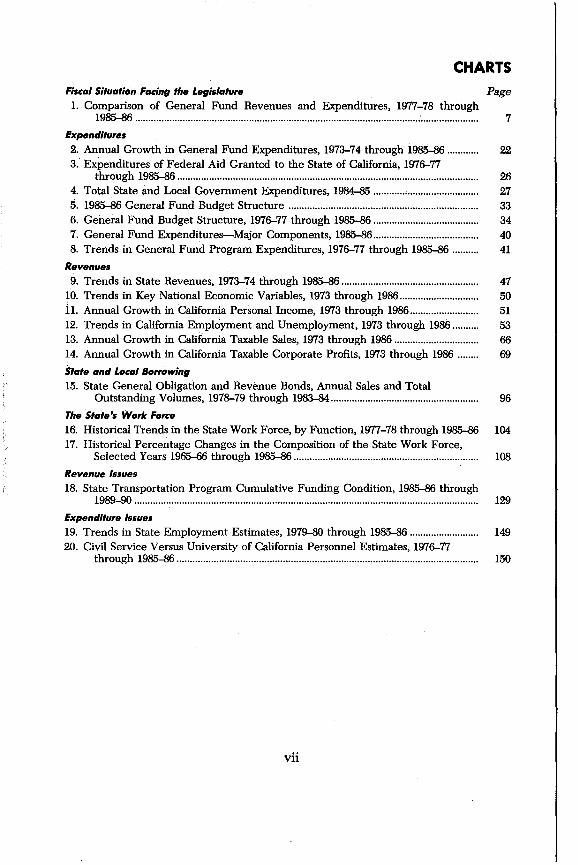
1. Comparison of General Fund Revenues and Expenditures, 1977-78 through1985-86 :...................... 7
Expenditure.2. Annual Growth in General Fund Expenditures, 1973-74 through 1985-86 223.' Expenditures of Federal Aid Granted to the State of California, 1976-77
through 1985-86 264. Total State and Local Government Expenditures, 1984-85 275. 1985-86 General Fund Budget Structure 336. General Fund Budget Structure, 1976-77 through 1985-86 347. General Fund Expenditures-Major Components, 1985-86........................................ 408. Trends in General Fund Program Expenditures, 1976-77 through 1985-86 .......... 41
Revenue.9. Trends in State Revenues, 1973-74 through 1985-86 ,..................................... 47
10. Trends in Key National Economic Variables, 1973 through 1986.............................. 50iI. Annual Growth in California Personal Income, 1973 through 1986.......................... 5112. Trends in California Employment and Unemployment, 1973 through 1986.......... 5313. Annual Growth in California Taxable Sales, 1973 through 1986 6614. Annual Growth in California Taxable Corporate Profits, 1973 through 1986 69
Stllte lind Loelll Borrowing15. State General Obligation and Revenue Bonds, Annual Sales and Total
Outstanding Volumes, 1978-79 through 1983-84........................................................ 96
The Stllte'. Work Foree16. Historical Trends in the State Work Force, by Function, 1977-78 through 1985-86 10417. Historical Percentage Changes in the Composition of the State Work Force,
Selected Years 196:H>6 through 1985-86...................................................................... 108
Revenue I..ue.18. State Transportation Program Cumulative Funding Condition, 1985-86 through
1989-90 129
Expenditure I..ue.19. Trends in State Employment Estimates, 1979-80 through 1985-86 14920. Civil Service Versus University of California Personnel Estimates, 1976-77
through 1985-86 150
vii
1
INTRODUCTION
The purpose of this document is to assist the Legislature in setting it~
priorities and reflecting these priorities in the 1985 Budget Act. It seeksto accomplish this purpose by (1) providing perspectives on the state'sfiscal condition and the budget proposed by the Governor for 1985-86 and(2) identifying some of the major issues facing the Legislature in 1985. Assuch, this document is intended to complement the Analysis ofthe 1985-86Budget Bill, which contains our traditional item-by-item review of theGovernor's Budget.
The Analysis continues to report the results of our detailed examinationof all programs and activities funded in the Governor's Budget. It alsocontains our recommendations on the various amounts proposed in theBudget Bill, as well as our recommendations for legislative changes in thestatutory provisions governing individual programs and activities. In contrast, this document presents an analytical overview of the state's fiscalcondition. The recommendations included herein cut across program oragency lines, and do not necessarily fall under the jurisdiction of a singlefiscal subcommittee.
The 1985-86 Budget: Perspectives and Issues is divided into three parts.
Part One, "State Finances in 1985," provides a perspective on the state'scurrent fiscal situation. Part One is divided into two sections:
• Fiscal Situation Facing the Legislature, which discusses the state'sGeneral Fund condition in 1984 and 1985, and
• The Long-Term Fiscal Outlook, which discusses the economic outlookfor the state through 1987-88.
Part Two, "Perspectives on the 1985-86 Budget," presents data on thebudget as a whole-expenditures, revenues and the fiscal condition ofstate and local governments-to provide a perspective on the budgetissues that the Legislature will face in 1985. Part Two is divided into foursections:
• Expenditures, which details the total spending plan for the state fromall funding sources and highlights the major changes in program activities proposed by the Governor;
• Revenues, which discusses the various sources of income to the state,as well as the economic circumstances that will influence the level ofrevenues in the current and budget year;
• State and Local Borrowing, which discusses the types and volume ofborrowing being done by the state and local governments; and
• The State's Work Force, which analyzes the reasons for changes in thestate's work force in 1985-86. It also examines historical trends thataccount for the current functional composition of state employment.
2
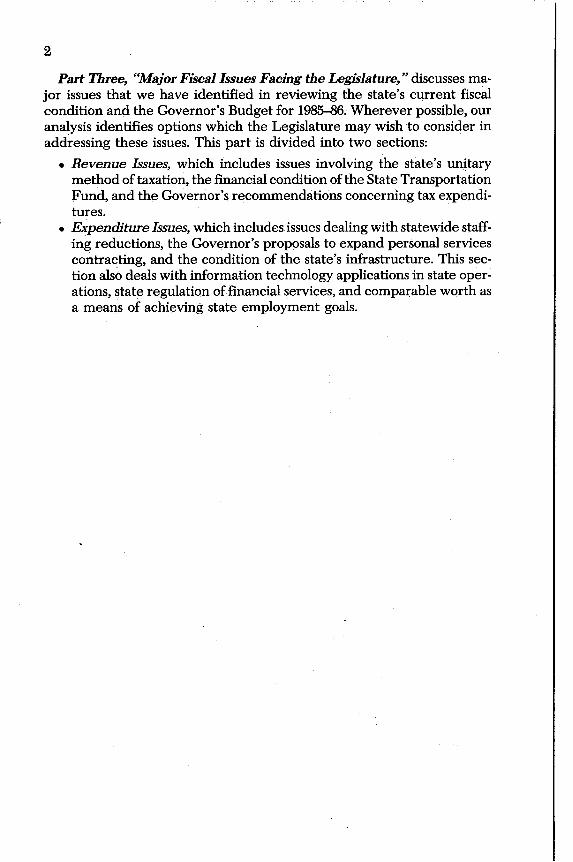
Part Three, "Major Fiscal Issues Facing the Legislature," discusses major issues that we have identified in reviewing the state's current fiscalcondition and the Governor's Budget for 1985-86. Wherever possible, ouranalysis identifies options which the Legislature may wish to consider inaddressing these issues. This part is divided into two sections:
• Revenue Issues, which includes issues involving the state's un~tary
method of taxation, the financial condition of the State TransportationFund, and the Governor's recommendations concerning tax expenditures.
• Expenditure Issues, which includes issues dealing with statewide staffing reductions, the Governor's proposals to expand personal servicescontracting, and the condition of the state's infrastructure. This Section also deals with information technology applications in state operations, state regulation offinancial services, and comparable worth asa means of achieving state employment goals.
Part One
ANCES
Due to the continued expansion of the California economy, the Governor has been able to present the Legislature with a budget for 1985-86 thatprovides for' both significant expansions in state-funded services and ahealthy reserve for contingencies. In terms of purchasing power, the levelof General Fund revenues projected for 1985-86 is 1.3 percent higher thanthe level of revenues estimated for the current year. Because a substantialportion of these revenues will not have to be used to replenish the reserve,as was necessary in the current year, expenditures (in inflation-adjusteddollars) can grow by even more-almost 3.9 percent. Thus, the short-termoutlook for the state's General Fund is reasonably bright.
This part of the Perspectives and Issues provides a brief overview of thestate's fiscal condition in 1984 and 1985. It also discusses the state's budgetary prospects beyond the upcoming fiscal year. A more detailed discussionof revenues and expenditures appears in Part Two of this document.
7
Fiscal. Situation Facing the LegislatureTable 1 provides information on General Fund revenues, expenditures
and the end-of-year balance for each of the last 10 years. Trends in GeneralFund revenues and expenditures are illustrated in Chart 1. If the budgetestimates prove to be accurate, 19~6will he the third year in a row inwhich General Fund revenues have exceeded expem:litures, after fiveyears in which the reverse was true. It would also be the third year in arow that the General Fund ended the year in the black, rather than thered.
The Governor's spending program for 1985--86 would leave the GeneralFund with a positive balance exceeding $1 billion on June 30, 1986-upfrom $985 million at the end of the current year. These funds would beretained in the Reserve for Economic Uncertainties, in order to protectthe General Fund from unanticipated declines in reveIiues and unforeseen increases in expenditures. Thus, the reserve serves a key purpose:by insulating the budget from adverse developments on the revenue andexpenditure side, it helps the state provide a continJ.lOus and more predictable level of services to its citizens.
Chart 1Comparison of General FundRevenues and Expenditures1977-78 through 1985-86 (In billions)
General Fund balance .................................. $1,839.1 $3,913.9 $2,905.4 $2,540.7 $681.0 -$30.8 -$521.3 $490.6 $985.3 $1,043.5Carry-over reserves .................................... (125.9) (227.8) (225.3) (542.8) (332.0) (57.8) (87.1) (63.0) (15.3) (3.4)Reserve for Los Angeles County GrantAccount.................................................. - - - - - - - (1011.O)
Reserve for Economic Uncertainties...... - - - - (349.0) - - (327.6) (970.0) (1,040.1)--a Source: State Controller.b Details may not add -to totals due to to rounding.cSource: Governor's Budget.
00
9
Effecton
1984-85Surplus
$286252
-506
$31-12
$19
Condition oftheGeneral Fund
in 1984-85as Projected by
Governor's BudgetJanuary January
1984 1985
$205 $49125,825 26,07725,076 25,582
$954 $9853 15-- --
$951 $970
Effecton
1983-84Surplus
$57459
-231
$286-58
$228
As Projected As Reportedin Governor's by State
Budget ControllerJanuary January
1984 1985-$521 -$46423,368 23,82722,641 22,872
$205 $491105 163--- ---
$100 $328
Beginning resources ..Revenues and transfers ..Expenditures .General Fund balance ..Reserves b ..
Unrestricted balance ..
General Fund Condition Improves in 1983-84 and 1984-85
Table 2 summarizes the changes in the condition of the General Fundthat have taken place during the past year.
Table 2Change in General Fund Condition
1983-&1 and 1984-85(dollars in millions) a
Condition oftheGeneral Fund
inl91J3..84
aDetails may not add to totals due to rounding.b Includes unencumbered balance of continuing appropriations, and reserve for Los Angeles County
Medical Assistance Grant Account.
1983-84. One year ago, the Governor's Budget projected that thestate would end fiscal year 1983--84 with a balance of $100 million in theGeneral Fund. The State Controller now reports that the actual balancewas $328 million. The increase resulted entirely from higher-than-anticipated revenues.
As shown in Table 2, revenues and transfers exceeded the initial budgetestimate by approximately $459 million in 1983--84. These additional revenues were due almost entirely to the performance of the state's economy,which was considerably stronger than what the Governor's Budget for1983--84 anticipated.
On the expenditure side, the budget estimate proved to be much moreaccurate. Almost the entire difference between projected and actual expenditures can be attributed to accounting adjustmen'ts made by the StateController. These adjustments stem from the court's decision in a lawsuitfiled against the state regarding the state's contributions to the StateTeachers' Retirement System. The court ruled that the state could notlegally defer its contributions to the system, which are specified in statute,and ordered the Controller to transfer the funds that were not providedin 1983--84 and previous years to the system. As a result, the Controllerduring the current year transferred $337 million from the state GeneralFund to the State Teachers' Retirement Fund, and reflected the transferon his books as a 1983--84 expenditure.
10
. Absent this adjustment, the surplus at the end of 1983--84 would havebeen $665 million, or $565 million more than what was projected sixmonths earlier.
1984-85. The Department of Finance's current estimate of the unrestricted surplus at year-end 1984-85 is quite similar to the estimate thatappeared in the Governor's Budget a year ago. At that time, it was anticipated that the state wo:uld end the fiscal year with a b;llance of $951million, however, the. balance is now expected to reach $985 million byyear-enq. Of this amount, $15 million will already have been committedby the Legislature (but not spent), leaving $970 million uncommitted.
Even so, there are some f~iirly significant differences between the latestrevenue and expenditure estimates and last year's. As Table 2 shows,revenues are up $252 million, while expenditures are up $506 million. Anincrease in the amountcarried over from 1983-84 ($286 million) , however,offset the difference, leaving the General Fund balance about where itwas estimated in January 1984.
The increased revenues are attributable to the effects of an improvedeconomy ($138 million), the interest earnings associated with the externalborrowing program ($84 million), and the anticipated collection of additional tax revenues under the tax amnesty program ($30 million).
The increase in expenditures is mainly due to a $161 million increase inpayments to Supplemental Security Income/State Supplementary Payment (SSI/SSP) recipients and $223 million in additional expenditures forK-14 education.
General Fund Condition for 1985-86
In the budget year, revenues again are expected to exceed proposedexpenditures, this time by a total of $58 million. These funds would be usedto bring the balance in the Reserve for Economic Uncertainties up to$1,040 million, or 3.7 percent of General Fund expenditures.
General Fund revenues are projected to increase by $1.8 billion, or 7.1percent, in 198~6. In addition, due to the fact that approximately $642million in 1984-85 General Fund revenues was put in reserve, rather thancommitted to the funding of ongoing expenditure programs, a corresponding amount of "base" revenue in 19~6 is available to fund increases in expenditures.
The Governor's Budget proposes a total increase in General Fund expenditures of $2.3 billion, or 9 percent, over estimated expenditures in thecurrent year. The largest increase is proposed for education, which wouldgain $1.3 billion, or 9.6 percent, in additional General Fund support aboveits 1984-85 funding level. This includes an increase of $896 million, or 9.5percent, for K-12 education; an increase of $63 million, or 19 percent, inGeneral Fund contributions to the State Teachers' Retirement System;
11
and increases for the University of California, the California State University, and California Community Colleges of 12 percent, 8.9 percent, and4.5 percent, respectively.
13
The Long-Term Fiscal OutlookThe overall condition of the General Fund beyond the budget year will
depend on three factors-future levels of state spending, future levels ofstate income (that is, revenues plus transfers) , and the amount of reservesthat the Legislature seeks to maintain.
The levels of income and expenditures beyond the budget year will bedetermined by a variety of factors, including economic conditions,judicialdecisions, ballot initiatives, and actions of the Legislature. The Legislaturemay, for example, enact legislation which changes tax rates or definitionsof the tax base and thereby affects the level of revenue collections. It mayalso initiate new expenditure programs, or modify existing ones. There isno way of predicting what the outcome of legislative action in the futurewill be.
One can, however, provide an illustration of what the condition of theGeneral Fund would be in future years if (a) no law changes are made thatsignificantly affect state income, (b) the economy behaves in linewith theDepartment of Finance's projections, and (c) the level of expenditures ismaintained at the level proposed in the Governor's Budget, adjusted onlyfor inflation and population growth.
General Fund Income
The most important factor determining state income in future years willbe the economy's performance. Generally speaking, the state's revenuebase appears to have sufficient "elasticity" to grow at a pace equal to, andprobably slightly above, the rate of growth in California's personal incomebase-at least during normal years. Obviously, this relationship will nothold during periods when economic activity fluctuates. For example,when an economic slowdown occurs, corporate profits usually fall, and thepercentage of income that consumers spend on taxable commodities canalso decline. During economic expansions, the opposite usually occurs.Thus, on a year-to-year basis, the rate of growth in revenues can vary,depending on what the economy is doing.
It is not possible to predict with any confidence the economy's performance beyond the next 18 months. Indeed, no economist can say with anycertainty what will happen to such key economic variables as interestrates, inflation, unemployment, and corporate profits beyond the nextseveral quarters-if that. This is especially true given such factors as theunsettled conditions in the foreign trade sector, international debt problems, the inability of federal officials themselves to predict what futurecourses monetary and fiscal policies will take, the uncertain prospects forthe federal deficit and the fact that the economy currently is in a "transition phase" during which it could either begin to expand or contract.Consequently, any estimate of General Fund revenues beyond 19~6
14
depends heavily on what one assumes about the economy's performancebeyond 1986.
The Governor's Budget contains a projection of General Fund revenuesfor 1986-87 and 1987-88. This projection is based on the Department ofFinance's standard economic forecast for 1985 and 1986, and thereafterassumes that the economy will experience a mild recession in 1987 followed by recovery in 1988. The reason why the department chose toassume that a recession will occur in 1987 is that the average length ofpostwar economic expansions is 34 months, and the current expansion hasalready lasted 26 months. Should the department's assumptions come true,Table 3 shows that General Fund revenues would be $29.9 billion in 198687 and $30.6 billion in 1987-88,
We believe the department's assumption that a mild recession will occur before 1989 is reasonable, given past experience. Should the economysomehow "beat the odds" by expanding beyond 1986 and avoiding anytype of downturn, however, General Fund revenues would be significantly higher than what is shown in Table 3-probably in the range of $30.2billion for 1986-87 and $32.5 billion for 1987-88. Most economists do not puta very high probability on an uninterrupted economic expansion of thislength.
4156
1987-88$1,27630,560 b
31,676 c
(-1,116)
41,276
1986-87$1,04329,900 b
29,660 c
(240)
31,040
Prior-year resources ..Income (as projected by DOF) .Expenditures .
(Annual surplus) .Year-end General Fund balance:
Carry-over reserves .Reserve for Economic Uncertainties .
General Fund Expenditure Growth
The Governor's Budget proposes General Fund expenditures in 1985-86of $27.9 billion. In order to estimate the amount that would be needed tocontinue this level of state services in 1986-87 and 1987-88, two adjustments must be made. First, certain "one-time" expenditures must beremoved in order to arrive at the ongoing "base" budget. Second, theadjusted base for 1985-86 must be increased for population growth andinflation, so as to hold "real" per capita expenditures constant over time.We have done this based on the assumption that inflation will average 5percent per year and population growth will average 1.7 percent annually.
Table 3Condition of the General Fund a
1985-86 through 1987~
(dollars in millions)
1985-86b
$98527,92227,864
(58)
a Details may not add to totals due to rounding.b Source: 1985-86 Governor's Budget.c Assumes 1985-86 expenditures are adjusted to reflect inflation and population increases.
15
The result is that actual expenditures grow by about 6.8 percent per year.Table 3 shows that the amount of funding needed' to support a con~tant
level of "real" per capita expenditures is $29.7 billion in 1986-87 and $31.7billion in 1987-88.
General Fund Condition
Table 3 shows what the condition of the General Fund would be in1986-87 and 1987-88, given these income and expenditure assumptions.The table indicates that:
• On an annual basis, General Fund income wO].lld exceed GeneralFund expenditures by approximately $240 million in 1986-87, butwould fall short of these expenditures by $1.1 billion in 1987..:.s8.
• The General Fund balance....;...that is, the total amount of unused funds"left over" at the 'end of the year-would rise from $1 billion in1985-86 to $1.3 billion in 1986-87, and then fall to under $200 millionin 1987-88.
Thus, a recession could quickly cause the General Fund balance toevaporate.
Part Two
CTIVES1985-86
This part of our analysis provides perspectives on the Governor;sBudget for 1985-86. It consists of four major sections, as follows:
• Expenditures. This section provides an overview of the expenditure side of the state's budget. It discusses the level of proposed expenditures, the major components of the budget, and the major program changes proposed in the budget.
• Revenues. This section provides a perspective on the state's economy in 1984 and 1985, and the outlook for the economy in future years.It also includes an analysis of revenue collections in the prior, current,and budget years, and discusses how revenues would be affected byalternative assumptions about economic growth.
• State and Local Borrowing. This section focuses on the types andvolume of borrowing being done by the state and local governments.
• The State's Work Force. This section analyzes the reasons forchanges in the state's work force in 1985-86. It also examines historicaltrends that account for the current functional composition of stateemployment.
21
Expenditures in 1985-86
TOTAL STATE SPENDING PLAN
The Governor's Budget for 1985-86 proposes total expenditures of $56.6billion. This amount includes:
• $33.6 billion in state expenditures, consisting of $27.9 billion from theGeneral Fund, $5.3 billion from special funds, and $0.5 billion fromselected bond funds;
• $13.7 billion in expenditures from federal funds; and• $9.3 billion in expenditures from various «nongovernmental cost"
funds, including funds established for retirement, working capital,revolving, public service enterprise, and other purposes.
Table 4 presents the components of the state's spending program for1983-84, 1984-85 and 1985-86.
a Source: Governor's Budget. Details may not add to totals due to rounding.b Source: State Controller.
Governmental Expenditures
The budget proposes expenditures from governmental funds-that is,total state spending less nongovernmental cost funds-amounting to $47.3billion in 1985-86. This represents a $2 billion, or 4.9 percent, increase fromthe current-year level, primarily reflecting increases in General Fundexpenditures of $2.3 billion.
Using this measure of the budget, during 1985-86 the state will spend$1,814 for every man, woman and child in California or $129.5 million perday.
22
State Expenditures
That portion of the state spending plan financed by state revenuesdeposited in the General Fund or special funds is usually referred to as"state expenditures." As shown in Table 4, state expenditures areproposed to total $33.6 billion in 1985--86, which is 6.1 percent higher thanstate expenditures in the current year.
General Fund Expenditures
The budget proposes General Fund expenditures of $27.9 billion in1985--86, which accounts for nearly one-half of all expenditures under thestate's auspices.
--Total BUdget
---,,--- ---- ---/ ---..../
--------
22
-- 1973 Dollars
14
Chart 2Annual Growth in General Fund Expenditures1973-74 through 1985-86 (in billions)
Chart 2 and Table 5 show the General Fund expenditure trend since1973-74. Expenditures in Chart 2 and Table 5 are displayed both on a"current dollar" and "real dollar" basis. Expenditures in "real dollars"represent expenditure levels as they appear in the budget (that is, "current dollars") adjusted for the effects of inflation since 1973.
In current dollars, the proposed General Fund budget for 1985--86 isalmost four times what it was in 1973-74. In terms of "real dollars," however, the proposed General Fund budget is only a little more than one andone-half times what it was in 1973-74.
23
As shown iii Chart 2 and Table 5, between 1973-74 and 1980-81 totalGeneral Fund expenditures increased at an average annual rate of 17percent in current dollars, and by 7 percent in "real dollars", The rateslowed con.siderably in 1981-82, as the state experienced the effects of thenationwide recession. Beginning in the current year,spending growth hasresumed a more traditional course, in line with the expansion of the state'seconomy.
a Source: State Controller.b "Real dollars" equal current dollars deflated to 1973-74 dollars using the Gross National Product implicit
price deflator for state and local purchases of goods and services.C Source: Governor's Budget.
The level of General Fund expenditures proposed for 1985-86 continuesthe upward trend in "real" expenditures begun in the current year, afterthree years ofdeclining "real" expenditures. Total General Fund expenditures proposed for 1985-86 are 8.9 percent more than estimated expenditures for the current year, which translates into an increase in purchasingpower of 3 percent.
Because significant one-time expenditures are included in the currentyear total, the actual expansion of service levels proposed in the Governor's Budget is even greater than 3 percent. for example, General Fundexpenditures for 1984-85 reflect a one-tirtie $200 million loan repaymentto Los Angeles County. We estimate that if adjustments are made for theseand other one-time expenditures, the level of service proposed in theGovernor's Budget for 1985-86 is 3,5 percent higher than the current-yearlevel. Even so, proposed General Fund expenditures in 1985-86, expressedin "real dollars", are still $383 million below the pre-recession highreached in 1980-81.
24
Federal Fund Expenditures
Federal fund expenditures account for almost one-third of the expenditures in the state's 1985-86 budget (excluding nongovernmental cost andbond funds). As shown in Table 6, during the past 10 years federal fundshave accounted for as much as 39 percent (1976-77) and as little as 28percent (1979-80) of total state expenditures. Since 1982-83, federal expenditures have been declining as a percentage of total state expenditures.
Table 6Federal Fund Expenditures asa Percent of Total State Expenditures a
a Excludes nongovernmental cost and bond funds. Details may not add to totals due to rounding.b 1976-77 through 19~ data from State Controller.
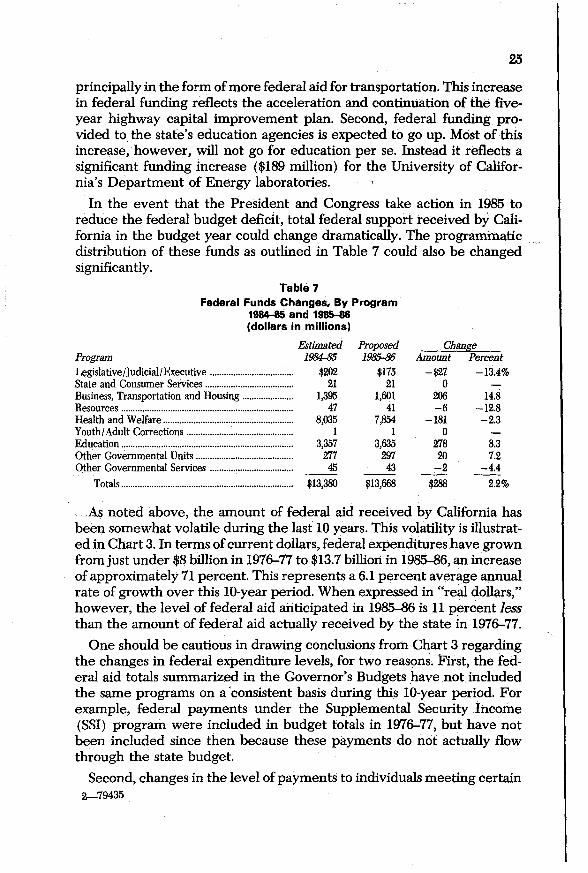
The level of federal expenditures anticipated in 1985-86-$13.7 billionrepresents an increase of $288 million, or 2.2 percent, over the estimated1984-85 level. This relatively small increase in total federal funding masksseveral major increases and decreases anticipated in the budget year.These increases are shown in Table 7, by broad program area. The mostsignificant reduction, $181 million in health and welfare programs, is primarily due to a decrease of $345 million in unemployment insurance (VI)benefits and administration, reflecting the assumption that the rate ofunemployment in California will decline from 7.5 percent in 1984-85 to 7percent in 1985-86. The decrease in VI is offset by various health andwelfare increases, particularly in the Aid to Families with DependentChildren (AFDC), public health, social services and rehabilitation programs.
Table 7 also shows that two significant increases in federally fundedexpenditures are anticipated in the budget year. First, business, transportation and housing programs are expected to receive increased support,
25
principally in the form ofmore federal aid for transportation. This increasein federal funding reflects the acceleration and continuation of the fiveyear highway capital improvement plan. Second, federal funding provided to the state's education agencies is expected to go up. Most oHhisincrel:ise, however, will not go for education per se. Instead if reflects asignificant funding increase ($189 million) for the University of California's Department of Energy laboratories.
In the event that the President and Congress take action in 1985 toreduce the federal budget deficit, total federal support received by California in the budget year could change dramatically. The programmaticdistribution of these funds as outlined in Table 7 could also be changedsignificantly.
8.37.2
-4.42.2%
14.8-12.8-2.3
Amount Percent-$27 -13.4%
o206-6
-181o
27820-2
$288
ChangeProposed1985-86
$17521
1,60141
7,8541
3,63529743
$13,668
Table 7Federal Funds Changes, By Program
1984-85 and 1985-86(dollars in millions)
Estimated1984-85
$20221
1,39547
8,0351
3,35727745
$13,380
ProgramLegislative/Judicial/Executive .State and Consumer Services .Business, Transportation and Housing .Resources ..Health and Welfare ..Youth/Adult Corrections ..Education .Other Governmental Units ..Other Governmental Services .
Totals .
As noted above, the amount of federal aid received by California hasbeen some\\That volatile during the last 10 years. This volatilityis illustrated in Chart 3. In terms ofcurrent dollars, federal expenditures have grownfrom just under $8 billion in 1976-77 to $13.7 billion in 1985-86, an increaseof approximately 71 percent. This represents a 6.1 percent average annualrate of growth over this lO-year period. When expressed in "real dollars,"however, the level of federal aid anticipated in 1985-86 is 11 percent lessthan the amount of federal aid actually received by the state in 1976-77.
One should be cautious in drawing conclusions from Chart 3 regardingthe changes in federal expenditure levels, for two reasons. First, the federal aid totals summarized in the Governor's Budgets have .notincludedthe same programs on a 'consistent basis during this 1O-year period. Forexample, federal payments under the Supplemental Security income(SSI) program were included in budget totals in 1976-77, but have notbeen included since then because these payments do not actually flowthrough the state budget.
Second, changes in the level of payments to individuals meeting certain2-79435
26
eligibility criteria (the so-called entitlement programs) can change significantly the total amount of federal aid received by the state, even thoughthere may not have been a change in underlying federal policy or funding.For example, when the Governor's Budget was submitted for 1982-83, itestimated that the state would receive $2.1 billion in federal funds forunemployment insurance. California, however, actually received $3.6 billion in that year, a difference of $1.5 billion, or 75 percent. The increasewas due more to the,effects of the recession on the number of personseligible tp receive VI benefits, than it was to any discretionary increase infederal support for the program.
Chart 3
Expenditures of Federal AidGranted to the State of California1976-77 through 1985-86 (in billions)
Expenditures$14..., Totai
Dollars
12- 010-
Real aDollars..
76-77 77-78 78-79 79-80 80-81 81-82 82-83 83-84 84-85 85-86a "Real" federal doUars equallofal federal doUars deflaled fo 1976-77 doUars using (est.) (prop.)
the GNP price deflator for state and local purchases of goods and services.
Total State and .Local Government Spending in California
Local governments are also a significant contributor to public sectorspending in California. Because local agencies receive a good portion oftheir resources from the state, however, their expenditures cannot simplybe added to those of the state in order to determine aggregate government spending. Instead, state expenditures that go to local governmentagencies must first be subtracted from the state totals, to avoid doublecounting.
27
Chart 4
Total State and Local Government Expenditures1984-85
Total Expenditures$75.9 Billion
State"
Cities
Local Education
Special Districts
"Nf'l stale l'xl>enditures
Local govermnent expenditures consist of expenditures by tour types otlocal jurisdictions: counties, cities, special districts and local education(K-14). The local education category includes expenditures for elementary and secondary schools (K-12), county offices of education, regionaloccupation centers, and community colleges. Chart 4 displays 1984-85expenditures by each government entity, as a portion of total state andlocal government expenditures. It shows that net state spending accountsfor slightly more than one quarter of total state and local expenditures inthe current year.
In the current year, expenditures for all services provided by state andlocal governments in California are expected to total approximately $76billion. This amount consists of approximately $22 billion in net state expenditures (that is, state expenditures net of funds provided to local governments) and approximately $54 billion in local expenditures. Thesefigures include federal funds expended by state and local governments,and exclude expenditures from bond proceeds and nongovernmental costfunds.
The fact that net state spending-$21.9 billion-is only one-half of totalGeneral Fund, special fund and federal fund expenditures identified inthe Governor's Budget ($43.9 billion) demonstrates how much "state
28
money" actually is spent at the local level. These latter expenditures,which total $22 billion in the current year, are included in our estimate oflocal government spending. The principal component of this amount isstate aid to local school districts ($12.1 billion).
Table 8 provides a perspective on government sector spending in California over the past three years. As Table 8 demonstrates, the relativeshare of total state and local government expenditures accounted for bythe state and each of the four types of local jurisdictions has remainedvirtually unchanged during the past three years.
Table 8Estimated Total State and Local Government Expenditures
Subtotal, Local Government ($45,295) (69.8%) ($49,411) (71.9%) ($53,985) (71.2%)State .................................................... 37,186 38,851 43,914Less: Amount expended by local
a Local government expenditure data for 1982-83, and county data for 1983-84, taken from the StateController's Report on Financial Transactions. Figures for 1983-84 and 1984-85 represent LegislativeAnalyst's office estimates. All local government data include enterprise fund transactions. Stategovernment expenditure data are taken from Governor's Budgets. Details may not add to totals dueto rounding.
TAX EXPENDITURESIn addition to the $33.6 billion in total state funds which the Governor's
Budget requests for direct expenditure programs in 1985-86, it also proposes approximately $12.9 billion of indirect spending in the form of "taxexpenditures".
These tax expenditures result from various tax exclusions, exemptions,preferential tax rates, credits, and deferrals, which reduce the amount ofrevenue collected from the state's "basic" tax structure-that is, the overall system of taxation, including those provisions, such as personal exemption credits under the personal income tax, which have general applicability. Thus, "tax expenditures" include those special provisions of the taxcode which are used to achieve social policy goals or provide tax relief.
In terms of the state's overall fiscal condition, the fact that these moniesare indirectly spent using the tax system as a distribution mechanism
29
makes them no less "expenditures" than are monies which directly passthrough the normal appropriation process. Thus, tax expenditures areappropriately viewed as part of the Governor's overall spending plan.
Table 9 shows the Department ofFinance's estimate of state tax expenditures in 1985--86. The table indicates that tax expenditures are expectedto total $12.9 billion in the budget year, which is equivalent to 46 percentof General Fund expenditures and 38 percent of total direct state expenditures. Of the $12.9 billion, about 70 percent is associated with variousexemptions, deductions and credits permitted under the personal incometax, including the nontaxability ofemployer contributions to pension plans($1.4 billion) and the deductibility of mortgage interest expenses ($1.3billion). A third major tax expenditure is the exemption from the sales taxgranted to food consumed at home ($1.3 billion).
(We believe the department's list of tax expenditures inappropriatelyincludes some provisions of the tax code which are not really "tax expenditures." These provisions are so widely available and used by so manytaxpayers that they really should be viewed as part of the state's basic taxstructure itself.)
Table 9State Tax Expenditures a
1985-86(dollars in millions)
Tax Expenditure Category1. Personal income tax ..2. Sales and use tax .3. Bank and corporation tax .4. Motor vehicle fuel taxes ..5. Other taxes .
Total, all categories .
Amount$9,0093,327 b
368110103
$12,917
a Source: Governor's Budget.b In addition to the state tax expenditure shown for the sales and use tax, there is a comparable local
government tax expenditure estimated at $876 million.
CONTROLLING EXPENDITURES
Control Through the Constitution
On November 6, 1979, California voters approved Proposition 4, the"Spirit of 13" Initiative. Proposition 4, which placed Article XIII B in theCalifornia Constitution, has three main provisions:
• It places a limit on. the year-to-year growth in tax-supported appropriations of the state and individual local governments;
• It precludes the state and local governments from retaining surplusfunds-any unappropriated balances at the end of a fiscal year mustbe returned to taxpayers within a two-year period; and
• It requires the state to reimburse local government for the cost ofcertain state mandates.
30
Table 10Impact of Article XIII B on the State
1983-84 through 1985-86(dollars in millions)
Appropriations limit ..Appropriations subject to limitation ..
Amount under the limit ..
1983--84$20,368
17,737
$2,631
1984-85$21,74620,629
$1,117
198f5...!36$23,09521,323
$1,772
Impact of Article XIII B in 1985-86. Table 10 shows the'Department of Finance's estimate of the state's appropriation limit under ArticleXIII B as well as the appropriations subject to limitation in 1983-84, 198485, and 1985-86. The department estimates that the state will be $1.8billion below its limit in 1985-86.
Since the voters approved Article XIII B, there has been a large gapbetween the limit and spending subject to limitation. This is because thestate appropriated more monies in the base year (1978-79) than it took inas tax revenue. This resulted in the original "base" being larger than theamount of spending that could be sustained under existing tax laws.
The gap between the limit and spending subject to limitation is expected to increase significantly in 1985-86. The Department of Finance expects that appropriations subject to limitation in 1985-86 will increase by3 percent over the 1984-85 level, compared to a 16 percent increase duringthe previous year. The difference between these two rates of growth isdue largely to a one-time factor: in the current year, $642 million wasappropriated to the Reserve for Economic Uncertainties. In contrast,however, only $70 million is proposed for appropriation to the reserve inthe budget year. If the appropriation to the reserve is excluded from bothyears' totals, appropriations subject to limitation are proposed to grow by6.4 percent in the budget year.
The state's appropriations limit will not be a fiscal constraint in 1985-86.For the limit to be a constraint in future years, revenues would have togrow at rates significantly exceeding the annual adjustments to the state'slimit. Based on the economic forecast prepared by the administration, thisis not likely to occur. Rather, it appears that the rates of growth for bothrevenues and the limit will largely parallel each other. Hence, the limitprobably will not be a constraint in the foreseeable future.
Prediction or Plan?
It should be noted that the budget estimates are not predictions of howmuch ultimately will be spent, although these estimates reflect countlesspredictions about expenditure rates and other factors that are in partoutside of the state's control. Rather, the budget estimates reflect the
31
Governor'sfisca] plan-that is, what he thinks expenditures ought to be,given all of those factors that the state can and cannot control. It is certainthat, between now andJune 30,1986, expenditures (and revenues) will berevised by the Governor, the LegiSlature, changing economic conditions,the resolution ofcourt cases, and many other factors. Thus, as in past years,actual revenues and expenditures may be vastly different from the estimates contained in the Governor's Budget.
Budgeted Versus Adual Expenditures
The expenditure program proposed in the Governor's Budget invariably is changed during the 18 months followingsubmission of the budget.Table 11 compares the original estimates with actual expenditures duringthe past 11 years.
Change C
Amount Percent
$514 6.6%348 3.8168 1.6
-114 -1.02,790 20.71,480 8.7
382 1.8925 4.5
-1,448 -6.21,195 5.5
506 2.0
Table 11Proposed and Actual General Fund Expenditures
a Souree: Governor's Budget.b Source: State Controller.C Details may not add to totals due to rounding.
As Table 11 shows, actual expenditures exceeded the amollntsoriginallyproposed by the Governor in nine of the last eleven years-usually bysignificant margins. Only twice during this 11-year period-in 1977-78 and198~was the actual amount spent less than the amount initiallyproposed for expenditure. The large c;lecrease in the budget for 1982-83$1.4 billion-primarily reflects the severe recession that began in 1981.Revenues in that year were wellbelo~thelevel projeCted in the Governor's Budget, making it necessary forthe Legislature to make large cutsin expenditures in order to minimize the end-of-year deficit.
MAJOR COMPONENTS OF THE STATE BUDGETState expenditures traditionally are divided into three categories within
the budget: state operations, capital outl~y, and local assistance. Table 12presents the distribution of General Fund and special fund expenditUres
32
among these categories for the past, current, and budget years. The Governor's Budget for 1985-86 also includes "unclassified" General Fund expenditures of $75 million for legislative initiatives, and an additional $40million for a loan guarantee.
Table 12General FLindandSpecial Fund Expenditures, by Function a
1983-84 through 1985-86(dollars in millions)
Estimated1984-85
General FundState operations .Capital outlay ; .Local assistance ; ..
Aid to individuals ..Aid to local governments ; ..
Unclassified ..
Totals d ..
Special FundsState· operations ..Capital outlay ..Local assistance ..Unclassified .
Totals d ..
a Source: Covernor's Budget.b Source: State Controller.C Percentage change eguals or exceeds 100 percent.d Details may not add to totals due to rounding.
As Chart 5 shows, state operations make up 23 percent of total GeneralFund expenditures in the budget year, while local assistance, as definedin the Governor's Budget, makes up 76 percent. Together, these components account for just over 99 percent of total General Fund expendituresproposed in the budget for 19~6.
State. Operations
The budget proposes an increase from the General Fundof $720 million,or .13 percent, for state operations expenditures in 19~6; As shown inChart 6, General Fund expenditures for state operations will have increased by $3.8 billion, or 144 percent, during the ten years from 1976-77through 1985-86. When adjusted for inflation; however, expenditures haveincreased by only $738 million, or 28 percent, during this period.
Capital Outlay
The budget proposes no General Fund expenditures for capital outlayin 1985-86. General Fund capital outlay expenditures over the past tenyears have fluctuated from zero to a high of $151 million (in 1979-80). TheGovernor's Budget for 1984-85 proposed that $94.7 million be appropriated from the General Fund for capital outlay, but only $8 million wasultimately appropriated.
33
Chart 5
1985-86 General Fund Budget Structure
Total Expenditures a$27.9 billion
Local AssistanceAid to Local Governments
Local AssistanceAid to Individuals
a State operations and local assistance totals do not include $75 million (.3%) allocated 10 cover the cost of legislation approved inthe budget year and $40 million (.1 0/(1) for state guarantee of loan.
Local Assistance
As illustrated in Cha~t 6, General Fund expenditures for local assistancewill have increased by $13.4 billion, or 171 percent, during the 10 yearsfrom 1971>-77 through 1985-86. The growth in state fiscal relief to localgovernments, which began immediately following the passage of Proposition 13, explains much of this increase. Additionally, direct benefit programs' such as AFDC grants, which are classified as local assistance, havegrown rapidly during the past decade.
Table 12 displays local assistance expenditures, by funding source. Itshows that the Governor's Budget proposes an overall increase of $1.5billion, or 7.3 percent, in General Fund support for this category of expenditures.
Chart 6.General Fund Budget Structure1976;,..77 through 1985-86 (in billions)
Aid to Individuals Versus Aid to Local Governments
Local assistance, as the term is used in the budget, encompasses a widevariety of programs. Some of these programs do not provide assistance tolocal government agencies; instead, they provide assistance to individuals.Such payments may be made directly to individuals, as in the case of theRenters' Tax Relief program, or through an intermediary, such as thefederal or county governments. Among the payments made through intermediaries are SSI/SSP payments, which are distributed by the federalgovernment, and AFDC payments, which are distributed by county governments.
The Governor's Budget divides local assistance into three categories:(1) "Payments to Local Government," (2) "Assistance to Individuals,"and (3) "Payments to Service Providers." The distinction between thesecond and third categories-"Assistance to Individuals" and "Paymentsto Service Providers"-reflects the form in which assistance to individualsis provided. The former category includes cash grants to individuals, whereas the latter includes the cost of services provided to individuals. Thistreatment tends to ignore the issue of where the responsibility for providing the service lies. For example, the "payments to service providers"
Table 13Major General Fund-Supported
Local Assistance ProgramsProviding Aid to Individuals
1983-84 through 1985-86(dollars in millions)
Medi.Cal a .
AFDC b ..
SSI/SSP .Developmental Services ..Personal Property Tax Relief (subventions) ..Personal Property Tax Relief (provided through other
sources) ..Renters' Tax Relief .Homeowners' Property Tax Relief ..Senior Citizens Renters' Tax Relief ..Senior Citizens' Property Tax Assistance .Subventions for Open Space .Senior Citizens' Property Tax Postponement ..Payment to Local Governments for Sales and Property
a Excludes county administration.b Grant payments only.c $51 million of the amounts shown for these three programs was funded from special fund sources; this
amount is excluded in calculating General Fund total.d Details may not add to totals due to rounding.
36
category includes the state funds provided to county governments to assistthe counties in providing a meaningful level of service for the alcohol anddrug programs. Table 12 displays what we believe is a more meaningfuldivision of local assistance expenditures: "Aid to Local Governments" and"Aid to Individuals."
Aid to Individuals. Table 13 identifies 12 General Fund-supportedlocal assistance programs which our analysis indicates are appropriatelycategorized as "Aid to Individuals." Overall, the Governor's Budget proposes a funding increase of $407 million, or 6 percent, for these programsin the budget year. On a program-by-program basis, however, the Governor's Budget is proposing increases for seven of these 12 programs, nochange in funding for four and transfer of funding for one.
Aid to Local Governments. Table 14 displays the major GeneralFund local assistance programs which our analysis indicates provide "Aidto Local Governments." Overall, the Governor's Budget proposes an increase in funding for these programs of approximately $1 billion, or 8.1percent, from current-year levels. This change is primarily the result ofthe 10 percent funding increase proposed for K-12 education. The decrease between 1984-85 and 1985-86 in the "All Other" category reflectsthe repayment, during the current year, of a $200 million loan to theGeneral Fund under the Los Angeles County Medical Assistance GrantProgram.
Table 14Major General Fund-Supported
Local Assistance ProgramsProviding Aid to Local Governments
1983-84 through 1985-86(dollars in millions)
Public Health Services : ..California Children's Services ..Department of Rehabilitation .Mental Health Programs ..Alcohol and Drug Programs ..Social Services-Programs .Social Services-County Administration ..County Justice Subvention ; ..K-12 Education .Community Colleges .All Other .
Totals a .
a Details may not add to totals due to rounding.
Actual1983-84
$9043845
44562
161III63
8,5971,036
357
$11,819
Estimated1984-85
$9434558
51969
22412364
9,4951,084
353
$12,977
Governor'sBudget1985-86
$9505165
59472
30813067
10,4531,134
200
$14,024
37
RESERVE fOR ECONOMIC UNCERTAINTIES
The Governor's Budget holds $1,043.5 million from the General Fundin reserve for 1985-86. Of this amount, $1,040.1 million would be appropriated to the Reserve for Economic Uncertainties, and $3.4 million represents funds which have already been appropriated but are not expectedto be spent during the budget year.
The Reserve for Economic Uncertainties was created by the 1980Budget Act, and provides a source of funds to meet General Fund obligations in the event of an unanticipated decline in revenues or increases inexpenditures following enactment of the Budget Bill. In addition, moniesin this fund can be loaned, interest-free, to the General Fund in the eventof a cash-flow shortage during the fiscal year. In the absence of such loans,the balance in the reserve is invested and produces interest income for theGeneral Fund.
The amount proposed for the reserve in 1985-86 is equal to about 3.7percent of proposed General Fund expenditures.
COST-Of-LIVING ADJUSTMENTS (COLAs)
Each year, the Governor's Budget typically includes funds for variouscost-of-living adjustments, commonly referred to as COLAs. These adjustments generally have a common objective: to compensate for the effectsof inflation on the purchasing power of the previous year's funding level.
Discretionary and Statutory COLAs
Existing law authorizes automatic COLAs for 20 different programs,most of them in the health, education and welfare areas. These adjustments generally are referred to as statutory COLAs. Many other localassistance programs traditionally have received COLAs on a discretionary(or nonstatutory) basis, through the budget process.
In 1985-86, statutory COLAs will range from 3.8 percent (child nutritionin schools) to an estimated 10.7 percent (Medi-Cal noncontract hospitals).Those statutory COLAs with the largest costs are for K-12 apportionments($580 million), SSI/SSP grants ($103 million) and Community Collegeapportionments ($89 million). The General Fund cost of fully fundingstatutory COLAs in 1985-86 is approximately $1 billion.
Governor's Budget Proposal
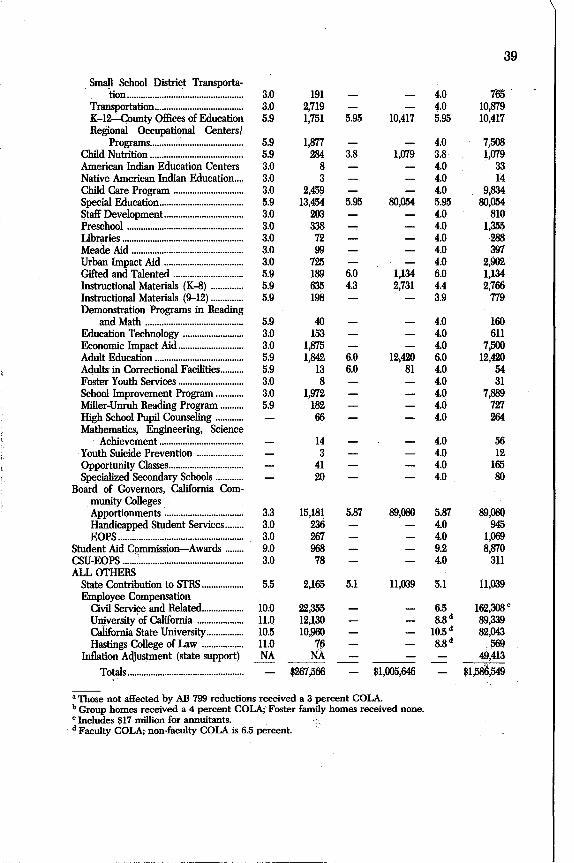
The budget proposes a total of $1,587 million from the General Fund forCOLAs in 1985-86, including $1,006 million for statutory COLAs (generally the full amount required by existing law) and $581 million for discretionary COLAs. The specific increases proposed by the Governor areshown in Table 15.
The table also includes one COLA-like adjustment: the $49 million increase proposed for state operating expenses in order to offset the effects
38
of inflation on the budgets for 24-hour care institutions, state programsdedicated to fire and life safety, and programs involved with revenueproduction or the maintenance of classroom ratios. These adjustmentsgenerally are 5 percent.
Table 15General Fund Cost-of-Living Increases
1984-85 and 1985-86(dollars in thousands)
2,564
4,916
4,736
21,67614,76813,9623,065
871
$2,560
20,58219,7204,772
565,0321,3233,605
135
7,4985,601
17514,576
103,22481,3455,988
55712,377
2843,0539,3432,272
4.04.0
4.04.0
4.0
4.0%
5.35.34.05.34.0
5.956.05.954.0
4.0
4.02.44.04.0
4.04.05.36.82.4
5.354.04.0
10.74,916
13,9623,065
565,0321,3233,605
$20,582
103,22481,345
557
5.956.05.95
5.35.3
5.3
5.36.8
10.7
5.35%
460
641
$640
3,8474,9301,193
1,184
5,4193,6722,364
451363
94,96322060634
1,8751,399
443,644
19,47615,3481,497
1053,094
711,2722,336
568
2.0
3.0%
3.0
3.03.0
5.65.64.0 b
5.63.0
3.03.03.03.0
5.95.95.95.9
6.07.6"5.67.53.0
4.23.03.0
10.4
12.53.0
1984-85 1985-86Budgeted 1% Statutory BudgetPercent Dollar Percent Dollar Percent Budget asIncrease Increase 1ncrease 1ncrease Increase ProposedDepartment/Program
HEALTH AND WELFAREAlcohol and Drug Programs .Health Services
County Health (AB 8) .Medically Indigent Services ..Public Health ..Medi-Cal
Noncontract Hospitals (includingPHPs and RHF) .
PHPs, CDS, and RHF (nonhospi.tal services) ..
Long·Term Care Facilities, in·cluding state hospitals ..
Providers, all others .Beneficiary ("Spin·off') ..Drug Ingredients ..County Administration .
State Contribution to STRS .................. 5.5 2,165 5.1 11,039 5.1 11,039Employee Compensation
Civil Service and Related.................. 10.0 22,355 6.5 162,308 c
University of Califoruia .................... 11.0 12,130 8.8 d 89,339Califoruia State University................ 10.5 10,960 10.5 d 82,043Hastings College of Law .................. 11.0 76 8.8 d Ji69
Inflation Adjustment (state support) NA NA 49,413---$1,586,549Totals .................................................. ...., $267,566 $1,005,646
a Those not affected by AB 799 reductions received a 3 percent COLA.b Group homes received a 4 percent COLA;'Foster family homes received none.c Includes $17 million for annuitants.d Faculty COLA; non-faculty COLA is 6.5 percent.
40
PROGRAM EXPENDITURES
We have discussed in some detail total expenditures proposed for thebudget year and their relationship to historical spending levels. In addition, we have examined the relationship of the three major componentsof the budget-state operations, local assistance and capital outlay. Wenow turn our attention to the distribution of expenditures on a programmatic basis.
Where Does the Money Go?
Chart 7 and Table 16 show the distribution of General Fund expenditures, by major program categories, in 1985-86. These displays indicatethat the two largest budget categories are education and health and welfare, which collectively account for $23.4 billion, or 84 percent, of totalGeneral Fund expenditures. The remaining $4.5 billion, or 16 percent oftotal expenditures, goes for tax relief and all other programs of stategovernment, such as corrections and resources.
Chart 7
General Fund Expenditures-Major Components1985-86
Total Expenditures$27.9 Billion
K-12Education
HigherEducation
Youth andAdult Corrections
Health and Welfare
The so-called "people programs"-education, health and welfare-havebeen the fastest growing components of General Fund expenditures inrecent years. Chart 8 illustrates that since 1976-77, expenditures for these
41
programs have increased significantly. Over the ten-year period, higherand lower education expenditures have increased by $10.2 billion, or 219percent, while health and welfare expenditures have grown by $5 billion,or 139 percent.
Table 16Expenditures for Health, Welfare, and EducationAs a Percent of Total General Fund Expenditures
19B5-a6(dollars in millions) a
K-12 Education b ..
Higher Education .
Subtotal, Education ..Health and Welfare .
Subtotai, Education, Health and Welfare ..Other program areas ..
Total General Fund budget ..
Amount
$10,6974,179
$14,876.8,509
$23,3854,479
$27,864
Percent ofGeneral Fund
Budget38%15
53%31
84%16
100%
a Source: Governor's Budget.b Includes $400 million for State Teachers' Retirement System contribution.
Chart 8
Trends in General FundProgram Expenditures1976-77 through 1985-86 (in billions)
Health and Welfare:Medi-Cal ..County health , .SSI/SSP .AFDC grants : .Social services programs .Mental health .Developmental.services .L.A. County Medical Assist. Grant Program .Other, health and welfare ..
Subtotals, Health and Welfare ..Education:
K-12 .State teachers' retirement ..University of California ..California State University ..California Community Colleges ..Other, higher education ..
Subtotals, Education ..Other: .
Youth and adult corrections ..Resources .Tax relief .Debt service .Unallocated .All.other .
Subtotals, Other .
Totals C.
Table 17Estimated General Fund Program Changes·
1984-85 and 1985-86(dollars in millions)
Estimated1984-85
a BaSed on mnounts shown in Governor"s Budget.b Perce.ntage. change equals or exceeds 100 percent.C Details may not add to totals due to rounding.
Summary of Major Program Changes
i?or 1985-86, the budget proposes a net increase in General Fund expendli:uies of $2.3 billion, or 8.9 percent, above the level of expendituresestimated for the current year. Table 17 shows the primary factors thataccount for the proposed change in expenditures. It show:; tltat the largestincrease is proposedf6r"education. The Governor proposes an increase inGeneral Fund expenditures for education of $1.3 billion, or 9.6 percent,above the 1984-85 level. Within each major expenditure category, signific~t program changes ha.ve been proposed. Some of the major GeneralFund changes include the following:
Medi-Cal expenditures are proposed to increase by $127 million, or 6.4percent. Three factors primarily account for this increase: provider rate
43
increases and a beneficiary cost-of-living adjustment ($71 million); increased expenditures to offset decreased receipts from the federal government ($93 million); and other changes in the cost per unit of service ($37million). These costs partially are offset by an estimated decrease in caseload.
SSIISSP expenditures are expected to be up $135 million, or 11 percentabove estimated current-year expenditures. This increase primarily reflects a 5.3 percent cost-of-living increase for grants ($103 million) andincreased caseloads.
Social Services Programs expenditures are up $84 million or 35 percentabove estimated current-year expenditures. This increase primarily reflects increased General Fund costs to replace a net decrease in federalfunds, ($11 million) as well as increases for cost-of-living ($27 million) andbasic caseload growth ($39 million).
Mental Health expenditures are $75 million, or 12 percent, higher in1985-86. The increase is primarily the result of $40 million in additiilnalfunding for local programs, a $15 million cost-of-living adjustment for localprograms, and increased staffing in state hospitals, costing $5 million.
K-12 Education expenditures are budgeted at $10.3 billion in 1985-86.This is an increase of $896 million, or 9.5 percent, over estimated currentyear expenditures. The primary factors accounting for this increase are:(1) $731 million for statutory and discretionary cost-of-living adjustments(COLAs); (2) $168 million for increased enrollment in public schools; and(3) $105 million to continue a program established by SB 813 (Ch 498/83)which provides fiscal incentives to school districts for increasing theamount of instructional time offered. These factors are partially offset bya $177 million reduction in General Fund requirements resulting fromanticipated increases in school district property tax receipts.
State Teachers' Retirement Fund contributions from the General Fundare proposed to increase by $63 million. Of this amount, $31 million represents an increase in the state's basic contribution to the fund (for inflationary and special adjustments), and $32 million to increase the purchasingpower protection for STRS retirees.
Higher Education General Fund expenditures are proposed to increaseby $323 million, or 8.7 percent. Expenditures for the University of California (UC) are budgeted to increase by $171 million, or 12 percent; expenditures for the California State University (CSU) are proposed to increaseby $102 million, or 8.9 percent; and General Fund expenditures for theCommunity Colleges are budgeted to increase by $50 million, or 4.5 percent.
Accounting for a significant portion of the increase for higher educationis $171 million in salary and benefit increases for UC and CSU faculty andstaff.
44
Youth and Adult Correctional Agency expenditures are proposed toincrease by $121 million in the budget year. This will fund 1,906 additionalpersonnel-years for the Department of Corrections and the increasedoperating expenditures needed to accommodate the 10 percent growth inthe prison population projected by the end of 1985--86.
Debt Service is expected to be $84 million, or 18 percent, higher in1985--86. This reflects the large volume of general obligation bond issuesapproved by the voters in the last two statewide elections.
Unallocated expenditures are budgeted at $374 million in 1985--86. Ofthis amount, $162 million is proposed for General Fund-supported civilservice and related employee compensation increases, $75 million hasbeen set aside to cover the costs of unidentified legislation enacted duringthe budget year, and $40 million is earmarked for legislation which wouldestablish a state loan guarantee to the Thrift Guaranty Corporation forpayments to account holders of an insolvent financial company.
45
RevenuesThe various expenditure programs discussed in the Analysis are support
ed by revenues which are derived from many different sources. Thebudget identifies over 50 specific revenue categories, ranging from taxeslevied on individuals and businesses, to income which the state earns fromits own assets, such as oil-producing properties and financial investments.
About 85 percent of all state revenues are deposited directly in theGeneral Fund, from which they may be appropriated to support thegeneral activities of state government. In most years, nearly 90 percent ofGeneral Fund revenue is derived from three sources: the sales and use tax,the personal income tax, and the bank and corporation tax.
Those state revenues that are not deposited in the General Fundnormally about 15 percent of the total-are placed into special funds tosupport specific programs and activities, including highway maintenanceand construction, and various education-related capital outlay projects.
The availability of revenues is the key determinant of how much thestate can afford to spend in providing goods and services to the public. Italso determines how much money will be available to set aside in reservefor a "rainy day," so that the state can be reasonably confident of its abilityto pay its bills on time, even if economic conditions deteriorate unexpectedly. Thus, in analyzing the Governor's Budget for 1985-86, it is importantto consider whether the state will collect sufficient revenues to (a) fundthe Governor's proposed spending plan, (b) finance new legislation whichthe Legislature may choose to enact, and at the same time (c) set enoughmonies aside to adequately protect the General Fund against possiblerevenue shortfalls or unanticipated expenditures.
This section examines the Department of Finance's forecast for revenues in the current and budget years, including the economic projectionsand other assumptions on which the revenue forecast is based.
SUMMARY OF THE REVENUE OUTLOOK
The level of revenues that the state can expect to receive will be determined by a wide variety of factors. These include how the state's tax baseis defined, the tax rates that are applied to this tax base, the effect thateconomic conditions will have on the size of the tax base, the time lagsbetween when tax liabilities are incurred and when they are actually paidto the state, the extent to which the Legislature chooses to enact legislation which affects the total amount of revenue collected, and other factorssuch as court decisions and actions of the federal government which directly affect revenues. Of these, the single most important factor influencing the level of California state revenues in 1985-86 will be the behaviorof the state's economy.
46
Continued Economic Expansion Assumed
The Department of Finance's economic forecast assumes that California's economy, like the nation's, will continue to expand throughout both1985 and 1986, although at a much more moderate pace than the spectacular growth of 1984. Also projected are continued declines in the unemployment rate and relatively moderate inflation. The department's assumption that economic growth will moderate is consistent with the consensusviews of economists generally and characteristic of what usually happensas an economic expansion matures.
Current Year Budget Year(1984-85) (1985-136)
$26,077 $27,9222,268 1,845
9.5% 7.1%
$4,926 $4,9991,110 7329.1% 1.5%
$31,003 $32,9213,377 1,918
12.2% 6.2%
$3,81675724.8%
$27,6263,335
13.7%
$23,8092,578
12.1%
General Fund Revenues-Amount .-Dollar change .-Percent change .
Special Fund Revenues-Amount .-Dollar change ..-Percent change ..
Totals, General Fund and Special Fund Revenues-Amount ..-Dollar change ..-Percent change ..
Drop-Off in Revenue Growth Expected
Table 18 summarizes the budget's estimates of how much state revenueswill be generated in the current and budget years if the department'seconomic forecast comes true. For comparison purposes, the table abosummarizes how revenues performed during the prior year. Chart 9, onthe other hand, shows the trend in state revenues, by source, over the pastdecade.
Table 18 indicates that:
• Prior-year (1983-84) total revenues were $27.6 billion ($3.3 billion, or14 percent, above the previous year's level). This amount consists ofabout $23.8 billion in General Fund revenues (up 12 percent) and $3.8billion in special fund revenues (up 25 percent). The largest singlecause of the unusually rapid growth in prior-year special fund revenues was a 23 percent increase in motor vehicle-related revenues,brought about by legislation that increased vehicle-related licenses,fees and fuel taxes (discussed in more detail below).
TAble 18Revenue Summary
General Fund and Special Funds1983-84 through 1985-86
(dollars in millions) a
Prior Year(1983-84)
a Source: Governor's Budget. Details may not add to totals due to rounding. Figures include effects ofvarious revenue-enhancing measures and certain shifts of revenues between various special funds andthe General Fund. General Fund revenue total for 1985-86 includes $137 million due to the Governor's proposed funding of energy-related tax credits through direct appropriations.
47
• Current-year (1984-85) total revenues are estimated to reach $31billion (up $3.4 billion, or 12 percent), consisting of $26.1 billion inGeneral Fund revenues (up 9.5 percent) and revenues to specialfunds of $4.9 billion (up 29 percent). The unusually rapid growth incurrent-year special fund revenues primarily reflects the discontinuation of large transfers from special funds to the General Fund. Thesetransfers occurred in 1981-82, 1982-83 and 1983-84.
• .Budget-year (1985-86) total revenues are projected at $32.9 billion($1.9 billion, or 6.2 percent, above the estimated current-year level).The total includes $27.9 billion in General Fund revenues (up $1.8billion, or 7.1 percent) and $5 billion in special fund revenues (up 1.5percent) .
Chart 9
Trends in State Revenuesa
1973-74 through HJ85-86 (in billions)
$35
projected
-----+.
2
2
74
.8 General Fund Revenues
• Special Fund Revenues
a Source: Governqr's Budgets and State Controller's reports,· Data" are for fiscal years ending In years shown.b Includ.es oth~r taxes, licenses, fees, interest income, ,transfers, .and other sources. Some afthe year~to-year
fluctuations 10 revenues in this category and in specla! funds 'revenues.reffe.ct year-ta-year shifts,in revenu~s
between these two categories.
No Budget-Year Growth After Adjustments for Inflation and Populption
Both by historical standards and relative to the currerit year, the reve~
nue growth rate projected for the budget year is low. Growth in totill sta.terevenues averaged 12 percent over the period 1973-74 through 1983-84,and is projected to be 12 percent in the current year as welL Tpis rate isnearly double the 6.2 percent growth rate projected in the budget year.
48
Likewise, revenue growth, after adjusting for the effects of populationgrowth and inflation, averaged close to 1.9 percent during the prior 10years, and is projected to be 4 percent in 1984-85. In contrast, inflationadjusted revenues per capita are expected to decline by 1.3 percent in1985-86.
While some of the drop-off in the revenue growth rate can be explainedby "special" factors, such as the effects of past legislation and ballot initiatives, it primarily reflects the expected moderation in the pace of economic activity during 1985 and 1986. This is particularly true in the case ofGeneral Fund revenues. In adc:lition, we believe that the department'sbudget-year General Fund revenue estimate is understated by about $345million, relative to the amount of revenues that its economic assumptionsshould produce. If the $345 million is added to total revenues as displayedin the budget, the projected increase become~ about 7.6 percent in 198586. This increase would be justenough to offset the effects ofinflation andpopulation growth on current-year'revenues. (General Fund revenuegrowth increases to around 8.7 percent when the $345 million is added in,or roughly in line with expected growth in personal income during 1985-00.) .
Thus, while the department's economic assumptions produce a revenuegrowth rate forthe budget year which is certainly well below the historicalayerage, it'is sufficiently high to at least keep total state revenues growing"instep" with inflation and population. .
We now turn to a more detailed discussion of state revenues in the prioryear (1983-84), current year (1984-85), and budget year (1985-86), following a closer look at the economic assumptions on which the current-year and budget-year revenue forecasts are based. .
THE ECONOMIC OUTLOOKEconomic performance during 1985 and 1986 will be the prime determi
nant of state revenue collections during the latter half of 1984-85 and in1985-86. Economic activity in calendar 1985 will account for about onethird of current-year (1984-85) General Fund revenues and about twothirds of budget~year (1985-86) General Fund revenues. The remainingone-third ofbudget-year revenues will be determined by economic conditions in 1986.
The economic outlook projected by the department for 1985 and 1986is a relatively favorable one. Most important, the economy is expected tocontinue expanding in both years, though at a slower pace than in 1984.
1984 Ends on a Strong Note
On balance, 1984's overall economic performance was very favorable.At the national level, real GNP grew by 6.8 percent, which was about 1percentage point faster than the department had expected one year ago.
49
As shown in Chart 10 and Table 19, the year also saw a decline in theunemployment rate, a further downward-drift in inflation, and fairlystrong performances for corporate profits, employment, car sales andhousing starts.
Table 19Department of Finance's Economic Outlook for
California and the. Nation·1984 through 1986
1984Estimated b
Unemployment rate (%) ,............ 7.5%Savings rate (%) 6.0Prime interest rate (%) ;......... 12.1New car sales (millions of units) 10.4Housing starts (millions of units) 1.81
Economic Indicator1. National Economy
Percent change in:-Real GNP ; ..-Personal income , ..-Pre-tax corporate profits ..-Wage and salary employment ; .-Civilian employment , ..-GNP prices ;-GNP consumer prices .-Consumer Price Index ; ..
Unemployment rate (%) ;; ; .New car registrations (thousands of units) .New building permits (thousands of units) ..
2. California Economy
Percent change in:-Personal income ..~Wage and salary income ..-;"Wage and salary, employment ..~Civilian employrilent .-Consumer Price Index ..-Key elements of t~ 'state's tax base:
-Taxable personill income C .
-Taxable sales , .-Taxable corporate profits ..
a Source: ~vernor's Budget and Department of Finance.b As estimated in December 1984 and published in the 1985-86 Governor's Budget.C Defined as total personal income plus social security contributions minus transfer payments and "other
labor mcome." This income concept historically has shown a strong correlation to adjusted grossincome reported for tax purposes in Ciilifornia.
California's performanci:lin 1984 was even better, as the state registereda phenomehal8.5 percent increase in "real" personal income (please seeChart 11) and an extremely strong 6.1 percent gain in wage and salaryemployment (please see Chart 12). As a result, California's unemployment rate declined by almost 2 percentage points, a record one-year drop.
/
50
Chart 10
Trends in Key N.ational ECbnomic Vadables1973 through 1986 a
b Inflation as measured by the GNP consumption expenditures deflator.
Table 19a1so indicates that the key elements of the state's tax base, including taxable sales and corporate profits, all registered strong gains. Asshown in Table 20, California's economic performance was inuch strongerthan predicted prior to the start of the year, especially in terms of thegrowth in personal income, wage and salary employment, and taxa.blesales.
Of course, the economy was not without its problems in 1984. Theseincluded persistently high interest rates (please see Chart 10), seriousinternational debt problems, a record-high foreign trade deficit and, ofcourse, a $200-billion-plus annual federal budget deficit with no near~termprospects for eliminating it. Likewise, the pattern of economic growthwithin 1984 was surprisingly uneven, with strong gains in the first twoquarters of the year giving way to weakness in the third quarter. Thisraised concerns that the economy might be headed downward. However,the economy grew at a Strong 4 percent annual rate in the fourth quarter,doing much to alleviate these concerns. Thus, despite its problems, theeconomy ended 1984 and began 1985 on a fairly strong note.
51
Table 20Accuracy of Economic Forecasts
for California in 1984
RevisedOriginal Forecasts Department
DepartmentOther Forecasters b
ofFinance January 1985of June 1984 Estimated
Economic Indicator Finance" Lowest Average Highest Forecast Actual c
"Source: 1984-85 Governor's Budget.b Includes First Interstate Bank, Security Pacific Bank, Bank of America, Crocker Bank, UCLA, and the
Commission on State Finance. Forecasts are as of approximately year-end 1983, corresponding towhen the Department of Finance constructed the economic assumptions contained in the Governor'sBudget for 1984-85. For detail on these forecasts, please see 1984-85 Perspectives and Issues, Table28, page 73.
c Source: 1985-86 Governor's Budget.
Continued Growth Expected
Table 19 summarizes the department's economic forecast for the nationand California. This forecast reflects the consensus view among economists tllat the current economic expansion, which began in 1983, will slowbut nevertheless continue throughout 1985 and 1986. For the nation as awhole:
• Real GNP is projected to rise by 3 percent in 1985 and 3.3 percent in1986. While well below the 6.8 percent gain in 1984, these are healthy,sustainable rates of growth.
• Pre-tax corporate profits are expected to post a relatively small 2percent gain in 1985, followed by a 15 percent improvement in 1986.
• Unemployment is expected to drift downward to 7.2 percent in 1985and 6.6 percent in 1986, reflecting modest gains in civilian employment of 2.2 percent and 2.1 percent in the two years, respectively.
• Housing starts (1.7 million units in 1985 and 1.8 million in 1986) areprojected to hover at the same general level that was reached in 1984(1.8 million). The same general leveling off is expected for new carsales-1O.2 million units in both 1985 and 1986, compared to 10.4million units in 1984.
California To Outperform Nation
Table 19 also shows that, although the pace of economic activity inCalifornia is expected to slow from 1984, the state is still expected tooutperform the nation. For example:
52
• Personal income in California is projected to rise by 8.6 percent in1985 and 7.9 percent in 1986, versus 7.5 percent and 7.4 percent,respectively, at the national level. And, as shown in Chart 11, "real"personal income growth in the state (4.8 percent in 1985 and 3.6percent in 1986) is expected to compare favorably with the growthrates realized during the past decade (an average of 3.8 percent forthe 1973-through-1983 period).
Projected
~
Percent change in total personal income(entire bar)
II Percent change in "real" personal income b
14
Chart 11
Annual Growth in California Personal Income1973 through 1986 a
Annual Percent DChange
16%
12
10
8
6
4
2
73 74 75 76 77 78 79 80 81 82 83 84 85 86a Source: Department of Finance estimate for 1984 and projections for 1985 and 1986.b Real personal income is defined as total personal income deflated by the GNP consumption expenditures deflator.
• Employment growth projected for California (3.5 percent in 1985 and2.2 percent in 1986 for civilian employment; 3.7 percent in 1985 and2.9 percent in 1986 for wage-and-salary employment) is expected tooutdistance national employment growth rates. Although the state'semployment growth rates are, from an historical perspective, relatively moderate (Chart 12), they translate into a very large numberof new jobs-nearly 400,000 in 1985 and over 300,000 in 1986.
• The state's unemployment rate is expected to drop rapidly, as a resultof these job gains, and fall below the national unemployment rate inboth 1985 and 1986. As Chart 12 shows, the expected 6.9 percent and6.4 percent unemployment rates forecasted for California in 1985 and1986, respectively, would be amongst the lowest since 1973.
53
Chart 12
Trends in California Employment and Unemployment1973 through 1986 a
10%
8
6
4
2
o
- 2 _ Annual growth in wage and salary employment
----- Civilian unemployment rate
73 74 75 76 77 78 79 80 81 82 83 84 85 86
a Sources: Department of Finance and Employment Development Department. Data are estimated for 1984.
The implications of the current economic outlook for state revenues arebest seen in the forecast for those key California variables which mostdirectly affect the state's major revenue sources. As shown in Table 19:
• "Adjusted" personal income (that is personal income adjusted fortransfer payments and social security contributions, so as to roughlyapproximate "taxable" personal income) is projected to increase by9.1 percent in 1985 and 7.9 percent in 1986.
• Taxable corporate profits are forecast to rise 9.9 percent in 1985 and17 percent in 1986, following 1984's gain of 18 percent and 1983's gainof 17 percent (please see Chart-l4). The cumulative 78 percent increase for these four years (1983 through 1986) is in sharp contrast tothe preceding four years, and compares favorably to the era of 20percent-plus increases experienced from 1976 through 1978, after the1973-75 recession ended.
• Taxable sales are predicted to rise 8.4 percent in 1985 and 7.9 percentin 1986. Because of continuing moderate inflation, these gains willallow for fairly good increases in "real" taxable sales, including 4.6percent in 1985 and 3.6 percent in 1986 (please see Chart 13).
54
Inflation-Outlook Remains Good (For Now)
Chart 10 shows the trend of general inflation faced by consumers nationally since 1973 and the department's projected rate of inflation for 1985and 1986.
The chart and Table 19 indicate that a major upswing in inflation is notexpected during either 1985 or 1986. Some uptick is projected at thenational level, both for GNP prices generally and GNP consumer prices.The same is projected in 1986 for the Consumer Price Index. However, theoutlook for Consumer Price Index inflation shows relative stability forboth 1985 and 1986 in California (4.9 percent in each year) and for 1985nationally (4.4 percent). The general consensus among economic forecasters is that a major near-term escalation of inflation is not likely.
There are several reasons for this view. First, as shown in Table 21, unitlabor costs (which are a prime determinant of the inflation rate) areexpected to grow relatively slowly despite a projected drop-off in hourlylabor productivity gains, reflecting moderate increases in hourly laborcosts. Second, the softness in world oil prices is expected to keep gasolineprices low. A third reason is the currently high value of the dollar ininternational currency markets. While having the negative effect of drawing jobs and production away from the United States, the strong dollarallows consumption of more lower-cost foreign imports which bothreduces costs to consumers directly and tends to hold down the prices ofdomestically-produced items.
"Core"Inflation C
9.3%9.08.66.65.04.33.8
CPI13.5%10.46.13.24.33.74.0
Inflation RateGNP Deflator
Total Consumption9.2% 10.2%9.6 8.76.0 5.93.8 3.73.8 3.33.5 3.43.8 3.8
Table 21Trends in Factors Influencing National Inflation
1980 through 1986 a
Growth in Growth inHourly Labor UnitCompensation Labor Costs b
a Data for 1984, 1985 and 1986 from Data Resources, Inc., Review of the u.s. Economy, January 1985.b The annual change in unit labor costs is approximately equal to the difference between growth in hourly
labor compensation and productivity growth.C This variable has been developed by Data Resources to reflect the "underlying" rate of inflation, which
depends on such factors as unit labor costs and is free of transitory phenomena and temporary priceshocks involving such commodities as food and fuels.
These factors are expected to offset any upward pressure on prices thatusually occurs as continued economic expansion causes labor markets totighten and the amount of "excess capacity" in the economy to decline.
55
Despite the relatively moderate rates of inflation projected for the nexttwo years, we should still be concerned about the threat inflation poses tothe economy. As we learned all too well during the 1970's, the'rate ()finflation can accelerate quickly if monetary growth is not controlled, orif outside shocks, such ~ disruptions in the supply of oil, occur. Furthermore, even a 5 percent inflation rate makes prices double in only 14 years,and can cause problems such as Unintended income redistributions, instability in financial markets, and high interest rates. Thus, controllirigandreducing inflation should remain a top priority of the nation's economicpolicymakers.
Interest Rates-Only Temporary Improvement Expeded
The problem of high interest rates, which h~ plagued the economysince the late 1970's, is expected to lessen in 1985. The improvement,however, is only expected to be temporary, with rates drifting upward by1986. Specifically, the department is projecting that:
• The prime rate will average 11.2 percent in1985 and 11.8 percent in1986, versus 12.1 percent in 1984; and
• The average mortgage rate will be 13.8 p~rcent in 1985 and 13.9percent in 1986, compared to 14.1 percent fu 1984.
Current data suggest that the department's 1985 interest rate forecastcould be a bit high, since the prime rate has been reduced seven timessince September 1984 and now stands at 10.5 percent. In fact, UCLAcurrently projects that the prime rate will average 10.6 percent and mortgage rates will average 12.7 percent in 1985, while Data Resources, Inc.(DRI) predicts a 1985 average prime rate that is even 10wer-,-10.1 percent. Nevertheless, the department's assumptioJ:). that interest rates willreverse course and drift upwards later in 1985 reflects the consensusamong most economists, including UCLA, and DRI. And, should 1984'sstrong fourth. quarter economic performance carry into the first half of1985, this could bring with it upward interest rate pressures.
In addition to their failure in accurately predicting future changes. ininterest rates, economists have been unable to fully explain why interestrates have been at stich historically-high levels;~ recent years. This isespecially true of "real" long-term interest rates ,(that is, interest ratesadjusted for inflation) . Most economists believe that interest rates currently are higher .than they "should be," based upon such factors as demandand supply for credit and the rate of inflation. Although these economistshave offered a variety of possible explanations for the high rates-including fears, of a new inflation surge and the impact that federal budgetdeficits in the future are likely to have on the capjtal markets-there is noconsensus as to exactly what the real causes of today's high interest ratesare and, therefore, where these rates will head in the future.
56
What is clear is that continued high interest rates will tend to hurteconomic activity. In many cases, the types of economic activity mostaffected by high interest rates are those very types that are important tothe continued growth of the ~conomy, such as business investment andhomebuilding. Expenditure growth in both of these categories is expectedto taper off in 1985, due to the combined effects of a more slowly growingeconomy and relatively high long-term interest rates. High interest ratesalso contribute to our foreign trade problems, since they draw in foreigncapital to the U.S., thereby raising the value of the dollar and reducing thedemand for our exports.
Federal Budget Problems Still Unresolved
Despite all of the attention directed at the federal budget deficit duringthe past several years, the deficit problem remains unresolved. Most forecasters expect the federal deficit to be in the $200-billion-plus range boththis year and next and, if no action is taken, to remain at this level thereafter. These forecasters generally do not believe that the economy will beable to "grow itself out" of the deficit, since the federal government'sexpenditure base is simply out-of-line with its revenue base.
Countless predictions have been made as to what the full economicimplications of the deficit will be. Some economists believe that thesedeficits eventually will cause interest rates to rise to excessive levels,thereby stunting economic growth and investment and eventually leadingto lower productivity and higher inflation. On the other hand, othereconomists maintain that much of the concern about deficits is overstated,and that the economy will somehow "learn to live with them." Last yearat this Wne, for example, there was considerable concern that problemsrelated to the deficit might abort the recovery; yet, the economy performed quite well in 1984 and interest rates actually fell. These economistsalso argue that in recent years, the federal budget deficits may haveactually benefitted the economy, by generatiIlg demand for productionand jobs while the private sector was weakened by the recession. They alsopoint to the fact that one reason why the deficits exist is the generousfederal tax benefits that were enacted in 1981 and 1982, which themselvesare aimed at aiding the private sector.
The truth about the deficit problem is that no one really knows at thistime exactly what these deficits will do to the economy. What does seemclear, however, is that over time, the economy would be healthier withoutthese deficits than with them. In any event, the implications of continuingfederal budget deficits are a major cause of uncertainty regarding theeconomic outlook.
A second area of uncertainty related to federal budget policies involvesexactly what expenditure and taxation policies Congress will adopt thisyear. While this is always a source of uncertainty, it is more so this year
57
than normally, for two reasons. First, the federal government is considerkg expenditure cutbacks in a number of areas that would have directimplications for state governments-particularly with regard to theirhealth and welfare programs. Second, the U.S. Treasury has proposed tocompletely overhaul the U.S. personal and corporate income tax system.Among other things, this proposal would lower tax rates, raise personalexemptions, and repeal or modify many existing deductions, exclusions,credits, and preferential treatments for certain types of income and expenses. The primary effects of this proposal would be to redistribute thetax burden away from individuals and toward businesses, and make the taxsystem more "neutral" in terms of its effects on taxpayers' decisions abouthow to spend and invest their money. This proposal could have a numberof significant economic effects. It would not, however, have much of anear-term effect either on total federal revenues collected or on the federal budget deficit.
Finance Versus Other Forecasters
Table 22 compares the Department of Finance's national and Californiaeconomic forecasts for 1985 with those which were made by other economists at approximately the same point in time (year-end 1984). Generally
Department of Finance 8.6%Other ForecastersUCLA 9.7Security Pacific Bank 9.4First Interstate Bank...................................... 10.0Crocker Bank 8.9Bank of America 11.0Wells Fargo Bank............................................ 9.0Commission on State Finance 8.7
Average of "Other" Forecasters 9.5%
NewPercent Change In: Residential
"Real" Wage and BuildingConswner Personal Salary Unemploy- Pennits
Prices Inoome d Jobs ment Rate (thousands)4.9% 3.5% 3.7% 6.9% 185
a Forecasts prepared as of approximately year-end 1984.b Includes the projections ofSD-odd economists as published in Blue Chip Economic Inmcatorsfor January
1985. The consensus forecast for 1985 real GNP growth was increased to 3.7 percent in February 1985.C Represents the lowest/highest forecast for each variable as published in Blue Chip Economic Indicators
for January 1985, after eliminating the most extreme high and low forecast reported.d Defined as personal income adjusted for consumer price inflation.3-79435
68
speaking, the department's economic forecast is about where those ofmost other public and private forecasters were when the departmentprepared its forecast (November-December 1984). Since then, many forecasters have revised their projections upward a bit, based upon such factors as the greater-than-expected drop in the prime interest rate and thestronger-than-predicted real growth in GNP during the fourth quarter.
Nevertheless, the department's overall forecast is not fundamentally outof line. Most forecasters still envision the same general type of economicperformance in 1985 that Finance does: fairly moderate inflation andhomebuilding activity, healthy but reduced gains in output and employment, declining unemployment, and mild growth in national corporateprofits.
However, if one were to characterize the department's 1985 forecast asbeing toward one end ofthe forecasting range or the other, onewould putit toward the "low" end. As Table 22 shows, the department's forecast isa bit below the consensus for national real GNP growth, corporate profits,car sales, homebuilding activity, and both "nominal" and "real" Californiapersonal income growth. Even so, the general story told by all of theforecasters is pretty-much the same, and the differences between thosestories are not such as to suggest the department's forecast is "out-of-line"or less reasonable than anyone else's. .
PRIOR-YEAR (1983-84) REVENUES
General Fund revenue collections in 19~, the most recently-completed fiscal year, totalled $23.8 billion. This represents an increase of $2.6billion (12 percent) over 1982-83.
Revenue Growth Rebounded From Recessionary Lows
The rate of growth in revenues during 198~ was about average byhistorical standards. For example, over the period 1970-71 through 198283, General Fund revenue growth averaged 14 percent per year. Prioryear revenue growth was also about average in "real" terms (that is, afteradjusting for inflation)--5.5 percent, versus 5.4 percent for the 1970-71through 1982-83 period. Revenue growth during the prior year, however,was extremely strong compared to growth during the 1980-81-through1982-83 period, when the economy was in a recession. During this period,revenue growth averaged only 5.6 percent in nominal dollar terms andactually declined after adjusting the growth rate for inflation.
As for the performance of individual revenue sources in 19~:
• Sales and use taxes increased by 13 percent, or $996 million;• Personal income taxes rose by 20 percent, or $1.6 billion (this abnor
mally high increase partly reflects cash-flow factors and the timing ofincome tax indexing adjustments to withholding tables);
59
• Bank and corporation taxes increased by 26 perqent, or $664 million;• Income from all other sources including investments, other taxes,
special fund transfers, fees and royalties fell, by 21 percent, or $698million.
Growth Would Hav.eBeen Even Higher Without Special Factors
The decline in General Fund income from "other sources" in 1983--84is explained primarily by two special factors that were completely unrelated to the level of economic activity. First, revenues from death-relatedtaxes fell by $324 million in 1983--84, due to the phasing-in of Proposition6 (June 1982) and Ch 634/80 (discussed later). Second, Ch 327/82 increased insurance tax revenues by $227 million in 1982-83 and reducedthem by $112 million in 1983--84. It did so by revising the due dates forinsurance tax prepayments. The remaining decline in income from "othersources" reflects such factors as the decline in the amount of tidelands oilrevenues transferred to the General Fund. In the absence of these specialfactors, revenues from "all other" sources would have risen in 1983-84, andtotal General Fund revenue growth would have exceeded 15 percent. Thisstrong "underlying" growth trend reflects the strong economic performance that occurred, particularly during the first six months of 1984.
Improving Economy Caused Upward Revenue Revisions
Table 23The Department of Finance's
. Track Record for Forecasting Revenues in1983-84 and 1984-85
(dollars in_millions) a
-en.-91
94202
$138$114"$252
$26,077
82$917
$1,090 d
$2,007$23,809
Revenue Estimate For1983-84 1984-85$21,802 e $25,825
-11032028427368
History of Changes
A. Original budget estirhate b .
B. Revisions due to economic factors and technical reestimates-April 1983 ..-June 1983 .-January 1984 ..-May 1984 ..-June 1984 ; ; .-July 1984 ..-January 1985 .
Subtotals :..C. Revisions due to other factors, including legislation and court casesD. Total revisions .E. Actual!estimate as reflected in the Budget for 1985-86 ijanuary 1985.)
a Information in the table was developed from Department of Finance data. For additional detail on thisinformation, including the composition of economics-related revenue adjustments by type of tax, seePerspectives and Issues for 1983-84 and 1984-85, and Why Aren't Revenue EstiIIiates More Accurate?,Legislative Analyst, Report 84-13, November. 1984.
b Published in January preceding the start of the fiscal year.e Excludes proposal contained in the 1983-84 Governor's Budget to raise revenues by $677 million.d Includes $980 million from 1983 legislation associated primarily with various tax accelerations and the
transfer of special fund monies into the General Fund. Also includes $18 million from 1984 legislationand $92 million from court decisions and federal law changes.
"Includes $84 million in interest income earnings from the state's short-term external borrowing program(this gain will be partially offset by the interest costs of short-term external borrowing). Also includes$30 million from 1984 legislation.
60
Table 23 summarizes the department's track record in estimating 198384 revenues. It indicates that actual 1983-84 revenues were more than $2billion above the department's initial Ganuary 1983) estimate for thatyear. Nearly $1.1 billion of the difference was due to such factors as legislation, court decisions and federallaw changes. The remaining $917 millionreflected the fact that the economy did not perform as the departmentforecast, as well as technical revenue reestimates.
As Table 23 shows, the department did not completely anticipate eitherthe strength or timing of the economic recovery. For example, after the1983-84 revenue estimate was first made, the department actually reduced it. Then, beginning in June 1983, it began revising its estimateupward, step-by-step.
Table 24 shows, however, that the magnitude of the difference betweenthe department's revenue estimates forl983-84 and actual revenues wasconsiderably less than the average discrepancy in preceding years. Thus,from an historical perspective, the department's revenue estimating performance for 1983-84 was above average.
Table 24Discrepancies Between Estimated and Actual
General Fund Revenues Attributable to Economic andTechnical Factors
1973-74 through 1983-84 •
Percent Difference Between ActualRevenues and:
6.410.810.6
Original JanuaryPeriod Budget Estimate1. 1983-84 4.2%2. Prior l()..year period
(1973-74 through 1982-83)-Average discrepancy b ..
-Largest underestimate .-Largest overestimate ..
First MayEstimate
3.2%
4.97.57.6
MidyearEstimate(January)
1.9%
2.54.93.5
a Information in the table was developed by Legislative Analyst"s office from Department of Financehistorical revenue data. For year-to-year details on the department"s revenue estimating discrepancies, see 1984-85 Perspectives and Issues and Why Aren't Revenue Estimates More Accurate?, Legislative Analyst, Report 84-13, November 1984.
b Unweighted average of absolute values of percent revisions for individual years.
CURRENT-YEAR (1984-85) REVENUES
General Fund revenue collections in 1984-85 are projected to total $26.1billion. If this level of collections is realized, it will represent an increaseof $2.3 billion (9.5 percent) over the prior-year level. Although the paceof revenue growth expected in1984-85 is well below that experienced in
61
1983-84, it is healthy. The slowdown merely reflects the economy's slowing from the extraordinary rapid pace it exhibited in early 1984. As forindividual revenue sources:
• Sales and use taxes are expected to increase by 12 percent, or $1.1billion.
• Personal income taxes are projected to rise by 13 percent, or $1.2billion.
• Bank and corporation taxes are projected to rise by 9.1 percent, or$294 million.
• Income from all other sources, including investments, other taxes,special fund transfers, fees and royalties, are projected to decline by11 percent, or $280 million.
Underlying Growth Trend Understated
As in the prior year, there are a variety of special factors which, takentogether, have caused the rate of projected revenue growth for the current year to be artificially low. These factors include the continued phasing-ill of death-ta,x reductions required by Proposition 6 and Ch 634/80and, most significant, the absence in 1984-85 of over $650 million in General Fund income from vehicle license fees and tidelands oil revenueswhich is reflected in General Fund income for 1983-84. These factorsmore than offset the positive effects on 1984-85 revenue growth caused bythe state's one-time tax amnesty program ($30 million), nearly $265 million in special fiduciary and death-related tax payments, "arbitrage" investment earnings associated with the state's new external borrowingprogram, and the $112 million reduction in insurance tax receipts during1983-84 brought about by Ch 327/82. In the absence of these and vanousotherspecial factors, current-year General Fund revenue growth wouldhave been closer to 12 percent, than the 9.5 percent that is projected inthe budget.
Net Revenue Revisions Minor
As shown in Table 23, the revisions to the department's revenue estimates during the past 12 months have added $252 million to the originalestimate, of which only $138 million reflects economic forecasting revisions and technicll1 reestimates. The $138 million net revision to date ismuch smaller than the mid-year revision for 1983-84 attributable to economic factors-$494 million. Since the department's revenue estimatingrecord in 1983-84 was above average by historical standards, its record for19B+-:85 thus far is all the more. impressive.
BUDGET-YEAR (1985-86) REVENUES
Table 25 presents the department's estimates ofstate revenues for 198586. Total state revenues in the budget year are projected to reach $32.9billion, a gain of 6.2 percent ($1.9 billion) over 1984-85. This gain repre-
62Table 25
State Revenue Collections1!183-14 through 1985-86
(dollars in millions) •Change
Actual Estimated Projected 1984-85 to 1985-86General Fund 1983-84 1984-85 1985-86 Amount PercentTaxes:
Sales and use ...................................... $8,639 $9,705 $10,510 $805 8.3%Personal incomeb .............................. 9$1 10,485 11,165 680 6.5.Bank and corporation C .............. , ..... 3,231 3,525 3,950 425 12.1Inheritance imd gift d ...................... 109 100 34 -66 -66.0Insurance e .......................................... 457 635 675 40 6.3Cigarette ............................................ 185 183 180 ...,.3 -1.4Alcoholic beverage .......................... 137 137 140 3 2.3Horse racing ...................................... 125 120 122 2 1.7Estate .................................................. 128 175 159 -16 ~9.1--- --- --- -- --
Oil and gas revenues........................ 143 500 448 -'-52 -10.3Sales and use b .................................. 159 125 lOB -17 -"'13.6Interest on investments .................. 112 137 123 -14 -10.2Cigarette tax ...................................... 78 78 77 -1 -1.5Other.................................................... 205 816 814 -2 -0.2--- --- --- -- --
Totals, Special Funds .................. $3,817 $4,926 $4,998 $73 1.5%
Totals, State Funds ...................... $27,626 $31,003 $32,921 $1,918 6.2%
a Source: 1985-86 Governor's Budget. Details may not add to totals due to rounding. Percent changes arecomputed prior to rounding.
b Includes $122 million in 1985-86 resulting .from the Governor~s proposal to fund energy tax creditsthrough direct appropriations.
C Includes $15 million in 19815-$ resulting from the Governor's proposal to fund energy tax credits throughdirect appropriations.
d The decline in these revenues overtime is due to Proposition 6 (June 1982), which repealed inheritanceand gift taxes and fu their place imposed an estate "pick-up" tax.
e Revenues were reducedby.about $112 million in 1983-84 due to the tax acceleration provisions of Ch3Z1182 (SB 1326), which also had increased revenues by about $2Z1 million in 1982-83.
f Ch 541/81 (SB 215) increased the motor vehicle and diesel fuel tax rates from 7 cents to 9 cents per galloneffective January 1983, and implemented substantial fee increases related to vehicle operation beginning in 1982. Ch 933/81 (AB 202) increased registration fees further but will expire after 1985. Ch323/83 (AB 223) revised the methods of determining the "market value" of new vehicles and thedepreciation schedule for existing vehicles, and also accelerated the payment of fuel tax revenues.The compined effect of these measures on vehicle-related taxes and fees is $246 million for 1983-84,$236 million for 1984-,85, and $260 million for 1985-86.
g Includes trailer coach fees.h Reflects sales and use tax receipts to the Transportation Planning and Development Account in the
Transportation Fund as specified under Ch 161/79 (SB 620) and Ch 541/81 (SB 215).
63
sents a sharp fall-off from the current-year's projected rate of increase,which is almost twice as large-12.2 percent. Of the total amount, about85 percent represents General Fund revenues and 15 percent representsspecial fund revenues.
General Fund Revenues
As shown in Table 25, General Fund· revenues in the budget year areforecast to reach $27.9 billion, a gain of $1.8 billion (7.1 percent). The1985-86 amount includes nearly $11.2 billion in personal income taxes (a6.5 percent gain), $10.5 billion in sales and use taxes (an 8.3 percent gain),and nearly $4 billion in bank and corporation taxes (a gain of 12 percent).These reasonably healthy growth rates reflect the department's forecastof a continued economic expansion throughout 1985 and the first half of1986.
Revenue Trend Relatively Free of Distortions
The 7.1 percent growth in General Fund revenues projected for 1985-86is relatively free of distortions from special factors. This is not to say thatthere are no sucih distortions at work in 1985-86. Indeed, there are four:(1) growing revenue losses from the phasing-out of inheritance taxes, (2)revenue gains from the tax amnesty program, (3) artifically high currentyear revenue collections from unexpectedly large fiduciary tax paymentsand death-related taxes involving three extremely wealthy Californians(one of whom was Howard Hughes), and (4) the Governor's proposal tofund the state's current energy tax credit programs by direct appropriations instead of through tax credits. These factors, however, partially offsetone another and the underlying revenue growth trend which emergesafter adjusting for them-about 7.6 percent-is not dramatically differentfrom the projected rate-7.1 percent.
Tapering Revenue Growth Due To Slower Economy
The projected growth rate in General Fund revenues during the budgetyear (7.1 percent, or 7.6 percent after adjustment for special factors) isdecidedly below the projected rate for the current year (9.5 percent, orabout 12 percent after adjustment for special factors). The reason for thissharp drop-off is that, although the California economy is expected tocontinue expanding during both 1985 and 1986, the pace of expansion isexpected to be slower than in 1984. This reduced rate of general economicexpansion will in turn slow the rate at which the major elements of thestate's tax base, and thus revenue collections themselves, grow.
64
Moderate Gains For Personal Income Taxes
Personal income taxes are projected to rise by 6.5 percent in the budgetyear. This compares to a projected increase of nearly 13 percent for thecurrent year. Thus, the rate of growth in personal income tax collections,while still fairly good, is expected to moderate sharply.
There are two reasons for this moderation:
• First, there is the anticipated slowdown in California personal incomegrowth, from over 12 percent in 1984 to 8.6 percent in 1985 and 7.9percent in 1986.
• Second, the "elasticity" ofpersonal income tax collections is expectedto be relatively low in both 1985 and 1986.
Income Tax "Elasticity" to Decline. The best way to understandthe income tax projections for any fiscal year is to examine the projectionof income tax liabilities for the calendar years which underlie the fiscalyear revenue estimates. Year-to-year growth in tax liabilities can be related to three factors-the growth in (1) the number of taxpayers (which iscorrelated with employment growth), (2) average taxable income pertaxpayer (which is correlated with average personal income per employee), and (3) the June-to-June change in the California ConsumerPrice Index (the CCPI,which is used underthe income tax indexing lawto annually adjust the state's marginal income tax brackets and various taxcredits and deductions for inflation).
The percentage increase in tax liabilities which results from each 1percentage point of income growth (that is, the "elasticity" of tax revenues) is influenceddifferently by each ofthese three variables. For example, (a) rapid growth in average income tends to produce a "high" elasticity, as taxpayers move into higher tax brackets, (b) rapid growth in theCCPI tends to produce a "low" elasticity, as tax bracket boundaries areshifted outward, causing taxpayers to move back into lower brackets, and(c) growth in employment per se historically has resulted in about thesame percentage increase in tax liabilities.
Table 26 shows those variables in the department's economic forecastthat are the primary determinants of estimates of income tax liabilitygrowth and elasticity. The table also shows our estimates of income taxliability growth and elasticity, using these same economic assumptions andour own personal ~come tax revenue-estimating model. The table indicates that elasticity is expected to drop from about 1.75 in 1983 to 1.25 in1984, and to 1.02 in 1985, before rising slightly to 1.04 in 1986. What thismeans is that a given percentage point of personal income growth produced fewer tax dollars in 1984 than in 1983, and will produce still fewertax dollars in 1985 and 1986.
65
Table 26Estimates of Income Tax
"Elasticity" and Its Determinants1983 through 1986
Average Real IndexingIncome Per AdjustmentEmployee b Factor C
6.9% -1.2%4.1 4.60.4 5.00.6 5.1
ImpliedTax
Liabilities d
12.4%16.89.28.4
ElasticityofTax
Liabilitieswith
Respectto Income"
1.751.251.021.04
a Defined as personal income minus transfer payments plus social security contributions. This incomeconcept historically has shown a strong correlation to adjusted gross income reported for tax purposes.
b Growth in average adjusted personal income per employee, adjusted for the indexing adjustment factor(the June-to-June change in the California Consumer Price Index).
C June-to-June change in the California Consumer Price Index (statutorily mandated).d Estimated by Legislative Analyst's office using Department of Finance economic forecast. The depart
ment's own estimates of tax liability growth differ somewhat from these figures."Estimated by Legislative Analyst's office. Figures represent the ratio of tax liability growth to growth
in adjusted personal income shown in the table, computed prior to rounding.
The principal reason for the decline in elasticity shown in Table 26 is thedrop in the growth of average real income per employee. It is this variable,which the department projects to be negligible in both 1985 and 1986, thatgives elasticity its "punch" by propelling taxpayers into higher tax brackets more rapidly than indexing shifts the boundaries of the individual taxbrackets outward. Clearly, if the department's economic forecast comestrue, there won) be any such "punch" in 1985 and 1986, and therefore,grpwth in incoII;l;e tax liabilities will be limited to approximately the rateof income growth.
Our estimate of how much personal income tax revenues the department's economic forecast should produce is a bit higher-by about $120million for the current year and budget year combined-than the department's own estimate. This difference, which is concentrated in the budgetyear, is less than 1 percent of the nearly $22 billion to be collected inpersonal income tax revenues for the two years combined.
Special Revenue Adjustments. The personal income tax projectionfor the budget year includes $162 million from two special factors:
• Tax Amnesty. The projection assumes that $40 million will be received as a result of the tax amnesty program established by Ch1490/84 (AB 3230). This program offers taxpayers a one-time opportunity to "come forward" and pay their back taxes without penalties,provided they do so prior to March 15, 1985,when the higher penaltiesand stricter enforcement procedures also established by Chapter 1490take effect. This program also is expected to bring in $19 million inpersonal income tax revenues in the current year, or total revenuesof $59 million for 1984-85 and 1985-86 combined. (An additional $11
66
million in current-year amnesty revenues is expected from the salesand use tax, making the total expected two-year revenue gain fromthe program equal to $70 million.)
• Energy Tax Credit Proposal. The revenue projection for thebudget year also includes $122 million in personal income tax revenues that would result from the Governor's proposal to eliminate thestate's current energy tax credit program. The administration proposes to replace the present tax credit mechanism with a direct annual appropriation to fund a portion of these credits.· (An additional $15million revenue gain is included in the budget-year revenue estimatefor the bank and corporation tax, making the total revenue gain forthe proposal equal to $137 million). The Governor's proposal is discussed in Part Three of this volume and under Item 9100 of theAnalysis.
Taxable Sales-Unspectacular But Steady
As shown in Table 25, sales and use taxes are projected to increase by8.3 percent in the· budget year. While this increase is well below the 12percent anticipated in the current year, it is still a good, solid increase.
The projected rate of growth in sales tax revenues during 1985-86 meansthat growth intaxable sales is expected to pretty-much mirror the growth
Projected
---+Percent change in total taxable sales(entire bar)Percent change in "real" taxable sales b
D•20
Chart 13Annual Growth in California Taxable Sales1973 through 1986
a Source: California Department of Finance.b "Real" taxable sales equal total taxable sales (current-dollars) deflated by the GNP price deflator for consumption expenditures.c Total taxable sales declined by 0.4 percent.d Taxable sales in 1984 include an estimated $630 million due to the Summer Olympics in Los Angeles and the Nation~1
Democratic Convention in San Francisco. . ..
67
in California personal income-both in the second half of 1985 andthroughout 1986. This consistency shows up, regardless ofwhether growthis expressed in either no:minal or "real" terms. This is confirmed by comparing Chart 11 and Chart 13, and by looking at the ratio of taxablesales-to-personal income contained in the department's economic forecast.
As Table 27 shows, the taxable sales-to-personal income ratio droppedfor three consecutive years-from 57 percent in 1979 to under 55 percentin 1980, under 53 percent in 1981, and under 50 percent in 1982. Then, asthe econ.omic recovery set in in 1983, the ratio rose slightly to nearly 51percent, and rose again in 1984 to slightly over 52 percent. As Chart 13illustrates, taxable sales growth in "real" terms during 1984 was nothingshort of spectacular-over 11 percent. For both 1985 and 1986, however,the department projects that the ratio will hold steady at·52 percent, orjust a notch below the 1984 level. This assumes th~t taxlible sales will riseby 8.4 percent in 1985 and 7.9 percent in 1986, or at a pace that is nearly
Table 27Historical Trends in Ta.xable Sales in California
1968 through 1986·(dollars in millions)
Ratio ofPercent Change in: Taxable
Total Total "Real" Sales toTaxable Taxable Taxable Personal
• Source: Deparbnent of Finance and State Board of Equalization. Estimated (1984) and projected (1985and 1986) data from Deparbnent of Finance. Historical taxable sales data have been adjusted by thedeparbnentto account for changes over time in the definition of the taxable sales base, includinginclusion of gasoline sales beginning in mid-1982.
b Defined as total taxable sales deflated by u.s. GNP consumption expenditures deflator.
68
identical to the projected rise in personal income (8.6 percent and 7.9percent, respectively). The department's 1985 estimate assumestllat particularly sharp drop-offs in taxable sales growth will occur in the buil<iing,automobile, general manufacturing, home furnishings, and services industries.
Revenues May Be Slightly Understated. Our own analysis indicatesthat, while the departnlent's economic forecast off~rs no basis for expecting booming taxable sales growth or a dramatic rise in the sales-to-incomeratio during 1985 or 1986, there are some grounds in the forecast foranticipating a better taxable sales performance than what the departmentexpects. For example, the department's economic forecast assumes thatCalifornia's unemployment rate will fall sharply over the next 18 months,that "real" interest. rates will soften a bit, that the percentag~ of thepopulation which is employed will be rising, and that 1985 expenditureson consumer durable goods and fixed nonresidential business investmentwill rise more rapidly than personal income. All of these factors historicallyhave implied a rise in the taxable sales-to-personal income ratio, and arecapable of offsetting such negative factors in the taxable sales outlook asdeclining gasoline prices and the. moderating rate of housing starts.
Our own revenue estimating techniques suggest that, if the department's economic forecast comes true, the sales-to-income ratio wouldprobably drift up to around52.4 percent in 1985 and 53.6 percent in 1986,thereby generating about $105 million in additional sales and use taxrevenues during the current and budget years, combined. Even if thisturns out to be the case, the ratio of taxable sales-to-personal income wouldstill remain well below its 1980 level.
Corporate Profits-Above. Average Growth Anticipated
Revenues from the bank and corporation tax are more difficult toproject from year-to-year than revenues from any other source. This isbecause of the inherent volatility of corporate profits, the wide variety offactors which influence profits, the complex prepayment patterns whichfirms use to remit funds to the state, and the lengthy· time lags requiredbefore actual data on past corporate profits become available. The task ofprojecting these revenues has become even more difficult in the pastseveral years because recent federal law changes have distorted the historical relationships between California and U.S. profits. The most significant of these changes occurred as a :result of the Economic Recovery TaxAct (ERTA) of 1981 and the Tax Equity and Fiscal Responsibility Act(TEFRA) of 1982, which dramatically revised the rules governing depreciation allowances for federal tax. purposes.
As Table 25 shows,the department projects that revenues from the bankand corporation tax will rise by over 12 percent in the budget year. Thus,the bank and corporation tax is projected to grow faster in 1985-86 than
69
any other major revenue source. This rate compares to a healthy 9.1percent rise in the current year and the enormous 27 percent increase inthe prior year, which occurred as profits began recovering from theirabnormally low recessionary levels during the 1980 through 1982 period.
The above-average growth projected for bank and corporation tax revenues reflects the department's projection for taxable corporate profits. AsChart 14 shows, California profits are estimated to have risen by 17 percentin 1983 and 18 percent in 1984. For 1985 and 1986, the department projectsgains of nearly 10 percent and over 17 percent, respectively. This wouldrepresent four consecutive years of relatively strong profit growth.
Chart 14Annual Growth in California Taxable Corporate Profits1973 through 1986
a Source: California Departme'nt of .Finance. Pro.lit totals include a $335 million reduction.·in -1975 due to changes indepletion allowances and a $967 million increase in 1978 due to Proposition 13. Preliminary 1984 estimate byDepartment of Finance and Franchise Tax Board. .
The department's 1985 and 1986 corporate profit growth.projections forCalifornia are noticeably stronger than its projection of corporate profitsgrowth nationally (2 percent in 1985 and 15 percent in 1986). Nonetheless,our own revenue-estimating procedures indicate that the department'stwo-year estimates of California corporate profits and tax revenues arebasically consistent with its overall economic forecast, after consideringnot only the relationship between national and California profit levels andstate-federal depreciation differences, but also the unique effects that suchvariables as interest rates, inflation rates, and California taxable sales andemployment have on California profits.
70
Specifically, we estimate that if the department's economic forecastcomes true, bank and corporation. tax revenues will be higher than thedepartment's estimate by about $10 million in the current year and $30million in the budget year, or $40 million for the two years combined. Thisis. an extremely small difference-only about one-half of one percent ofrevenues for the two years combined. Of course, we are the first to admitthat there is a fairly large error margin surrounding anyone's corporateprofits estimates, especially estimates for California.
As evidence that the department's relatively strong projection for California corporate profits growth is not unreasonable, we note that projected profits relative to the state's personal income base amount to under 8.6percent for 1985 and 9.3 percent for 1986. This compares to an average ofover 9 percent for the entire 17-year period (including recession years)from 1968'through 1984, and 9.4 percent during the entire decade of the1970's (again including recession years).
Other Major Taxes
Table 25 shows that General Fund revenues from taxes other than thethree major taxes are projected to total $1.3 billion in the budget year.These taxes include the insurance tax ($675 million), the inheritance, giftend estate taxes ($193 million, combined) , the cigarette tax (*180 million) ,alcoholic beverage taxes ($140 million), and horse racing taxes ($122 million) .
The budget-year estimate for these taxes is $39 million. (or 2.9 percent)below the.current-year projected level of $1.3'billion. This decline is thenet result of three distinctly different trends within this category oftaxes-growth in insurance tax collections, declines in inheritance, giftand estate taxes, and rela.tive sta.bility in the remaining taxes. It should alsobe noted that, after adjusting for special factors affecting inheritance andestate taxes (discussed below), the "underlying" trend in budget-yearcollections within this "other major taxes" category shows a mild increaseof 2.7 percent ($36 million).
Healthy Growth in Insurance Taxes. Insurance tax collections areprojected to reach $675 million in 1985-86, a gain of 6.3 percent ($40million). This estimate is based on the department's projections of insurance tax premiums, which in turn are derived from survey responsessubmitted by 150 California insurance companies that account for about55 percent ofall insurance premiumswritten in the state. According to thesurvey, the amount of insurance premiums subject to the 2.33 percentgross premiums tax (under current law this rate will return to 2.35 percentin 1986) is expected to rise by about 11 percent in 1984 (the year on
71
which 1985 tax prepayments are based), and 7.5 percent in 1985 (the yearon which 1986 tax prepayments are based). Taxes on these premiumsaccount for about 97 percent of all insurance tax collections.
The estimated increase in premiums during 1984-11 percent-represents a strong gain and is consistent with the healthy growth in the economy that characterized 1984. By comparison, premiums grew by slightlyless-9.9 percent-during 1983, and by less than 5.5 percent in each of thethree years before that, when the economy was in a downturn. The projected gain of 7.5 percent for 1985, while less than that for 1984, is still areasonably good increase and is consistent both with the pace of personalincome growth projected and the expectation that the economy will beless robust in 1985 than in 1984.
It should also be noted that the 39 percent ($178 million) increase incurrent-year receipts shown in Table 25 is unrelated to insurance taxpremium growth, and instead reflects cash-flow shifts associated with Ch327/82 (SB 1326). Among other things, this statute revised the timing ofinsurance prepayments and had the effect of raising revenues by $227million in 1982-83, lowering revenues by $112 million 1983--84, and raisingrevenues by $8 million in 1984-85. Thus, the growth in current-year insurance tax collections would have been a more-moderate 10 percent in theabsence of these cash-flow distortions, and thus more in-line with estimates of 1984 and 1985 growth in insurance premiums.
Special Factors Distort Death-Related Taxes. Combined inheritance, gift and estate taxes are projected to be $193 million in the budgetyear-a fall of $82 million (30 percent) from the $275 million expected inthe current year. This decline, as well as the 17 percent gain in currentyear receipts, reflects distortions due to several special factors:
• First, Proposition 6 (June 1982) repealed the state's inheritance andgift taxes and established in their place a "pick-up" estate tax, whichallows the state to receive a portion of the revenue stemming fromthe federal estate tax, at no increased cost to taxpayers. (Proposition6 became effective for estates and decendents and for gifts made onor after June 9,1982.) As a result, revenue losses from inheritance andgift taxes and revenue gains from the estate tax are being "phased-in".
Table 28 summarizes what the estimated revenue effects of Proposition 6 and Ch 634/80 (which reduced inheritance taxes prior toProposition 6) have been. It indicates that the net effect of thesemeasures has been to reduce 1985--86 revenues by $966 million (83percent), and to reduce revenues since 1980-81 on a cumulative basisby over $2.9 billion (57 percent).
• Second, several unusually large, one-time death-related tax paymentswere received in the current year. One was a $44 million inheritancetax payment from the Howard Hughes' estate. In addition, $35 million
12
in estate tax payments were made by two other large estates. The $79million froIIl these special payments is not part of the normal revenuetrend line for these taxes. Had they not occurred, budget-year collections from death-related taxes would have been about unchanged(down $3 million) from the current year.
Although there will still be some inheritance and gift tax revenuescollected after 1985-86, the revenue trend for death-related taxes beyondthe budget year will increasingly be dominated by the estate tax. Basedupon the state's experience with this tax so far, it appears that the "underlying" growth trend is between 10 percent and 12 percent per year. Thus,once inheritance and gift tax collections have been eliminated, a moderateannual growth trend in death-related taxes can be expected. This, in turn,will serve to boost the overall "elasticity" of the General Fund revenuebase relative to what it has been during the Proposition 6 and Chapter 634phase-in years.
Table 28Effects of Tax Law Changes on Inheritance.
Gift and Estate Tax Revenues1980-81 through 1985-86
a Estimates by California Department of Finance and Legislative Analyst.
No Growth in Other Taxes. The three remaining major taxes,.-thecigarette, alcoholic beverage and horse racing taxes,.-are projected tototal $442 million in 1985-86. This is an increase of only $2 million over thecurrent year and a decline of $5 million relative to the prior year.
There are two reasons why these taxes, taken together, are essentiallya "no growth" revenue source:
• First~ the "bases" on which these taxes are levied have not beengrowing much. For example, the dollar volume of parimutuel horseracing wagering (the main source of horse racing revenues) is essentially unchanged for the prior, current and budget years at a bit over$2.2 billion, while total consumption of cigarettes is expected to decline.
73
• Second, both the cigarette and alcoholic beverage taxes are selectiveexcise taxes which are levied on a "cents-per-unit-consumed" basis.Thus, these revenues do not go up to reflect inflation as does a tax likethe sales tax, which is levied as a percent of the amount spent for acommodity.
Regarding the cigarette tax, per capita consumption of cigarettes hasfallen in all but one year (1981) since 1976. The decline was acceleratedafterJanuary 1, 1983 when the federal excise tax on cigarettes was doubled,from 8 cents to 16 cents per pack. The federal rate is scheduled to returnto 8 cents per pack on October 1, 1985.
If the higher federal rate is not extended, California will have an opportunity to raise its own cigarette tax rate without raising thetotal amountof taxes on cigarettes, and thus prices paid by cigarette users. For each 1cent increase in California's per-pack cigarette tax above the current 10cent level, about $25 million in revenues would be raised annually, assuming current per capita consumption levels.
Interest Income
The General Fund can earn interest income from four primary sources:(1) the investment of surplus monies left over from the prior year, (2)earnings on those balances in the Pooled Money Investment Account(PMIA) which are not General Fund balances, per sebut on which theGeneral Fund nevertheless is legally entitled to earn interest, (3) anyGeneral Fund monies that are idle because of the time lag between whenrevenuesare collected and disbursements are made, and (4) "arbitrageearnings" on the short-term investment of temporarily-idle monies thatthe General Fl.ll?"d has externally borrowed to handle its intra-year cashflow imbalances. Of these four sources, the third-temporarily-unusedGeneral Fund monies-has been the single most important source ofinterest income in the past several years, partly bec~use there have notbeen large surplus balances left over from prior years. Beginning with thecurrent year, "arbitrage earnings" also have become significant. And, asthe General Fund's fiscal condition has improved, the first source of interest income-the investment of surplus funds-has increased in iniportance.
The budget projects that General Fund interest on investments will beabout $402 million in 19~6,of which $395 million represents returns onthe General Fund's share of PMIA balances. The level of General Fundinvestment income projected for 19~6 compares to about $437 million(including $430 million from the PMIA) projected for 1984-85 and $262million (including $255 million from the PMIA)· in 1983-84, and assumesthat:
74
• The average balance in the PMIA during 1985-86 will be in the rangeof $10.6 billion. This is less than the average balance of $10.9 billion for1984-85, reflecting a combination of factors including anticipated reductions in non-General Fund monies held for local agencies and theState Teachers' Retirement System (STRS), plus a somewhat reducedvolume of General Fund external borrowing.
• The General Fund share of monies in the PMIA will be slightly over35 percent, or about the same as for 1984-85. Thus, the General Fund'sPMIA balance is assumed to be a bit over $3.7 billion in the budgetyear versus close to $3.9 billion in the current year.
• The average interest yield on PMIA investments in 1985-86 will beabout 10.4 percent. This compares to an actual average yield of about11.5 percent at year-end 1984, 11.4 percent for the first half of 1984-85,and approximately 11 percent projected for the current year as awhole.
Our analysis of the department's interest income estimates has turnedup several problems:
• On the one hand, the department appears to have double-countedthe interest earnings from non-PMIA sources, thereby overstatinginterest income in both the current and budget years by over $7million, or about $15 million for the two years combined.
• On the other hand, there appears to be an internal inconsistencybetween (1) the department's assumptions regarding the averageGeneral Fund balance in the PMIA, (2) its estimates of temporarilyidle cash balances available from external borrowing sources for investment in the PMIA, and (3) its projections of a growing GeneralFund surplus balance in both ·1984-85 and 1985-86. In particular, theassumptions regarding the average balance in the account are too lowto be consistent both with the department's expected volume of external borrowing and its surplus projections, thereby understatinginterest income. We anticipate that the amount of the revenue understatement is at least $15 million for the current and budget yearscombined (thus offsetting the overstatement identified above), andprobably more. We understand that the department is in the processof reworking its figures.
Given the above, we believe that the department's interest incomeestimate is conservative, and that when the May Revise is released, theinterest income estimates for 1984-85 and 1985-86 combined will be several tens of millions of dollars higher.
In any year, the estimate of interest income is quite susceptible to error.As a "rule of thumb," for each $100 million increase (decrease) in theaverage PMIA balance that is accounted for by the General Fund in1985-86, interest income will be about $10 million higher (lower) than the
75
amount forecast. Alternatively, for each 1 percentage point increase (decrease) in the average PMIA yield, relative to the forecasted rate, interestincome will be about $40 million higher (lower).
Evaluation of General Fund Revenue Estimates
This section summarizes our evaluation of the department's GeneralFund revenue estimates. Our evaluation consists of two parts: (1) ouranalysis of whether the department's revenue projections are consistentwith its economic forecast (internal consistency) , and (2) our assessmentof how alternative economic assumptions that are· equally . reasonablewould affect revenues.
Internal Consistency: Two-Year Estimates On the Low.Side
We have taken the department's economic assumptions for 1985 and1986 and used our own revenue-estimating techniques to test whetherFinance's revenue projections for the current and budget years are consistent with its economic assumptions.
Our analysis, which focused on the state's three major taxes, suggeststhat an economy along the lines projected by the department wouldgenerate somewhat more General Fund revenues in 1985-86 than whatthe department forecasts. We believe that this gain would be about $345million. However, because our analysis·also concludes· that General Fundrevenues in 1984-85 are likely to be about $80 million less than whatFinance projects, the net difference for the current and budget yearscombined would be $265 million. Relative to the size of the tax revenuebase (over $50 billion for the current and budget years, combined), thisis a negligibledifference-only one-half of 1 percent-especially whenone considers the complexities and error margins involved in revenueestimating.
Nevertheless, the difference is significant enough in absolute dollarterms that the Legislature may wish to incorporate it in its own fiscalplanning.
As shown in Table 29, the $265 million difference between our estimatesand the department's is due primarily to differences in revenue estimatesfor the personal income tax ($120million) and the sales .aIld use tax ($105million). There are a variety of reasons for these differences. In the caseof the personal income tax, our income tax simulation model indicates thattaxpayers will be pushed into higher marginal tax brackets at a somewhatmore rapid pace than what the departm~:ntassum,es, thereby raising average tax rates. In the case pf the sales and use tax, we believe that the ratioof taxable sales to personal income will. be higheJ;in both 1985 and 1986than the department assumes, given such variables in itseco:nomic forecast as sharply falling unemployment rates, a downward drift in real interest rates, and a rise in the percentage of the population.thatholds jobs. All
76
of these factors historically have been associated with increases in thetaxable sales ratio.
Significant Statistical Error Margins Exist
Table 29 also shows our estimates of the statistical error margins thatsurround the revenue estimates. These margins provide a useful perspective on the basic reliability of revenue estimates, independent of theproblems of accurately forecasting the economy. Simply stated, these margins indicate the band within which revenues could fluctuate even if thedepartment's economic forecast comes true. As Table 29 shows, in thebudget year this confidence interval is about $220 million for the personalincome tax, $250 million for the sales and use tax, and $280 million for thebank and corporation tax. The reason why the error margin is largest forthe bank and corporation tax, even though it raises much less revenuesthan either of the other two taxes, is that corporate profits are so volatile.In addition, because major changes recently were made.in the federal taxtreatment of corporate depreciation allowances to which California hasnot conformed, the exact statistical relationship between California taxable profits and national pre-tax profits is subject to greater uncertaintiesthan previously.
Table 29Legislative Analyst's Revenue Estimates UsingDepartment of Finance Economic Assumptions
1984-85 and 1985-86(dollars in millions)
19tJ4...85 1985-86Difference
LAO Error From LAO ErrorIncome Source &timate Margin" Finance &timate Margin"Bank and corporation tax .............. $3,535 $130 $10 $3,965 $280Sales and use tax.............................. 9,630 115 -75 10,690 2.'iOPersonal income tax........................ 10,470 115 -15 11,178 220--
" Amount by which revenues could differ from the estimate in either direction, based upon a 95 percentconfidence factor.
These considerations, coupled with the fact that the department's economic forecast itself could prove to be wrong, make it clear that therevenue estimates for 1984-85 and 1985-86 are subject to considerablerevision during the next 18 months.
Alternative General· Fund Revenue Scenarios
Given the ever-present uncertainty about how the economy will perform in the future, it is important to make some estimate of the marginby which actual revenues in the current and budget years· could differfrom whatth~department projects if the department's economic forecastdoes not come true.
77
The department has constructed two alternative economic scenarios toshow how economic conditions other than those assumed in its "standard"forecast would affect revenues. One scenario is based on a more optimisticset of. economic assumptions.than •those. used in preparing the standardbudget forecast; the other is based on more pessimistic assumptions. Thesealternative forecasts illustrate the extent. to which the paths followed bythe national and state economies could easily depart from what the department forecasts for 1985 and 1986. These scenarios, however, by nomeans bracket the full range of possible outcomes.
Table 30 summarizes the key features of the department's alternativeeconomic forecasts. The optimistic scenario for 1985 calls for a sharprebound in economic growth from the drop-off experienced in the latter halfof 1984, accompanied by higher inflation and interest rates. The department assumes that rising interest rates eventually would lead to a recessionin 1987 or 1988; however, until that time, the state's economic pacewould be above that of the standard forecast. In contrast, the pessimisticalternative calls for a recession during most of 1985 and early 1986,accompanied by we:;lkpersonal income growth and declining employment.
Table 30Alternative Economic Outlooks
Prepared by the Department of Finance1985 and 1986·
2. California Data:Personal income growth .Wage and salary job growth .Unemployment rate .Building permits (thousands) .
a Source: Governor's Budget.
Low Forecast1985 1986
-0.1% -0.5%-21.3 38.3
8.3 9.60.9 -1.64.1 4.49.7 9.5
1.42 1.44
6.1% 3.2%1.7 -1.68.1 9.9153 169
High Forecast1985 1986
4.1% 4.4%5.2 13.86.7 5.53.4 2.94.8 6.1
10.8 11.21.87 2.03
9.6% 9.8%4.7 4.46.4 5.6215 226
Table 31 shows that the department's alternative economic scenariosproduce General Fund revenue estimates for 1984-85 which range from$418 million (1.6 percent) above, to $507 million (1.9 percent) below, thestanda.rd forecast. For 1985-86, the estimates range from $1.2 billion· (4.2percent) above to nearly $1.9 billion (6.8 percent) below the standardprojection. (The revenue estiInates prepared hy the Cotnmission onStateFinance in December--$194 million above the department's current-year
78
estimate and $181 million above its budget-year estimate, or $375 millionabove for the two yearscombined--fall well within these margins.) Thepotential error margins are not inconsistent with the actual error marginsthat have materialized in past years, as shown in Table 24, and it is likelythat one could find economists at either end of the forecasting rangedefined by the department's two alternatives. In sum,the message givenby Table 31 is that signific~teconomics-related revenue estimating errorscould occur in both 1984--85 and 1985-86. It is even possible that revenuescould fall outside of these ranges.
Both Budget Surpluses and Defici~s are PossibleTable 31 also shows that the General Fund balance would be dramatical
ly affected if either of thesealternative revenue scenarios were to materialize. Specifically:
• Were the "high" scenario to occur, the result would bea two-yearrevenue improvement of nearly $1.6 billion. This would leave theGeneral Fund with a year-end 1985-86 surplus of over $2.6 billion,which would be enough to both fund a 5 percent reserve for economicuncertainties and still leave $1.2 billion to finance new programs,expansion of existing programs, one-time expenditures or a tax reduction.
Table 31Revenue Effects of Alternative
Department of Finance Economic Forecasts1984-85 and 1985-86(dollars in millions)"
1984-85Low High
Forecast Forecast
1985-86Low High
Forecast Forecast
CombinedTwo-Year EffectLow High
Forecast Forecast1. Change from revenues in
the standard forecast a
Personal income tax ............ -$235 $265 -$805 $605 -$1,040 $870Sales and use tax .................. -95 105 -820 440 -915 545Bank and corporation tax .. -150 25 -240 80 -390 105Other revenues .................... -27 23 -32 28 -59 51
2. Unrestricted balance in theGeneral Fund C .................... $463 $1,388 -$1,364 $2,611 -$1,364 $2,611
a Source: Governor's Budget and Department of Finance.b These totals differ slightly from those shown in the budget because they represent the unrounded sums
of the unrounded figures for each revenue source, whereas the figures shown in the budget arerounded sums.
C Computed by adjusting General Fund balances shown in the 1985-86 Governor's Budget for .the department's standard economic forecast, to "reflect the revenue effects shown in the table. These balancesare $970 million for 1984-85 and $1,040 million for 1985-86, excluding estimated reserves for continuing appropriations of $15 million in 1984-85 and $3 million in 1985-86.
79
• Were the "low" scenario to occur, the re,mlt would be a two-yearrevenue shortfall of over $~.4 billion. Unless· expenditures were reduced from the levels proposed in the budget, this would leave theGeneral Fund in a deficit at the end of the budget year, amountingto nearly $1.4 billion.
What Will Happen?
Obviously, no one can say with certainty which of these (or other)alternative forecasts will come true. The department's feeling is that itsstandard forecast has a 50 percent chance of occurring, its optimisticalternative has a 15 percent chance, and its pessimistic alternative has a35 percent chance. Thus, the department feels that the risks are primarilyon the "downside."
We conclude that the department's forecast is somewhat pessimistic atthis point, particularly given the recent favorable reports on the strengthof economic performance in late 1984. Our own view is thatthe economy'sperformance, at least in California, is likely to be a bit stronger than whatthe department anticipates. Consequently, for planning purposes, theLegislature could reasonably add $200 million to the department's reve-nue projections to reflect 2. s':Tonger-than-anticipated economy. .
Summary
At the present time, the department's two-year revenue totals, althoughnot unreasonable, appear to be somewhat on the low side. We believe thatthe department's two-year revenue projection appropriately could beraised by $465 million, including $265 million to bring revenues more inline with the d~partment'seconomic forecast and $200 million to recognize the possibility of a stronger-than-projected economy.
We also, however, agree with the department that actual revenuesduring the two-year period covered by the Governor's Budget (1984--85and 1985-86) could be from $1 billion to $2 billion higher or lower, depending on the particular path taken by the economy. Given this, it is inevitablethat the revenue estimates will have to be revised during the next 18months. And, because of the very real downside risks that are apparent inthe economic outlook, it is imperative that the Legislature closely monitorthe state's economic trends and revenue receipts throughout this period.
Sp.cial Fund Revenues
Table 25 shows that revenues to all state· special funds, combined, areprojected to reach $5 billion in 1985-86. Table 32 shows the share ofspecialfund revenues accounted for by each of the major special fund revenuesources.
80
Table 32Summary of Special Fund Revenues
1985-86(dollars in millions) •
Revenue Source1. Motor Vehicle Taxes and Fees
License fees .Fuel taxes .Registration and other fees , .Trailer coach fees , .
Subtotals .2. Oil and Gas Revenues , .3. Retail Sales Taxes
("spillover" revenues) .4. Interest on Investments .5. Cigarette Taxes .
Subtotals .6. All Other C ••••••••••••••••••••••••••••••••••••••••••••••••••••••••••••••••••••••••••••••••••••••••••••••••••••••••••
Totals .
Amount
$1,3151,149
93034
$3,428448 b
10812377
$4,184814
$4,998
Percent ofTotal
26.3%23.018.60.7
68.6%9.0
2.22.51.5
83.7%16.3
100.0%
a Source: Governor's Budget. Details may not add to totals due to rounding. .b Of this amount, $436 million represents tidelands oil and gas royalties from state lands. The remainder
represents school lands royalties, primarily from geothermal sources.C Includes such sources as fees to the Department ofConsumer Affairs, electricity utility surcharge monies,
Department of Fish and Game fees and licenses, and penalties on traffic violations and criminalconvictions.
The major source of special fund income to the state is motor vehiclerelated levies, which include taxes on gasoline and diesel fuel ($1.1 bil~
lion), vehicle license and trailer coach fees ($1.3 billion), and registrationfees ($930 million). These vehicle-related levies are expected to total over$3.4 billion in the budget year, an increase of 4.8 percent ($158 million)over 1984-85. Other major sources of special fund income include oil andgas tax revenues ($448 million), "spillover" sales and use tax revenues($108 million), cigarette tax receipts ($77 million), and interest on investments ($123 million). The special fund sales and use tax revenues reflectmonies which go to the Transportation Planning and Development Account, while the cigarette tax monies represent local governments' statutory 30 percent share of the total collections from this tax.
At the outset of this discussion, it is importantto note that Table 25 doesnot include any special fund revenues from the California State Lottery,which was approved by the voters in November 1984 (Proposition 37).The budget indicates that approximately $300 million in lottery revenuesare expected during 1985-86, and that these funds will be distributed tovarious levels of education according to the provisions of the lottery law.These funds, however, do not appear in either the expenditure orrevenuetotals shown in the budget. This is because the department presently isclassifying these monies as "nongovernmental trust and agency funds." As
81
such, they fall outside of the umbrella of state funds whose income andspending activities are reported in the budget. The department adoptedthis classification on the theory that neither the Legislature nor the Governor has any authority regarding the appropriation of these monies (atheory with which we do not concur). A briefoverview of the state lottery,including its revenue potential, is provided at the end of this section.
Slow·Revenue Growth Expected
Table 25 shows that special fund revenues in 1985-86 are expected to be1.5 percent above their 1984-85 level. This slow growth primarily reflectsthe fact that most special fund revenue sources are much less"elastic"than most of their General Fund counterparts with respect to economicgrowth. One reason for this is that a number of special fund revenuesources, such as the fuel tax and cigarette tax, rely on excise taxes that arelevied per unit ofconsumption (for example, so much per gallon of gasoline or pack of cigarettes) instead of on an ad valorem basis (that is, as apercent of the dollar amount spent on the commodity). As a result, thegrowth in these revenues primarily depends on such factors as populationgrowth, and does not reflect inflation. Other reasons for the slow growthprojected in special fund revenues during 1985-86 include an expecteddecline in interest earnings, due to reduced interest yields and specialfund balances in the PMIA, and a drop in sales and use tax "spillover"revenues associated with the current softness in gasoline prices.
Growth Trend Relatively Free of Distortions From Major Legislation and General Fund Transfers
In each of the previous three years, the rate of growth in special fundrevenues has be~:n severely distorted, either by the effects ofmajor legislation or the transfer of special fund revenues to the General Fund.
The three most important specific causes of these distortions have included:
• Legislation which revised vehicle registration, weight and drivers'license fees, and· fuel taxes;
• Transfers of funds from the Motor Vehicle License Fee (VLF) account to the General Fund, as a means of applying cuts in statespending to local governments; and
• The allocation of tidelands oil revenues to the General Fund on aone-time basis.
The first of these three distortions (legislation) is illustrated in Table 33.
In 1985-86, however, the growth in speciaIfund revenues will be relatively free of these distortions.
82
Table 33Effects of Recent Law Changes on
Vehicle-Related Fees and Tax Revenues1981-82 through 1985-86
(dollars in millions) •
Five-Year
Law Change b 1981-82 1982-83 1983-84 1!J84-.85 1985-86 TotalsA. Licenses and Fees
aDepartment of Finance estimates.b Ch 541/81 (SB 215) increased gasoline and diesel taxes, vehicle registration fees, weight fees, and drivers'
license fees, and Ch 933/81 (AB 202) increased registration fees further. Ch 323/83 (AB 223) changedthe method for determining the "market value" of new motor vehicles, revised the depreciationschedule for valuing cars for license fee purposes, and provided for a one-time acceleration of fueltax revenues to the state.
Fuel Tax Revenues-Underlying Trend Remains Flat
Table 25 indicates that, because of the increase in the fuel tax from 7cents to 9 cents per gallon (Ch 541) that took effect on January 1, 1983,and the one-time acceleration of fuel tax collections in 1983-84 (Ch 323),fuel tax revenues declliied by $68 million in 1984-85. These revenues areprojected to rise by $4 million in 1985-86. When fuel tax revenues areadjusted for these law changes, however, the year-to-year changes aredampened considerably. The underlying stability of fuel tax revenuesreflects many different factors, such as changes in the automobile mix,increasing fuel economies, and the impact of gasoline prices on consumption. The department's fuel tax estimate assumes that average gasolineconsumption per vehicle will drop from 575 gallons in 1983-84 to 565gallons in 1984-85 and to 550 gallons in 1985-86.
Vehicle-related registration and license fee revenues are projected atnearly $2.3 billion in the budget year. This is an increase of 7.2 percent.The projection assumes net increases in fee-paid vehicle registrations of2.9 percent and 2.7 percent in 1985 and 1986, respectively. These relativelylow rates of growth reflect the department's expectation that consumerpurchases of new vehicles during the next 24 months will be lower in unitterms-by about 2.2 percent in 1985 and 1.6 percent in 1986-than their1984 level.
The vehicle-related special fund revenues discussed above provide themajor source of financing for the construction and on,going maintenanceof the state's. transportation system. As noted earlier, the underlyinggrowth trend for. these revenues is relatively weak, primarily becausethese revenues are derived in large part from non-ad valorem excise taxesand are levied on such items as gasoline gallonage and vehicle registrations, which themselves have not been growing very rapidly. At the sametiIne, however, highway construction and maintenance costs, as well asother transportation needs, continue to rise. As a result, it now appearsthat the state's transportation financing needs cannot be met unlesschanges are made to these vehicle-related funding mechamsms.
In Part Three we identify the transportation financing problems facingthe state today, and discuss various options available to the Legislature forresolving these problems. These options include making changes .in themanner and extent to which vehicle-related elements of the state's revenue hase are taxed, such as gasoline sales, vehicle registrations, and licensefees.
Tidelands Oil and Gas Revenues to Remain in Special Funds
Table 25 shows that a total of $471 million in oil and gas revenues willbe collected by the state in the budget year, compared to$524 million inthe current year and $430 million in the prior year. All but about $34million of these funds (or $437 million in the budget year) representrevenues collected by the State Lands Commission from oil, gas, geothermal, and other sources. In turn, most of these State Lands Commissioncollections represent direct earnings received by the state from tidelands(principally located adjacent to the City of Long Beach) . Of the $54million decline in state oil and gas revenues projected for the budget year,about $18 million reflects a one"time revenue windfall resulting from theout-of-court settlement of the state's antitrust suit againstARCO (the statewill receive about $20 million from this settlement in 1984-85 and about$2 million in 1985-86). The remaining $36 million declirie reflects declinesin gas production at the state's fields and soft oil prices in world markets.
Traditionally" the state's tidelands revenues have been used, along withbond proceeds, to finance state capital outlay projects., Large portions ofthese revenues were shifted on a"one-time~'basis to the General Fund in1981-82, 1982-83, and 1983-84, in order to help balance the state's budget.In both the current and budget years, however, about 95 percent of allstate oil and gas revenues ($500 million in 1984-85 and $448 million 198586) will he retained by special funds for capital outlay pllrposes.
84
Additional Oil Revenues A Possibility
The state could receive additional oil revenues in 1985-86 beyond therevenues included in the Governor's Budget. These revenues couldresultfrom (a) settlement of outstanding antitrust litigation against six oil companies that produce oil from state tidelands and submerged lands in theLong Beach area and (b) consummation of an agreement with the U.S.Department of Interior over the state's share of federal revenues fromoffshore oil development. The exact amount and timing of any additionalreceipts that might occur, however, is very uncertain at this time. Potentially, the magnitude of these revenues could be in the range of severalhundred million dollars. .
The budget proposes to allocate these additional revenues, ifin fact theyare realized, for infrastructure financing purposes. The Governor'sproposals for infrastructure financing are discussed in Part Three of thisvolume.
How Special Fund Revenues are Distributed
Table 34 identifies how the budget proposes to allocate revenues fromthe four major special fund sources among different programs and levelsof government. Specifically, it shows that:
• Cities and counties will receive almost half of the motor vehicle fueltax revenues.
• Cities and counties are to receive .all of the proceeds from vehiclelicense fees, after administrative and certain other costs are deducted.This distribution is the same as in the current year, but is in s~arp
contrast to what it was during the 1981-82 through 1983-84 period,when substantial amounts of vehicle license fee revenues were transferred to the General Fund to help balance the budget. In 1983-84,for example, the General Fund transfer amounted to $393 million.
• Motor vehicle registration fees are· used to support the Departmentof Motor Vehicles (DMV) and the California Highway Patrol (CHP),with most of the remainder going to the Department of Transportation (Caltrans) for highway maintenance and construction.
• As noted earlier, tidelands oil revenues are allocated mainly for capital outlay purposes. Most of these revenues are divided among threespecial funds (the Capital Outlay Fund for Public Higher Education(COFPHE), the State School Building Lease-Purchase Fund, and theSpecial Account for Capital Outlay (SAFCO)). .
• The "spillover" sales tax revenues are used mainly for mass transit andspecial transportation programs, and are allocated to both' state andlocal agencies.
• Of the state cigarette tax levies which go to localities (30 percent ofthe total), approJdmately 80 percent goes to cities and 20 percent goesto counties.
Table 34Proposed Distribution of Special Fund Revenues
From the Four Major Special Fund Sources. 1985-86
(dollars in millions) •
Total Amount Distribution ofRevenuesRevenue Source ofRevenues RecipientA. Motor Vehicle Taxes andFees
85
Amount
1. License fees .
2. Fuel taxes .
3, Registration and other fees
4. Trailer coach fees .
$1,331 b
1.154 c
934 e
34
To cities ..To counties ..For DMV administration .For Board of Equalization ;.For city streets .For county roads ; , ..To cities and counties for streets and roads ..ToCaltrans for state highways ; ..Other ; ..Adjustment ~o fund balances , ..ToDMV ..ToCHP .To Caltraus .To other state agencies ,..Other ..To counties , ..To localities generally .To Department of HousiIlg and Community
Development.. ..
$511738811
18024911357938
_5 d
200396282488
1121
2
B. Tidelands Oil and Gas Reve-nues " .
C. Retail Sales and Use Taxes("spillover" revenues) ........
D. Local Cigarete Taxes ..
436 f California Water Fund ; .COFPHE Fund ; .Central Valley Water Project Construction
Fund ..State School BuildiIlg Lease-PurmaseFund ..SAFCO , .Other , , .' .
112 g State agencies, iIlciudiIlg suplJort for masstransit , .
Local agencies, iIlciudiIlgsupport for specialtransit programs .
77 .To cities ; !: ;.; ..To counties ; ; ; .
25120
515012214
57
65
6314
a Source: Governor's Budget. Details may not add to totals due to rounding.b Includes $16 million in interest income from prior-year fund balances.c Includes $5 million in interest income from prior-year fund balances.d Negative sign indicates expenditures from prior-year fund balances.e Includes $4 million in interest income from prior-year fund balances.fThe distribution of revenues shown in the table is that which appears in the Governor's Budget. The
distribution called for under existing lawis shown in the Analysis, as part of our discussion of ControlSection 11.50. That discussion also explains how our interpretation of the distribution proposed inControl Section 11.50 differs from the interpretatioll used in the budget.
g Includes $4 million in interest from prior-year fund balances. The $11 million difference between therevenues shown and the identified program expenditures will be financed through transfers from theState Highway Account.
81.0%12.04.52.5
100.0%
d6
THE CALIFORNIA STATE LOTTERY--AN OVERVIEW
As noted earlieI', the specialfu,nd revenue totals contained in the budgetdo not include revenues associated with the California State Lottery. Thisis because the department presently is classifying these revenues as fallinginto the category of "nongovernmental trust and agency funds." Moniesso classified are not normally reported in the budget. (Other revenuestreated in this fashion include revenues to pension funds and certain bondfunds:) In any event, because the new lottery does represent a major newsource of special fund revenues, it is appropriate to briefly discuss here itsprovisions and revenue potential.
Basic Provisions of the California State Lottery
The California State Lottery was autho~izedand established by Proposition 37, which was approved by the voters in November 1984. The California State Lottery Act of 1984 provides for a state-operated lottery whichwilLbe administered, subject to certain restrictions, by a five-person commiSSion appointed by the Governor and confirmed by the State Senate.The Legislature has the authority· to amend the act if, by doing so, itfurthers the purposes of the measure.
The act specifies that the proceeds of lottery ticket sales shall be distributed as follows:
• 50 percent shall be returned to the public in the form of lottery prizes;••. No more than 16 percent shall be used for administrative expenses of
operating the lottery; and• 34 percent shall he allocated to various levels of public education, plus
any unclaimed lottery prizes and any portion of the amount by whichactual administrative expenses fall short of 16 percent. (Based uponthe actual experience of states with lotteries, education's share oflottery ticket sales eventually will be around 40 percent.)
The initiative provides that education's share of thelottery receipts shallbe allocated on a "per bapita" basis amongst K-12 education, the community colleges, the California State University (CSU) system, and theUniversity of California (UC). The budget estimates that, based uponcurrent average-daily-attendance and full-time-enrollment projections,the 1985-86 allocation of the state's share of lottery proceeds would be asfollows:
• K-12 ...................................................................•....................• Community Colleges ....................•.....................................• CSU :...........•........................................................................• UC .
Total .
87
Projected Revenues
Projecting the volume of California lottery ticket sales and state lotteryrevenues for 1985-86 is extremely speculative, especially given that thelottery's commissioners were only appointed in late January and there hasnever been a statewide lottery before in California. Because the fivecommissioners have yet to decide the types of lottery games to be played,the frequency of lottery drawings, and the number and locations of ticketsales outlets, one can only speculate about how much lottery revenues willbe realized.
Last year we estimated that a fully-operational lottery eventually couldgenerate $500 million annually for public education. The amount of revenues that can be expected in 1985-86, however, is undoubtedly less thanthis amount, given that lottery games take considerable time to plan andimplement properly. The lottery commissioners recently indicated thatthey planto have the lottery operational before year-end 1985; however,no specific "timetable" has been developed.
As indicated above, the budget assumes that 1985-86 lottery revenuesto education will be in the range of $300 million. This assumption couldbe optimistic, since the exact timing and nature of the state's lottery gameshave yet to be determined and, at the time this analysis was written, eventhe lottery director had not yet been named.
The Legislature Needs to Review Lottery Revenues and Expenditures
We recommend the Legislature require that: (1) the proceeds from thelottery eannarked for education be deposited in a special fund, (2) theproceeds from the lottery eannarked for the administration ofthe lotterybe deposited in a separate special fund, and (3) expenditures from bothlottery special funds be made subject to direct Budget Act appropriation.
As discussed above, state lottery revenues are not included .in thebudget totals because the Department of Finance has classified lotteryrelated monies as "nongovermental trust and agency funds," similar topension funds and certain bond funds. For this sarp.e reason, most lotteryrelated expenditures do not appear in the budget, and are not subject tolegislative review through the normal budget process.
The department has the authority to classify lottery funds in any manner it chooses. We believe, however, that the department's decision tokeep lottery-related funds "outside" of the budget and the normal appropriation process is not warranted by the nature of these funds, nor is itappropriate, for two reasons:
• First, this decision means that the budget will fail to reflect the extentto which the state is supporting public education in California.
• Second, the decision makes it more difficult for the Legislature tomonitor the use of lottery revenues and ensure that they are being
88
subjected to the same thorough review as the expenditure of otherstate funds.
For these reasons, we recommend that the Legislature:
1. Designate the California State Lottery Education Fund as a specialfund,
2. Establish a second special lottery fund into which the share of lotteryproceeds available for administrative costs is placed, and
3. Make the expenditure of monies from both of these special fundscontingent on a direct Budget Act appropriation. .
These actions would not conflict with Proposition 37's requirementsregarding how lottery proceeds are to be spent, but would ensure thatlottery-related expenditures are properly tracked, properly reviewed andsubjected to necessary legislative oversight.
THE LONG-TERM REVENUE OUTLOOK
Accurately projecting what General Fund and special fund revenuesmight be beyond the budget year is always an extremely difficult undertaking, largely because it is impossible to guess with any confidence whatpath the economy will follow in the future. Nevertheless, it is importantthat long-term revenue projections be constructed using the most reasonable economic assumptions available, so that the Legislature will have atleast some. general idea of what the prospects for General Fund andspecial fund revenues might be in the future. Such forecasts are preparedboth at the federal level and by many economic consulting firms.
The most important factor determining state inc()me in future years willbe the path taken by the state's economy. Generally speaking, the state'srevenue base appears to have sufficient "elasticity" tqgrow at a pace equalto, and probably slightly above, the growth rate of California's personalincome base-at least during normal years. (This is pretty much the casefor the budget year.) However, this relationship can be severely distortedduring periods when economic activity fluctuates from the long-termtrend. For example, when an economic downturn occurs, corporate profits usually fall in dollar terms, and the percentage of their income thatconsumers spend on taxable commodities can also decline. During strongeconomic expansions, the opposite usually occurs. Thus, on a year-to-yearbasis, the rate of growth in revenues can be higher or lower than thegrowth rate for the economy.
Obviously, it is not possible to predict the economy's performancebeyond the next 18 months with any confidence. Indeed, no economist cansay with any certainty what will happen to such key economic variablesas interest rates, inflation, unemployment, and corporate profits beyondthe next several quarters (if that). This is especially true given such factorsas the unsettled conditions in the foreign trade sector, international debt
89
problems, the inability of federal government officials themselves to predict what courses monetary and fiscal policies will take in the future, thecontinued prospects for large federal budget deficits and their potentiallynegative effects on the economy, and the fact that the economy currentlyappears to be in a "transition phase" during which it could either beginto expand or contract. Given this, a.ny estimate of what General Fundrevenues will be beyond 1985-86 depends entirely on what one wants toassume about the economy's performance beyond 1986.
The Department's Long-Term Revenue Forecast
The Governor's Budget contains projections of both General Fund andspecial fund revenues for 1986-87 and 1987-88. These projections areshown in Table 35. The projections assume that the department's standardeconomic forecast for moderate growth will come true in 1985 and 1986,and that the economy will experience a mild recession in 1987, followedby a post-recession recovery in 1988. The reason the department chose toassume a recession in 1987 is that the average length of postwar economicexpansions is 34 months, and the current expansion has. already lasted 26months. Table 35 shows that, should the department's assumptions cometrue, General Fund revenues would total $29.9 billion in 1986-87 and $30.6billion in 1987-88, while special fund revenues would total $5.2 billion and$5.4 billion in those two years. Thus, total state revenues would amountto$35.1 billion in 1986-87 and $36 billion in 1987-88.
The General Fund revenue growth rates implied by this projection are7.1 percent for 1986-87 and 2.2 percent in 1987..:88, when the "brunt" ofthe 1987 recession would be felt by the state's treasury.
It appears that the General Fund could weather this economic stormalthough just barely-without having to either raise taxes or reduce "real"per-capita expenditures below projected 1985-86 levels. This would not betrue, however, if either (a) a 1987 recession was more severe than whatthe department has assumed, or (b) the year-end General Fund balancesprojected for 1985-86 and 1986-87 were not put into the Reserve forEconomic Uncertainties where they would be available to "bail out" theGeneral Fund during such a recession.
Given the underlying "elasticity" of the state's revenue structure, weanticipate that the General Fund balance would again proceed to growafter 1987-88 as the economic recovery contained in the department'slong-term projections took place.
A. General Fund RevenuesPersonal income tax .Sales and use tax .Bank and corporation tax .Other sources .
Subtotals, General Fund Revenues ..B. Special Fund Revenues ..
C. Total Revenues, All Sources .
1985-86
$11,16510,5103,9502,297
$27,9224,999
$32,921
$12,00011,2304,3002,370
$29,9005,200
$35,100
7.5%6.98.93.2
7.1%4.0
6.6%
$12,40011,3704,3402,450
$30,5605,400
$35,960
3.3%1.20.93.4
2.2%3.8
2.5%
a Source: Governor's Budget and Department of Finance.
The "No Recession" AlternativeWe believe the department's decision to assume a mild recession before
1989 is reasonable, given historical experience. However, should the economy somehow "beat the odds" by expanding beyond 1986 and avoidingany type of downturn, General Fund revenues would be higher than thelevels shown ill Table 35. As an illustration, for example, revenues couldbe in the range of about $30.2 billion for 198&-87 and $32.5 billion for1987-88, if California's personal illcome growth rate durfug this periodwere to average between 7 percent and 8 percent.
In this event, the General Fund would continue to accrue a surplusthroughout the entire forecast period, which would reach about $2.4 billion at the end of 1987-88. This would be sufficient to maintafu a 5 percentreserve ($1.6 billion) and still leave about $800 million that could be spenton new programs, expansion of existing programs, one-time expendituresor tax reductions.
Most economists, however, do not believe the likelihood of an uninterrupted economic expansion like this is very high. Nor do we. It seems morereasonable to assume that even if the economy were able to avoid anoutright economic downturn over the next few years, there would at leastbe some period of economic lethargy. Assuming this, even a no-recessionlong-term economic outlook might not result in much of a "discretionary"surplus in 1987-88.
91
Slale and Local BorrowingIn addition to the $33.1 billion in state expenditures which would be
funded from state revenue collections in 1985-86, the Governor's Budgetproposes that the state expend approximately $469 million in fundsderived from the sale of bonds. Generally speaking, these funds will beused for capital outlay programs.
The State of California issues both general obligation bonds and revenuebonds. These two categories of borrowing instruments have the followinggeneral characteristics:
• General obligation bonds are backed by the state's full faith and credit. Thus, when the State of California issues a general obligation bond,the state pledges to use its taxing power, if necessary, to payoff thebond (both principal and interest). These bonds must be authorizedby a two-thirds vote of both houses of the Legislature, and then mustbe approved by a majority of the voters at a statewide election.
• Revenue bonds are not backed by the full faith and credit of the state.Instead, they are secured-at least in theory-by revenues from theprojects which are financed from the bond proceeds. State revenuebonds must be authorized by a majority vote of both houses of theLegislature, but they do not require voter approval.
This section provides information on borrowing by the state, includingthe sales and outstanding volumes of state general obligation and revenuebonds. It also contains a brief discussion of borrowing conducted by California's local governments.
STATE BORROWING
The state borrows money on both a long-term and short-term basis.Long-term borrowing provides funds for a variety of state and state-assisted local capital outlay programs. Short-term borrowing provides funds tomeet the state's cash-flow requirements.
State General Obligation Bonds
General obligation bonds issued by the state are used to support a widevariety of programs, such as state construction projects, state parks andrecreational facilities, new state prisons and county jails. These bonds alsoare issued to provide financial assistance for California veterans seekingto purchase homes.
During 1984, California voters approved a record $2.7 billion in additional bond authorizations. Most of this amount consisted ofadditional authorizations for existing state bond programs-those financing county jails($250 million), new state prisons ($300 million), parks and recreationalfacilities ($370 million), clean water ($325 million) and safe drinking water projects ($75 million), school building lease-purchase ($450 million),
92
assistance to veterans ($650 million), and fish and wildlife enhancement($85 million). In addition, voters approved two new bond programs: $100million for hazardous substance cleanup and $50 million for senior citizencenters.
Outstanding
$239.372.421.097.484.8
208.927.5
194.5169.925.0
484.1134.0285.075.0
215.96.0
15.0
15.013.4 341.6
1,485.8 614.2148.4 1,421.671.3 18.0
1,887.3 2,872.7
$5,288.4 $7,401.8
Redeemed$810.8157.644.058.575.3
191.132.555.520.1
$85.030.095.0
345.0500.0110.0495.0455.085.0
185.0595.0100.050.040.0
180.0
340.0
$3,690.0
Unsold$1,050.0
230.065.0
155.9160.0400.0145.0280.0285.0370.0
1,200.0250.0795.0530.085.0
200.0950.0100.050.0
2,140.01,750.0
89.35,100.0
$16,380.2
Status of Bonds Authorized. Table 36 identifies for the state's general obligation bond programs the portion of the currently-authorizedamounts that are outstanding, redeemed, and unsold. As the table shows,on December 31, 1984 the state had not sold $3.7 billion in authorizedbonds, compared to $2.3 billion at the end of 1983. Of the authorized bondsalready sold ($12.7 billion), the state had retired approximately $5.3 billion, leaving $7.4 billion, or 58 percent of the total, still outstanding.
Table 36General Obligation Bonds of the State of California
As of December 31. 1984(dollars in millions)
Authorized
State construction .Higher education construction ..Junior college construction ..Health sciences facilities construction .Community college construction ..Beach, park, recreational, and historical facilities ..Recreation, fish, and wildlife ..State, urban, and coastal park ..Parklands acquisition and development .Park and recreational facilities .Clean water ..Safe drinking water .New prison construction ..County jail construction ..Lake Tahoe land acquisition ..First-time homebuyers .School building lease-purchase .Hazardous substance cleanup .Senior centers ..School building aid ..Water resources development ..Harbor bonds .Veterans farm and home ..
Totals" ..
"Details may not add to totals due to rounding.
Sale of General Obligation Bonds. In 1983-84, the State Treasurermarketed $810 million in general obligation bonds. Over half of thisamount ($450 million) was sold for the veterans farm and home loanprogram. The next largest volume of bonds ($195 million) was sold for theschool building lease-purchase program.
During the current year, over $1.3 billion in general obligation bond
93
sales by the State Treasurer's Office are anticipated, an increase of approximately $500 million over the vglume sold last year. Most of the increase$350 million-is attributable to the state's new prison construction program.
For 1985-86, the budget shows that. a total of $1.2 billion in generalobligation bond sales are planned by the State Treasurer. A significantportion of these sales ($710 million) is attributable to the additional authorizations approved by voters in 1984. The largest volume of bonds tobe sold in 1985-86 will be used to finance the new prison constructionprogram ($345 million) , followed by bond sales for the veterans farm andhome building loan program ($340 million), the state school buildinglease-purchase program ($95 million), safe drinking water projects ($80million), hazardous substance cleanup ($50 million), and various otherprograms ($280 million).
General Fund Costs For Paying OFF Bonds. Table 37 shows projections of the debt service payments for principal and interest that will bemade in 1985-86 on bonds Fully-supported by the General Fund. Debtservice for the budget year is estimated to total $486 million, of which $233million is for repayment of principal and $253 million is for payment ofinterest. This is an increase of $108 million, or 28 percent, over estimatedcosts in the current year. Our analysis indicates that the repayment ofstategeneral obligation bonds continues to be one of the most rapidly growingGeneral Fund "programs" in the state's budget, exceeding, for example,the rate of growth for K-12 education (9.5 percent) and mental healthprograms (12 percent).
a Includes estimated debt service only on general obligation bond issues currently authorized by theelectorate. Excludes debt service on short-term borrowing.
b Interest rates of 9.5 percent and 10.0 percent are assumed for anticipated bond sales in 1984-85 and1985-86, respectively. Figures for 1982-83 and 1983-84 are actual bond sales.
c Source: 1985-86 Governor's Budget.
The amount of debt service actually paid by the General Fund, however, could be lower than the amounts shown in the budget. This is becausethe authorizations for some of thebond programs, such as the programsfor hazardous substance cleanup and assistance for first-time homebuyers,
94
call for project revenues to pay at least part of the debt service costs. Thebudget, however, shows that the General Fund will pay these costs because of uncertainties over when such revenues would be generated.
The debt service estimates are based on specific assumptions regardingfuture bond sales and interest rates. If the actual volume of sales is greater(less) than the estimated volume, or interest rates are higher (lower) thanprojected, then the amounts needed from the General Fund to service thedebt will increase (decrease) accordingly.
How Bond Proceeds Will Be Spent. Once General Fund bonds aresold, the proceeds from the sales are allocated for expenditure on specificprojects. Table 38 identifies these expenditures for the prior, current, andbudget years, according to the source of bond funding.
Table 38Selected Bond Fund Expenditures
1983-84 through 1985-86(dollars in millions)a
1857
51375
185b
Program 1983-84Parklands acquisition $45Fish and wildlife b
Parks and recreational facilities ..Safe drinking water ; ..Clean water .County jails .Lake Tahoe land acquisition ..Beach and park .Urban and coastal park ..New prison ..School building lease-purchase ..Higher education construction .Unallocated capital outlay , .
Totals $400
19!J4.-85 1985-86$102 $37
15 1711
46 7172 8251 1255 265 b
23 b
620 4190 95
b
b
$1,130 $469
a Details may not add to totals due to rounding.b Less than $1 million.
Past Year. In 1983-84, the midyear estimate of bond fund expenditures was $824 million, or $424 million more than the actual amount spent.Most of this shortfall occurred in the new prison construction program.Actual expenditures under this program were $324 million less than whathad been estimated.
Current Year. In 1984-85, the budget indicates that bond fund expenditures will reach a record level of $1.1 billion. This estimate assumesthat $620 million of the $795 million authorized for new prison construction will be expended in the current year. As noted earlier, however, thebudget indicates that $345 million of this authorization will not be marketed until the budget year. Thus, it is very unlikely that this level of expenditure could be reached.
95
Budget Year. In 19~6, bond fund expenditures are expected toreturn to a more normal level ($469 million). As shown in Table 38, thetwo programs accounting for almost half of these expenditures are countyjails ($125 million) and school building lease-purchase ($95 million).
State Revenue Bonds
Agencies of the state also issue revenue bonds. These bonds are fundamentally different from general obligation issues, in that, in theory, onlythe revenue generated from the financed project is pledged as security.
Traditionally, revenue bonds have been used by the state to finance theconstruction of such projects as toll bridges and higher education dormitories. Beginning in the 1970s, however, the state expanded the scope ofrevenue bond programs to include financing for home purchases, pollution control, and health and educational facilities. In 1983, the Legislaturecreated a new revenue bond program which will provide financing forurban waterfront restoration projects.
Table 39 identifies the 17 different state revenue bond programs andshows the current authorization, if any, for each. As of December 31, 1984,a total of $7.9 billion in state revenue bonds was outstanding.
Table 39State Agency Revenue Bonds
As of December 31. 1984(dollars in millions)·
AuthorizationIssuing Agency Limit, IfAnyCalifornia Educational Facilities Authority $750California Housing Finance Agency :;..... 2,350California Pollution Cqp.tro! Financing Authority ..California Transportation Commission .Department of Water Resources ..Trustees, California State University ..Regents, University of C:ilifornia .State Public Works Board ..State Public Works Board, Energy Conservation and Cogenera-
tion.................................................................................................... 500Hastings College of Law ..Veterans Revenue Debenture............................................................ 1,000California National Guard 100California Health Facilities Authority 2,409California Student Loan Authority ;.. 300California Alternative Energy Source Financing Authority 200California Rail Passenger Financing Authority.............................. 1,250California Urban Waterfront Area Restoration Financing Au-
thority 650
Totals $9,509
a Details may not add to totals due to rounding.
Three housing bond programs account for over $2.8 billion, or 36 percent, of the oustanding bonds: the California Housing Finance Agency
96
($2.1 billion), the Veterans Revenue Debenture ($656 million), and theCalifornia National Guard ($39 million). Bonds issued by two other authorities, the California Pollution Control Authority and the CaliforniaHealth Facilities Authority, also account for significant portions of therevenue bonds outstanding (about $1.4 billion each). The table also showsthat 10 of the 17 programs have statutory authorization limits, whichtogether total $9.5 billion. Of this amount, approximately $4.5 billion (47percent) remained unused at the end of 1984.
Revenue Bond Sales. Revenue bond sales have increased dramatically in the last five years. In 1980-81, state financing authorities issuedapproximately $800 million in· revenue bonds. For the last two years,however, sales have approached $2 billion. Three authorities accountedfor over 80 percent of the sales in 1983-84-the California Housing Finance Agency ($438 million), the California Pollution Control FinancingAuthority ($452 million), and the California Health Facilities Authority($561 million). These authorities also will account for over 75 percent ofthe estimated sales during the current year.
Use of General Obligation Versus Revenue Bonds
Chart 15 compares the sales and outstanding volumes of state generalobligation and revenue bonds since 1978-79. It shows that revenue bond
Chart 15State General Obligation and Revenue BondsAnnual Sales and Total Outstanding Volumes1978-79 throu9h 1983-84 (in billions) a
a Source: California State Treasurer.,Data asol June 30 of each fiscal year.
97
sales have significantly exceeded general obligation bond sales in each ofthe past five years. As a result, the volume of outstanding revenue bondshas increased dramatically, in contrast to only a slight increase in thevolume of general obligation bonds outstanding.
The increase in revenue bond sales, relative to general obligation bondsales, partly reflects the fact that revenue bonds generally are not subjectto statutory interest rate ceilings. Under existing law, the interest rate onstate general obligation bonds cannot exceed 11 percent. High interestrates, especially during 1982 and 1983, have sometimes made it difficult tosell general obligation bonds within these ceilings. In addition, generalobligation bond sales for each of the state's programs are subject to specificauthorization limits. The limits for six of these programs have already beenreached. In contrast, there are no restrictions on sales under 7 of the state's17 revenue bond programs.
Additional Long-Term Borrowing
In addition to the general obligation and revenue bond programs described above, the state also engages in other forms of long-term borrowing, mainly through the issuance of certificates ofparticipation (CPs). Forexample, the state has borrowed $42 million through the issuance of CPsto fund the new headquarters' facility for the Franchise Tax Board. Up to$300 million in these instruments may also be used by the State PublicWorks Board to finance state prison construction projects. Finally, theLegislature has authorized the use of CPs, revenue bonds, and other debtinstruments for the construction of "high technology" educational facilities, which would be leased to state postsecondary education institutions,such as the University of California.
Funding for the costs associated with these types of long-term borrowing is provided by the General Fund. These funds, however, are notincluded within the administration's estimate of debt service requirements. In the case of the CPs, the funding shows up (or will show up) inthe individual agencies' budgets as the cost of "facilities operations". Thisis because the state's lease payments for use of the facilities are pledgedto retire the debt. In the case of the "high technology" issues, the cost ofthe debt service is funded out of the state's annual appropriation for theparticular educational institution.
Short-Term Borrowing by The State
The General Fund often borrows money on a short-term basis to compensate for the difference between when revenues are actually receivedand. when the state must pay its bills. This type of borrowing for "cashmanagement" purposes is a routine and integral part of managing thestate's fiscal affairs.
98
In the past, most of the General Fund's short-term borrowing was doneinternally, usually from the Reserve for Economic Uncertainties, fromspecial funds, or from the Pooled Money Investment Account (PMIA).
In 1983--84 and 1984-85, however, the state began to borrow from external sources. In 1983--84, for example, the state borrowed $1.2 billion fromthe private sector by issuing revenue anticipation notes. The balance ofthe state's cash flow needs for 1983--84 was met through loans from thePMIA ($1.3 billion) as well as from special funds and accounts ($772million).
For the current year, the state borrowed $1.4 billion through the sale ofrevenue anticipation notes in August 1984. The Legislature authorized theuse of external borrowing, even when sufficient funds are available internally, in order to take advantage of the fact that the state can borrow fromexternal sources at a cost that is lower than the cost of borrowing frominternal sources. This is because the state can borrow from externalsources at tax-exempt interest rates, while internal sources must be paidinterest at rates comparable to the yield on taxable securities.
The budget for 1985-86 shows that $1.3 billion in short-term notes willbe issued in August 1985. The state's cash flow needs during the budgetyear also will be financed periodically from internal sources. Our detailedanalysis of the external borrowing program proposed for 1985-86 appearsin Item 9620 of the Analysis.
LOCAL BORROWING
The State of California does not directly regulate most types of borrowing by local governments. However, state law does govern such factors asthe permissible types of borrowing that local entities can undertake andthe maximum interest rates that can be paid on certain debt. The state alsohas beenrequired to enforce recently-enacted federal limits on certaintypes of borrovying for private purposes, including housing. Regardless ofits specific responsibilities for regulating local government borrowing, thestate has an important interest in the amount of borrowing undertaken bylocal governments. This is because the marketability of state debt can beaffected by the total volume of tax-exempt local debt offered for sale.
Short-Term Local Borrowing
Local governments engage in short-term borrowing by issuing a widevariety of secured and unsecured debt instruments. These include, amongothers, tax anticipation notes, revenue anticipation notes, certificates ofparticipation, and tax-exempt commercial paper. The volume of suchshort-term borrowing, although not known with certainty, has increasedsignificantly in recent years. For example, it appears that the various levelsof local government in California issued over $5.3 billion in short-term
99
debt obligations during 198~alone. This is over $4 billion more than thevolume issued in the previous year. The large increase appears to havebeen at least partly due to the recession, which caused local governmentsto borrow heavily from outside sources to meet their cash-flow requirements. In 1983-84, with the economic recovery easing the cash-flow situations of local governments, the volume of short-term local borrowing fellto approximately $3 billion.
Long-Term Local Borrowing-Growth Eases
Mter increasing dramatically over the previous four years, the rate ofgrowth in long-term bond sales by local governments appeared to easeslightly last year. Based on information provided by the California DebtAdvisory Commission, we estimate that sales reached over $5.8 billion in1983-84, up from $5.7 billion in 198~. Most of the growth in previousyears was due to housing bond sales, which rose from $1.2 billion in 1979-80to $2.3 billion in 198~. Last year, however, local housing bond sales fellto $1.8 billion, apparently in response to the temporary federal moratorium on the tax exemption for interest earned on housing bonds.
TRENDS IN STATE AND LOCAL BORROWING
The state and local governments traditionally have relied on bonds,long-term loans, and other forms of borrowing to raise funds for the construction of public facilities, such as roads, schools, water systems, prisons,and recreational facilities. In recent years, however, a number of trendsand policy changes have emerged which affect the purposes, methods,and level of borrowing, as discussed· in detail below.
New Federal Limits on "Private Activity Bonds"
State and local agencies have begun to rely heavily on tax-exempt bondsto provide financing for private projects. This includes, for example,industrial development bonds, which are used to finance private manufacturingand commercial facilities, and revenue bonds, which often are used to helpfinance private pollution control and alternative energy projects.
Concerned that such tax-exempt bonds frequently are used to financeprojects that benefit private investors more than the general public, thefederal government recently enacted limits on the volume of "privateactivity bonds" which state and local authorities could issue each year.These limits generally apply to bonds issued for industrial and commercialdevelopment projects, certain for-profit educational and health facilities,and student loans. The federal Tax Reform Act of 1984 set a limit on theissuance of private activity bonds for the state as a whole at $150 perresident or $200 million per calendar year, whichever is greater.
The Governor recently established the California Debt Limit AllocationCommittee (CDLAC), which is responsible for determining the cap on
100
such borrowing within California and allocating borrowing authorityamong state and local jurisdictions. Based on the state's population,CDLAC set the cap for 1985 at $3.8 billion. It appears, however, that thenew federal limit will not pose any significant problems for Californiajurisdictions, because the volume of private activity bonds issued is likelyto fall well below the limit.
Housing Bond Sales Remain Significant
Housing bonds account for a substantial portion of the growth in bondsales during recent years,particularly at the local level. In 1977-78, a totalof $416 million in housing bonds were sold. In 1982-83, total housing bondsales reached almost $3.0 billion, with over 75 percent of this amountattributable to local sales. Housing bond sales in 1983-84 fell by approximately $150 million, although the volume remains significantly highercompared to what it was in previous years. In general, local authoritieshave been able to issue large volumes of housing bonds to make housingmore affordable during periods of escalating home prices and mortgageinterest rates.
Both the state and the federal government have expressed concern overthe rapid growth in the sale of housing revenue bonds, primarily out offear that such bond sales will increase the interest costs and limit themarket for other tax-exempt bonds sold for more traditional public purposes. The federal government recently has taken actions to limit andregulate the issuance of housing bonds, particularly mortgage revenuebonds. These restrictions include annual limitations on the volume ofmortage revenue bonds that may be issued in each state, and a sunset,effective December 31, 1987, on the federal tax exemption for interestearned on state and local bonds issued for such purposes.
The use of tax-exempt bonds to provide below-market financing forhousing also presents major fiscal and policy issues at the state level. Ourrecent report, The Use ofMortgage Revenue Bonds in California (Report85-7) , discusses some of these issues and provides other information on theuse of tax-exempt housing bonds within California.
Debt Financing for Infrastructure Continues on the Rise
State and local authorities continue to issue a significant amount of debtto finance "infrastructure"-capital improvements and public works. According to information from the California Debt Advisory Commission,approximately $1.4 billion was issued for such purposes between Januaryand June of 1984, compared to less than $500 million for the same periodin 1982.
The level of debt issued to finance infrastructure could increase ifACA55 is approved by the voters in June 1986. This constitutional amendment,in effect, would restore local government's ability to issue general obliga-
101
tion bonds, as it would allow increases in local property tax rates to securethe bonds. (This ability was effectively removed by the passage of Proposition 13.) Contingent on the approval of two-thirds of the local jurisdictions' voters, local agencies would be able to issue general obligation bondsfor any form of capital improvements needed locally.
Potential Impact of Federal Tax Reform
The U.S. Congress and the Reagan Administration currently are considering proposals for major reform of the federal income tax system. Whilethe proposals under consideration vary, the underlying purpose of theseproposals is tax simplification. To accomplish this, the options would eliminate many of the current tax deductions and credits that have madefederal tax laws complicated. They also would revise tax rates, to ensurethat individual tax liabilities remain essentially the same.
Federal tax reform potentially could have a significant impact on themarket for tax-exempt debt. In particular, if federal tax rates are reduced,tax-exempt bonds would become less attractive, especially for individualswho currently are in high tax brackets. For example, from the standpointof investors in the 40 percent tax bracket, a taxable security which earns10 percent is equivalent to a tax-exempt security which earns 6 percent.If, however, the investor's tax bracket were reduced to, say 25 percent, theyield on the tax-exempt security would have to rise to 7.5 percent in orderto remain competitive with the taxable security. Under these circumstances, a reduction in federal tax rates may narrow the "spread" betweentaxable and tax-exempt securities. As a result, issuers of tax-exempt debt,such as the state, may be required to offer or accept higher interestrates-which would increase debt service costs-in order to market theirdebt issues.
103
The SIDle's Work ForceThe Governor's Budget proposes a state government work force of
227,888 personnel-years (pys) for 1985-86. Four functional areas accountfor 79 percent of the total: higher education (40 percent); health andwelfare (16 percent); business, transportation, and housing (14 percent);and youth and adult corrections (9 percent).
THE PROPOSED WORK FORCE FOR 1985-86
The budget proposes to reduce the size of the state's work force by 2,869personnel-years, or 1.2 percent, in 1985--86. From a program perspective,the largest reductions would occur in three principal areas-health andwelfare (-2,713 pys); business, transportation and housing (-880 pys);and state and consumer services (-654 pys). These reductions would bepartially offset by a significant increase in the youth and adult correctionalprogram (+ 1,830 pys), as shown in Table 40.
Table 40The State Work Force, by Function
(in personnel-years)1983-84 through 1985-86 a
Change Change1984-85 19~
Estimated Proposed to 1985-86 to 1985-861fJ83-M 1984-85 1985-86 Amount Percent Amount Percent
Table 40 indicates that when the budget proposal is compared to theactual number of personnel-years worked in 1983--84, the proposed statework force for the budget year is 1,193 personnel-years higher. Over thetwo-year period covered by the table, youth and adult correctional programs will increase by 4,648 personnel-years, or 30 percent, while healthand welfare; higher education; and business, transportation and housing;collectively, will decrease by 5,101 pys, or 3.1 percent.
As shown in Chart 16, the trend identified in Table 40 is characteristicof state experience in recent years. Specifically, the total state work forcedipped after the passage of Proposition 13 and has remained relatively
104
steady since 1980-81. The composition of the state work force is changing,however, as health and welfare staffing is cut back while youth and adultcorrections is expanding.
Chart 16
Historical Trends in the StateWork Force, by Function1977-78 through 1985-86 (in thousands)
As we discuss in detail in Part Three, the personnel reduction proposedfor the budget year can be explained by a variety of factors, including thefollowing:
• The staffing estimates for 1984-85 are higher than the state's actualwork force in 1983-84 and represent the second largest year-to-yearincrease since Proposition 13. By comparing this estimated level tothe proposed amount for 1985-86, the magnitude of the reduction isinflated.
• The 1984-85 estimate of the state work force is not a very reliable baseagainst which the number of personnel-years proposed for 1985-86should be compared. This is because the current-year estimate, morethan likely, is overstated and, therefore, tends to exaggerate the sizeof the reduction proposed for the budget year.
• A large number of authorized positions are proposed for eliminationin 1985-86. Some of these reductions are due to increased efficiencies.
• Many of the staffing reductions are attributable, however, to book-
105
keeping adjustments, unallocated reductions, position decreaseswhich would have occurred in the absence of administrative actions,or staffing reductions which have been anticipated for several years.
• The budget contains numerous proposals to contract for personnelrelated work currently performed by state employees or of the typegenerally done by state employees. We estimate that a minimum of1,300 pys have been "saved" in this manner.
Proposed Changes by Function
Health and Welfare. The largest staffing reduction in absoluteterms, 2,713 personnel-years, is proposed for health and welfare. A littlemore than one-half of these reductions are proposed for the EmploymentDevelopment Department, where a total of 1,367 personnel-years wouldbe deleted. This reduction can be attributed to a variety offactors, including administrative economies, automation of the unemployment insurance (VI) and disability insurance (DI) programs, transfers to other departments and levels of government, workload changes in the VIprogram, and program terminations. State hospitals operated by both theDepartments of Mental Health and Developmental Services account forthe other major reduction. These decreases are occurring due to population reductions, introduction of labor-saving equipment in kitchens andpharmacies, a transfer of laundry operations to the Prison Industry Authority, and a reduction of overhead costs at Stockton State Hospital pursuant to legislative direction.
Personnel reductions in the Departments of Health Services, SocialServices, and Rehabilitation also are attributable to the transfer of variousprograms to local entities, including family planning and maternal andchild health; adoption placements; and vocational rehabilitation services,respectively.
Business, Transportation, and Housing. The budget proposes toreduce staffing for this program area by 880 pys, or approximately 3 percent. Caltrans would experience the largest reduction (-543 pys) due toefficiency reductions, contracting for services, and increased salary savings. The California Highway Patrol would experience a net reduction of129 pys, primarily due to the completion in the current year of the trainingphase of the AB 202 program. That program will have added approximately 670 uniformed officers to the department's operations over a three-yearperiod. The Department of Motor Vehicles is also experiencing a contraction. The principal change in the department is dUe to an automationproject that was initiated in 1978.
State and Consumer Services. Three departments account for themajor portion of the changes in this area. The State Personnel Board isbeing reduced by 105 pys, or 25 percent, due to an acceleration of itsdecentralized personnel selection program to individual state depart-
106
ments, as well as the termination of the merit system and technical personnel work it currently performs for local government on a reimbursablebasis. With regard to this latter activity, the budget proposes that a newJoint Powers Authority perform this function instead. The authority's staffing would not be counted in the totals for the state. In addition, theFranchise Tax Board will reduce its work force by 120 personnel-years,primarily due to improvements in tax return processing. The Departmentof General Services, meanwhile, will eliminate 219 pys due primarily toworkload-related changes in the State Printing Plant, increased salarysavings for the State Police, as well as reductions in janitorial personnel (50pys) reflecting the policy decision to contract for such services.
Higher Education. The budget shows both the University of California (UC) and the California State University (CSU) experiencing net 'staffing reductions in the budget year. There is less here than meets theeye, however. Budgeted personnel-years generally are not as reliable inthese two segments of higher education as they are elsewhere in stategovernment. In fact, the state has no control whatever over UC's staffinglevel.
According to the budget, UC will experience a net decrease of 250 pys.As discussed in more detail in the Analysis (Item 6440), however, ourreview indicates that the net change in university personnel will actuallyresult in increased costs to the state, rather than savings. This is becausethe majority of the 600 pys that the budget claims are being deleted aresupported with nonstate funds, while the majority of the personnel added(350 pys) are supported by the General Fund.
The net reduction of 81 pys that the budget shows for the CSU will notresult in any savings to the state. This is because the system has deleted250 personnel-years in an unallocated reduction, but has retained thefunding associated with these positions.
Youth and Adult Corrections. The state's correctional program accounts for the most significant staffing increases in the budget year. Thebudget proposes to increase the Department of Corrections' staffing by1,906 pys, or 10 percent. This increase is due to the significant increasesin the adult inmate population and the opening of new facilities to accommodate them. Partially offsetting the department's staffing increases arestaffing reductions totaling. 76 pys in the Youth Authority. These reductions primarily reflect what the budget terms "staffing efficiencies".
PERSONNEL-YEARS IN HISTORICAL PERSPECTIVEThe Governor's Budget for 1985-86 places a great deal of emphasis on
trends in the size of the state's work force. For example, the budgetdocument indicates that, during the last 20 years, "government clearly hasgrown faster than the population rate." It is particularly useful to analyze
StatePopulation a
18,46420,03921,53723,77125,18625,62226,066
107
changes in the state's work force from a historical perspective. Our analysis indicates that personnel-year changes over the last two decades havebeen quite moderate, increasing at an average annual rate of 2.1 percent.During the same period, state population increased at an average annualrate of 1.7 percent.
As shown in Table 41, over two decades, the state work force will growby 51 percent, while population will grow by 41 percent. It is not surprising, however, that the state's work force is growing slightly faster than thepopulation over time. This is generally because of increased services provided by the state. For example, a larger percentage of the state's population is attending the University of California and California State University than it did in 1965-66.- Similarly, the Department of Corrections ishousing a larger portion of the state's citizens and the Department ofMotor Vehicles is processing more vehicle registrations as a percentage ofthe state's population than it did two decades ago.
Table 41 also illustrates the trends in civilian employment over theperiod. Like the state's work force, this sector grew at a faster rate thanthe state's population. This also is not surprising, however, given tworecent trends: (1) the influx of second wage earners into the labor forceand (2) a higher percentage of the national and state population of working age due to demographic changes over the period.
Table 41Trends in California Employment and Population
1965-66 through 1985-86 (selected years. in thousands)
Difference:1965-66 to 1985-86 .Percent change .Average annual change ..
7750.7%2.1%
5,06270.1%2.7%
7,60241.2%1.7%
a Source: Governor's Budgets and Department of Finance.b Source: Department of Finance and Employment Development Department. Data reported on average
employment over a calendar-year. Amounts reflected here are for the concluding year of each fiscalyear.
Changing Distribution of the Work Force by Functional Area
Chart 17 illustrates how the percentage distribution of the state's workforce, by functional area, has changed since 1965-66. What the chart showsis that higher education staffing, principally for the University of Califor-
108
nia and the California State University, is the single largest component ofthe state's work force, in both percentage and absolute terms. Its relativeimportance, moreover, has been growing in recent decades. From 30percent of the state's work force in 1965-66, employment in higher education has increased to 41 percent of the state's total in 1983-84.
Chart 17Historical Percentage Changes in the FunctionalComposition of the State Work ForceSelected Years-1965-66 through 1985-86 a
80-8175-7670-7165-66
10
83-84 84-85 85-86(est.) (prop.)
aSource: Governor's Budgets. Historical figures adjusted for comparability with the state's organizational structure in 1985-86.
HigherEducation..
Other
CJ 100%
Youth and 90
Adult80Corrections.. 70
Business, 60Transportationand Housing 50
40
Health and 30Welfare
11.1 20
Conversely, the relative importance of employment in both health andwelfare and business, transportation and housing has been declining inrecent years-from 22 percent and 21 percent of the total state's workforce in 1965-66 to 16 percent and 14 percent in 1985-86, respectively.Changes in health and welfare staffing levels can be attributed to a number of factors, including major reductions in the state hospitals' mentallyill populations, beginning in the 1960s and extending to the mid-1970s. Thisled to the closing of three state hospitals and staffing reductions in theremaining 11 hospitals. Similarly, the developmentally disabled population in the state hospitals has been declining since the late 1960s. Thedecline in business, transportation and housing primarily reflects the reduction in the state's extensive highway capital outlay program from thepeak levels in the early 1970s.
109
Youth and adult correctional programs accounted for 6 percent of thetotal state work force from 1965-66 through 1980-81. Since then, the programs' share of the total has steadily increased, reaching an all-time highof 9 percent in the budget year. This expansion has consisted almostexclusively of increases in the Department of Corrections to accommodate the influx of adult inmates.
Staffing for all other activities of state government, including generaladministration and revenue collection functions, consumer services, parksand other resource-related activities, has remained relatively stable, atapproximately 20 percent of the state work force, despite significantchanges in state services and operations during the last two decades.