+ All Categories
Home > Documents > The 2010 Federal Reserve Payments Study - FRB Services · Depository institution accountholders’...

The 2010 Federal Reserve Payments Study - FRB Services · Depository institution accountholders’...

Date post: 12-Apr-2018
Category:
Upload: duongque
View: 218 times
Download: 1 times
Share this document with a friend
22
The 2010 Federal Reserve Payments Study Noncash Payment Trends in the United States: 2006 – 2009 Research Sponsored by the Federal Reserve System Updated April 5, 2011 Copyright 2011, Federal Reserve System
Transcript

The 2010 Federal Reserve Payments Study

Noncash Payment Trends in the United States: 2006 – 2009

Research Sponsored by the Federal Reserve System

Updated April 5, 2011

Copyright 2011, Federal Reserve System

2010 Federal Reserve Payments Study December 2010

© 2010, Federal Reserve System 2

Project Team Members

Federal Reserve

Geoffrey R. Gerdes

Senior Economist, Payment System Studies Section Division of Reserve Bank Operations and Payment Systems Board of Governors of the Federal Reserve System

May X. Liu

Statistician, Payment System Studies Section Division of Reserve Bank Operations and Payment Systems Board of Governors of the Federal Reserve System

Nancy Donahue

Retail Payments Financial Product Coordinator Retail Payments Office of the Federal Reserve System Federal Reserve Bank of Atlanta

Richard R. Oliver

Executive Vice President Federal Reserve Bank of Atlanta

Alexander F. Eiermann

Senior Research Assistant Division of Reserve Bank Operations and Payment Systems Board of Governors of the Federal Reserve System

Melinda Rushing

Vice President Retail Payments Office of the Federal Reserve System Federal Reserve Bank of Atlanta

Jacqueline M. Iwata

Senior Research Assistant Division of Reserve Bank Operations and Payment Systems Board of Governors of the Federal Reserve System

Sharon Pepples

Retail Payments Financial Director Retail Payments Office of the Federal Reserve System Federal Reserve Bank of Atlanta

Consultants

Michael D. Argento

Expert McKinsey & Company, Atlanta, GA

Jarrett Helms

Expert McKinsey & Company, Atlanta, GA

Timothy Arscott-Mills

Senior Expert McKinsey & Company, Atlanta, GA

Michael Southwell

Specialist McKinsey & Company, Atlanta, GA

Christopher Gill

Senior Expert McKinsey & Company, Atlanta, GA

David Stewart

Senior Expert McKinsey & Company, Chicago, IL

2010 Federal Reserve Payments Study December 2010

© 2010, Federal Reserve System 3

Contents

1 EXECUTIVE SUMMARY............................................................................................................. 4

2 SUMMARY OF FINDINGS.......................................................................................................... 7

2.1 Check Payments .................................................................................................................... 7

2.1.1 Checks Cleared Electronically............................................................................................. 8

2.1.2 Checks Returned Unpaid .................................................................................................... 9

2.1.3 On-Us Checks ..................................................................................................................... 9

2.1.4 Checks Paid by Type of Depository Institution.................................................................. 10

2.1.5 Checks Written by Counterparty and Purpose .................................................................. 11

2.1.6 Image Exchange and Image Exchange Exceptions.......................................................... 12

2.2 Electronic Payments ........................................................................................................... 13

2.2.1 ACH Payments .................................................................................................................. 14

2.2.2 Credit Card Payments ....................................................................................................... 15

2.2.3 Debit Card Payments......................................................................................................... 16

2.2.4 Prepaid Card Payments .................................................................................................... 17

2.2.5 ATM Withdrawals............................................................................................................... 18

3 CONCLUSION........................................................................................................................... 19

4 APPENDIX ................................................................................................................................ 20

4.1 About the Study ................................................................................................................... 20

4.1.1 Depository Institutions Payments Study............................................................................ 20

4.1.2 Electronic Payments Study................................................................................................ 21

4.1.3 Check Sample Study ......................................................................................................... 21

4.2 Tabular Results.................................................................................................................... 22

2010 Federal Reserve Payments Study December 2010

© 2010, Federal Reserve System 4

1 Executive Summary

The 2010 Federal Reserve Payments Study is the fourth of a series of triennial studies

conducted by the Federal Reserve System to comprehensively estimate and study

aggregate trends in noncash payments in the United States. This study estimates the total

number and value of payments that were made in 2009 by check, debit card, credit card,

automated clearinghouse (ACH), and prepaid card from accounts domiciled in the United

States. The study also estimates the number and value of ATM withdrawals.

The estimated number of noncash payments totaled 109.0 billion in 2009, with a value of

$72.2 trillion. The number of noncash payments in the United States has increased at a

compounded annual rate of 4.6 percent since 2006, the year examined in the 2007 Federal

Reserve Payments Study (Exhibit 1).

Exhibit 1: Number of Noncash Payments

2006 2009 CAGR*

Total (billions) 95.2 109.0 4.6%

Checks (paid) 30.5 24.5 -7.1%

ACH 14.6 19.1 9.4%

Credit card 21.7 21.6 -0.2%

Debit card 25.0 37.9 14.8%

Prepaid card 3.3 6.0 21.5%

Figures may not add due to rounding.

*CAGR is compound annual growth rate.

Electronic payments (those made with cards and by ACH) now collectively exceed three-

quarters of all noncash payments while payments by check are now less than one-quarter

(Exhibit 2). The increase in electronic payments and the decline of checks can be

attributed to technological and financial innovations that influenced the payment instrument

choices of consumers and businesses. Many other factors, including the business cycle,

2010 Federal Reserve Payments Study December 2010

© 2010, Federal Reserve System 5

changes in the composition of economic activity, regulatory developments, and population

growth may also have influenced these trends.

Exhibit 2: Distribution of the Number of Noncash Payments

2006 2009

Prepaid4%

ACH

15%Credit card

23%

Debit card

26%

Checkspaid

32%22%

Prepaid 5%

Credit card

18%

Debit card

20%

Checkspaid

35%

ACH

The check collection process has become substantially more electronic since the last

survey. Depository institution accountholders’ use of check image deposit services

(“remote deposit capture”) and replacement of paper exchange with image exchange

between depository institutions has expanded. Approximately 13 percent of checks were

deposited as images at the bank of first deposit, and 97 percent of “interbank” checks –

those deposited at one depository institution but drawn on another – involved electronic

clearing.1 The latter compares to an estimate of 43 percent in the 2007 study.

ACH transactions grew at 9.4 percent per year from 2006 to 2009, resulting in 19.1 billion

entries at the end of the period. Interim data demonstrate that ACH growth decelerated

between studies: the number of ACH entries grew more rapidly early in the three-year

period than at the end.

Since 2006, the debit card has eclipsed the check as the most used noncash instrument.

This was not only because the number of debit card transactions increased at 14.8 percent

per year from 2006 to 2009 but also because the number of checks paid declined 7.1

percent per year. The number of checks written also continued to decline, albeit at a

1 The number of interbank checks used for this estimate includes commercial checks only, excluding U.S. Treasury checks and Postal Money Orders.

2010 Federal Reserve Payments Study December 2010

© 2010, Federal Reserve System 6

somewhat slower pace (5.7 percent) than checks paid. The rates of decline in checks

written and check paid during this period were both greater than during the previous three-

year period (2003-2006).

Though starting from a smaller base, payments made with prepaid cards (which include

private label, general purpose, and EBT cards) increased at the fastest rate (21.5 percent

per year), reaching a total of 6 billion transactions in 2009. Aggregate credit card

payments, on the other hand, exhibited the first observed decline (-0.2 percent per year) of

any instrument besides the check since the Federal Reserve Payments Study began in

2000.

The 2010 Federal Reserve Payments Study comprises three related data collection efforts.

Some data are from the 2010 Depository Institutions Payments Study and are based on

responses to surveys sent to a nationally representative, stratified random sample of

depository institutions (DIs). Other data are from the 2010 Electronic Payments Study,

based on a survey of payment networks, processors, and card issuers that process most

of the electronic payments in the United States. Finally, the 2010 Check Sample Study,

which is based on a random sample of checks processed by the Viewpointe archive

member banks, is the source of data about the changing nature of check writing in the

United States. See section 4.1 for a description of the studies.

The Federal Reserve System wishes to thank the organizations and

individuals who contributed to the estimates discussed in this report. We

recognize that studies such as these shift resources from other important

initiatives. We appreciate the commitment of time and energy by all who

were involved. Their efforts have provided tremendous benefit to the

industry.

2010 Federal Reserve Payments Study December 2010

© 2010, Federal Reserve System 7

2 Summary of Findings

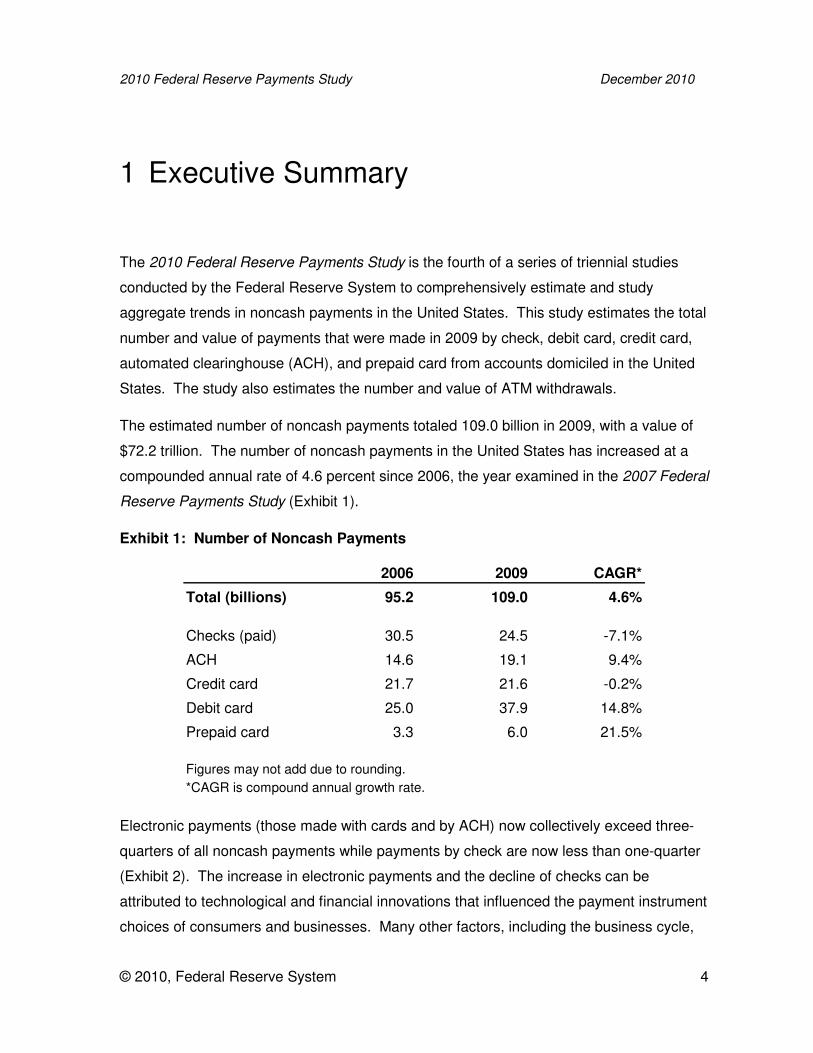
Overall, the number of noncash payments in the United States increased 4.6 percent per

year since 2006, approximately the same pace as the previous three-year period (4.5

percent).2 By comparison, real dollar gross domestic product and personal consumption

expenditure increased by 1.8 and 0.3 percent, respectively, per year between 2006 and

2009. The dollar value of noncash payments decreased 1.6 percent per year over the

same period, likely reflecting the economic recession.
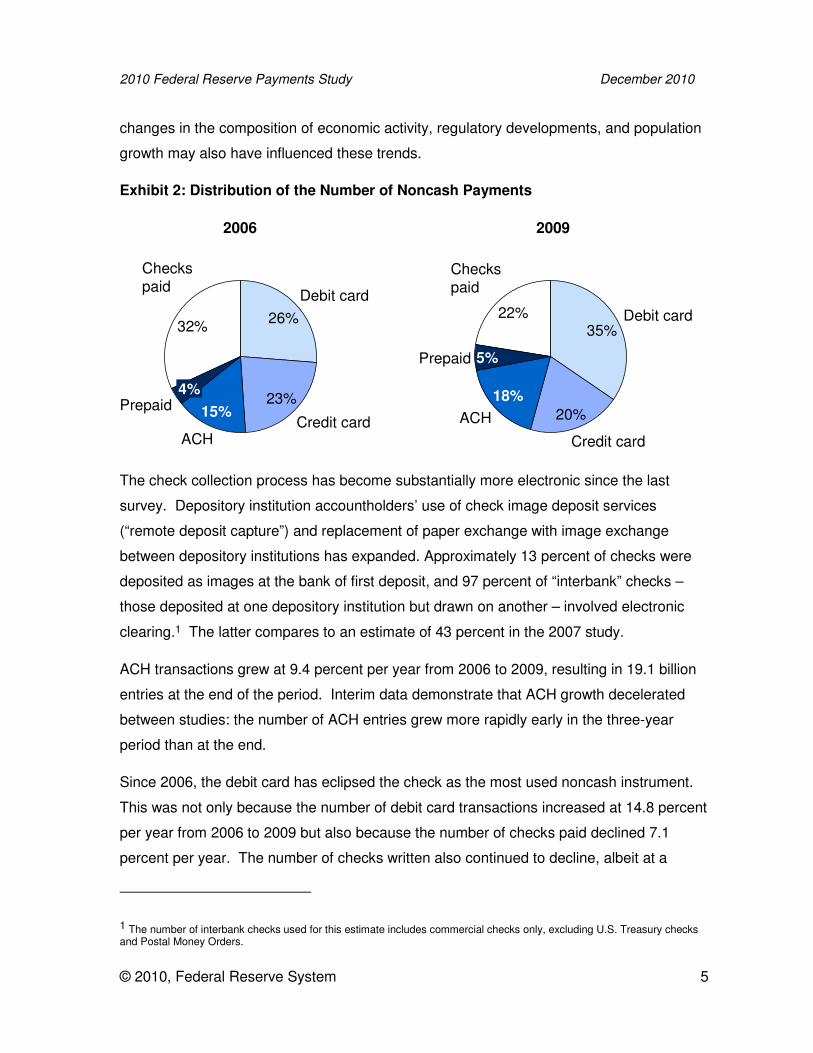
2.1 CHECK PAYMENTS

The number of checks paid in 2009 is estimated to have been 24.5 billion, with a value of

$31.6 trillion. The number of checks paid declined 7.1 percent per year between 2006 and

2009, resulting in 6.1 billion fewer checks paid in 2009 than 2006.3 Because of the use of

the ACH to convert some consumer checks by billers and merchants, the number of

checks paid differs from the number of checks written (Exhibit 3).4 The number of checks

written declined less than the number of checks paid. There were 5.3 billion fewer checks

written in 2009 than in 2006, a decline of 5.7 percent per year.

2 In this report, estimates of noncash payments do not include payments made using large-value funds transfer systems. The growth rate between 2003 and 2006 has been adjusted for comparability, because the 2004 study did not attempt to estimate all 2003 prepaid card transaction volume. 3 Checks paid include those cleared as original paper checks, as substitute checks, via electronic check presentment, or via image exchange. They exclude checks converted to other forms of payment, such as ACH, for clearing and settlement. 4 By agreement, consumer checks can be converted into electronic payments by merchants at the point of sale or by billers that receive check remittances. Some checks counted as written may have been used only as source documents to initiate electronic payments.

2010 Federal Reserve Payments Study December 2010

© 2010, Federal Reserve System 8

Exhibit 3: Number of Checks Written, Paid, or Converted to ACH

billions

2009

27.8

24.5(88%)

3.3 (12%) Converted to ACH

-5.7%

Paid as checks

2006

33.1

30.5(92%)

2.6 (8%)Checks written

The average value of checks paid decreased from $1,363 in 2006 to $1,292 in 2009.

Including checks converted to ACH, which averaged $227 in 2009, the average value of a

check written decreased from $1,278 in 2006 to $1,165 in 2009. The decrease in average

value likely reflects the economic recession that existed during the latter part of the period,

and may not represent permanent changes in the financial behavior of consumers and

businesses.5

2.1.1 Checks Cleared Electronically

Over the past three years, the percentage of checks cleared electronically has more than

doubled. These changes are increasing the efficiency of the check clearing system for

interbank checks—those drawn on a different depository institution than the one at which

they were deposited. At the time of the survey, an estimated 97 percent of interbank

checks involved the replacement of the original paper check with electronic payment

information at some point in the collection process, compared to an estimated 43 percent

at the time of the prior survey.

5 According to the National Bureau of Economic Research’s Business Cycle Dating Committee, the recession began December 2007 and ended June 2009.

2010 Federal Reserve Payments Study December 2010

© 2010, Federal Reserve System 9

2.1.2 Checks Returned Unpaid

From 2006 to 2009, the number of checks returned unpaid declined 6.1 percent per year,

from 153 million items to 127 million items. During this time period, the number of checks

paid also decreased, and the ratio of checks returned to checks paid declined from 0.50

percent in 2006 to 0.52 percent in 2009. The total value of returned checks decreased

11.4 percent per year during the same period, from $182 billion in 2006 to $127 billion in

2009. The ratio of returned checks to paid checks by value declined from 0.44 percent to

0.40 percent. The average value of returned checks decreased from $1,193 to $1,001;

these results may stem from the nature of bank overdraft programs or changes in financial

behavior of consumers and businesses.

2.1.3 On-Us Checks

From 2006 to 2009, the number of on-us checks—checks that were deposited or cashed at

the same depository institution on which they were drawn—increased from 6.2 billion in

2006 to 6.4 billion in 2009 (Exhibit 4). The proportion of on-us checks also increased,

from 20.4 percent of paid checks in 2006 to 26.3 percent in 2009. The increasing

proportion of on-us checks is consistent with the consolidation among large commercial

banks that took place during that period.

2010 Federal Reserve Payments Study December 2010

© 2010, Federal Reserve System 10

Exhibit 4: On-Us versus Interbank Checks Paid6

billions

-7.1%

Interbank

On-us

2009

24.5

18.0(74%)

6.4(26%)

2006

30.5

24.3(80%)

6.2(20%)

2.1.4 Checks Paid by Type of Depository Institution

In 2009, commercial banks paid 84.5 percent of checks by number and 92.5 percent by

value. Credit unions and savings institutions paid 8.6 percent and 5.5 percent by number

and 2.3 percent and 4.1 percent by value, respectively. From 2006 to 2009 the number of

checks paid by savings institutions declined most rapidly (16.9 percent per year), followed

by credit unions (9.1 percent per year) (Exhibit 5). The larger relative declines at credit

unions and savings institutions may be driven by the increased use of debit cards by

consumers. Credit unions, and to a lesser extent savings institutions, have a higher

proportion of consumers in their account base than do commercial banks.

6 An on-us check is a check paid by the depository institution at which it was first deposited. An interbank check is paid at one depository institution but drawn on another.

2010 Federal Reserve Payments Study December 2010

© 2010, Federal Reserve System 11

Exhibit 5: Checks Paid by Type of Depository Institution

Number Value Average Number Value Average

(billions) (trillions) value (billions) (trillions) value Number Value

Total 30.5 $41.6 $1,363 24.5 $31.6 $1,292 -7.1% -8.8%

Commercial banks 25.0 $39.0 $1,558 20.7 $29.2 $1,414 -6.2% -9.1%

Credit unions 2.8 $0.8 $282 2.1 $0.7 $352 -9.1% -2.2%

Savings institutions 2.3 $1.6 $681 1.3 $1.3 $973 -16.9% -6.5%

Postal money orders 0.2 $0.0 $164 0.1 $0.0 $180 -8.4% -5.4%

U.S. Treasury checks 0.2 $0.2 $1,203 0.2 $0.3 $1,544 1.7% 10.5%

Figures may not add due to rounding.

The value of postal money orders was $28 billion in 2006 and $24 billion in 2009.

2006 2009 CAGR (%)

2.1.5 Checks Written by Counterparty and Purpose

As mentioned above, the Check Sample Study estimates the proportion of checks in

various counterparty and purpose categories from a random sample of checks processed

by a small number of very large banks. The total number of checks written (as estimated

by the Depository Institutions Payments Study) was allocated to each category under the

assumption that the estimated proportions represent the true proportion among checks

written and processed by all depository institutions.

Of the checks written in 2009, 44.3 percent, or 12.3 billion checks, were estimated to be

consumer-to-business (C2B) checks, down from 17.0 billion in 2006 (Exhibit 6). All

purpose categories of C2B checks experienced declines over the period, including checks

written for remittance (i.e., bill payment), point-of-sale (POS) purchases, and those that

could not be categorized (remittance/POS). The decline in C2B check writing reflects,

among other things, the replacement of consumer checks by electronic payments, such as

online bill payments through the ACH, or point-of-sale purchases with debit cards.

Replacement of checks by electronic instruments and the economic slowdown are likely

also to have affected the number of checks written by businesses. The number of

business-to-consumer checks (B2C) declined from 5.6 billion to 5.2 billion from 2006 to

2009. Simultaneously, the number of business-to-business (B2B) checks declined from

8.3 billion in 2006 to 7.9 billion in 2009.

2010 Federal Reserve Payments Study December 2010

© 2010, Federal Reserve System 12

The category of consumer to consumer (C2C) is estimated to have increased to 2.4 billion

in 2009 from 2.2 billion in 2006.

Exhibit 6: Change in the Distribution of Checks

2006(33.1 billion)

2009(27.5 billion)

2.4

5.2

0.6

2.0

1.2

1.6

7.96.0

12.38.6

2.2

5.6

1.1 1.8

1.9

8.3

C2B

5.4

B2C

P2P / C2C

B2B

17.010.7 4.4

CAGR(2006-09)

4%

-3%

-2%

-10%

4%

-3%

-2%

-10%

Remittance / POSPOS OtherRemittance

billions

2.1.6 Image Exchange and Image Exchange Exceptions

An estimated 16.3 billion items were presented to the paying depository institution via

image exchange in 2009. Of those, six million (0.04 percent) required exception handling

because paying institutions judged the images to be of insufficient quality to be processed

accurately or because the check images and accompanying data did not match. The

former types of exceptions result from a check image failing the paying institution's image

quality analysis (IQA), which measures objective characteristics of the image, or its image

usability analysis (IUA), which includes more subjective measures. Data mismatch

exceptions result from the MICR codeline of a check and the image of the check becoming

disassociated during processing. Other image exchange related exceptions occur when a

paying institution receives duplicate images of checks in an image exchange file or

2010 Federal Reserve Payments Study December 2010

© 2010, Federal Reserve System 13

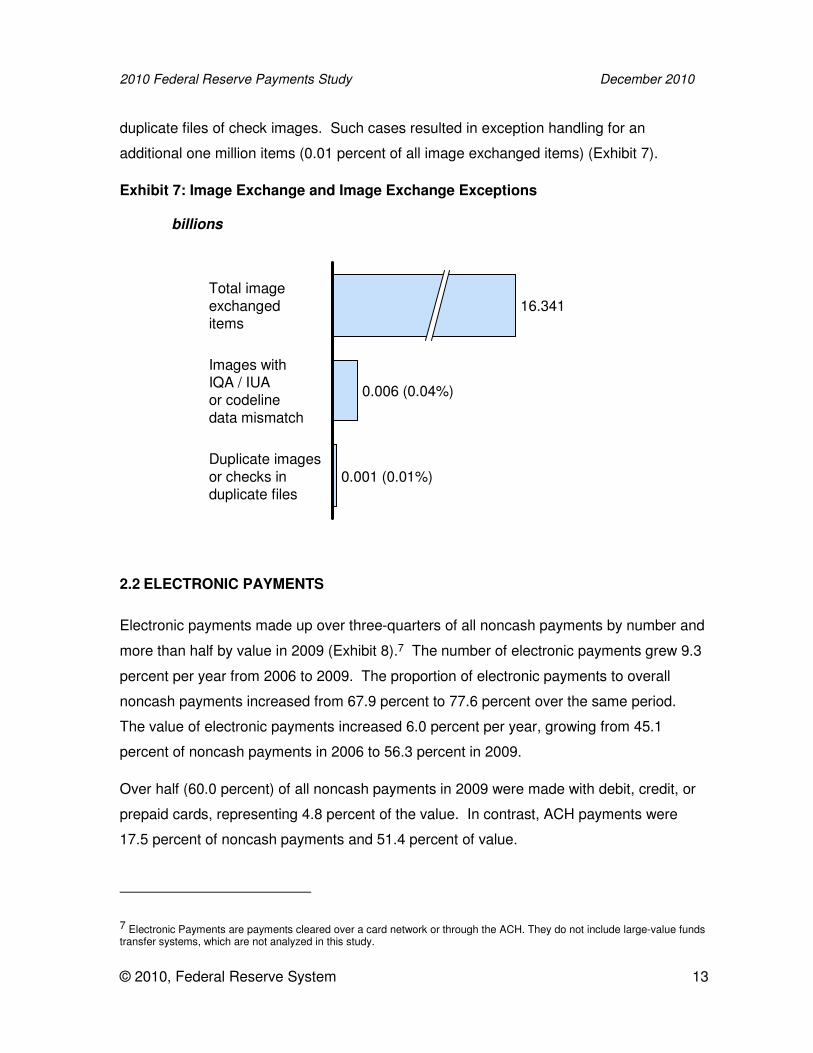
duplicate files of check images. Such cases resulted in exception handling for an

additional one million items (0.01 percent of all image exchanged items) (Exhibit 7).

Exhibit 7: Image Exchange and Image Exchange Exceptions

Duplicate imagesor checks induplicate files

0.001 (0.01%)

Images with IQA / IUAor codelinedata mismatch

0.006 (0.04%)

Total imageexchangeditems

16.341

billions

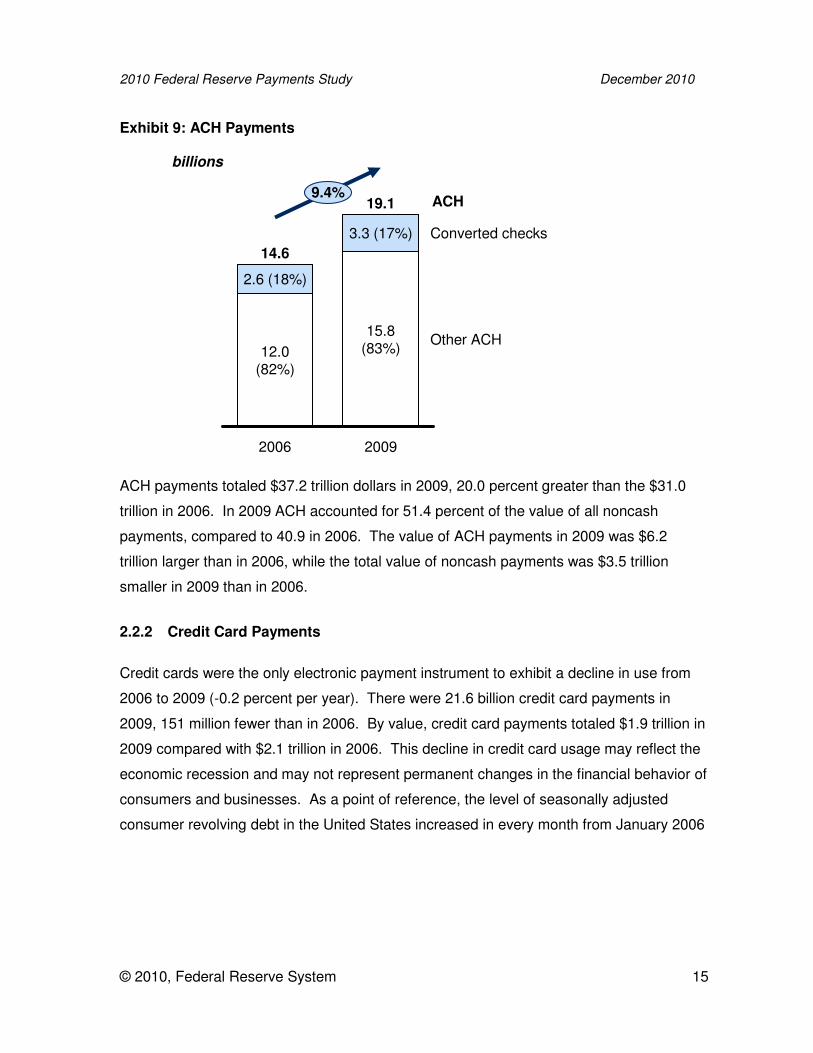
2.2 ELECTRONIC PAYMENTS

Electronic payments made up over three-quarters of all noncash payments by number and

more than half by value in 2009 (Exhibit 8).7 The number of electronic payments grew 9.3

percent per year from 2006 to 2009. The proportion of electronic payments to overall

noncash payments increased from 67.9 percent to 77.6 percent over the same period.

The value of electronic payments increased 6.0 percent per year, growing from 45.1

percent of noncash payments in 2006 to 56.3 percent in 2009.

Over half (60.0 percent) of all noncash payments in 2009 were made with debit, credit, or

prepaid cards, representing 4.8 percent of the value. In contrast, ACH payments were

17.5 percent of noncash payments and 51.4 percent of value.

7 Electronic Payments are payments cleared over a card network or through the ACH. They do not include large-value funds transfer systems, which are not analyzed in this study.

2010 Federal Reserve Payments Study December 2010

© 2010, Federal Reserve System 14

Exhibit 8: Distribution of the Number and Value of Noncash Payments in 2009

Number Value

22%

Checks paid

35%

Debitcard

20%

Credit card

18%

ACH

5%Prepaid1

Checks paid2%

Debit card

3%

Creditcard

51%ACH

0%

Prepaid1

44%

2.2.1 ACH Payments

The number of ACH payments increased 9.4 percent per year from 2006 to 2009, from

14.6 billion transactions in 2006 to 19.1 billion transactions in 2009. Interim data

demonstrate that ACH growth decelerated between studies: the number of ACH entries

grew more rapidly early in the three-year period than at the end. ACH payments in 2009

exceeded those in 2006 by 4.5 billion.

The number of converted checks in 2009 (3.3 billion) was greater than in 2006 (2.6 billion)

but decreased from 17.7 percent to 17.3 percent of total ACH transactions (Exhibit 9).

2010 Federal Reserve Payments Study December 2010

© 2010, Federal Reserve System 15

Exhibit 9: ACH Payments

2009

19.1

15.8(83%)

3.3 (17%)

2006

14.6

12.0(82%)

2.6 (18%)

9.4%

Other ACH

Converted checks

billions

ACH

ACH payments totaled $37.2 trillion dollars in 2009, 20.0 percent greater than the $31.0

trillion in 2006. In 2009 ACH accounted for 51.4 percent of the value of all noncash

payments, compared to 40.9 in 2006. The value of ACH payments in 2009 was $6.2

trillion larger than in 2006, while the total value of noncash payments was $3.5 trillion

smaller in 2009 than in 2006.

2.2.2 Credit Card Payments

Credit cards were the only electronic payment instrument to exhibit a decline in use from

2006 to 2009 (-0.2 percent per year). There were 21.6 billion credit card payments in

2009, 151 million fewer than in 2006. By value, credit card payments totaled $1.9 trillion in

2009 compared with $2.1 trillion in 2006. This decline in credit card usage may reflect the

economic recession and may not represent permanent changes in the financial behavior of

consumers and businesses. As a point of reference, the level of seasonally adjusted

consumer revolving debt in the United States increased in every month from January 2006

2010 Federal Reserve Payments Study December 2010

© 2010, Federal Reserve System 16

to its peek in August 2008 before declining in every subsequent month through September

2010.8

2.2.3 Debit Card Payments

Debit card payments continued their double-digit growth from 2006 to 2009 and accounted

for 34.8 percent of noncash payments in 2009 (2.0 percent by value). Total debit card

payments increased 14.8 percent per year during the period (Exhibit 10). PIN debit

payments increased more rapidly (15.6 percent per year) than signature debit payments

(14.3 percent per year). The absolute increase in signature debit payments from 2006 to

2009 (7.7 billion) exceeded the total increase in PIN debit payments (5.1 billion).

Exhibit 10: Debit Card Payments by Type 9

14.8%

Signature

PIN

2009

37.9

23.4(62%)

14.5(38%)

2006

25.0

15.7(63%)

9.4(37%)

billions

Debit card

The average signature debit value per transaction declined from 2006 to 2009 from $40

per transaction to $37. The average value of PIN debit card payments increased during

this period, from $37 to $39 per transaction.10 Interestingly, the average value of

8 Federal Reserve Board of Governors, G.19 statistic, Consumer Credit 9 Includes debit transactions funded from demand deposit accounts; does not include “prepaid” debit. 10 The estimate of the value of PIN debit card payments excludes a portion of value estimated to have been returned to the customer as cash.

2010 Federal Reserve Payments Study December 2010

© 2010, Federal Reserve System 17

Signature payments dropped below the average value of PIN payments, in part reflecting

the expansion of the use of the signature in small-value card payments.

2.2.4 Prepaid Card Payments

Although they still represent a relatively small volume among the categories of noncash

payments discussed, the use of prepaid card is the fastest growing.11 The number of

prepaid card transactions increased 21.5 percent per year from 2006 to 2009, and the

value of prepaid transactions increased at 22.9 percent per year. Private label was the

most used type of prepaid card, with 2.7 billion transactions in 2009. Two billion

transactions were made using Electronic Benefits Transfer (EBT) cards, and 1.3 billion

were made using general purpose prepaid cards (Exhibit 11).

Exhibit 11: Prepaid debit payments by type

Prepaid debit

2.0(33%)

2.7(45%)

1.3(22%)

1.1(33%)

1.9(58%)

0.3(9%)

2006

3.3Private label

21.5%

EBT

General purpose

2009

6.0

billions

11 Prepaid debit includes payments made by prepaid instruments purchased by households and payments by cards funded by US firms or government agencies to disburse payments or benefits to households (e.g., payroll cards, EBT); includes single-use and reloadable cards, but excludes transit cards, toll way systems, and phone cards. General purpose prepaid instruments are network branded by either credit card or PIN networks (e.g., payroll or prepaid banking cards). Private label transactions are prepaid cards which are limited in usage to one or several merchants (e.g., gift cards).

2010 Federal Reserve Payments Study December 2010

© 2010, Federal Reserve System 18

2.2.5 ATM Withdrawals

There were 6.0 billion ATM withdrawals in 2009, with a total value of $647 billion. ATM

withdrawals increased 0.9 percent per year by number and increased 3.8 percent per year

by dollar value since 2006. The average ATM withdrawal increased slightly from $100 to

$108.

These estimates do not measure the number or value of cash payments. ATMs are not

the only source for cash, and many factors may have contributed to the increase in the

absolute value of cash withdrawn from ATMs. Furthermore, the number or value of cash

withdrawals is not necessarily proportional to the number or value of cash payments.

2010 Federal Reserve Payments Study December 2010

© 2010, Federal Reserve System 19

3 Conclusion

With electronic payments now representing over three-quarters of all noncash payments,

the 2009 study demonstrates that the migration from paper to electronic payment methods

shown in previous studies is continuing and in some cases at increasing rates. While the

study focuses on aggregate empirical data that does not in itself reveal the specifics of

substitution patterns, it seems clear that the increasing adoption of electronic options, such

as debit cards, online bill payments, and prepaid cards is a driving factor.

Several findings and implications warrant highlighting:

• Nearly all interbank checks are now cleared electronically. This has increased the

efficiency of check clearing at a time when check usage is declining at a faster rate

than in prior periods.

• Debit card usage continues to grow at double-digit annual rates. While the study

did not measure cash usage, it is likely that some of debit card’s growth has come

from its substitution for cash payments.

• Prepaid cards are an increasingly significant part of the noncash payments

landscape and meet a range of market needs.

2010 Federal Reserve Payments Study December 2010

© 2010, Federal Reserve System 20

4 Appendix

4.1 ABOUT THE STUDY

As in the previous studies, the 2010 study included two data collection efforts to estimate

the annual number and value of significant types of noncash payments in the United States

for 2009. Estimates of check payments and ATM withdrawals were based on findings from

the 2010 Depository Institutions Payments Study. Electronic payments volume estimates

were based on findings from the 2010 Electronic Payment Instruments Study and

supplemented by the 2010 Depository Institutions Payments Study.

A third effort, the 2010 Check Sample Study, was the basis for estimating the distribution

of checks by counterparty and purpose.

The research methods used in 2010 are similar to those used in 2007, 2004 and 2001.

Some 2006 estimates have been revised to reflect new information and ensure

consistency with the 2009 estimates.

McKinsey & Company assisted the Federal Reserve in this effort.

Detailed reports of the methodology and findings of each study will be made available on

www.frbservices.org.

4.1.1 Depository Institutions Payments Study

The 2010 Depository Institutions Payments Study collected the number and value of

different types of payments from deposit accounts at a representative, random sample of

depository institutions for March and April of 2010. McKinsey & Company worked with

Lieberman Research Group as a subcontractor for this effort.

A stratified random sample of 2,700 depository institutions in the United States was drawn.

The largest depository institutions were sampled at a higher rate in an effort to count as

many transactions as possible and estimate as few as possible. The sample included

2010 Federal Reserve Payments Study December 2010

© 2010, Federal Reserve System 21

commercial banks, savings institutions, and credit unions. A total of 1,311 depository

institutions provided data for the survey, including all of the 50 largest US depository

institutions.

Although the survey period was March and April, 2010, unless otherwise noted, the

estimates were annualized and reported as 2009 estimates. This approach allowed for

comparison to the data on electronic payments. Readers may wish to consult the more

detailed report of findings for additional information on the study’s methods and results.

4.1.2 Electronic Payments Study

The 2010 Electronic Payments Study estimated the number and value of electronic

payments in the United States for calendar year 2009. Data were collected by surveying

payment networks, processors, and card issuers. Of the 116 organizations asked to

participate, 94 of the largest organizations provided data.

Survey forms were distributed to the payment organizations that process, clear, or settle

electronic payments in the United States to collect data for the calendar year 2009.

Respondents to this voluntary study collectively accounted for an estimated 95.5 percent of

the electronic transactions and 99.6 percent of the electronic payments value in the United

States.

4.1.3 Check Sample Study

The 2010 Check Sample Study estimated the distribution of checks by counterparty and

purpose for the calendar year 2009. Study data are based on a random sample of checks

processed by 11 banks that use the Viewpointe archive.

2010 Federal Reserve Payments Study December 2010

© 2010, Federal Reserve System 22

4.2 TABULAR RESULTS

Number Value Average Number Value Average Number Value Number ValueTotal noncash payments 95.2 75.74 796 109.0 72.2 663 13.8 -3.5 4.6 -1.6

Checks (paid) 30.5 41.60 1,363 24.5 31.6 1,292 -6.1 -10.0 -7.1 -8.8

US Treasury checks 0.2 0.23 1,203 0.2 0.31 1,544 0.0 0.1 1.7 10.5Postal money orders 0.2 0.03 164 0.1 0.02 180 0.0 0.0 -8.4 -5.4Commercial checks 30.2 41.34 1,371 24.1 31.26 1,296 -6.0 -10.1 -7.2 -8.9

On-us 6.2 11.91 1,916 6.4 10.96 1,702 0.2 -1.0 1.2 -2.7

Returns 0.2 0.18 1,193 0.1 0.13 1,001 0.0 -0.1 -6.1 -11.4

Electronic payments 64.7 34.14 528 84.5 40.6 481 19.8 6.5 9.3 6.0

ACH 14.6 30.97 2,122 19.1 37.16 1,947 4.5 6.2 9.4 6.3

Credit card 21.7 2.12 98 21.6 1.92 89 -0.2 -0.2 -0.2 -3.4

Debit carda25.0 0.97 39 37.9 1.42 38 12.8 0.4 14.8 13.5

Signature (Offline)a

15.7 0.62 40 23.4 0.86 37 7.7 0.2 14.3 11.2PIN (Online) 9.4 0.35 37 14.5 0.56 39 5.1 0.2 15.6 17.3

Prepaid card 3.3 0.08 23 6.0 0.14 24 2.6 0.1 21.5 22.9

General purpose 0.3 0.01 41 1.3 0.04 33 1.0 0.0 63.4 48.8Private label 1.9 0.03 18 2.7 0.04 17 0.8 0.0 11.8 9.5

EBT 1.1 0.03 27 2.0 0.05 28 0.9 0.0 21.4 22.6

ATM cash withdrawals 5.8 0.58 100 6.0 0.65 108 0.2 0.1 0.9 3.8

Checks (written)b33.1 42.30 1,278 27.8 32.35 1,165 -5.3 -9.9 -5.7 -8.6

Checks converted to ACH 2.6 0.70 272 3.3 0.75 227 0.7 0.1 8.7 2.4

Memoc

Real GDPd13.37 14.12

Real PCEe9.07 9.15

Population 298.6 307.0Relative prices

GDP implicit price deflator 0.94 1.00

CPIf

0.94 1.00

Numbers in billions. Values in trillions of USD. Figures may not add due to rounding. CAGR is the compound annual growth rate.

b. Includes the use of checks as source documents to initiate electronic payments.

c. These figures, provided for comparison, were obtained from the Bureau of Economic Analysis (BEA), U.S. Department of Commerce, as of October 31, 2010.

d. Real Gross Domestic Product in trillions of USD.

e. Real Personal Consumption Expenditures in trillions of USD.

f. Consumer Price Index.

2.01

2.05

a. Revised because the 2007 summary report debit card estimates included general purpose prepaid. Revision based on the assumption that all general purpose prepaid

payments were by Signature.

0.1

8.4

0.06

0.06

2006 2009

Total change

2006-2009 CAGR(%)

0.8 1.8

0.3

0.9


Recommended