The Astrophysical Journal, 788:130 (13pp), 2014 June 20 doi:10.1088/0004-637X/788/2/130 C 2014. The American Astronomical Society. All rights reserved. Printed in the U.S.A. THE 2011OUTBURST OF RECURRENT NOVA TPyx: X-RAY OBSERVATIONS EXPOSE THE WHITE DWARF MASS AND EJECTION DYNAMICS Laura Chomiuk 1 ,2 , Thomas Nelson 3 , Koji Mukai 4 ,5 , J. L. Sokoloski 6 , Michael P. Rupen 2 , Kim L. Page 7 , Julian P. Osborne 7 , Erik Kuulkers 8 , Amy J. Mioduszewski 2 , Nirupam Roy 9 , Jennifer Weston 6 , and Miriam I. Krauss 2 1 Department of Physics and Astronomy, Michigan State University, East Lansing, MI 48824, USA; [email protected]2 National Radio Astronomy Observatory, P.O. Box O, Socorro, NM 87801, USA 3 School of Physics and Astronomy, University of Minnesota, 115 Church Street SE, Minneapolis, MN 55455, USA 4 CRESST and X-ray Astrophysics Laboratory, NASA/GSFC, Greenbelt, MD 20771, USA 5 Center for Space Science and Technology, University of Maryland Baltimore County, 1000 Hilltop Circle, Baltimore, MD 21250, USA 6 Columbia Astrophysics Laboratory, Columbia University, New York, NY, USA 7 Department of Physics and Astronomy, University of Leicester, Leicester, LE1 7RH, UK 8 European Space Astronomy Centre (ESA/ESAC), Science Operations Department, E-28691 Villanueva de la Caada, Madrid, Spain 9 Max Planck Institut f ¨ ur Radioastronomie, Auf dem H ¨ ugel 69, D-53121 Bonn, Germany Received 2014 February 16; accepted 2014 May 2; published 2014 May 30 ABSTRACT The recurrent nova T Pyx underwent its sixth historical outburst in 2011, and became the subject of an intensive multi-wavelength observational campaign. We analyze data from the Swift and Suzaku satellites to produce a detailed X-ray light curve augmented by epochs of spectral information. X-ray observations yield mostly non-detections in the first four months of outburst, but both a super-soft and hard X-ray component rise rapidly after Day 115. The super-soft X-ray component, attributable to the photosphere of the nuclear-burning white dwarf, is relatively cool (∼45 eV) and implies that the white dwarf in T Pyx is significantly below the Chandrasekhar mass (∼1 M ). The late turn-on time of the super-soft component yields a large nova ejecta mass (10 −5 M ), consistent with estimates at other wavelengths. The hard X-ray component is well fit by a ∼1 keV thermal plasma, and is attributed to shocks internal to the 2011 nova ejecta. The presence of a strong oxygen line in this thermal plasma on Day 194 requires a significantly super-solar abundance of oxygen and implies that the ejecta are polluted by white dwarf material. The X-ray light curve can be explained by a dual-phase ejection, with a significant delay between the first and second ejection phases, and the second ejection finally released two months after outburst. A delayed ejection is consistent with optical and radio observations of T Pyx, but the physical mechanism producing such a delay remains a mystery. Key words: novae, cataclysmic variables – stars: individual (T Pyxidis) – white dwarfs – X-rays: stars Online-only material: color figures 1. INTRODUCTION The five thermonuclear explosions of T Pyxidis observed in 1890, 1902, 1920, 1944, and 1966 earned the system its place as the prototypical recurrent nova, but have also highlighted our poor understanding of many aspects of binary evolution and nova theory. The community has waited anxiously for the next outburst of T Pyx in order to study this peculiar system with modern multi-wavelength capabilities, and T Pyx finally obliged by entering its sixth recorded outburst in 2011 April. High-quality panchromatic observations are now revealing a host of new surprises for this system. A nova is a transient event marking a thermonuclear runaway on the surface of an accreting white dwarf. The white dwarf accretes hydrogen-rich material from a companion star, and this accreted material settles down into a thin degenerate layer on the surface of the white dwarf. The pressure and temperature in this layer increase until explosive nuclear burning begins, and the bulk of the accreted envelope is expelled from the white dwarf at hundreds to thousands of km s −1 . Novae are expected to recur on an accreting white dwarf with a timescale primarily determined by the white dwarf mass and accretion rate (e.g., Yaron et al. 2005; Wolf et al. 2013). Predicted recurrence timescales vary widely (∼1–10 8 yr; Yaron et al. 2005), and those novae repeating on historical timescales have been dubbed “recurrent” novae. Theoretically, we expect recurrent novae to occur in binaries where massive white dwarfs accrete at high rates, because more massive white dwarfs have higher surface gravities, meaning that the critical conditions are reached for smaller accreted envelopes, and higher accretion rate systems accrue this trigger mass in less time. Even before 2011, T Pyx flew in the face of our expectations for recurrent novae. The evolution of its optical light curve is slow, showing a several months-long plateau around maximum light and a relatively slow decline from this maximum (Schaefer 2010). T Pyx has a short orbital period (1.83 hr; Uthas et al. 2010), solidly below the cataclysmic-variable (CV) period gap. According to the theory of CV evolution, such short-period systems should have, on average, very low accretion rates (e.g., Knigge 2011), but observations in quiescence—and the short nova recurrence time—imply that T Pyx has an accretion rate orders of magnitude higher than these expectations (Gilmozzi & Selvelli 2007; Selvelli et al. 2008). In addition, measured binary parameters imply that the white dwarf in T Pyx may be significantly less massive than the Chandrasekhar mass (Uthas et al. 2010), in contrast with common assumptions for recurrent novae. The high accretion rate in T Pyx does not appear to be sustainable, as it is exceeds expectations by several orders 1
THE 2011 OUTBURST OF RECURRENT NOVA T Pyx: X-RAY OBSERVATIONS EXPOSETHE WHITE DWARF MASS AND EJECTION DYNAMICS
Laura Chomiuk1,2, Thomas Nelson3, Koji Mukai4,5, J. L. Sokoloski6, Michael P. Rupen2,Kim L. Page7, Julian P. Osborne7, Erik Kuulkers8, Amy J. Mioduszewski2,
Nirupam Roy9, Jennifer Weston6, and Miriam I. Krauss21 Department of Physics and Astronomy, Michigan State University, East Lansing, MI 48824, USA; [email protected]
2 National Radio Astronomy Observatory, P.O. Box O, Socorro, NM 87801, USA3 School of Physics and Astronomy, University of Minnesota, 115 Church Street SE, Minneapolis, MN 55455, USA
4 CRESST and X-ray Astrophysics Laboratory, NASA/GSFC, Greenbelt, MD 20771, USA5 Center for Space Science and Technology, University of Maryland Baltimore County, 1000 Hilltop Circle, Baltimore, MD 21250, USA
6 Columbia Astrophysics Laboratory, Columbia University, New York, NY, USA7 Department of Physics and Astronomy, University of Leicester, Leicester, LE1 7RH, UK
8 European Space Astronomy Centre (ESA/ESAC), Science Operations Department, E-28691 Villanueva de la Caada, Madrid, Spain9 Max Planck Institut fur Radioastronomie, Auf dem Hugel 69, D-53121 Bonn, Germany
Received 2014 February 16; accepted 2014 May 2; published 2014 May 30
ABSTRACT
The recurrent nova T Pyx underwent its sixth historical outburst in 2011, and became the subject of an intensivemulti-wavelength observational campaign. We analyze data from the Swift and Suzaku satellites to produce a detailedX-ray light curve augmented by epochs of spectral information. X-ray observations yield mostly non-detectionsin the first four months of outburst, but both a super-soft and hard X-ray component rise rapidly after Day 115.The super-soft X-ray component, attributable to the photosphere of the nuclear-burning white dwarf, is relativelycool (∼45 eV) and implies that the white dwarf in T Pyx is significantly below the Chandrasekhar mass (∼1 M�).The late turn-on time of the super-soft component yields a large nova ejecta mass (�10−5 M�), consistent withestimates at other wavelengths. The hard X-ray component is well fit by a ∼1 keV thermal plasma, and is attributedto shocks internal to the 2011 nova ejecta. The presence of a strong oxygen line in this thermal plasma on Day 194requires a significantly super-solar abundance of oxygen and implies that the ejecta are polluted by white dwarfmaterial. The X-ray light curve can be explained by a dual-phase ejection, with a significant delay between the firstand second ejection phases, and the second ejection finally released two months after outburst. A delayed ejectionis consistent with optical and radio observations of T Pyx, but the physical mechanism producing such a delayremains a mystery.
The five thermonuclear explosions of T Pyxidis observed in1890, 1902, 1920, 1944, and 1966 earned the system its placeas the prototypical recurrent nova, but have also highlightedour poor understanding of many aspects of binary evolutionand nova theory. The community has waited anxiously for thenext outburst of T Pyx in order to study this peculiar systemwith modern multi-wavelength capabilities, and T Pyx finallyobliged by entering its sixth recorded outburst in 2011 April.High-quality panchromatic observations are now revealing ahost of new surprises for this system.
A nova is a transient event marking a thermonuclear runawayon the surface of an accreting white dwarf. The white dwarfaccretes hydrogen-rich material from a companion star, and thisaccreted material settles down into a thin degenerate layer onthe surface of the white dwarf. The pressure and temperature inthis layer increase until explosive nuclear burning begins, andthe bulk of the accreted envelope is expelled from the whitedwarf at hundreds to thousands of km s−1.
Novae are expected to recur on an accreting white dwarfwith a timescale primarily determined by the white dwarfmass and accretion rate (e.g., Yaron et al. 2005; Wolf et al.2013). Predicted recurrence timescales vary widely (∼1–108 yr;Yaron et al. 2005), and those novae repeating on historical
timescales have been dubbed “recurrent” novae. Theoretically,we expect recurrent novae to occur in binaries where massivewhite dwarfs accrete at high rates, because more massivewhite dwarfs have higher surface gravities, meaning that thecritical conditions are reached for smaller accreted envelopes,and higher accretion rate systems accrue this trigger mass inless time.
Even before 2011, T Pyx flew in the face of our expectationsfor recurrent novae. The evolution of its optical light curve isslow, showing a several months-long plateau around maximumlight and a relatively slow decline from this maximum (Schaefer2010). T Pyx has a short orbital period (1.83 hr; Uthas et al.2010), solidly below the cataclysmic-variable (CV) period gap.According to the theory of CV evolution, such short-periodsystems should have, on average, very low accretion rates (e.g.,Knigge 2011), but observations in quiescence—and the shortnova recurrence time—imply that T Pyx has an accretion rateorders of magnitude higher than these expectations (Gilmozzi& Selvelli 2007; Selvelli et al. 2008). In addition, measuredbinary parameters imply that the white dwarf in T Pyx may besignificantly less massive than the Chandrasekhar mass (Uthaset al. 2010), in contrast with common assumptions for recurrentnovae.
The high accretion rate in T Pyx does not appear to besustainable, as it is exceeds expectations by several orders
1
The Astrophysical Journal, 788:130 (13pp), 2014 June 20 Chomiuk et al.
of magnitude for mass transfer rates driven by gravitationalradiation (the commonly accepted mass transfer mechanism atsuch short orbital periods). Knigge et al. (2000) and Schaeferet al. (2010) have hypothesized that mass transfer in T Pyx isin a short-term elevated state, perhaps incited by a powerfulnova outburst which occurred during the 1800s (before regularrecords were kept on T Pyx). Before this postulated event, T Pyxmay have been a typical CV below the period gap, with a verylow accretion rate and long intervals between novae. However,after the hypothesized explosion, the hot white dwarf irradiatedthe companion star and induced an unusually high mass transferrate. Perhaps this irradiation power is slowly dwindling and theaccretion rate is gradually declining, explaining the increasingintervals between nova events observed for T Pyx throughoutthe last century. Observational tests of this hypothesis havereached divergent conclusions as to whether there is evidencefor a secular decline in T Pyx’s accretion rate (e.g., Schaeferet al. 2013; Godon et al. 2014).
Regardless of T Pyx’s history, it is clear that T Pyx pro-vides an opportunity to test an unusual corner of nova param-eter space. Compared with other novae, we have a thoroughunderstanding of the binary system’s parameters and the accre-tion rate (Selvelli et al. 2008; Uthas et al. 2010). With multi-wavelength data collected from the 2011 outburst, we can mea-sure key properties of the nova event, like ejected mass, andcompare them with predictions from nova models. With thisgoal in mind, campaigns have been carried out across the en-tire electromagnetic spectrum, providing an exquisitely detailedpicture of the 2011 nova outburst of T Pyx (Chesneau et al.2011; Kuulkers et al. 2011a, 2011b; Shore et al. 2011, 2013;Evans et al. 2012; Imamura & Tanabe 2012; Nelson et al. 2014;Ederoclite 2013; Williams 2013; Schaefer et al. 2013; Pattersonet al. 2013; Sokoloski et al. 2013; Tofflemire et al. 2013; DeGennaro Aquino et al. 2014; Godon et al. 2014; Surina et al.2014).
At every wavelength studied so far, the 2011 outburst of TPyx shows surprising features when compared to expectationsfor recurrent novae. As in previous outbursts, the optical lightcurve shows a sort of plateau for three months (Figure 1),implying that the optical photosphere is roughly constant in sizefor ∼90 days after thermonuclear runaway (Shore et al. 2013).Optical spectroscopy shows that T Pyx is an unusual “hyper-hybrid” nova, switching from He/N class to Fe ii class aroundDay 10, and then back to He/N on Day 65 (Williams 2012, 2013;Ederoclite 2013; Surina et al. 2014). The radio light curve andoptical measurements of the change in the binary period afterthe nova event imply a large ejected mass (∼10−4–10−5 M�;Nelson et al. 2014; henceforth, Paper I; Patterson et al. 2013),rather than the ∼10−6–10−7 M� expected for recurrent novae.Radio light curves also show a late and steep rise (Figure 1;Paper I), implying that either the ejecta in T Pyx were verycold (<200 K) during the first ∼50 days of the outburst, or thebulk of the nova ejecta stalled at an ∼AU-scale radius until itwas finally expelled ∼50 days after the thermonuclear runaway(such a delay might also explain the long plateau in the opticallight curve; Shore et al. 2013).
In this work, we focus on X-ray observations of the 2011outburst of T Pyx obtained with Swift and Suzaku, and compareour results with inferences from other wavelengths. X-rayemission from novae can be split into two broad classes, whichmay, but need not, exist contemporaneously (Krautter 2008).The first class is super-soft X-ray emission, characterized byeffective temperatures between 105 and 106 K, and luminosities
Figure 1. Overview of the 2011 outburst of T Pyx at optical, X-ray, and radiowavelengths. Top: V-band optical data from the AAVSO. Middle: 0.3–10 keVX-ray light curve obtained with Swift/XRT. Bottom: VLA radio light curve at2.5, 7, and 37 GHz (Paper I).
(A color version of this figure is available in the online journal.)
in the range 1036–1038 erg s−1. High-resolution spectra obtainedwith the grating instruments onboard Chandra and XMM-Newton have confirmed that this emission originates near thewhite dwarf photosphere (Nelson et al. 2008; Rauch et al. 2010;Ness et al. 2011; Orio 2012). In some novae (e.g., V2491 Cyg,RS Oph) the soft X-ray flux is continuum emission that mostlikely originates at the white dwarf photosphere. In other cases,the soft X-rays are associated with strong lines of H and He-like carbon, nitrogen and oxygen that likely indicate scatteredphotospheric emission (see Ness et al. 2013 and referencestherein). Super-soft X-ray emission only becomes visible atlater stages of the nova outburst, once the ejecta have becomeoptically thin to the radiation from the hot, still burning whitedwarf surface layers; therefore, the emergence time of the super-soft source can be used as a diagnostic for ejecta mass (Henzeet al. 2011; Schwarz et al. 2011).
Observations of novae in the ∼1–10 keV energy range alsoreveal harder X-ray emission on timescales of days to yearsafter outburst (e.g., Mukai et al. 2008). During the novae in RSOph and V407 Cyg, both of which have red giant secondaries,hard X-ray emission was detected at early times and attributedto the interaction of the nova ejecta with the dense wind ofthe companion (Sokoloski et al. 2006; Nelson et al. 2012).In systems with less evolved donors (and hence lower densitycircumbinary environments), internal shocks within the ejectahave been proposed as the origin for hard X-ray emission (seeMukai et al. 2008 and references therein). In these cases, hardX-ray emission can tell us about the structure of the ejectaas the nova outburst progresses (O’Brien et al. 1994). In thelast three years, novae have been identified as a new class ofGeV gamma-ray transient by Fermi/LAT, indicating that theshock interactions in novae are capable of accelerating particlesto relativistic speeds (Abdo et al. 2010; Hill et al. 2013; seealso Tatischeff & Hernanz 2007). Observations of novae inthe 1–10 keV range are required to characterize these shocks
2
The Astrophysical Journal, 788:130 (13pp), 2014 June 20 Chomiuk et al.
and fully understand the gamma-ray production mechanism. Wenote that T Pyx was not detected with Fermi (C. Cheung 2013,private communication), making it a useful comparison case forthe study of why some novae produce detectable gamma-rayswhile others do not.
In this paper, we discuss both modes of X-ray emissionduring the 2011 outburst of T Pyx. In Section 2, we discuss theX-ray observations and data reduction; Swift monitoring revealsthe X-ray evolution at high cadence, while our single epoch ofSuzaku spectroscopy provides high signal to noise on Day 194.In Section 3, we describe the Swift X-ray light curve, andSection 4 presents our spectral analysis of the Swift and Suzakudata. Section 5 analyzes the observed hard X-ray componentand concludes that it is likely produced by a shock withinthe ejecta, rather than interaction between the nova and pre-existing circumbinary material. Section 6 presents a super-softcomponent with a relatively cool temperature and late turn-on time (compared to other recurrent novae). In Section 7, wediscuss how these X-ray results align with optical and radioobservations, and suggest that all three wavelength regimessupport a second, massive, delayed ejection in T Pyx. Weconclude in Section 8.
Throughout the paper, we take 2011 April 14 (MJD = 55665)as t0 or Day 0, the beginning of optical rise and the start of theoutburst (Waagan et al. 2011; Schaefer et al. 2013). We alsoassume a distance to T Pyx of 4.8 ± 0.5 kpc (Sokoloski et al.2013).
2. OBSERVATIONS AND DATA REDUCTION
2.1. Swift
The 2011 outburst of T Pyx was monitored frequently withthe Swift satellite as part of the ongoing monitoring of novaeby the Swift Nova CV Group (Kuulkers et al. 2011a, 2011b;Osborne et al. 2011a). A series of 221 Swift X-ray Telescope(XRT) observations of T Pyx were carried out between 2011April 14 (Day 1) and 2012 April 17 (Day 369), resulting inone of the most detailed X-ray light curves of a nova obtainedto date. All observations were made in photon counting mode.The total XRT exposure time was ∼271 ks, with a mediansnapshot duration of ∼1 ks. Swift observed T Pyx daily duringthe first month of the outburst, and then reduced the cadence to2–3 times per week for the subsequent three months. Once theX-ray emission became bright at the start of 2011 September(see Section 3 below), the cadence was once more increased todaily, and remained so for the next two months. The observingcadence was reduced at late times, ultimately resulting in weeklyobservations after 2012 January, through 2012 April (Days262–369).
We created grade 0–12 event light curves and time-resolvedhardness ratios using the Swift/XRT products generator devel-oped by the Swift group at the University of Leicester.10 Thisweb-based tool can create X-ray light curves, spectra and im-ages of any object that has been observed with the XRT, andmakes use of tools originally developed for automatic reduc-tion of gamma-ray burst observations. Details of these productsare given in Evans et al. (2009). We used an adaptive binningstrategy to maximize the count rate and hardness ratio informa-tion in the light curves. Prior to Day 124, and after Day 200,the data were binned to give a minimum of 20 counts per bin.In between these days while the source was bright, the datawere binned by observation (i.e., all snapshots with a single
10 http://www.swift.ac.uk/user_objects/
Figure 2. X-ray spectrum of T Pyx as observed with Suzaku on Day 194 inthree different XIS units (colored as black, red, and blue lines). The data areshown in the upper panel as points, overlaid with the best-fit model (the sumof a blackbody, a thermal bremsstrahlung plasma, and a Gaussian line) in solidlines. The parameters of this model can be found in Table 1. Residuals in the fitto the data are shown in units of sigma in the lower panel. The data shown hereare without the energy offset discussed in Section 4.1, to illustrate the offset inenergy calibration between XIS1 and XIS0/XIS3.
(A color version of this figure is available in the online journal.)
observation ID). We also created spectra for certain time in-tervals during the outburst (see Section 4.2), again using theXRT products generator. We obtained the appropriate responsematrix file, in this case swxpc0to12s6 20010101v013.rmf, fromthe calibration database. The resulting spectra were binned tohave a minimum of one count per bin, and then modeled inXSpec using the Cash statistic, a maximum likelihood-basedstatistic for Poisson data (Cash 1979).
2.2. Suzaku
Given the X-ray rise reported by Osborne et al. (2011a),we requested and were granted a Director’s Discretionary Timeobservation of T Pyx with the Suzaku observatory. The exposurewas carried out on 2011 October 25 (Day 194). Here, we focuson the data obtained with the X-ray Imaging Spectrometer (XIS)in the 0.3–10 keV energy range. All three functioning XIS unitswere operated in the full-window imaging mode, obtainingX-ray event data every 8 s over the full 19′ by 19′ field ofview. After standard screening,11 the net exposure time was∼38,600 s for each XIS unit. We extracted the source spectrafrom a 180′′ region centered on T Pyx using XSelect v2.4b.Background spectra were extracted from annular regions alsocentered on the source, with inner radius 240′′ and outer radius420′′ for both XIS1 and XIS3, while the outer radius was 390′′for XIS0 (the smaller size is to avoid dead regions of the chip).We created response files using the xisrmfgen and xisarfgenftools. The most recent version of the contamination model(version 20120719) was used to calculate the effective areas.The resulting spectra were binned to have a minimum of 30counts per bin in order to facilitate the use of χ2 statistics indetermining the best-fit spectral model (Figure 2).
3. X-RAY LIGHT CURVE OF THE 2011OUTBURST OF T Pyx
We present the Swift XRT light curve in the middle panelof Figure 1, as well as the V-band AAVSO optical light curve
The Astrophysical Journal, 788:130 (13pp), 2014 June 20 Chomiuk et al.
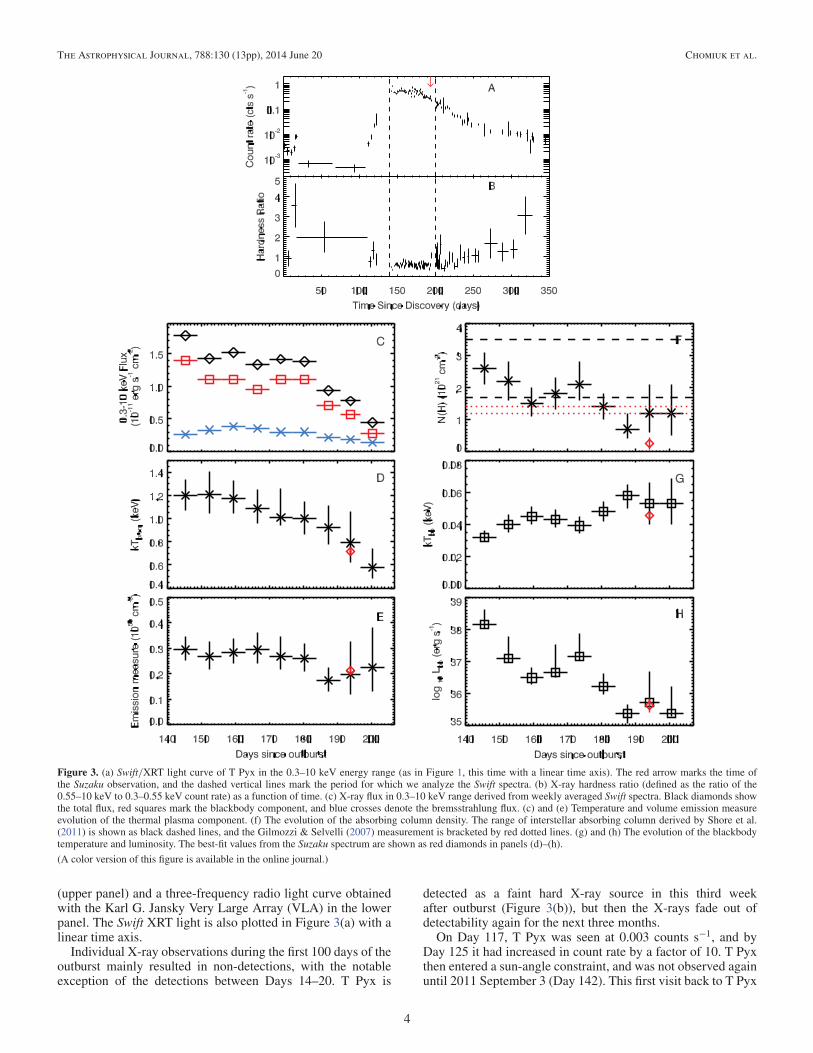
Figure 3. (a) Swift/XRT light curve of T Pyx in the 0.3–10 keV energy range (as in Figure 1, this time with a linear time axis). The red arrow marks the time ofthe Suzaku observation, and the dashed vertical lines mark the period for which we analyze the Swift spectra. (b) X-ray hardness ratio (defined as the ratio of the0.55–10 keV to 0.3–0.55 keV count rate) as a function of time. (c) X-ray flux in 0.3–10 keV range derived from weekly averaged Swift spectra. Black diamonds showthe total flux, red squares mark the blackbody component, and blue crosses denote the bremsstrahlung flux. (c) and (e) Temperature and volume emission measureevolution of the thermal plasma component. (f) The evolution of the absorbing column density. The range of interstellar absorbing column derived by Shore et al.(2011) is shown as black dashed lines, and the Gilmozzi & Selvelli (2007) measurement is bracketed by red dotted lines. (g) and (h) The evolution of the blackbodytemperature and luminosity. The best-fit values from the Suzaku spectrum are shown as red diamonds in panels (d)–(h).
(A color version of this figure is available in the online journal.)
(upper panel) and a three-frequency radio light curve obtainedwith the Karl G. Jansky Very Large Array (VLA) in the lowerpanel. The Swift XRT light is also plotted in Figure 3(a) with alinear time axis.
Individual X-ray observations during the first 100 days of theoutburst mainly resulted in non-detections, with the notableexception of the detections between Days 14–20. T Pyx is
detected as a faint hard X-ray source in this third weekafter outburst (Figure 3(b)), but then the X-rays fade out ofdetectability again for the next three months.
On Day 117, T Pyx was seen at 0.003 counts s−1, and byDay 125 it had increased in count rate by a factor of 10. T Pyxthen entered a sun-angle constraint, and was not observed againuntil 2011 September 3 (Day 142). This first visit back to T Pyx
4
The Astrophysical Journal, 788:130 (13pp), 2014 June 20 Chomiuk et al.
Table 1Best-fit Model Parameters for Day 194 Suzaku Spectruma
Notes.a All quoted uncertainties are 90% confidence intervals.b NormBB = L39
D210
, where L39 is the bolometric luminosity of the source in units of 1039 erg s−1, and D10 is the distance to the source in units of 10 kpc.
c Normbr = 3.02×10⁻¹⁵
4πD2
∫nenidV , where D is the distance to the source in units of cm and ne and ni are the electron and ion number densities, respectively, in
units of cm−3.d Normvapec = 10−14
4πD2
∫nenidV , where the parameters have the same meaning as in the bremsstrahlung model.
e Normgauss = Total photons cm−2 s−1 in the Gaussian line.
revealed that the source had increased in count rate by anotherorder of magnitude, to around 0.4 cts s−1. The 0.3–10 keVcount rate remained high, although variable, until Day ∼180,at which point it began to fade systematically over the fol-lowing 200 days. By the time of the last monitoring observa-tion with Swift on 2012 April 17, the source count rate was∼0.07 counts s−1.
4. X-RAY SPECTRA OF THE 2011 OUTBURST OF T Pyx
4.1. A Deep View on Day 194 with Suzaku
Although the Swift observations were carried out with highcadence, in general, the continuous observation durations wererather short and resulted in limited counting statistics forspectroscopy. The Suzaku observation on Day 194 resulted in∼22,000 counts between all three XIS units (Figure 2). We usethis deep observation to characterize the X-ray emission in asmuch detail as possible, and to inform our model for the lowercount statistic Swift data.
We modeled the spectra extracted from all three XIS unitsjointly in Xspec version 12.8.0m (Arnaud 1996), and presentthe resulting parameters in Table 1. In all models, a constantwas included in order to allow for uncertainty in the calibrationof the relative effective areas of the three CCDs (typically of theorder of 5%–10%).
To account for absorption by the interstellar medium (ISM)we use the tbnew model of Wilms et al. (2000), and assume thecross-sections of Verner et al. (1996) and the ISM abundancesof Wilms et al. (2000). A range of values for the degreeof interstellar absorption toward T Pyx have been given inthe literature. Gilmozzi & Selvelli (2007) find a value of
E(B − V ) = 0.25 ± 0.02 from IUE ultraviolet spectra ofT Pyx obtained during quiescence, which corresponds to a valueof N (H ) ≈ (1.3 ± 0.1) × 1021 cm−2 (assuming the correlationbetween N (H ) and E(B−V ) of Predehl & Schmitt 1995). Shoreet al. (2011) used diffuse interstellar bands observed during the2011 outburst to determine E(B − V ) = 0.49 ± 0.17 mag forT Pyx, implying N (H ) ≈ (2.6 ± 0.9) × 1021 cm−2. Finally,Godon et al. (2014) determined an intermediate reddening valuefrom UV spectroscopy, E(B − V ) = 0.35 mag.
The Suzaku spectrum is clearly complex. A distinct softcomponent is observed below 0.5 keV and is most obviousin the XIS1 data, which has the highest sensitivity at lowenergies. A second, harder continuum component extends outto ∼6 keV. Finally, there is a rather striking resolved emissionline at E ≈ 0.65 keV that we identify as O viii Lyα. There areno obvious emission lines at any other location in the spectrum.
We begin our exploration of the spectrum with a simple modelthat accounts for the main features seen in the data: the sum ofa blackbody, a thermal plasma, and a Gaussian emission line(model tbnew*(bb+brems+gauss) in Table 1). This model isnot strictly physical, as the soft component is expected to showfeatures typical of a white dwarf atmosphere and the plasmais expected to cool primarily through lines, but it does providea useful starting point given the limited energy resolution ofthe spectrum. This simple model provides a reasonable fit tothe data, with χ2/ν = 1.26 (ν = 539). The Gaussian lineis clearly required to account for the feature at ∼0.65 keV.However, the best-fit energy of the emission line is found to be0.643+0.002
−0.003 keV, implying that the O viii line is redshifted by∼5000 km s−1. This velocity is at odds with the results ofTofflemire et al. (2013), who reported that the O viii Lyα line
5
The Astrophysical Journal, 788:130 (13pp), 2014 June 20 Chomiuk et al.
is blue-shifted by ∼−400 km s−1 in a Chandra Low EnergyGrating Spectrograph (LETG) observation taken a few monthslater (Day 210). The observed redshift is also larger thanvelocities derived from optical spectroscopy at any point duringthe outburst.
A careful examination of the residuals around the emissionline in all three XIS units reveals a shift to lower energies inthe XIS1 data, possibly indicating a problem with the energycalibration of the observation. At low energies (<1 keV),uncertainties in the energy scale calibration come primarily fromthe determination of the CCD zero-level, and it is possible thatthis was more uncertain for the XIS1 CCD than the others.We investigated the presence of this energy offset in XIS1relative to the other two CCDs using the gain fit command inXSpec. Fitting all three spectra independently with an absorbedblackbody model, we find evidence of an offset in the energyscale of XIS1 by approximately −8 eV relative to XIS0 andXIS3. Including this additional energy offset in the model fitdecreases both the reduced χ2 value of the fit, and the residualsaround the emission line in the XIS1 data. We therefore includean energy offset of −8 eV for the XIS1 spectrum in all ofour fits moving forward. This energy offset is consistent withthe estimated uncertainty in the energy scale below 1 keV of<10 eV,12 although it may indicate that the error in the energyscale determination for this observation was larger than typicalvalues. Comparing fits with and without the offset, we find verylittle difference in the values associated with the blackbody andbremsstrahlung components, but the energy of the line shiftsto higher energies with the inclusion of the energy offset. Wetherefore caution that the uncertainties in the line energy arelarger than the statistical errors from the fit alone, likely of theorder of 10 eV (or 4500 km s−1 in velocity space).
The best-fit parameters obtained for the simple black-body+thermal plasma+Gaussian line model, obtained with theinclusion of the additional XIS1 energy offset, are shown inTable 1. This model is presented in Figure 2, overplotted onthe observed spectra. The best-fit N (H ) value for this model isonly (2.7 ± 1.9) × 1020 cm−2, much lower than the value ex-pected from optical and UV estimates of reddening. The black-body temperature, kTBB, is found to be 47 ± 2 eV (545,400 ±23,000 K, 90% confidence level), with the main constraint com-ing from the well-sampled Wien tail between 0.4 and 0.6 keV.The normalization of this component implies a blackbody lu-minosity of (3.7+3.5
−1.8) × 1035 erg s−1. The plasma temperature isfound to be 0.72 ± 0.03 keV, or (8.4 ± 0.4) × 106 K. The nor-malization of this component corresponds to a volume emissionmeasure of EMV = n2 V = (2.2+0.2
−0.1) × 1057 cm−3, or an X-rayluminosity of (8.9+1.0
−0.6) × 1033 erg s−1.We have accounted for the presence of the O viii Lyα line in
this simple model with an additional Gaussian. However it ismore realistic to attempt to fit the data with a model that producesboth continuum and line emission. Therefore, we also modeledthe harder component with the APEC models of collisionalionization equilibrium plasmas (Foster et al. 2012). A solarabundance model gives a very poor fit to the data—the linesof He-like Si and S, as well as the Fe L-shell emission around0.9 keV are much too strong in the model compared to thedata, while the O viii Lyα line is too weak. If we allow theabundances of all metals to vary in tandem (while keeping theirrelative abundances at solar values), the model can achieve agood fit to the data with no residuals at the Si and S lines if
the best-fit metallicity is extremely subsolar (Z ≈ 0.01 Z�).However, such a model still fails to reproduce the O viii Lyαline observed in the data, and results in abundances seeminglyat odds with the report of approximately solar abundances in thelarger scale T Pyx ejecta (Williams 1982).
We obtain a better, but still inadequate, fit to the dataif the abundance of O in the plasma is extremely super-solar, while assuming solar abundance for all other elements(model tbnew*(bb+vapec)a in Table 1). Leaving both the Oabundance of the plasma to vary freely and keeping all otherabundances fixed at solar values relative to hydrogen, we findχ2/ν = 1.7 (ν = 540) for an oxygen abundance of 150+6
−4 timessolar. The temperature of this plasma is similar to that found forthe simple bremsstrahlung model (kTbr = 0.70 ± 0.02 keV, or8.1×106 K). The temperature of the blackbody is slightly lower(kTBB = 35 eV, TBB = 406,000 K). The most marked differenceis in the N (H ), which is found to be more in line with the opticaland UV values, N (H ) = (2.0 ± 0.02) × 1021 cm−2.
The large oxygen abundance inferred by the strong emissionline in our spectrum could indicate that the shocked materialhas been significantly polluted by material from the whitedwarf. Interestingly, Tofflemire et al. (2013) find evidence fora strong overabundance (relative to solar) of N in their highspectral resolution Chandra/LETG data from Days 210 and235; our earlier Suzaku data unfortunately do not have sufficientresolution at low energies to explore this finding. Both oxygenand nitrogen overabundance are suggestive of the presence ofdredged-up white dwarf material in the thermal plasma.
We also tested an alternative possibility: that the X-rays comefrom a primarily oxygen-rich plasma that has very little metalcontent. We fit an absorbed blackbody + vapec model to thedata, but this time allowed all elemental abundances to varyfreely (model tbnew*(bb+vapec)b in Table 1). Given the lackof obvious spectral features, we kept the relative abundances ofHe, C, N and all metals with higher atomic numbers than O fixedat their solar ratios relative to Fe, and allowed the abundance ofFe to vary freely. The abundance of oxygen was allowed to varyindependently. This model results in a significantly better fit tothe data than the previous model, with χ2/ν = 1.2 (ν = 539).The abundances of all metals other than O are essentially zero,and the abundance of oxygen relative to hydrogen is ∼60%enhanced relative to solar values. The temperatures of the twocomponents are similar to those found for other models.
Alternatively, the bright oxygen line could be an indicationthat the plasma is underionized and has not yet come into colli-sional equilibrium (i.e., in non-equilibirum ionization; NEI). Totest this scenario, we use the vnei model in XSpec. The overallspectrum is modeled as the sum of an absorbed blackbody plusNEI plasma (Model tbnew*(bb+vnei) in Table 1). Keepingall elemental abundances at their solar values, we find no fitswith χ2/ν < 1.7 (ν = 538). Allowing the oxygen abundance tovary freely, but keeping all other elements fixed at solar does notimprove the fit much (χ2/ν < 1.6, ν = 537). Allowing all otherelements to vary in tandem from their solar values, as we did forthe vapec model above, does result in a better fit (χ2/ν = 1.2,ν = 537), and results in a similar ratio of oxygen to other metals(see Table 1 for model parameters). The best-fit ionization age,2.9 × 1011 s cm−3, is close to the equilibrium value for a plasmawith kT = 0.7 keV (Smith & Hughes 2010), suggesting thatnon-equilibrium ionization physics is not the primary reasonfor the strong oxygen relative to other metals.
In summary, the key results of our modeling of the Suzakuspectrum are (1) all models require both a soft and hard
6
The Astrophysical Journal, 788:130 (13pp), 2014 June 20 Chomiuk et al.
Table 2Best-fit Model Parameters for Weekly Averaged Swift X-Ray Spectraa
Date Range Time since N (H ) kTBB NormBBb kTbr Normbr
Notes.a All quoted uncertainties are 90% confidence intervals.b NormBB, normbr, and normgauss as defined in Table 1.c Parameter was fixed in model fit.
component to describe the emission, and (2) only a plasma thatis significantly enhanced in oxygen relative to all other elementscan reproduce the observed Suzaku spectrum at E > 0.5 keV.
4.2. Spectral Fits from Swift
To examine the time evolution of the distinct components weidentified in the Suzaku spectrum, we extracted and modeledweekly averaged spectra from the Swift observations. The fluxlevel and total number of counts before Day 142 are too lowto allow useful spectra to be produced. Likewise, we find thatafter Day 206 the weekly spectra have <100 total counts, andso no stable model fits are found. We therefore restrict ourspectroscopic analysis of the Swift data to weekly averagedspectra between Day 142 and Day 206 (2011 September3–November 6). At each epoch we model the fit with the simpleempirical tbnew*(bb+brems+gauss)model developed for theSuzaku data, i.e., the sum of a blackbody, a Gaussian emissionline, and thermal bremsstrahlung absorbed by the interstellarmedium. Visual inspection of the first few weekly spectra showsan enhancement of counts at the position of the O viii linefound in the Suzaku spectrum, justifying the inclusion of theGaussian line component. We fixed the energy of the Gaussianline because of the lower number of counts in the Swift spectra,and allowed the line flux to vary freely. Given the uncertaintiesin the Suzaku energy calibration discussed in Section 4.1, wefixed the energy of the line to the best-fit line energy found fromthe Swift September 3–9 spectrum (0.666 keV). Initial valuesfor all other parameters are taken from the Suzaku best-fit modeland then allowed to vary freely.
The resulting best-fit model parameter values and their 90%confidence interval uncertainties are shown in Figure 3 and listedin Table 2. Where the Swift and Suzaku observations overlap,Swift-derived parameters are consistent with measurementsfrom the deeper Suzaku observation (Suzaku parameters fromthe tbnew*(bb+brems+gauss) model shown as red diamondsin Figures 3(d)–(h)). The only exception is the N (H ) value,which is considerably lower for the Suzaku best-fit model thanthe overlapping Swift data. However, we note that the error barsshown on this plot are the statistical uncertainties from the modelfit only—they do not include a larger systematic uncertaintyrelated to the choice of model (see Table 1 for range of N (H )values found).
Over the ∼60 days where T Pyx is X-ray bright, we see evolu-tion in the spectrum and flux that is dominated by changes in thesuper-soft blackbody component (Figure 3(c)). The temperatureof the thermal plasma component is roughly constant betweenDays 140 and 180, and then declines by a factor of ∼2 by Day206 (Figure 3(d)). The volume emission measure over the sametime period does not vary significantly (Figure 3(e)), and so thedecline in temperature results in a modest drop in flux from thehard X-ray component (see blue points in Figure 3(c)).
The drop in the total flux by a factor of ∼2 between Day142–206 is mainly attributable to the blackbody component(Figure 3(c)). The decline in the super-soft light curve canalso be seen in Figure 3(h), where we see that the blackbodyluminosity is lower after Day 175 than before. This declinein flux is despite a roughly constant value of the absorbingcolumn density (Figure 3(f); consistent with the interstellarvalues estimated by Gilmozzi & Selvelli 2007 and Shore et al.2011) and a blackbody temperature evolution which shows nosignature of decline (Figure 3(g)).
In all but one of the spectra, the flux of the emission linecomponent is non-zero (Table 2). The flux appears to dropslightly in the first three weekly averaged spectra, and then re-brightens to its highest level in the October 1–7 spectrum. Theline then fades again; we only obtain an upper limit to the lineflux in the October 16–21 spectrum. The line flux is non-zero inthe last two epochs, and ∼60% smaller compared to Septembermeasurements.
We stress that the X-ray properties shown in Figure 3(c)–(h)are only obtained during the plateau in the X-ray light curve,Days 142–206. The count rates measured before Day 117 andafter Day ∼250 are orders of magnitude lower, and so we can-not glean spectral information at this time due to the poorsignal to noise in these observations. However, we can infersomething about the spectral properties from the hardness ra-tio plot (Figure 3(b)). We choose 0.55 keV as the break en-ergy between the soft and hard bands, since our Suzaku spec-tral fits imply that all flux above this energy originates in thethermal plasma component. At very early times, the spectrumappears to be quite hard, particularly at the time of the firstX-ray detections around Days 14–20. The spectrum then be-comes softer as the source gets brighter. Although the errorbars are quite large, the hardness ratio during the X-ray riseis higher than at peak brightness, which suggests that the hard
7
The Astrophysical Journal, 788:130 (13pp), 2014 June 20 Chomiuk et al.
X-ray component rose before the super-soft emission emerged.At late times, we observe a slight trend toward higher hard-ness ratios, presumably occurring as the super-soft continuumfades.
5. THE ORIGIN OF HARD X-RAY EMISSION IN T Pyx
The hard X-rays (E > 1 keV), modeled in the previous sectionas thermal plasma and seen in all Swift/XRT detections, indicatethe presence of a long-lived shock. Hard X-ray emission innovae can originate either in external material that is swept upand shocked by the nova ejecta (Sokoloski et al. 2006; Nelsonet al. 2008, 2012), or in shocks within the ejecta themselves(O’Brien et al. 1994; Mukai & Ishida 2001). In this section,we consider the possibility that the hard X-ray emission isproduced by interaction between the nova ejecta and pre-existingcircumbinary material. We will show that the timing of the hardX-ray component rules out plausible models for circumbinarymaterial around T Pyx as a significant source of X-rays. Wetherefore propose that an interaction within the 2011 ejecta,between two distinct episodes of ejection, explains the hardX-rays.
The temperature associated with the thermal plasma emissionencodes information about the kinematics of the shock. Duringthe first week T Pyx is visible after solar conjunction (Days142–148, the first Swift observations with good signal to noise;Table 2), the best-fit temperature of the hard X-ray emittingthermal plasma is Tbr ≈ 1.4 × 10⁷ K. This temperature iscomparable to those measured in hard X-ray components ofother novae (Lloyd et al. 1992; Balman et al. 1998; Mukai &Ishida 2001), and can be translated into a rough estimate of theshock velocity using the Rankine–Hugoniot jump conditions fora strong shock:
vs =√
16 kT br
3 μmH
(1)
vs
1000 km s−1 =√
Tbr
1.4 × 10⁷ K. (2)
Here, μ is the mean molecular weight of the gas and mHis the mass of a hydrogen atom. We therefore estimatevs ≈ 1000 km s−1 for the X-ray emitting shock in T Pyx.
The maximum velocity of the ejecta is a critical parameter forour models of shocked X-ray emission in T Pyx. We proceedwith our discussion using Hβ measurements of the maximumblueshift from Paper I; these imply a maximum expansionvelocity of ∼1900 km s−1 on Day 2 and ∼3000 km s−1 onDay 69 (see also Surina et al. 2014).
5.1. Could Interaction with Circumbinary MaterialProduce the Hard X-Ray Component?
A rich circumbinary medium is clearly present around TPyx, in the form of a spatially resolved, clumpy Hα+[N ii]remnant (Williams 1982; Shara et al. 1997; Schaefer et al. 2010).Contini & Prialnik (1997) propose that X-ray emission may beproduced in T Pyx when ejecta from nova outbursts interactwith this nebula. Balman (2010) and Balman et al. (2012)claimed a detection of spatial extension in X-ray images ofT Pyx in quiescence, as might be expected for such interaction.Subsequently, however, this claim was called into question usingre-analyzed high-resolution Chandra X-ray images (Montezet al. 2012).
Interaction between the 2011 ejecta and the spatially resolvednebula is simple to rule out with timescale arguments. TheHα+[N ii] flux from the nebula peaks at 4.′′4, or 0.1 pc (Sharaet al. 1997). All nine of the nebula’s “shells” proposed by Sharaet al. (1997) have radii > 1′′, or 6 × 1016 cm. Similarly largeradii, 2 × 1017 cm, are expected for the ejecta from the 1966outburst, if they expand at 1900 km s−1. Assuming the 2011ejecta are traveling at 1900–3000 km s−1, an encounter onDay 117 would imply that material from the 1966 ejection istraveling at just 20 km s−1. In the unlikely case that there areejecta from 1966 traveling at such a low velocity, we wouldexpect the shell of 1966 ejecta to be very thick (spanningvelocities 20–3000 km s−1), and the shock interaction to beprolonged over years. Instead, the rise and plateau of the hardX-ray light curve is contained to a relatively short period, Days∼117–206 (Figure 3). Reasonable assumptions for the velocityand distribution of the 1966 ejecta therefore imply that they aremuch too distant to be encountered by the 2011 ejecta in thefirst year.
In addition to the ejecta from previous novae, there mightbe circumbinary material present at smaller radii, perhaps lostthrough a wind during the quiescent period, 1967–2011. Indeed,T Pyx seems to have an unusually high accretion rate for a CV,so it is not unreasonable to expect such mass loss (Selvelli et al.2008; Schaefer et al. 2013; Godon et al. 2014). However, fromUV spectroscopy during quiescence, there is no evidence of astrong or fast outflow from T Pyx (Gilmozzi & Selvelli 2007).
Given the low inclination of T Pyx (Uthas et al. 2010), perhapsthe easiest way to “hide” significant mass loss from the binaryduring quiescence is to have it leak out of an outer Lagrangianpoint and remain concentrated in the orbital plane; we mightthen expect mass loss to proceed at relatively modest speeds onorder of the orbital velocity, ∼20 km s−1 (Uthas et al. 2010).The density of this equatorial circumbinary material should behighest near the binary, and fall off linearly with distance. Thisconfiguration of circumbinary material is in direct conflict withthe primary late rise of the X-ray light curve. While the faintdetections between Days 14–20 might be consistent with suchan interaction, the X-ray non-detections between Days 20–117imply a cavity surrounding T Pyx, extending between radii∼4 × 10¹⁴ − 2 × 1015 cm. No simple picture of circumbinarymaterial in T Pyx explains a cavity at these radii, surrounded bya dense shell. We therefore move on to consider an alternativeexplanation for the hard X-ray component in T Pyx that risesfour months after outburst: shocks within the 2011 nova ejecta.
5.2. Hard X-Rays Produced By Shocks Within the Ejecta
Shocks may be produced within the nova ejecta themselves, ifthe speed of ejection increases with time after the thermonuclearrunaway (O’Brien et al. 1994). In this case, the shock velocity(vs) is equal to 4/3 the differential velocity between the innerand outer ejecta components. In fact, we see increasing outflowvelocities in T Pyx over the first two months after outburst, asmeasured from optical spectroscopy (Paper I, Surina et al. 2014).The difference between the velocity of material ejection on Day2 and Day 69, as measured from the Hβ profile ([3000–1900] kms−1 = 1100 km s−1), is consistent with the interaction velocityestimated from the X-ray temperature (3/4vs ≈ 800 km s−1).
Let us simplify the complex picture painted by opticalspectroscopy into a cartoon scenario: one shell is expelledon Day 0 with a velocity of ∼1900 km s−1 and a second isexpelled later on with a velocity of 3000 km s−1. The bright hardX-ray component appears in the Swift data on Day 117, and rises
8
The Astrophysical Journal, 788:130 (13pp), 2014 June 20 Chomiuk et al.
steeply until it reaches maximum on Day 142 and plateaus untilDay ∼206, after which the flux gradually fades. In our model,the period of the X-ray rise and plateau corresponds to the timeit takes for the shock to plow through the first ejection (O’Brienet al. 1994); by Day 206, the first ejection would be completelyshocked. Using these measured velocities and requiring that theoutermost edges of the first and second ejections catch up withone another around Day 206, we find that the second ejectionwas released on Day 75 (in reasonable agreement with theincrease of Hβ expansion velocity and the rise of radio fluxdensity; Paper I, Surina et al. 2014).
In addition, the hard X-ray component shows a remarkablystrong O viii Lyα line in the Suzaku spectrum, implying thatthe shocked gas is overabundant in oxygen by a factor of ∼1–2orders of magnitude over solar values, as is commonly observedin nova ejecta (e.g., Gehrz et al. 1998). Such an unusually highoxygen abundance implies that the shocked material is novaejecta (rather than solar abundance material which may havebeen stripped from the secondary star).
The neutral hydrogen column density shielding the shockedmaterial decreases only a small amount, if at all, betweenDays 142 and 206, and it is not significantly higher than theISM foreground value during this period (Figure 3(f)). Muchmore dramatic declines in N (H ) are seen in the hard X-raycomponents of novae like V1974 Cyg and V382 Vel (Balmanet al. 1998; Mukai & Ishida 2001). T Pyx’s small decrease inN (H ) implies that the shock is not viewed through a denseabsorbing screen and is not deeply embedded in the ejecta.
We conclude that the timing, temperature, and abundancesof the bright hard X-ray component are all well described by ashock within the ejecta of the 2011 outburst.
6. A SUPER-SOFT SOURCE EMERGES AROUND DAY130 IN THE 2011 OUTBURST OF T Pyx
We clearly observe the unveiling of the super-soft X-rayemission in the Swift observations of T Pyx. The super-softphase is thought to begin when the nova ejecta have expandedenough to become optically thin to X-ray photons emanatingfrom the still-burning shell on the surface of the white dwarf(e.g., Krautter 2008; Schwarz et al. 2011). We note that thissuper-soft turn-on is an observationally defined phenomenon;the hot white dwarf is almost certainly present at earlier times,but it is not observed because of the large absorbing column.
Our analysis of both the Swift and Suzaku spectra of T Pyxshow clear evidence for a blackbody component with temper-ature of 35–45 eV ([4–5] × 105 K). The average bolometricluminosity of this blackbody between Days 143 and 150 is(1.3+8.0
−0.9)×1038 erg s−1, near the Eddington luminosity and typ-ical of a still shell-burning white dwarf (we note that blackbodymodel fits to super-soft spectra are known to underestimate thetemperature and overestimate the luminosity of the white dwarfphotosphere, so the uncertainties are likely larger than the sta-tistical errors from the model fit; Osborne et al. 2011b). Theluminosity of the blackbody is variable and appears to declineover the period Days 143–206. Similar variations have beenobserved in other novae, such as V2491 Cyg, where the bolo-metric luminosity during the super-soft phase did not appear tobe constant (Page et al. 2010).
The observed turn-on time of the super-soft source phasein novae has been identified as an important diagnostic of theejecta mass, since more massive ejecta will take longer to thinout as they expand, eventually reaching a column density wheresoft X-rays produced at the white dwarf photosphere can be
0 50 100 150 200Time After Ejection (Days)
1021
1022
1023
1024
1025
NH (
cm-2)
Mej = 10-6
Mej = 10-5
Mej = 10-4
3000 km s-1
1900 km s-1
Figure 4. When the column density of nova ejecta drops sufficiently (to∼5 × 1021 cm−2; black solid line), the nuclear-burning white dwarf shouldbecome visible as a super-soft X-ray source. The vertical gray region shows theplausible range of turn-on time for the super-soft phase in T Pyx, implying anejecta mass �10−5 M�. We overplot column density as a function of time forsix different sets of ejecta parameters: those assuming Mej = 10−6 M� (blue),Mej = 10−5 M� (orange), and Mej = 10−4 M� (red). Solid lines in blue,orange, and red represent ejecta with vmax = 3000 km s−1, while dashed linesare for vmax = 1900 km s−1.
(A color version of this figure is available in the online journal.)
transmitted through the ejecta. Schwarz et al. (2011) and Henzeet al. (2011) explore the time elapsed between thermonuclearrunaway and the observed turn-on of the super-soft source forlarge samples of novae. They find that super-soft turn-on timeis correlated with the Mej/vmax. Figure 4 shows the expectedtemporal evolution of the column density for shells ejectedat Day 0 with a range of masses and two possible expansionvelocities (chosen based on the Hβ line profiles of T Pyx atDays 2 and 69, respectively; Paper I). We assume that theshells have an r−2 density profile and spherical symmetry thatarise from a Hubble flow ejection with vmin/vmax = 0.2 (seePaper I for details, also Seaquist & Bode 2008). We estimatethat 5 × 1021 cm−2 is the maximum column density for whichwe could detect a super-soft component with temperature kT <50 eV (horizontal black line).
The super-soft source is definitely observed on Day 143, thefirst observation after the solar gap. A careful examination ofthe data obtained on Days 120 and 123 constrain the earliestturn-on time to Day 123, when equal numbers of photons aredetected above and below 0.5 keV, and a hint of an additionalsoft component can be seen in the spectrum. In Figure 4, wefind that a turn-on time of 123 days corresponds to an ejected ofmass of �few × 10−5 M�, assuming that the ejecta have beenexpanding since Day 0. If there is a two-month long delay in theejection of the bulk of the mass, as suggested by the followingsection, the ejecta mass implied by the turn-on time can beslightly lower, but still �10−5 M�. These mass estimates, whilelarger than traditionally assumed for T Pyx because of its shortrecurrence time (e.g., Contini & Prialnik 1997; Schaefer et al.2010), are compatible with estimates obtained from analysisof the 1966 outburst (Selvelli et al. 2008), radio light curves(Paper I), and the decrease of the binary period after the 2011outburst (Patterson et al. 2013).
The blackbody temperature associated with the super-softcomponent is much lower than in other recurrent novae, im-plying a white dwarf in T Pyx which is significantly below the
9
The Astrophysical Journal, 788:130 (13pp), 2014 June 20 Chomiuk et al.
Chandrasekhar mass. More massive white dwarfs have smallerradii and surface areas, and so have higher temperature photo-spheres once they become super-soft sources (Sala & Hernanz2005; Wolf et al. 2013). The recurrent novae RS Oph and U Scowere both observed to have high blackbody temperatures dur-ing their super-soft phases (60–90 eV; Osborne et al. 2011b;Orio et al. 2013), as was the classical nova V2491 Cyg (Pageet al. 2010). T Pyx is strikingly different, with a blackbody tem-perature of 30–50 eV, just half of what is measured in otherrecurrent novae (see also Tofflemire et al. 2013). Both the lowerpeak temperature and massive ejected shell are compatible witha nova outburst on a lower mass white dwarf (∼1 M�; Wolfet al. 2013).
The turn-off time of the super-soft source is also theoreticallypredicted to inversely scale with the white dwarf mass. The turn-off of the super-soft source refers to an abrupt decline in theblackbody luminosity, and likely marks the cessation of nuclearburning on the white dwarf surface, due to the exhaustion of thereservoir of hydrogen remaining after nova outburst. On a moremassive white dwarf, the nuclear-burning luminosity is higherand the reservoir of hydrogen is less massive, implying a shorterduration for the super-soft phase (e.g., Sala & Hernanz 2005).
We find evidence that the super-soft emission in T Pyx beganto turn off around Day 180 (Section 4.2). This inference fromthe Swift data is in agreement with the report of a very low-luminosity blackbody component in the Chandra spectrumobtained on Day 210 (Tofflemire et al. 2013). Wolf et al. (2013)predict a stable shell-burning super-soft phase for �1000 daysfollowing a nova on a 1.0 M� white dwarf; a super-soft durationof ∼200 days is more consistent with a nova on a 1.15 M� whitedwarf. The rapid super-soft turn-off time in T Pyx thereforeimplies a somewhat more massive white dwarf, potentially atodds with the late observed turn-on time and the low effectivetemperature in the super-soft phase (e.g., Henze et al. 2014).However, as we show in the next section, mass loss from T Pyxis peculiar and complex; discrepancies in white dwarf massconstraints might be resolved if a larger fraction of the hydrogenenvelope is expelled from T Pyx than theoretically predicted.
7. X-RAY, OPTICAL, AND RADIO EVIDENCE FOR ASTALLED EJECTION IN T Pyx
In Section 5.2, we found that the hard X-rays in T Pyx areconsistent with an interaction between two discrete shells: onewhich is triggered at Day 0 and expands at 1900 km s−1, andthe other which begins expanding at 3000 km s−1 on Day ∼75.This picture is also consistent with peculiarities seen at radioand optical wavelengths, as we discuss here.
The shapes of the radio and X-ray light curves are remarkablysimilar (Figure 1), which at first glance is surprising, as they arelikely emitted by fundamentally different processes and regions.Both essentially show non-detections for the first couple months,then rise steeply (Figure 1). However, the quasi-coordinatedrise is not a coincidence if the increases in both the radio andX-ray regimes are tied to the expansion of the ejecta. The radioflux rises as the optically thick thermal ejecta expand and theemitting area increases in size. The expansion of the ejecta alsoleads to a drop in the column density shielding the hot whitedwarf, revealing its super-soft X-ray emission. The hard X-rayemission is produced when fast-moving ejecta plow into slower-moving material. Based on arguments in Section 5, this materialalso appears to originate in the nova ejecta.
A detailed look at the two light curves reveals that the risesin the radio and X-ray are not perfectly synchronized. The first
detection of the main radio rise was made on Day 67, while thefirst significant detection of the main X-ray rise did not takeplace until 1.5 months later, Day 117. The lag between the hardX-ray and radio light curves cannot be explained if they share acommon source, with the radio emission originating in the sameshocked plasma as the X-ray. In addition, the radio emissionduring Days 117–164 is far too bright and optically thick, andthe temperature of the hard X-ray component is far too hot, toshare a common source in the shocked gas (see the Appendix).
In Paper I, we showed that the peculiar radio light curve canbe explained as either (1) a very cold ejection which is suddenlyheated (requiring an increase in temperature by a factor of 25in ∼19 days) or (2) a delay in the expulsion of the bulk ofthe mass by ∼60 days after the beginning of the optical rise.While both scenarios are consistent with the super-soft X-rayevolution of T Pyx, cooling and subsequent re-heating of theejecta provides no natural explanation for the presence of a late-onset hard X-ray component that appears to be consistent withshock emission. Even when the white dwarf’s photoionizingradiation can reach the outer ejecta and heat them, the radiationis too soft to result in X-rays with E > 1 keV. In contrast, thesecond scenario (a delay in ejecting the bulk of the mass fromthe binary; Figure 5) can self-consistently explain both the softand hard X-ray components, along with the radio and opticalevolution.
Our proposed multistage ejection scenario is illustrated inFigure 5. First, a shell constituting a small fraction (�10%)of the total envelope mass (shown in blue in Figure 5) ispromptly expelled at 1900 km s−1 around the time of optical rise.Meanwhile, the remaining bulk of the accreted envelope (shownin red) puffs up into a quasi-hydrostatic envelope surroundingthe binary for ∼60–70 days. This stalled, massive shell, orbitingthe central binary system as a common envelope-like structurewith radius �1014 cm, explains the bright, roughly constantplateau in the optical light curve and the early-time radio non-detections (Hachisu & Kato 2004; Paper I). It is interesting tonote that models of radio light curves imply that a low-massejection expelled on Day 0 might account for the sole radiodetection at early times (measured on Day 17 and followed bya suite of non-detections on Days 31–48; Paper I), which is alsocoincident with the very early and short-lived detection of hardX-rays.
Optical spectra reveal that T Pyx originally resembled aHe/N nova but switched to a Fe ii nova sometime betweenDay 2 and 10 (Ederoclite 2013; Williams 2013; see Williams1992 and Williams 2012 for more interpretation of such spectralclassifications). A wind with a low mass-loss rate but highvelocity (Mw ≈ 10−8 M� yr−1, vw ≈ 2000 km s−1) emanatingfrom the puffed-up envelope may sustain the observed high-velocity wings on optical emission lines during Days ∼2–60(Surina et al. 2014) while remaining optically thin and belowthe detection limits in the radio on Days 31–48.
On Day 65, the optical spectrum of T Pyx was observed totransition back to a He/N classification (Ederoclite 2013), im-plying that the bulk of the ejected mass was now being lost ina discrete shell-like event (central panel of Figure 5). Aroundthis time, the optical light curve begins to decline steeply andmonotonically; we interpret this decline as the optical photo-sphere finally receding through the ejecta (Figure 1). In addi-tion, the Hα line flux begins to systematically decrease (Surinaet al. 2014), implying a drop in the density of the envelope.It is also around Day 65 that we see the radio light curvebegin to rise, implying that the envelope is now growing in
10
The Astrophysical Journal, 788:130 (13pp), 2014 June 20 Chomiuk et al.
Figure 5. Schematic illustration of mass ejection and interaction in the 2011 outburst of T Pyx, integrating constraints from optical, radio, and X-ray data. The yellow,blue and red shells represent the large-scale remnant in T Pyx, the first, low-mass ejection, and the later, high-mass shell, respectively. The size of the arrows indicatesthe expansion velocity of each shell. The three panels show key components in the system at Day 20 (left), Day 70 (center), and Day 180 (right); see Section 7 formore details.
(A color version of this figure is available in the online journal.)
size (Paper I). Lastly, in our internal shock model for the hardX-ray emission from T Pyx, we calculated that the faster mov-ing ejection was likely expelled around Day 75 (Section 5.2;not precisely matching transitions at other wavelengths, but rea-sonably close given the uncertainties involved in our interpre-tation of the hard X-ray light curve). The agreement in timingfrom optical, radio, and X-ray tracers is remarkable; all im-ply that the bulk of the ejecta mass was not expelled from theenvirons of T Pyx until ∼2 months after the thermonuclearrunaway.
The physical cause of this stalled expansion remains unclear.Other novae have shown similar plateaus around optical maxi-mum, with the duration of the plateau widely varying betweensources, from a few to hundreds of days (e.g., Kato & Hachisu2011). However, most are not graced with rich multi-wavelengthdata sets like the community obtained for T Pyx in 2011, so theseplateaus have proved difficult to interpret. Friedjung (1992)noted that during the plateau in HR Del, the optical spectrumshowed little evidence of sustained strong mass loss as seen inother novae; it was in fact more consistent with an almost station-ary atmosphere. The author proposed that the nova outburst inthis system was initially not strong enough to eject the accretedenvelope, and instead settled into a quasi-static configurationwith little mass loss. No explanation was offered, however, forthe transition to the subsequent phase of significant mass loss.Hachisu & Kato (2004) concurred that plateaus around opticalmaximum could be interpreted as a static phase of the outburst,with an inflated but stable white dwarf photosphere formed afterthe onset of the thermonuclear runaway.
In later work, Kato & Hachisu (2011) proposed that the in-teraction of the companion star with the hydrostatic envelopecould provide an additional source of energy, empowering theoutburst to transition from a stable to a mass-losing configura-tion. Kato & Hachisu (2011) find that this mechanism should bemost efficient in very short period binaries, like T Pyx, wherethe companion becomes deeply embedded in the nova envelope.In addition, Livio et al. (1990) and Lloyd et al. (1997) find thatnovae which undergo such a common-envelope-like phase maydisplay ring-like morphologies in their ejecta, aligned with theorbital plane; Sokoloski et al. (2013) find hints of a ring structurein the Hα+[N ii] nebula surrounding T Pyx.
A different explanation for a delayed ejection from T Pyxis proposed by Williams (2012); he suggests that a significantfraction of the mass loss may have its source in the binarycompanion star, rather than the white dwarf. If the novaexplosion sweeps up or ablates material from the companionstar, some of the peculiarities of T Pyx, like its hyper-hybridspectral classification, could be explained. Detailed modelingof the interaction of the nova event with the companion star isrequired to assess the energetics, mass budget, and timescale ofthe interaction and evaluate if mass loss from the companionstar might help explain the 2011 outburst of T Pyx.
Even more speculatively, peculiarities like multiple anddelayed ejections might be explained if the nuclear-burning rateon the white dwarf surface fluctuates with time. Novae show anastounding diversity of light curves (Strope et al. 2010), someof which are difficult to explain with a single thermonuclearrunaway. Indeed, nuclear-driven X-ray bursts on neutron starssometimes display multiple thermonuclear runaways in thecourse of a single outburst (e.g., in’t Zand et al. 2003). Whilemultiple thermonuclear runaways are not theoretically predictedin a single nova outburst, they cannot be ruled out by currentobservations.
Considering all the available data in tandem, we favor adelayed ejection as the primary explanation for the multi-wavelength evolution of T Pyx, because this scenario can self-consistently explain the late and steep rise in the radio and X-raylight curves, the slow evolution of the optical light curve, andthe unusually complex optical spectral evolution of T Pyx. Thephysical mechanism driving this late-time mass ejection remainsunclear.
8. CONCLUSIONS
In our analysis of Swift and Suzaku data covering the 2011outburst of the recurrent nova T Pyx, we detect two distinctcomponents of X-ray emission: a super-soft component associ-ated with the photosphere of the nuclear-burning white dwarf,and a hard component associated with shocked thermal gas.
The super-soft X-ray component becomes detectable betweenDays 123–143, implying an ejection which is surprisinglymassive for a recurrent nova (�10−5 M�), but consistentwith other recent constraints for T Pyx (Selvelli et al. 2008;
11
The Astrophysical Journal, 788:130 (13pp), 2014 June 20 Chomiuk et al.
Patterson et al. 2013, Paper I). In addition, the temperature of thesuper-soft source is relatively cool (30–50 eV), implying that thewhite dwarf in T Pyx is significantly below the Chandrasekharmass. T Pyx therefore inhabits a poorly explored corner of novaparameter space, where its unusually high accretion rate, ratherthan an unusually massive white dwarf, drives it to have a shortnova recurrence time.
A hard X-ray component is also detected in all epochs withsufficient signal to noise for spectral analysis (Days 142–206).Hard X-rays are relatively common in novae, and are postulatedto originate in shocks internal to the nova ejecta (O’Brien et al.1994; Krautter 2008). The hard X-rays in T Pyx, however, areaccompanied by an unusually strong O viii Lyα emission line,which can only be fit if the thermal plasma has a highly super-solar abundance of oxygen. Such high oxygen abundances inthe nova ejecta require the dredge-up of significant amounts ofwhite dwarf materials during the nova event (contrary to somemodels of recurrent novae; e.g., Starrfield et al. 2012). Similarconclusions can be reached from analysis of Chandra LETGspectra, which find a factor of ∼15 overabundance of nitrogenin the ejecta, relative to solar (consistent with enrichment byCNO-processed white dwarf material; Tofflemire et al. 2013).
In addition, we note the appearance of a faint, hardX-ray component at early times with an unknown origin. Thiscomponent was only detectable by Swift/XRT in time-averagedspectra spanning Days 14–20, and its low signal to noise pre-cludes detailed spectral analysis. However, we note a singlecoincident radio detection with the VLA at 33 GHz on Day17 (Paper I). The nature of this component remains a mystery,although it may be linked to the first low-mass ejection fromT Pyx on Day 0 (Figure 5).
As measured from optical emission line profiles, the expan-sion velocity of ejecta in T Pyx increases by 50% during thefirst two months of outburst (Paper I, Surina et al. 2014); wefind that this variation, and subsequent interaction within theejecta, can naturally explain the temperature and light curve ofthe hard X-ray component. In Section 7, we present a cartoonpicture that can self-consistently explain the soft and hard X-rayevolution, the radio light curve, the optical spectral evolution,and the optical light curve. A shell of material is expelled onDay 0 at 1900 km s−1, and a second episode of mass ejectionis released on Day ∼65 at 3000 km s−1 (Figure 5). While thefirst ejection produces clearer signatures at optical wavelengths,the second ejection accounts for the bulk of the expelled mass(as implied by the small absorbing column in the hard X-raycomponent and the bright but delayed maximum in the radiolight curve). We do not yet understand the physical mechanismthat leads to the bulk of the nova mass stalling out and lingeringaround the binary for two months before finally being expelled,but T Pyx now joins a significant and growing sample of novaewhich show evidence for complex, multi-phase mass ejection(see Lynch et al. 2008; Krauss et al. 2011; Williams 2012 forother examples).
We are grateful to R. Williams, A. Ederoclite, M. Bode,R. Smith, and U. Munari for useful conversations. We thankthe Suzaku mission for the generous allocation of target-of-opportunity time to observe T Pyx. We also thank Neil Gehrelsand the Swift mission team for their support of the target-of-opportunity program for this nova. We acknowledge with thanksthe variable star observations from the AAVSO InternationalDatabase contributed by observers worldwide and used in thisresearch. This work made use of the HEASARC archive,
data supplied by the UK Swift Science Data Centre at theUniversity of Leicester, and observations obtained with theSuzaku satellite, a collaborative mission between the spaceagencies of Japan (JAXA) and the USA (NASA). The NationalRadio Astronomy Observatory is a facility of the NationalScience Foundation operated under cooperative agreement byAssociated Universities, Inc. L. Chomiuk is a Jansky Fellowof the National Radio Astronomy Observatory. J. Osborne andK. Page acknowledge the support of the UK Space Agency. J. L.Sokoloski and J. Weston acknowledge support from NSF awardAST-1211778.
Facilities: Swift, Suzaku, VLA, AAVSO
APPENDIX
PREDICTING RADIO LUMINOSITY OF THE HARDX-RAY EMITTING GAS
Here we investigate if the same thermal gas which emitshard X-rays in T Pyx can account for a significant portionof the observed radio flux. Take for example Day 156 (2011September 17), a date during the optically thick rise of the radiolight curve when both VLA radio and Swift X-ray observationswere obtained. The X-ray observations imply a volume emissionmeasure of 2.36 × 1057 cm−3 and a temperature of 1.2 keV(1.4 × 10⁷ K).
Assuming a spherical shell with radius of 1900 km s−1× 156Days = 2.6 × 1015 cm and thickness of 10% the radius, thisEMV corresponds to a number density of n = 3 × 105 cm−3.The path-length emission measure, EM = ∫
n2dl, determinesthe radio optical depth and therefore radio luminosity; here it isEM = 2 × 107 cm−6 pc. The optical depth of radio emission is:
τν = 0.08235
(EM
cm−6 pc
) (Tsh
K
)−1.35 ( ν
GHz
)−2.1(A1)
(Seaquist & Bode 2008). Therefore, the radio optical depth ofthe shocked gas is τν = 2 × 10⁻⁶ at 12.6 GHz, much lessthan unity and implying that the radio emission is completelyoptically thin. The radio flux density expected from this shockedgas is:(
Sν
mJy
)= 1.39 × 10⁸
(Tsh
K
) ( ν
GHz
)2(
Rsh
D
)2
(1 − e−τν ),
(A2)where Rsh is the radius of the shock and D is the distance tothe emitting body, both in cm. From the hard X-ray emissionmeasured on Day 156, we therefore predict a 12.6 GHz fluxdensity of 0.02 mJy. On that day, we instead measured a12.6 GHz flux density from T Pyx of 11 mJy, a factor of 550brighter than expected from the X-ray emitting shocked gas.
Similar results hold between Days 67–164; the shockedmaterial that produces the hard X-rays (or upper limits on thehard X-rays) is not sufficient to account for the radio emission.The bulk of the radio emission must be coming from anothersource. This estimate underlines the well-known result thatwarm 104 K gas is an efficient emitter at radio wavelengths,while the hot >106 K gas which efficiently emits at X-raywavelengths is usually optically thin and relatively faint in theradio.
REFERENCES
Abdo, A. A., Ackermann, M., Ajello, M., et al. 2010, Sci, 329, 817Arnaud, K. A. 1996, in ASP Conf. Ser. 101, Astronomical Data Analysis
Software and Systems V, ed. G. H. Jacoby & J. Barnes (San Francisco,CA: ASP), 17
12
The Astrophysical Journal, 788:130 (13pp), 2014 June 20 Chomiuk et al.
Balman, S. 2010, MNRAS, 404, L26Balman, S., Krautter, J., & Oegelman, H. 1998, ApJ, 499, 395Balman, S., Starrfield, S., Drake, J. J., et al. 2012, ATel, 3915, 1Cash, W. 1979, ApJ, 228, 939Chesneau, O., Meilland, A., Banerjee, D. P. K., et al. 2011, A&A, 534, L11Contini, M., & Prialnik, D. 1997, ApJ, 475, 803De Gennaro Aquino, I., Shore, S. N., Schwarz, G. J., et al. 2014, A&A,
562, A28Ederoclite, A. 2013, arXiv:1304.1305Evans, A., Gehrz, R. D., Helton, L. A., et al. 2012, MNRAS, 424, L69Evans, P. A., Beardmore, A. P., Page, K. L., et al. 2009, MNRAS, 397, 1177Foster, A. R., Ji, L., Smith, R. K., & Brickhouse, N. S. 2012, ApJ, 756, 128Friedjung, M. 1992, A&A, 262, 487Gehrz, R. D., Truran, J. W., Williams, R. E., & Starrfield, S. 1998, PASP, 110, 3Gilmozzi, R., & Selvelli, P. 2007, A&A, 461, 593Godon, P., Sion, E. M., Starrfield, S., et al. 2014, ApJL, 784, L33Hachisu, I., & Kato, M. 2004, ApJL, 612, L57Henze, M., Pietsch, W., Haberl, F., et al. 2011, A&A, 533, A52Henze, M., Pietsch, W., Haberl, F., et al. 2014, A&A, 563, A2Hill, A. B., Cheung, C. C., & Jean, P. 2013, in Proc of Recontres de Moriond:
Very High Energy Phenomena in the Universe, ed. E. Auge, J. Dumarchez,& J. Tran Thanh Van (Paris: ARISF)
Imamura, K., & Tanabe, K. 2012, PASJ, 64, L9in’t Zand, J. J. M., Strohmayer, T. E., Markwardt, C. B., & Swank, J. 2003, A&A,
409, 659Kato, M., & Hachisu, I. 2011, ApJ, 743, 157Knigge, C. 2011, in ASP Conf. Ser. 447, Evolution of Compact Binaries, ed. L.
Schmidtobreick, M. R. Schreiber, & C. Tappert (San Francisco, CA: ASP),3
Knigge, C., King, A. R., & Patterson, J. 2000, A&A, 364, L75Krauss, M. I., Chomiuk, L., Rupen, M., et al. 2011, ApJL, 739, L6Krautter, J. 2008, in Classical Novae, ed. M. F. Bode & A. Evans (2nd
Kuulkers, E., Orio, M., Osborne, J. P., et al. 2011a, ATel, 3647, 1Kuulkers, E., Page, K. L., Ness, J.-U., et al. 2011b, ATel, 3285, 1Livio, M., Shankar, A., Burkert, A., & Truran, J. W. 1990, ApJ, 356, 250Lloyd, H. M., O’Brien, T. J., & Bode, M. F. 1997, MNRAS, 284, 137Lloyd, H. M., O’Brien, T. J., Bode, M. F., et al. 1992, Natur, 356, 222Lynch, D. K., Woodward, C. E., Gehrz, R., et al. 2008, AJ, 136, 1815Montez, R., Sokoloski, J. L., & Nelson, T. 2012, ATel, 4097, 1Mukai, K., & Ishida, M. 2001, ApJ, 551, 1024Mukai, K., Orio, M., & Della Valle, M. 2008, ApJ, 677, 1248Nelson, T., Chomiuk, L., Roy, N., et al. 2014, ApJ, 785, 78Nelson, T., Donato, D., Mukai, K., Sokoloski, J., & Chomiuk, L. 2012, ApJ,
748, 43Nelson, T., Orio, M., Cassinelli, J. P., et al. 2008, ApJ, 673, 1067
Ness, J.-U., Osborne, J. P., Dobrotka, A., et al. 2011, ApJ, 733, 70Ness, J.-U., Osborne, J. P., Henze, M., et al. 2013, A&A, 559, A50O’Brien, T. J., Lloyd, H. M., & Bode, M. F. 1994, MNRAS, 271, 155Orio, M. 2012, BASI, 40, 333Orio, M., Behar, E., Gallagher, J., et al. 2013, MNRAS, 429, 1342Osborne, J. P., Beardmore, A. P., Page, K. L., et al. 2011a, ATel, 3549, 1Osborne, J. P., Page, K. L., Beardmore, A. P., et al. 2011b, ApJ, 727, 124Page, K. L., Osborne, J. P., Evans, P. A., et al. 2010, MNRAS, 401, 121Patterson, J., Oksanen, A., Monard, B., et al. 2013, arXiv:1303.0736Predehl, P., & Schmitt, J. H. M. M. 1995, A&A, 293, 889Rauch, T., Orio, M., Gonzales-Riestra, R., et al. 2010, ApJ, 717, 363Sala, G., & Hernanz, M. 2005, A&A, 439, 1061Schaefer, B. E. 2010, ApJS, 187, 275Schaefer, B. E., Landolt, A. U., Linnolt, M., et al. 2013, ApJ, 773, 55Schaefer, B. E., Pagnotta, A., & Shara, M. M. 2010, ApJ, 708, 381Schwarz, G. J., Ness, J.-U., Osborne, J. P., et al. 2011, ApJS, 197, 31Seaquist, E. R., & Bode, M. F. 2008, in Classical Novae, ed. M. F. Bode &
Selvelli, P., Cassatella, A., Gilmozzi, R., & Gonzalez-Riestra, R. 2008, A&A,492, 787
Shara, M. M., Zurek, D. R., Williams, R. E., et al. 1997, AJ, 114, 258Shore, S. N., Augusteijn, T., Ederoclite, A., & Uthas, H. 2011, A&A,
533, L8Shore, S. N., Schwarz, G. J., De Gennaro Aquino, I., et al. 2013, A&A,
549, A140Smith, R. K., & Hughes, J. P. 2010, ApJ, 718, 583Sokoloski, J. L., Crotts, A. P. S., Lawrence, S., & Uthas, H. 2013, ApJL,
770, L33Sokoloski, J. L., Luna, G. J. M., Mukai, K., & Kenyon, S. J. 2006, Natur,
442, 276Starrfield, S., Timmes, F. X., Iliadis, C., et al. 2012, BaltA, 21, 76Strope, R. J., Schaefer, B. E., & Henden, A. A. 2010, AJ, 140, 34Surina, F., Hounsell, R. A., Bode, M. F., et al. 2014, AJ, 147, 107Tatischeff, V., & Hernanz, M. 2007, ApJL, 663, L101Tofflemire, B. M., Orio, M., Page, K. L., et al. 2013, ApJ, 779, 22Uthas, H., Knigge, C., & Steeghs, D. 2010, MNRAS, 409, 237Verner, D. A., Ferland, G. J., Korista, K. T., & Yakovlev, D. G. 1996, ApJ,
465, 487Waagan, E., Linnolt, M., Bolzoni, S., et al. 2011, CBET, 2700, 1Williams, R. 2012, AJ, 144, 98Williams, R. 2013, AJ, 146, 55Williams, R. E. 1982, ApJ, 261, 170Williams, R. E. 1992, AJ, 104, 725Wilms, J., Allen, A., & McCray, R. 2000, ApJ, 542, 914Wolf, W. M., Bildsten, L., Brooks, J., & Paxton, B. 2013, ApJ, 777, 136Yaron, O., Prialnik, D., Shara, M. M., & Kovetz, A. 2005, ApJ, 623, 398