46
The 2011 Tohoku Earthquake and Tsunami Hazard Assessment Kenji Satake Earthquake Res. Inst. Univ. Tokyo [email protected]‐tokyo.ac.jp

The 2011 Tohoku Earthquake
and Tsunami Hazard Assessment
Kenji Satake
Earthquake Res. Inst. Univ. [email protected]‐tokyo.ac.jp

Outline
1. The 2011 Earthquake Source
2. The Tsunami
3. Past Tsunamis and the 2011 Source Model
4. Long‐term Forecast of Large Earthquakes
5. Tsunami Hazard Assessments at NPS

Outline
1. The 2011 Earthquake Source
2. The Tsunami
3. Past Tsunamis and the 2011 Source Model
4. Long‐term Forecast of Large Earthquakes
5. Tsunami Hazard Assessments at NPS

The largest earthquake in Japan’s historyMarch 11 Earthquake38°06.2’ N, 142° 51.6’ Edepth 24 km14 h 46 min 18.1 s (JST)M 9.0
The earthquake“Off the Pacific Coast of Tohoku Earthquake” by JMA
The disaster “The Great East Japan Earthquake Disaster”by Cabinet Office

The 2011 Tohoku Earthquake
11 March Tohoku Eq.
• Interplate earthquake due to subduction of Pacific plate at 8 cm /year or 8 m / century
• Largest size (M=9.0) in Japan’s history

GPS data and slip distribution
GSI (2010, 2011)
March 11, 20111998‐2000

Sato et al. (Science 2011)
Max observed slip: 24 m horizontal3 m vertical
Max slip on fault (estimated): > 50 m
7
Large slip revealed by seafloor observations
Repeated bathymetry sounding: ~ 50 m offsetFujiwara et al. (Science 2011) GSI (2011)
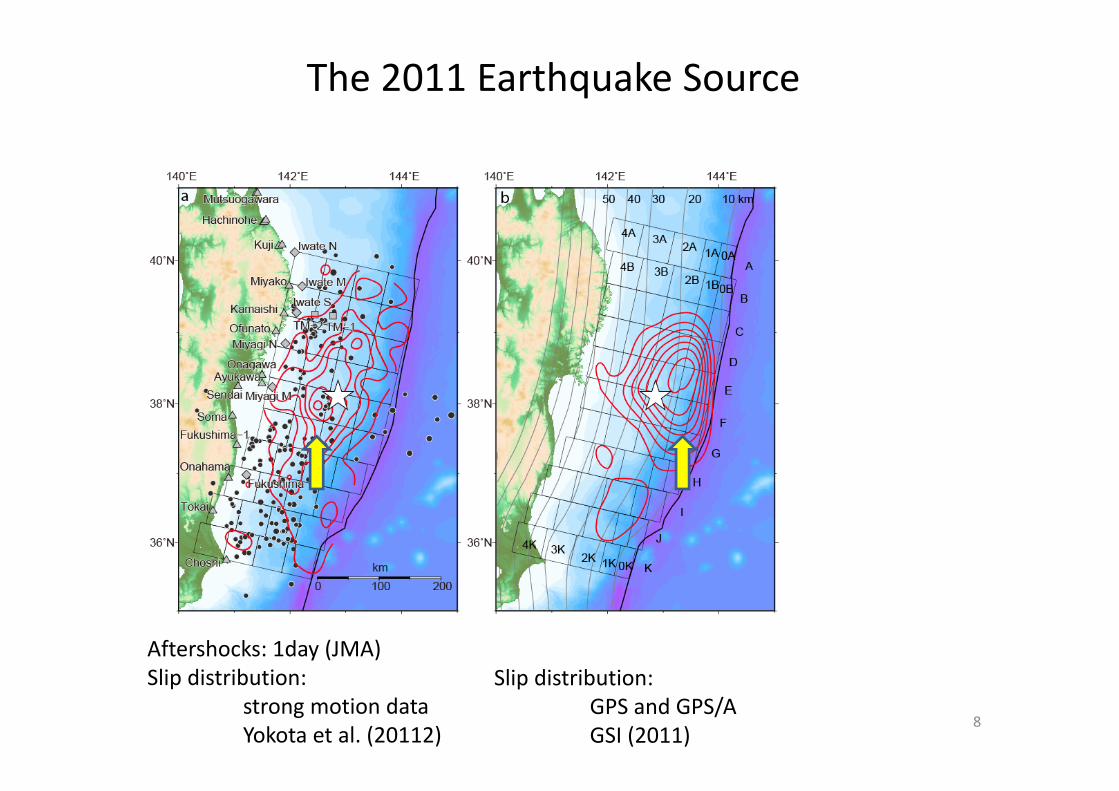
The 2011 Earthquake Source
Aftershocks: 1day (JMA)Slip distribution:
strong motion data Yokota et al. (20112)
Slip distribution: GPS and GPS/AGSI (2011)
8

Outline
1. The 2011 Earthquake Source
2. The Tsunami
3. Past Tsunamis and the 2011 Source Model
4. Long‐term Forecast of Large Earthquakes
5. Tsunami Hazard Assessments at NPS

Seafloor displacement(cross‐section)

March 11, 2011 tsunami
11
Iwate
Miyagi
Fukushima
Sendai plain
Large inundationabout 1 hour after eq.
Sanriku coast
High tsunami about 30 minutes after the earthquake

The Observed Tsunami

Outline
1. The 2011 Earthquake Source
2. The Tsunami
3. Past Tsunamis and the 2011 Source Model
4. Long‐term Forecast of Large Earthquakes
5. Tsunami Hazard Assessments at NPS

The 2011 and past Tsunami sources

The 1896 Meiji Sanriku tsunami
1896 Meiji tsunami: 22,000 casualties (more than 2011 tsunami)
M 7.2, Max tsunami height 38 mWeak shaking but large tsunami“Tsunami earthquake” Width: 50 km, slip: 6 m
Near trench axis15
Tanioka and Satake (1996)

The 1896 Meiji Sanriku tsunami
1896 Meiji tsunami: 22,000 casualties (more than 2011 tsunami)
16

Tsunami heights along Sanriku coast
1933~1896~2011
1933< 1896~2011
1933~1896 < 2011

The 869 Jogan earthquakeNihon Sandai Jitsuroku (Chronicle of Japan)A large earthquake in MutsuPanic stricken by violent tremblingsFallen houses, wide‐opened ground fissuresRoaring like thunder heard from the sea Sea rushed into castle, a few hundred milesAbout 1,000 people were killed
Tsunami deposit studiesSand layer brought by tsunamibelow volcanic ash (AD915)
distributed ~ 5 kmfrom the coast
Tsunami sand
Peat
To‐aAD 915
18Dr. Sawai, AIST

The 869 depositsPossible 869 depositsNo deposits
869 Simulation 2011 inundation
The 869 Jogan EarthquakeA fault model
Satake et al. (2008)Namegaya et al. (2010)
19

Past tsunamis
Sanriku coast• Attacked by tsunamis in 1896 (22,000 casualties) , 1933 (3,000 casualties), and 1960 (Chilean eq., 142 casualties)
• The 2011 tsunami was similar heights with 1896
Sendai Plain• Historical and geological data recorded AD 869 tsunami• The AD 869 tsunami was very similar to 2011• Tsunami hazard maps or break waters were prepared for a more frequent (99%, M~8) tsunami
20

The 2011 and past Tsunami sources

Temporal and spatial distribution of slips
22Satake, Fujii, Harada and Namegaya (2013)Bull. Seism. Soc. Am. (2011 special issue)

Deep and Shallow Subfaults
Ver 8.0 (55 subfaults)
23
TotalAverage slip 9.5 m Moment 4.21 x 10²² Nm (Mw = 9.0)

Deep Subfaults (Jogan model type)
24
“Jogan” typeAverage slip 6.4 m Moment 2.1 x 10²² Nm (Mw = 8.8)

Shallow Subfaults (Tsunami Earthquake type)
25
Tsunami earthquake typeAverage slip 18.6 m Moment 2.1 x 10²² Nm (Mw = 8.8)

Comparison with Coastal Tsunami Heights
Delayed slip Instantaneousslip
simulation
55 subfaults 26

Ver 8.0
1896 type
869 type
Deep and Shallow Subfaults
Long wavelength
Large inundation in Sendai plain
Short wavelength and large peak
High tsunami on Sanriku coast

Outline
1. The 2011 Earthquake Source
2. The Tsunami
3. Past Tsunamis and the 2011 Source Model
4. Long‐term Forecast of Large Earthquakes
5. Tsunami Hazard Assessments at NPS

Why wasn’t it forecasted?
Eastward rebound on March 11Westward motion in 1998‐2000
Coseismic slip(released strainduring earthquake)
Slip deficit(stored strain)
29GSI (2010, 2011)

Why wasn’t it forecasted?
Slip deficit(stored strain)
Yamanaka and Kikuchi (2004)
Large (M>7) earthquakes in 20th century
30
Westward motion in 1998‐2000
GSI (2010, 2011)

Earthquake Recurrence and Hazard Rate
Interval between eq.Earthquake Occurrence
periodic
Random (Poisson process)
Future (e.g., in next 30 years) probability can be computedfrom past recurrence data

Sanriku long‐term forecast
+3m, 24 m
+0.9 m, 5 m
‐0.7m, 15 m
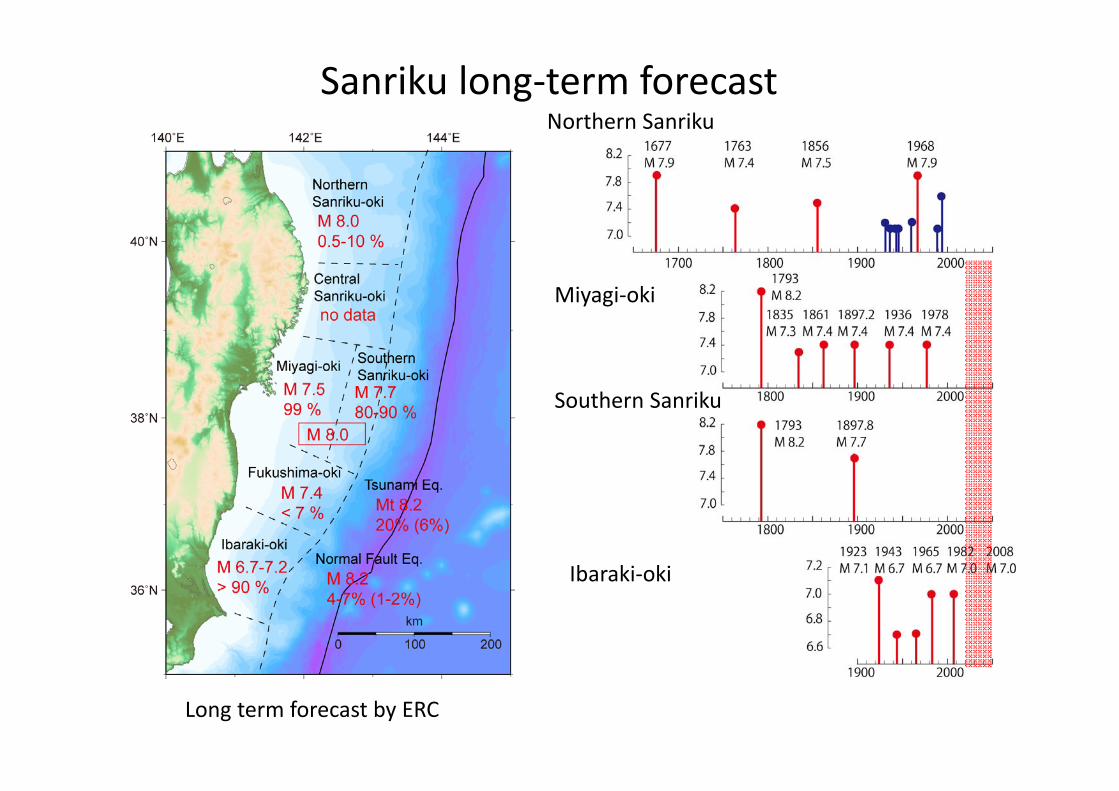
Long term forecast by ERC
Northern Sanriku
Miyagi‐oki
Southern Sanriku
Ibaraki‐oki
Sanriku long‐term forecast
+3m, 24 m
+0.9 m, 5 m
‐0.7m, 15 m
Long term forecast by ERC
Northern Sanriku
Miyagi‐oki
Southern Sanriku
Ibaraki‐oki

+3m, 24 m
+0.9 m, 5 m
‐0.7m, 15 m
Long term forecast by ERC
Long‐term forecast of earthquakes
Iwate
Miyagi
Fuku‐shima
The 2011 type earthquake (Mw 8.4 – 9.0)4 events in last 2500 yrsonce in 600 yrs
Along Japan trenchTsunami earthquakes (Mt 8.6 – 9.0) 4 events in last 400 yrs(1611, 1677, 1896 and 2011)once in 103 yrs somewhere along Trench
Outer‐rise normal fault eq.1 event in 400 yrs (1933)once in 400 – 750 yrs somewhere
Revision (update) on November 2011

Long‐term forecast by Japanese government
Region TypeAs of January 1, 2011 As of January 1, 2012M Probability M Probability
Northern Sanriku
Interplate 8 0.5‐10 % 8 (Mt 8.2) 0.7‐10 %
Others 7.1‐7.6 90% 7.1‐7.6 90%Central Sanriku ‐ ‐ ‐ ‐
Miyagi‐okiInterplate 7.5 99% 7.4 unknownOthers 7.0‐7.3 60%
Southern Sanriku
Interplate 7.7 80‐90 % 7.9 0%
Others 7.2‐7.6 50%2011 Tohoku
typenot estimated Mw 8.4‐9.0 0%
Fukushima‐oki Interplate 7.4 (swarm) < 7 % 7.4 (swarm) 10%
Ibaraki‐okiInterplate 6.7‐7.2 > 90 % 6.7‐7.2 > 90%Others 6.9‐7.6 70%
Japan Trench "Tsunami eq." Mt 8.2 20% Mt 8.6‐9.0 30%Japan Trench Normal‐fault 8.2 4‐7 % 8.2 (Mt 8.3) 4‐7 %
Earthquake Research Committee (2009, 2011)

Supercycle of earthquakes
Seismologists assumed earthquake cycle (~35 years) from past records of two centuries and made forecast (99% in 30 years), but there seems to be a supercycle (~700 years) on top of it.
36

Long‐term forecast of earthquakes
Long‐term forecast • based on earthquake history in last few centuries• 99 % probability in next 30 years but smaller size (M~8)
March 11 earthquake was much larger (M=9.0)• GPS data suggested such slip deficit• Earthquake supercycle may exist
37

Outline
1. The 2011 Earthquake Source
2. The Tsunami
3. Past Tsunamis and the 2011 Source Model
4. Long‐term Forecast of Large Earthquakes
5. Tsunami Hazard Assessments at NPS

Tsunami Assessment Method for Nuclear Power Plants in Japan (2002)
• Japan Society of Civil Engineers (2002)• Used as a standard guide for industry• English version published in 2006• Annex II in IAEA Safety Standards SSG‐18 (2011)
• Deterministic Method– The maximum and minimum water levels – Parametric study of fault parameters

Deterministic MethodParameter study by changing parameters
of the Standard Fault Modelin rational ranges
Fault Models for Scenario Earthquakes
Fault Model for the Design Tsunami
Standard Fault Model
LandTarget site
Sea
The design tsunami is the highest among scenario tsunamis at
the target site.
Direction of coastline
Target Site
The Design Tsunami
Scenario Tsunamis
Scenario Tsunamis
Tsun
ami height
Records of Historical tsunamis
JSCE (2002)
Standard fault model
Design tsunami for NPSDesign water levels
Fault model(s) based on historical tsunami
Parametric study andScenario tsunamis

Fukushima‐Daiichi NPS (TEPCO)
Fukushima‐1
Design height 6.1 m based on 1938 Shioya‐oki earthquakes (Mw 7.9)
Tsunami earthquakeSimilar to 1869 off Fukushimaestimated tsunami heights: 8.4 ‐15.7 m
The 869 Jogan‐type earthquakeestimated tsunami heights: 7.8 ‐ 9.2 m
However, probabilities of tsunami earthquakes and Jogan‐type earthquakes were considered to be low
Data source: TEPCO (2012)

Tsunami Damage at NPS
Onagawadesign tsunami height 13.6 msite level 14.8 m
Fukushima‐1design tsunami height 6.1 msite level 10‐13 m
Fukushima‐2design height 5.2 msite level 12 m
Tokaidesign height 4.9 msite level 8.0 m
13 m
16 m
15 m
5 m
2011 tsunami
Data source: IAEA (2011))

Tsunami Source ModelsTsunami sourcesFault models
Magnitude rangeProbability of earthquakesBranches for logic trees
Numerical Models for tsunami generation and propagationSeafloor deformation modelTsunami propagation modelBranches for logic trees
Logic trees and numerical simulation
Tsunami hazard curves
Tsunami heights for fragility curve
Probabilistic Tsunami Hazard Assessment
Atomic Energy Society of Japan 2011Implementation Standard Concerning the Tsunami Probabilistic Risk Assessment of
Nuclear Power Plants
Japan Society of Civil Engineers 2011
Annnaka et al. (2007, Pagepoh)Sakai et al. (2006, ICONE14)

Tsunami Source ModelsTsunami sourcesFault models
Magnitude rangeProbability of earthquakesBranches for logic trees
Numerical Models for tsunami generation and propagationSeafloor deformation modelTsunami propagation modelBranches for logic trees
Logic trees and numerical simulation
Tsunami hazard curves
Tsunami heights for fragility curve
Probabilistic Tsunami Hazard Assessment
Annaka et al. (2007)

Probabilistic Method
Aleatory (random) variabilityHazard curves
1896, 1611Tsunami Eq.
1677Tsunami Eq.
No Tsunami eq.
Epistemic (modeling) uncertainty Logic tree
Only at specific (past) locations
Anywhere along trench axis
年間超過確率
Tsunami Earthquakes
Annaka et al. (2007)

Conclusions
1. 2011 Tohoku earthquake was the largest (M~9) in Japan’s history2. Recently‐installed marine geophysical instruments revealed huge slip
near trench axis and recorded tsunami propagation toward coast3. Sanriku coast and Sendai plain experienced similar tsunamis in AD
869 (Jogan eq.) and in AD1869 (Sanriku tsunami eq.)4. The 2011 tsunami source was a combination of the Jogan‐type and
tsunami earthquake type 5. Long‐term forecast based on historical data estimated 99 %
probability but M~8 in Miygai‐oki6. The tsunami hazard assessments at NPS were made by a
deterministic method based on historical tsunamis. The probabilistic tsunami hazard assessment including the epistemic uncertainty was proposed but not implemented


