18
The 2012 Aiken County Exit Poll: Overview of Key Findings Performed by USCA Research Methods class Professor Bob Botsch, Director Erin McCulloch, Research Assistant
| Date post: | 24-Dec-2015 |
| Category: |
Documents |
| Upload: | roderick-dawson |
| View: | 214 times |
| Download: | 1 times |

The 2012 Aiken County Exit Poll:Overview of Key Findings
Performed by USCA Research Methods classProfessor Bob Botsch, Director
Erin McCulloch, Research Assistant

Gimme Shelter! I built that! Beech Island Community Center

Methodology
• N = 753• Sample design:
– 10 representative precincts– Stratified by gender, region of county. Precinct size– Systematic sampling– Two time clusters
• Response rate: 70%• Sample error: +/- 4%• Successfully matched presidential vote
– Romney: actual 63%; sample 60%– Obama: actual 36%; sample 37%

2012 Vote by Party: an exercise in party loyalty—GOP advantage: 51%/33%
Vote StrongDem(20%)
ModDem
(10%)
LeanDem (3%)
Indep
(16%)
LeanRep
(7%)
Mod Rep
(18%)
StrongRep
(26%)
Obama(37%)
97% 96% 85% 44% 2% 1% 0%
Rmney(60%)
4% 5% 15% 56% 98% 99% 100%
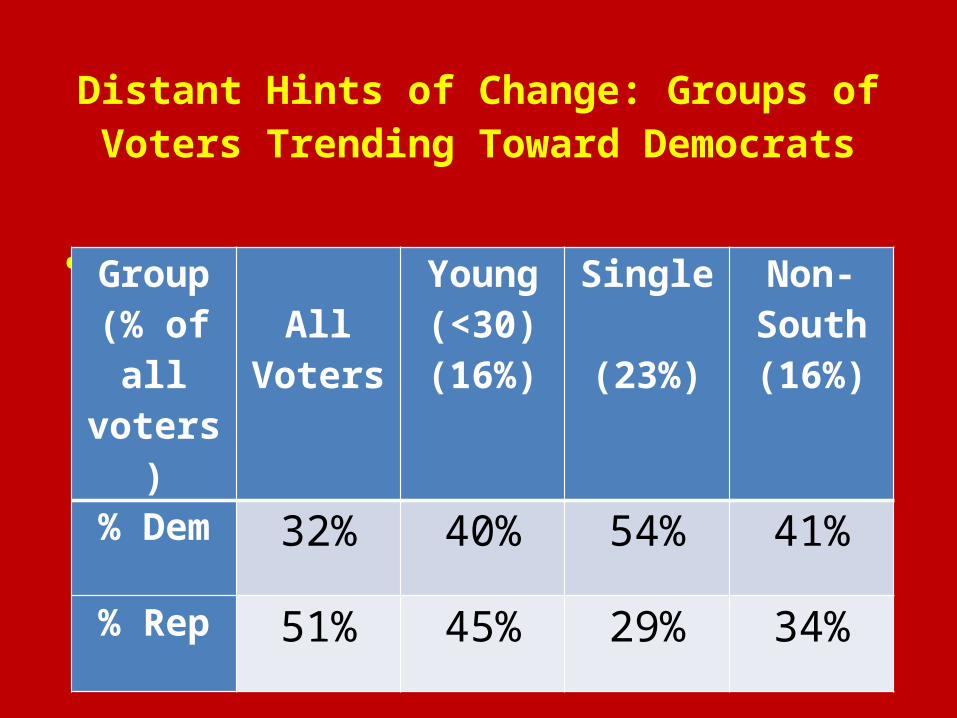
Distant Hints of Change: Groups of Voters Trending Toward Democrats
• Group(% of all voters)
All VotersYoung (<30) (16%)
Single
(23%)
Non-South(16%)
% Dem 32% 40% 54% 41%
% Rep 51% 45% 29% 34%

How These Groups are Different
•
Group All Voters Young (<30) Single Non-South
Obama is Muslim
32% 27% 21% 16%
Confederate Flag--Keep Up
50% 39% 29% 18%
Blacks too powerful
28% 20% 20% 14%
Hispanics too powerful
21% 13% 13% 12%
Gays too powerful
31% 18% 18% 24%
Atheists too powerful
29% 18% 19% 19%
Oppose Gay marriage
49% 32% 28% 36%

Tea Party Suppt: Drop from 2010 (43% to 30%) & Generally to the Far Right
Area/Issue Democrats Independt Non TP Rep’s TP Rep’s
white 37% 74% 95% 98%
conservative 9% 35% 80% 92%
moderate 21% 38% 15% 4%
Mean age 46 yrs 49 yrs 48 yrs 53 yrs
Family Income
app $36,000
app $46,000
app $57,000
app $65,000
Married 47% 62% 67% 81%
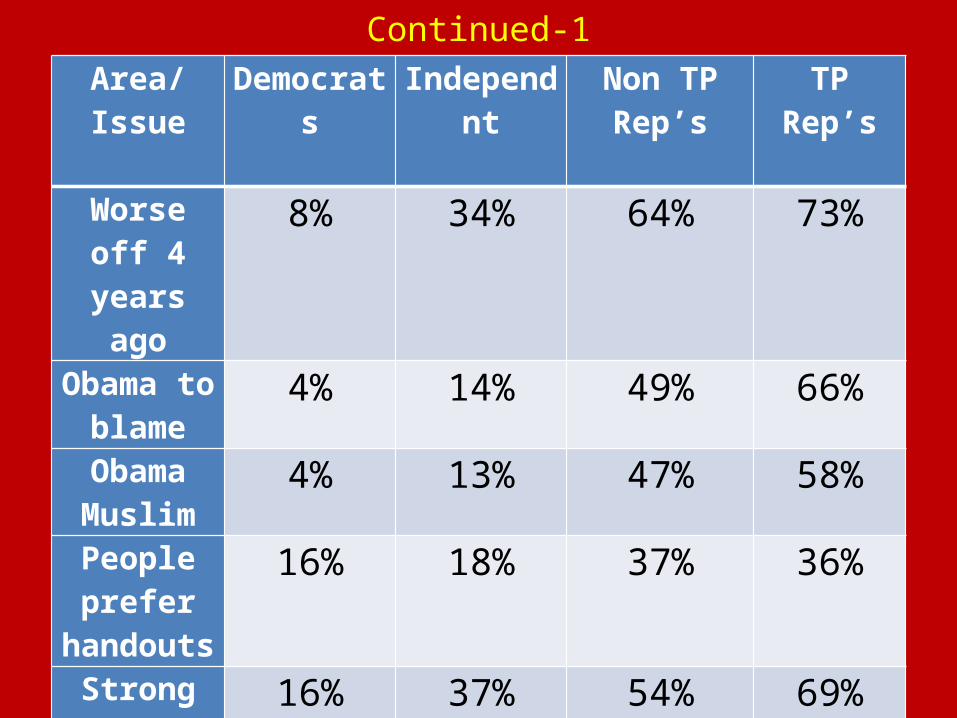
Continued-1Area/Issue Democrats Independnt Non TP Rep’s TP Rep’s
Worse off 4 years ago
8% 34% 64% 73%
Obama to blame
4% 14% 49% 66%
Obama Muslim
4% 13% 47% 58%
People prefer
handouts
16% 18% 37% 36%
Strong over Helpful leaders
16% 37% 54% 69%
Want leadrs to
compromse
79% 92% 77% 73%

Continued-2Area/Issue Democrats Independnt Non TP Rep’s TP Rep’s
Abortion: Pro-choice
69% 61% 40% 23%
Abortion: Pro-life
8% 9% 16% 19%
Cut programs to reduc defct
14% 43% 62% 80%
Health care by free mkt
4% 27% 33% 62%
Insurance cover birth control
70% 54% 36% 25%
Ext ALL tax cuts 21% 28% 34% 64%
Preserve Soc Security
85% 88% 86% 80%

Continued-3Area/Issue Democrats Independnt Non TP Rep’s TP Rep’s
Keep Confed Flag flying
10% 33% 54% 66%
Oppose Gay Marriage
22% 28% 66% 75%
Gays too powerful
17% 15% 43% 42%
Atheists too powerful
18% 12% 34% 41%
Blacks too powerful
9% 19% 39% 40%
Hispanics too
powerful
11% 13% 25% 26%
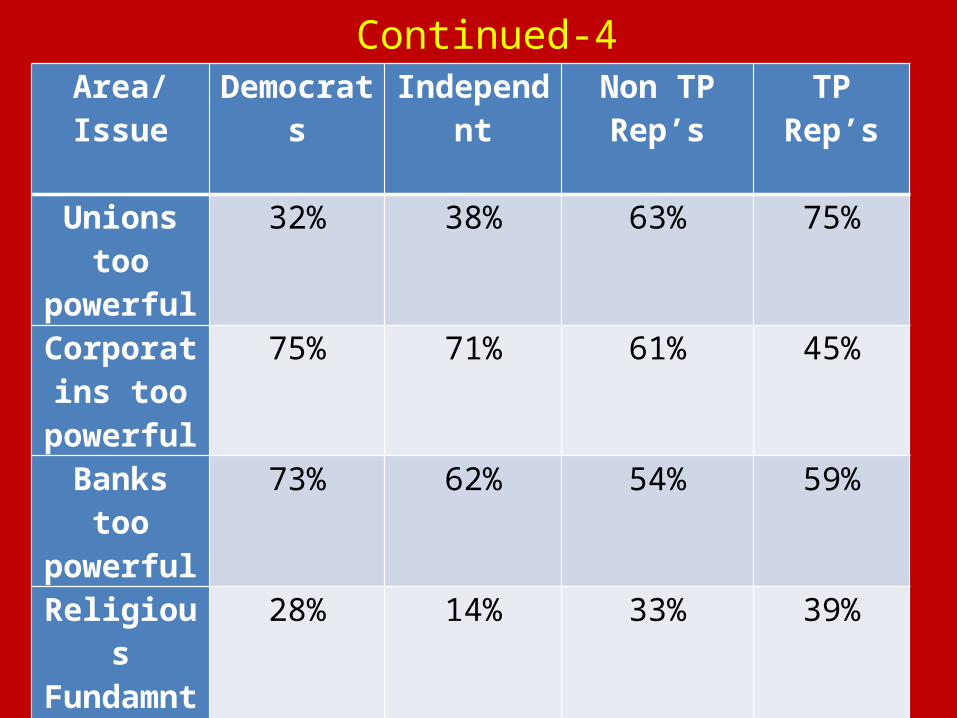
Continued-4Area/Issue Democrats Independnt Non TP Rep’s TP Rep’s
Unions too powerful
32% 38% 63% 75%
Corporatins too
powerful
75% 71% 61% 45%
Banks too powerful
73% 62% 54% 59%
Religious Fundamntst
28% 14% 33% 39%
Rel extrmly imprtant in vote choice
21% 11% 29% 38%
Nat. South self-identity
60% 59% 73% 70%
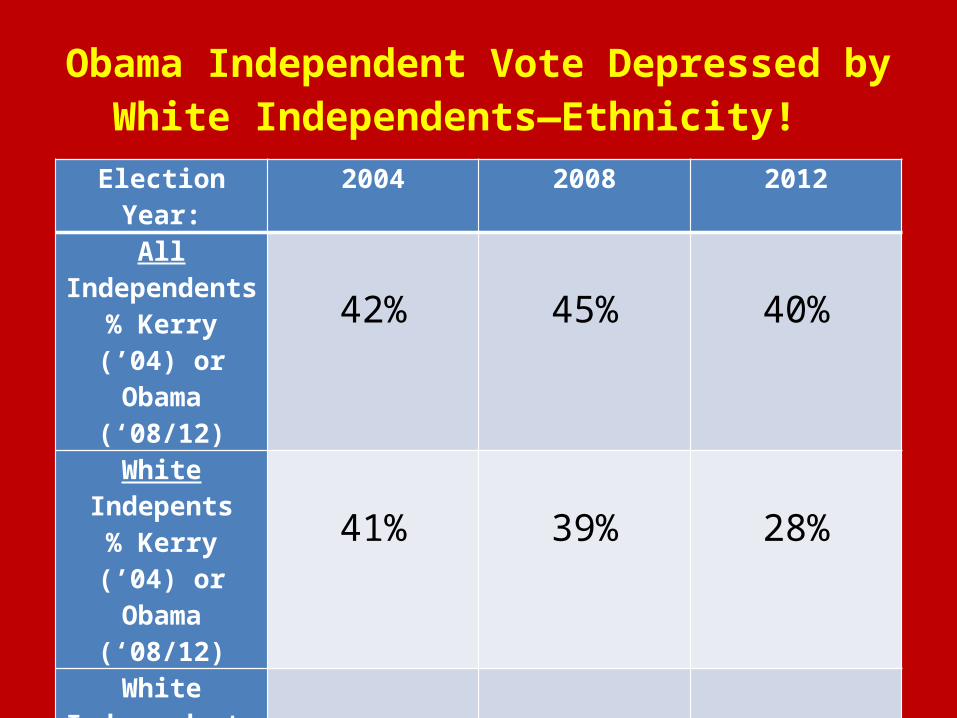
Obama Independent Vote Depressed by White Independents—Ethnicity!
Election Year: 2004 2008 2012All Independents% Kerry (’04) or Obama (‘08/12)
42%
45%
40%
White Indepents% Kerry (’04) or Obama (‘08/12)
41%
39%
28%
White Independents
% felt Blacks too much power
Not asked
15%
19%
White Independents
% think Obama is Muslim
Not asked
16%
27%

“Makers and Takers” as Seen Through Partisan Lenses
Opinion: Republicans Democrats
People want to Work
31% 52%
People Prefer Govt Handouts
37% 17%
Both play an equal role
30% 26%

Seeing People as “Takers” Increases Romney Vote
Voting Choice
People Want to
Work
Equal Role
People Prefer Govt Handouts
Obama 52% 36% 19%
Romney 48% 64% 81%

Ethnic Antipathy Score (Blacks too much power; Muslim; Conf Flag—4 pt scale) Predicts Vote Among Whites
Eth-Ant Score
(%)
0
(28%)
1
(18%)
2
(23%)
3
(31%)
Obama 73% 32% 3% 0%
Romney 27% 68% 97% 100%

Dramatic Increase in White Voter Ethnic-Antipathy Scores since 2008
Eth-Ant Score:
0 1 2 3
2008 % 33% 40% 21% 6%
2012 % 28% 18% 23% 31%
Change -5 % pts -22% pts +2% pts +25% pts

The Gender/Marriage Gaps in Aiken County and the Nation
Group Aik% (Nat %) Obama
Aik % (Nat %) Romney
Diff: Ob – RmAik (Nat)
total voteall voters
37% (51%) 60% (48%) -23% (+3%)
males 36% (45%) 60% (52%) -24% (-7%)
females 38% (55%) 59% (44%) -21% (+11%)
married 28% (42%) 70% (56%) -42% (-14%)
single 61% (62%) 33% (35%) +28% (+27%)
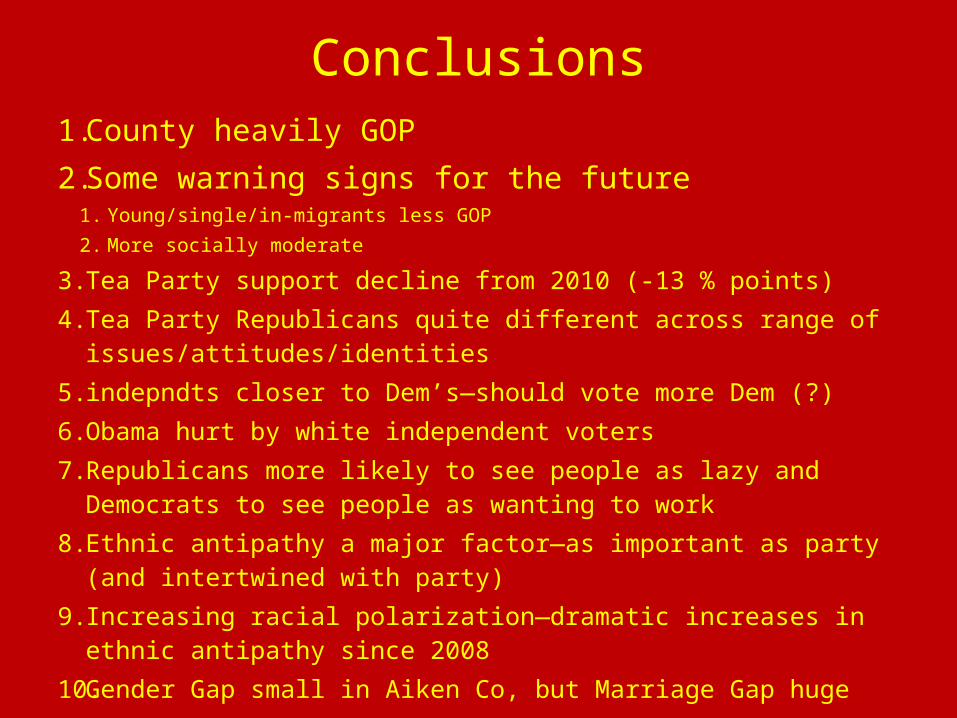
Conclusions1. County heavily GOP 2. Some warning signs for the future
1. Young/single/in-migrants less GOP2. More socially moderate
3. Tea Party support decline from 2010 (-13 % points)4. Tea Party Republicans quite different across range of
issues/attitudes/identities5. indepndts closer to Dem’s—should vote more Dem (?)6. Obama hurt by white independent voters7. Republicans more likely to see people as lazy and Democrats to see
people as wanting to work8. Ethnic antipathy a major factor—as important as party (and
intertwined with party)9. Increasing racial polarization—dramatic increases in ethnic
antipathy since 200810. Gender Gap small in Aiken Co, but Marriage Gap huge


