No. 18-1 The 2012 Diary of Consumer Payment Choice Claire Greene, Scott Schuh, and Joanna Stavins Abstract: This paper describes the results, content, and methodology of the 2012 Diary of Consumer Payment Choice (DCPC), the first edition of a survey that measures payment behavior through the daily recording of U.S. consumers’ spending by type of payment instrument. A diary makes it possible to collect detailed information on individual payments, including dollar amount, device (if any) used to make the payment (computer, mobile phone, etc.), and payee type (business, person, government). This edition of the DCPC included about 2,500 participants and was conducted in October 2012. During that month, U.S. consumers on average made about two payments per day. For the month, they paid mostly with cash (40 percent of payments) and debit cards (24 percent), followed by credit cards (17 percent). For recurring bill payments, consumers most commonly used electronic payments and checks. Like other payment-value data, the DCPC data show correlations between the choice of payment instrument and the dollar value of expenditure. For example, consumers tend to use cash more often than other instruments for small-value payments. The results of subsequent editions of the DCPC are reported in separate papers. Keywords: cash, checks, checking accounts, debit cards, credit cards, prepaid cards, electronic payments, payment preferences, Diary of Consumer Payment Choice JEL Classifications: D12, D14, E42 When this report was written, Claire Greene, Scott Schuh, and Joanna Stavins were members of the Consumer Payments Research Center in the Research Department of the Federal Reserve Bank of Boston. Claire Greene is now a payments risk expert in the Retail Payments Risk Forum at the Federal Reserve Bank of Atlanta. Scott Schuh, formerly the director of the Center and a senior economists and policy advisor at the Boston Fed, is an associate professor in the Department of Economics at West Virginia University. Joanna Stavins is a senior economist and policy advisor at the Boston Fed. Their email addresses are [email protected], [email protected], and [email protected], respectively. This report, which may be revised, is available on the website of the Federal Reserve Bank of Boston at http:// www.bostonfed.org/economic/rdr/index.htm. Acknowledgments appear on the first page of this report. The primary authors are responsible for any errors. The views expressed in this paper are those of the authors and do not necessarily represent the views of the Federal Reserve Bank of Boston or the Federal Reserve System. This version: January 17, 2018
Transcript
No. 18-1The 2012 Diary of Consumer Payment Choice
Claire Greene, Scott Schuh, and Joanna Stavins
Abstract: This paper describes the results, content, and methodology of the 2012 Diary of
Consumer Payment Choice (DCPC), the first edition of a survey that measures payment behavior
through the daily recording of U.S. consumers’ spending by type of payment instrument. A diary
makes it possible to collect detailed information on individual payments, including dollar
amount, device (if any) used to make the payment (computer, mobile phone, etc.), and payee type
(business, person, government). This edition of the DCPC included about 2,500 participants and
was conducted in October 2012. During that month, U.S. consumers on average made about two
payments per day. For the month, they paid mostly with cash (40 percent of payments) and debit
cards (24 percent), followed by credit cards (17 percent). For recurring bill payments, consumers
most commonly used electronic payments and checks. Like other payment-value data, the DCPC
data show correlations between the choice of payment instrument and the dollar value of
expenditure. For example, consumers tend to use cash more often than other instruments for
small-value payments. The results of subsequent editions of the DCPC are reported in separate
payments, payment preferences, Diary of Consumer Payment Choice
JEL Classifications: D12, D14, E42
When this report was written, Claire Greene, Scott Schuh, and Joanna Stavins were members of the Consumer Payments Research Center in the Research Department of the Federal Reserve Bank of Boston. Claire Greene is now a payments risk expert in the Retail Payments Risk Forum at the Federal Reserve Bank of Atlanta. Scott Schuh, formerly the director of the Center and a senior economists and policy advisor at the Boston Fed, is an associate professor in the Department of Economics at West Virginia University. Joanna Stavins is a senior economist and policy advisor at the Boston Fed. Their email addresses are [email protected], [email protected], and [email protected], respectively.
This report, which may be revised, is available on the website of the Federal Reserve Bank of Boston at http://www.bostonfed.org/economic/rdr/index.htm.
Acknowledgments appear on the first page of this report. The primary authors are responsible for any errors.
The views expressed in this paper are those of the authors and do not necessarily represent the views of the Federal Reserve Bank of Boston or the Federal Reserve System.
banking, mobile payments) that is altering the way households, businesses, and governments
make transactions. Generally, this transformation has been occurring with only minimal
documentation in the form of publicly available data on payment choices, especially those of
consumers who are among the ultimate end users of the payment system. This deficiency of
information motivates the measurement and study of consumer payment choice. The 2012 Diary
of Consumer Payment Choice (DCPC) was the first official payment diary conducted by the
Federal Reserve Bank of Boston. It was implemented, in October 2012, to gain an in-depth
understanding of the cash and noncash payment behavior of U.S. consumers.
This paper includes the official tables and reports the main results from the 2012 DCPC.
We find that by volume (that is, number of payments), U.S. consumers use cash, debit cards, and
credit cards for the bulk of their payments. The results also show that the dollar-value shares of
consumer payments differ markedly from the volume shares, because consumers’ choice of
payment instrument is correlated with the dollar value of the payment. In particular, consumers
on average used cash more often than other instruments for small-value payments, so the value
share (12.2 percent) of cash payments was much smaller than the volume share (40.2 percent).
Payment diaries in other countries and U.S. merchant data sources have previously shown similar
results regarding cash payments.1
Official DCPC Tables and Data
This report contains 16 tables with detailed estimates of consumers’ payment choices,
estimates of consumer activity related to cash management, and a rich set of consumer and
household demographic characteristics. 2 There are five types of tables:
1 See Klee (2008) and Bagnall et al. (2016) for evidence from payment diaries in other industrial countries;
see Cohen and Rysman (2013), and Wang and Wolman (2016) for other U.S. evidence. 2 The official definitions of survey concepts are found in Schuh and Stavins (2014) Definition Tables 1–7.
6
1. Total number and value of payments per consumer for October 2012: payments by type of
instrument, type of consumer expenditure, type of consumer expenditure and
payment instrument, and dollar value. [DCPC Tables 1–4]
2. Total number and value of purchases and person-to-person (P2P) payments per consumer for
October 2012 (hereafter called “nonbill payments”): purchases by instrument type,
consumer expenditure type, and type of device used. [DCPC Tables 5–7]
3. Total number and value of bill payments per consumer for October 2012: bill payments by
instrument type, consumer expenditure type, and location. [DCPC Tables 8–10]
4. Consumer cash management for October 2012: holdings by denomination, deposits and
withdrawals by location, withdrawals by source of funds, and shares of consumers
managing their cash. [DCPC Tables 11–15]
5. Consumer Characteristics: information about consumer demographic characteristics
and household income. [DCPC Table 16]
All DCPC data are available free of charge to the public, along with complete technical
documentation.3 The 2012 DCPC public-use microdata set contains the consumer-level DCPC
responses to all of the survey questions, including those used to create the official tables. A
complete list of variables in the 2012 DCPC datasets can be obtained from the questionnaire and
Technical Appendix, both posted online.4 All DCPC data users are strongly encouraged to read
the Technical Appendix (Angrisani, Foster, and Hitczenko 2017) for more information on the
data. For more information about the measurement approach and content of the DCPC, see
Greene, O’Brien, and Schuh (2017), which summarizes differences in survey methodology
between the 2012 DCPC and its second edition in 2015. The DCPC estimates reported here may
be revised in the future as a result of additional process improvement and insights from new
data. Rounding may have produced small discrepancies in the estimates throughout the paper.
3 See http://www.bostonfed.org/economic/cprc/data-resources.htm. 4 To obtain the 2012 DCPC dataset and questionnaire, see https://www.bostonfed.org/publications/diary-
The remainder of this paper is organized as follows. First, we provide context and
motivation for the DCPC, and then we report data on consumer payments and cash management
for the month of October 2012. Next, we briefly compare the 2012 DCPC results to the 2012 Survey
of Consumer Payment (SCPC) and provide a nontechnical description of the content and survey
methodology of the DCPC. (A corresponding technical appendix is available in Angrisani, Foster,
and Hitczenko [2017].) Before concluding, we describe the main concepts and definitions of the
DCPC and summarize the changes made since 2012. The official tables follow the conclusion.
Motivation for a Consumer Diary
In 2010, the Boston Fed teamed with the Federal Reserve Banks of Richmond and San
Francisco to develop and field a Diary of Consumer Payment Choice. This U.S. effort joined an
international movement by central banks and researchers to develop consumer payment diaries;
see Bagnall et al. (2016) for an inter-country comparison of consumer payment choices in
Australia, Austria, Canada, France, Germany, the Netherlands, and the United States (using
preliminary 2012 DCPC results for the U.S. data).5 The primary motivation for the DCPC was the
belief that daily recording of payment activity would produce more accurate results than those
from recall-based surveys such as the SCPC. The DCPC asks respondents to record every
payment they make each day; the SCPC asks respondents to recall from memory how many
payments they typically make during a longer period of time (a week, month, or year). Therefore,
the DCPC can be used to benchmark and evaluate the effectiveness of the SCPC, which the Boston
Fed has administered annually since 2008. 6
A second important motivation for developing and implementing the DCPC was to obtain
dollar values of consumer payments, which are not collected in the SCPC. Dollar values are
important for understanding payment behavior, because the choice of payment instrument is
5 The International Association of Currency Affairs (IACA) also helped facilitate this movement by bringing
the parties together in an environment conducive to voluntary collaboration and mutual development. In
particular, Adrian Baxter, Eugenie Foster, and Rick Haycock were instrumental in encouraging and
facilitating collaboration among central bank researchers who were developing consumer surveys and
diaries of payment choice. 6 The 2012 SCPC and DCPC are compared below.
8
correlated with the dollar amount of payments, as Klee (2008) and Cohen and Rysman (2013)
found from examining grocery store scanner data. In addition, the DCPC was designed to enrich
our understanding of consumer cash usage—which is particularly important for the Cash
Product Office of the San Francisco Fed—because there is a lack of data on cash usage by U.S.
consumers. To our knowledge, the only publicly available data on consumer-level cash behavior
came from the Survey of Currency and Transaction Account Usage (SCTAU), conducted by the
Board of Governors of the Federal Reserve System in 1984 and 1986, and the SCPC, which, as
noted, launched in 2008.7 The DCPC adds further details about consumers’ use of cash by
obtaining data on the types of cash expenditures, details of cash management, and information
about cash holdings and use of currency denominations. For a further discussion of U.S. measures
of cash and noncash payments, see Greene, Schuh, and Stavins (2016), in particular Figures 1 and
18.
Total Number and Value of Payments
U.S. consumers on average made 59 payments in October 2012, or almost two per day.
The average total dollar value of payments per consumer for the month was $4,043, for an average
per-payment value of $69. These estimates are based on DCPC respondents’ daily recording of
their transactions during a three-day period. The daily values were converted to monthly values
using appropriate weights.8
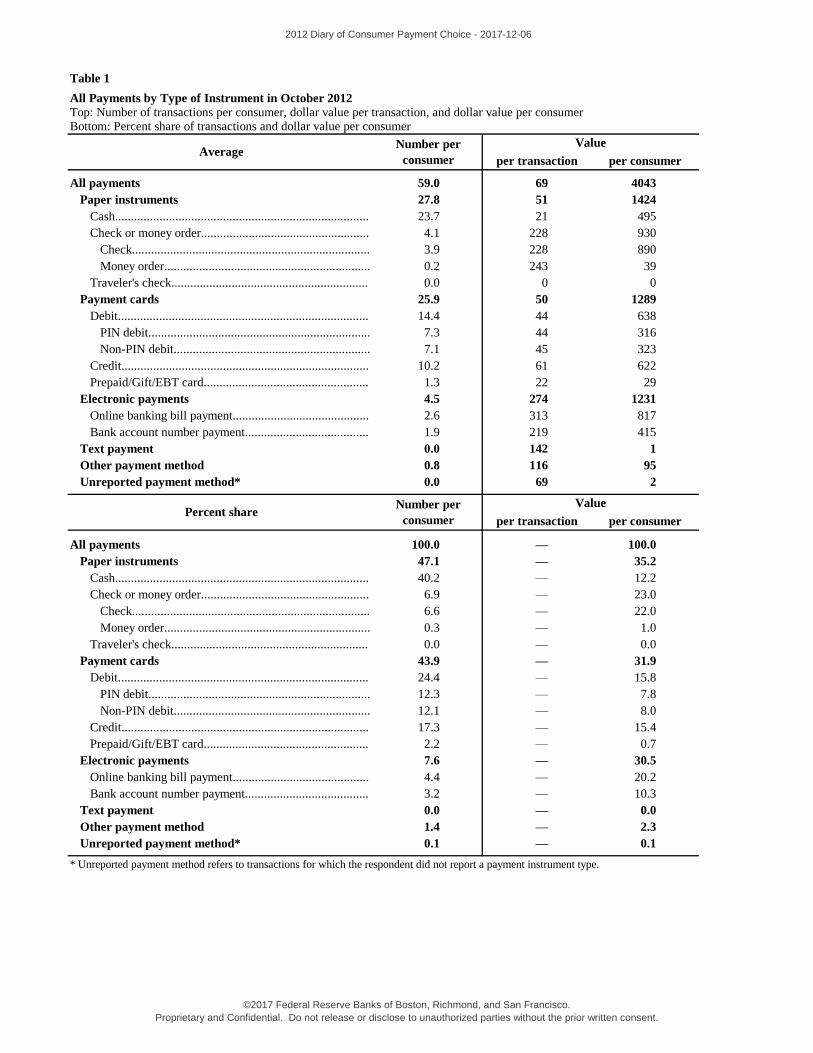
Number Shares by Payment Instrument
The most commonly used payment instrument was cash, followed by debit and credit
cards. Consumers on average made 23.7 cash payments (40.2 percent of total payments), 14.4
debit card payments (24.4 percent), and 10.2 credit card payments (17.3 percent) in October 2012
(DCPC Table 1). The use of paper instruments—cash, check, and money order—accounted for
nearly half of all payments (47.1 percent), with payment-cards use close behind (43.9 percent of
all payments). Electronic payments—online banking bill payments (OBBP) and bank account
7 See Avery et al. (1986 and 1987) for more details on the SCTAU. 8 See Angrisani, Foster, and Hitczenko (2017) for details on how the weights were constructed and applied.
9
number payments (BANP)—constituted only 7.6 percent of all payments. The top panel of Figure
1 shows the share of each payment instrument in terms of the number of transactions. Over the
three-day diary period, cash was used by more consumers than other payment instruments: 72.7
percent of consumers used cash, and debit cards were next, with 45.2 percent of consumers using
them for payments.
Source: 2012 DCPC, Federal Reserve Bank of Boston.
Figure 1: Payment instrument use, shares by number and value
Value Shares by Payment Instrument
The DCPC also collects data on the dollar value of each transaction. Unlike the number
shares, the value shares were approximately evenly distributed across paper, cards, and
electronic payments (DCPC Table 1). The bottom panel of Figure 1 plots the shares of the dollar
value of payments by payment instrument. Cash payments account for 40.2 percent of the
number of payments but only 12.2 percent of the total dollar value of consumer payments. In
contrast with cash, check and electronic payments tended to be used for greater-value payments
and therefore had substantially greater shares by value than by volume. The share of check by
10
value was 22 percent, and the shares of OBBP and BANP were 20.2 and 10.3, respectively. The
value shares of debit and credit cards were less than their respective volume shares, at 15.8
percent and 15.4 percent, respectively.
Like previous studies, the 2012 DCPC shows that consumer choices of payment
instrument were correlated with the dollar values of their payments.9 DCPC Table 4 shows, for
example, that two-thirds of payments for less than $10 were made with cash.
Average Value of Payment by Instrument
As noted above, consumer choices of payment instrument are correlated with the dollar
value of payments. Figure 2 shows the average value per payment by payment instrument, which
varied substantially across payment instruments. Cash had the lowest average value at $21 per
payment, closely followed by prepaid cards at $22 per payment. The average debit and credit
card payments were $44 and $61, respectively. OBBP had the highest average payment value:
$313.
9 These studies include Bagnall et al. (2016), Cohen and Rysman (2013), Klee (2008), and Bounie and
François (2006). See Greene, O’Brien, and Schuh (2017) for evidence of these correlations in the 2012 DCPC
data.
11
Source: 2012 DCPC, Federal Reserve Bank of Boston.
Figure 2: Dollar value per payment by payment instrument
The correlation between payment instrument choice and payment value shown here is
unconditional, that is, it does not control for factors such as characteristics of the consumer or
payment that might explain the payment instrument choice and alter the estimated (conditional)
correlation. Nevertheless, this simple result confirms that collecting dollar values of payments
can contribute to a better understanding of consumer payment choices.
12
Individual Payment Values
Source: 2012 DCPC, Federal Reserve Bank of Boston. Note: All values were truncated at $400. The smooth distribution of the data was
constructed by estimating the probability density function of individual payment values.
Figure 3: Distribution of individual payment values for all transactions, bills, and nonbills
Figure 3 shows the distribution of individual payment values for all payments (solid line),
bill payments, and nonbill payments (including purchases and P2P, dashed lines), with all values
truncated at $400. The graph shows that the majority of all payments were for low values. In fact,
34.3 percent of all payments were for less than $10, and 51.3 percent of all payments were for less
than $20. The distribution was strongly skewed, especially for nonbill payments: 39.5 percent
were for less than $10, and 58.5 percent were for less than $20. Bill payments were more evenly
distributed throughout the value range.
13
Consumer Payments by Type of Expenditure
In the broad categories of purchases, P2P payments, and bills, the vast majority of
payments recorded in the DCPC were purchases and P2P payments (hereafter called “nonbills”):
of the 59 monthly payments consumers made on average, 50.7 were nonbills (86 percent) and 8.3
were bill payments (14 percent). Because nonbills constituted the majority of payments, the
breakdown of the number of these payments resembles the breakdown of all payments (DCPC
Table 5). Figure 4 shows an analysis of bill and nonbill payments by payment instrument,
categorizing them by number of payments (top two horizontal bars) and value of payments
(bottom two horizontal bars).
Source: 2012 DCPC, Federal Reserve Bank of Boston.
Figure 4: Payment instrument use for bills and nonbills, shares by number and value
Compared to nonbills, bill payments were much more frequently paid by check or
electronic payments: the share of check payments was 24.9 percent for bills and 3.6 percent for
nonbills, and the share of electronic payments was 47.5 percent for bills and 1.1 percent for
nonbills (DCPC Tables 5 and 8). Of the two electronic payment types, consumers used OBBP
14
more frequently than BANP for bill payments: 2.3 payments or 27.8 percent of all bills on average
for OBBP and 1.6 payments or 19.8 percent for BANP.
Cash and cards were consumers’ preferred choices for nonbill payments, accounting for
nearly all such payments (94.2 percent of the total number). Among card payments, debit was the
most common method (13.4 payments or 26.4 percent on average), followed by credit (9.7
payments or 19.2 percent) and prepaid cards (1.3 payments or 2.5 percent). Consumers employed
cards to pay 52.3 percent of the total value of nonbills and only 9.3 percent of the total value of
bills. They used cash to pay 46.0 percent of the number of nonbills, 21.3 percent of the total value
of nonbills, and only 2.2 percent of the total value of bills.
The breakdown of bill shares by value reveals that electronic bill payments (OBBP and
BANP) accounted for more than half the value of all bill payments (58.4 percent). Bills paid by
OBBP, by BANP, and by check had the highest average values at $315, $239, and $234 per
payment, respectively. On average, bills paid by cash ($110) or by card ($123) were lower in value.
Though consumers used cash far less frequently for bills than for other payments, cash bill
payments were on average much larger in value than other cash payments ($110 versus $19).
DCPC Table 7 shows nonbill payments by device. Almost all in-person payments were
made with no device. Of the nonbill payments that were not made in person (on average only 3.3
payments out of 50.7), about half were made on a computer, and the rest were made by mail or
on a mobile phone. Almost all bill payments were not made in person (7.3 out of 8.3; DCPC Table
10). The most common location for bill payments was by mail (4.0 payments).
Respondents also classified their payments by broad merchant category (DCPC Table 4).10
DCPC Tables 6 and 9 show nonbill and bill payments by payee type. While food expenditures
10 The classification of payments by merchant category versus expenditure category is complex and
imperfect. So, while the total number and value of payments may be reasonably good estimates of actual
U.S. totals, detailed estimates by industry or product type may not provide good estimates of the
disaggregated categories. Preliminary analysis of the number and value of payments by DCPC merchant
category seems to support this hypothesis, so the reader is cautioned to treat estimates by merchant
category circumspectly. The methodology of classifying payments by industry and product was developed
further for the 2015 and 2016 DCPCs and is an ongoing area of research.
15
constituted the largest share of payments by number at 55 percent of all nonbill payments (DCPC
Table 6), they accounted for only 28 percent of the overall value of nonbill payments, as the
average value of food payments was the lowest among all merchant categories. For bills, housing-
related expenditures accounted for the highest share of payments in terms of both number and
value (DCPC Table 9).
Cash Management
Holdings and Use
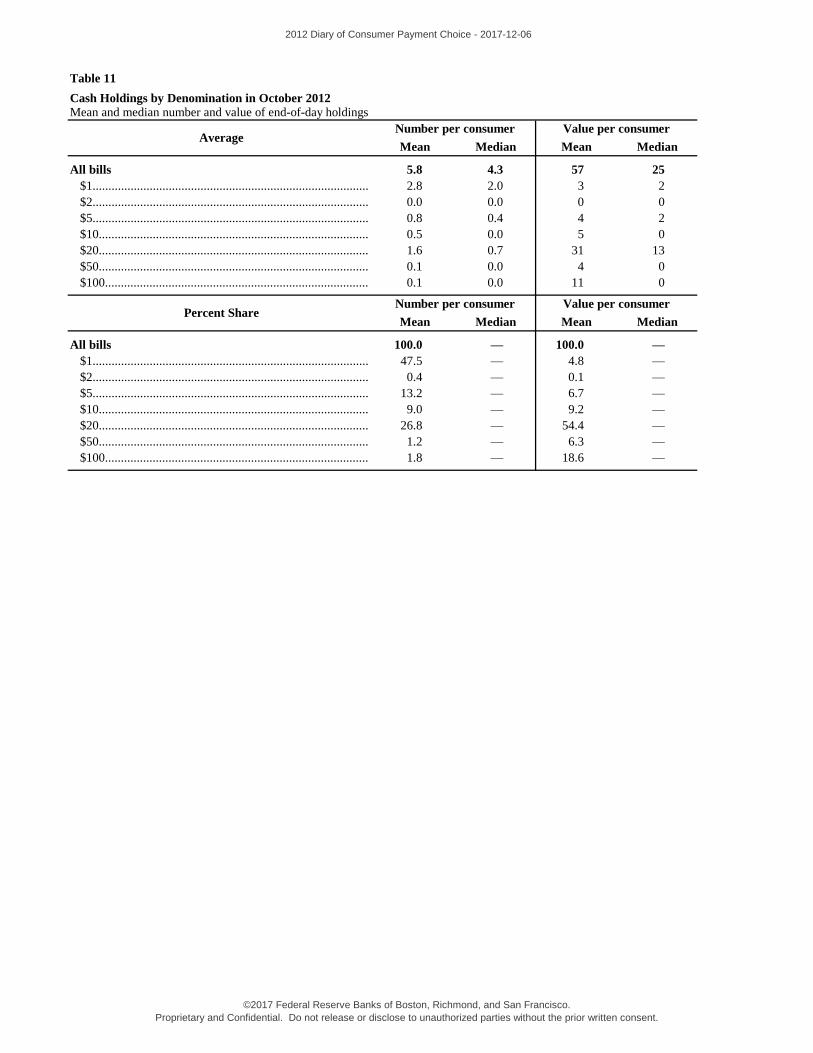
The DCPC asked respondents to count the cash in their wallet, purse, or pocket by
denomination at the beginning of their first diary day and each night. Figure 5 shows frequency
distributions of cash holdings for respondents’ opening day of the DCPC.11 Half of consumers
held $25 or less. The average amount of cash held was $57. DCPC Table 11 shows the distribution
of cash holdings by denomination. The most commonly held bill was $1 (47.5 percent of all bills),
followed by $20 (26.8 percent) and $5 (13.2 percent). The most value held was in $20 bills (54.4
percent of the total value held).
11 See DCPC Table 11 for the results on cash holdings by denomination, and see Fulford et al. (2015) and
Greene and Schuh (2014) for details on consumers’ holding and use of $1 and $100 bills, respectively.
16
Source: 2012 DCPC, Federal Reserve Bank of Boston. Note: All values were truncated at $500.
Figure 5: Frequency distribution of cash holdings at the start of respondents’ first diary day
Deposits and Withdrawals
The DCPC asked respondents to record any transactions involving cash, so in addition to
noting the purchases, P2P payments, and bill payments summarized above, they also recorded
cash deposits and withdrawals. On average, consumers made 0.86 deposits and 5.0 withdrawals
in October 2012 (DCPC Tables 12 and 13). The average value per deposit was $320, although
deposits at a bank teller were higher on average than those at an ATM ($353 and $140,
respectively). A bank teller was the most common location for cash deposits.
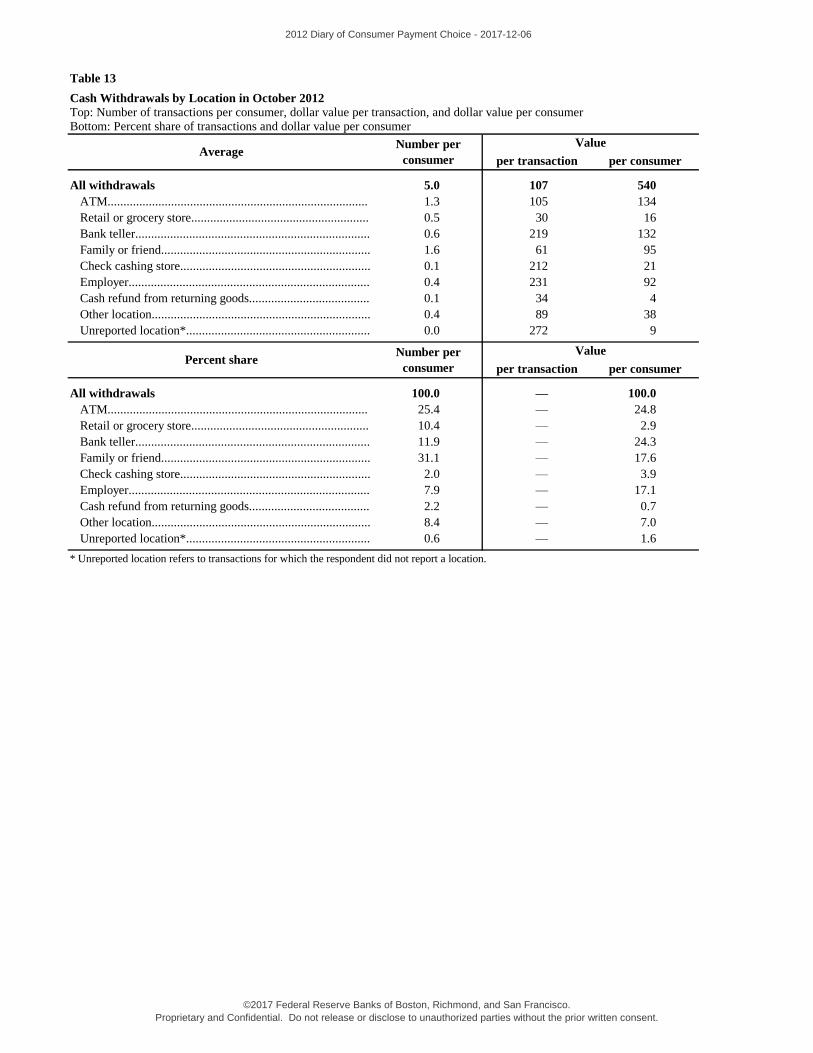
The average amount per cash withdrawal overall was $107, and the average amount per
ATM withdrawal was $105. Withdrawals at other locations, such as from an employer or bank
teller, were on average greater in value, but they occurred less frequently. The most frequent
17
source of cash was a family member or a friend (31 percent), followed by an ATM withdrawal
(25.4 percent). Of the five monthly withdrawals, on average 2.0 were from a bank account (ATM
or teller), 1.6 were from another person, and 0.9 was through another payment instrument, such
as cashing a check, getting a credit card advance, or withdrawing from a prepaid card.
Consumers withdrew cash more frequently than they deposited it. While only 6.3 percent
of consumers deposited cash during their three DCPC days (see DCPC Methodology below), 34
percent withdrew cash during the same period. On average, consumers withdrew $540 and
deposited $276 in cash in October 2012. The finding that consumers withdrew more cash than
they deposited is not surprising, given that only 4.7 percent of consumers reported that they are
paid in cash, but 40.2 percent of transactions by number and 12.2 percent by value were
conducted in cash. The average total value of cash payments in October 2012 was $495 (DCPC
Table 1), which is slightly less than the total amount withdrawn. However, while the
withdrawals, deposits, and transactions measure cash flows, consumers hold some stock of cash
in their wallets and elsewhere, as discussed above. The difference between the amount
withdrawn and the amount used for transactions can be attributed in part to changes in that stock.
Comparison to the 2012 Survey of Consumer Payment Choice
Since 2008, the Federal Reserve Bank of Boston has been conducting the annual Survey of
Consumer Payment Choice (SCPC), an internet-based, half-hour survey of about 2,000 U.S.
consumers (ages 18 years and older) that obtains detailed estimates of their adoption and use of
the most common payment instruments. The DCPC is designed, in part, to validate and
supplement the SCPC, which obtains data on the number of consumer payments from
respondents’ recall of their recent typical behavior.12 Largely because of potential measurement
error from recall, the SCPC collects only the number of payments made by consumers and not
the dollar value of those payments.
12 See Schuh and Stavins (2014) for a detailed summary.
18
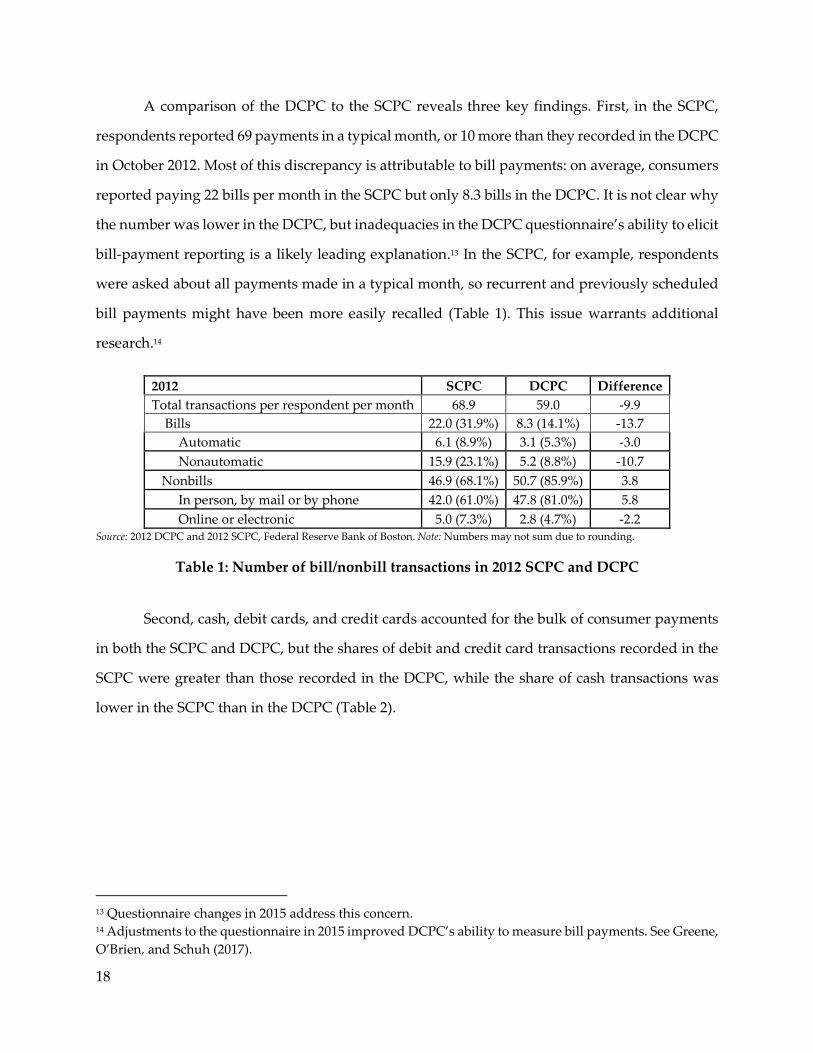
A comparison of the DCPC to the SCPC reveals three key findings. First, in the SCPC,
respondents reported 69 payments in a typical month, or 10 more than they recorded in the DCPC
in October 2012. Most of this discrepancy is attributable to bill payments: on average, consumers
reported paying 22 bills per month in the SCPC but only 8.3 bills in the DCPC. It is not clear why
the number was lower in the DCPC, but inadequacies in the DCPC questionnaire’s ability to elicit
bill-payment reporting is a likely leading explanation.13 In the SCPC, for example, respondents
were asked about all payments made in a typical month, so recurrent and previously scheduled
bill payments might have been more easily recalled (Table 1). This issue warrants additional
research.14
2012 SCPC DCPC Difference
Total transactions per respondent per month 68.9 59.0 -9.9
Bills 22.0 (31.9%) 8.3 (14.1%) -13.7
Automatic 6.1 (8.9%) 3.1 (5.3%) -3.0
Nonautomatic 15.9 (23.1%) 5.2 (8.8%) -10.7
Nonbills 46.9 (68.1%) 50.7 (85.9%) 3.8
In person, by mail or by phone 42.0 (61.0%) 47.8 (81.0%) 5.8
Online or electronic 5.0 (7.3%) 2.8 (4.7%) -2.2 Source: 2012 DCPC and 2012 SCPC, Federal Reserve Bank of Boston. Note: Numbers may not sum due to rounding.
Table 1: Number of bill/nonbill transactions in 2012 SCPC and DCPC
Second, cash, debit cards, and credit cards accounted for the bulk of consumer payments
in both the SCPC and DCPC, but the shares of debit and credit card transactions recorded in the
SCPC were greater than those recorded in the DCPC, while the share of cash transactions was
lower in the SCPC than in the DCPC (Table 2).
13 Questionnaire changes in 2015 address this concern. 14 Adjustments to the questionnaire in 2015 improved DCPC’s ability to measure bill payments. See Greene,
O’Brien, and Schuh (2017).
19
2012 SCPC DCPC Difference
Total transactions per respondent per month 68.9 59.0 -9.9
Cash 18.4 (26.8%) 23.7 (40.2%) +5.3
Check 6.5 (9.5%) 3.9 (6.6%) -2.6
Debit card 20.6 (29.9%) 14.4 (24.4%) -6.2
Credit card 14.9 (21.6%) 10.2 (17.3%) -4.7
Prepaid/Gift/EBT card 0.8 (1.2%) 1.3 (2.2%) +0.5
Online banking bill pay (OBBP) 3.2 (4.7%) 2.6 (4.4%) -0.6
Bank account number payment (BANP) 3.3 (4.7%) 1.9 (3.2%) -1.4 Source: 2012 DCPC and 2012 SCPC (Table 27), Federal Reserve Bank of Boston. Note: Numbers may not sum due to rounding. Money
orders, traveler’s checks, text payments, and other/unreported omitted from this table.
Table 2: Payments by payment instrument in 2012 SCPC and DCPC
Third, in terms of payments by instrument, the DCPC found significantly more cash
payments than did the SCPC. The SCPC respondents reported 18.4 cash payments (26.8 percent
of all payments) on average, compared to 23.7 cash payments in the DCPC (40.2 percent). Some
of this difference likely stems from the SCPC respondents’ recording more bill payments, which
are less frequently made with cash.15 The discrepancy in the number of cash payments indicates
that consumers may remember their cash payments more accurately when they record them the
same day instead of trying to recall them later. Consumers may not remember their low-value
payments, especially when they’re providing an estimate of aggregate monthly payments.
Aggregation may be as important as lack of recall, and the two effects might interact with each
other.
DCPC Methodology
The DCPC was designed to measure all daily U.S. consumer payments by payment
instrument over a fixed calendar period (month). Each participant recorded details about his or
her daily payments for three consecutive days. This strategy generated aggregate estimates of the
number and value of consumer payments for each day in the DCPC sample and, when the
estimates were summed across all days, for the month. October was chosen so that the aggregate
15 Later improvements to the way in which the DCPC collects information about bills are described in
Greene, O’Brien, and Schuh (2017), which includes an analysis of the ways in which these improvements
may have affected the comparability of 2012 and 2015 DCPC results.
20
estimates of the number of payments could be compared to those in the SCPC, which is fielded
primarily in October (see Angrisani, Foster, and Hitczenko 2013) and because October has a
relatively small seasonal component.16
The unit of measurement in the DCPC is a U.S. consumer, as opposed to a U.S. household.
It is less complicated and less costly to measure payments by one consumer versus all members
of one household, but doing so creates challenges for measuring payments that are made jointly
by household members, such as utility bills (electricity, water, etc.). However, the DCPC contains
considerable information about the composition of each respondent’s household and his or her
role in the household, which is helpful in analyzing individual consumer payment choices.
Because each respondent participates for only three consecutive days of the month, an
individual consumer’s recorded payment activity is unlikely to be a representative or
comprehensive picture of his or her payments for the month.
The DCPC was designed to collect data that complement and enhance the data collected
by the SCPC (Table 3). The primary similarity between the two surveys is the counting of the
number of consumer payments by payment instrument. The primary difference is that the DCPC
also collects the dollar value of each payment. Given the observed correlations between payment
instruments and average dollar values of payments, having data on both the number and dollar
value of payments provides a significant advantage to researchers seeking to document and
understand consumer payment choice.
For each payment they recorded, respondents were asked to record five additional
characteristics: time of day; location (payment made in person or not in person); device, if used
(computer, tablet, mobile phone, landline phone, mail or delivery service, or none of these);
merchant type (from one of 45 categories, see Table 9); and merchant name (only in paper diary,
not reported online). The DCPC also records more detail than the SCPC about cash management
(such as currency denomination, cash deposits, source of cash withdrawals, and coin-to-bill
16 Hernandez, Jonker, and Zwaan (2016) reports seasonal variation of as much as nearly 10 percent in Dutch
payments for certain months, but the authors find that October seasonal variation is essentially zero.
21
transactions) and income (such as type, dates of previous and next income receipt, and form of
income payment). The decision to record many of these details stemmed from the need to
carefully track the nature of daily payments.
Feature SCPC DCPC
Financial responsibility x
Assess payment instruments (PI) x
Adoption of PI x x (implied)
Incidence of use of PI x x
Cash activity x x
Frequency of use of PI x x
Dollar values of payment activity
x Source: Federal Reserve Bank of Boston.
Table 3: Comparison of data collected by SCPC and DCPC
Despite the detailed information about specific transactions, diary recordings may contain
flaws not found in data from financial institutions or other more exact measures. For example,
diary respondents might not record all payments accurately for various reasons: they forget
payments, delay payment recording or data entry, omit illegal or embarrassing payments, make
data-entry errors (online), or postpone payments until after the diary period to avoid response
burden.
Mixed-Mode Data Collection
A daily diary of consumer payment choice has the potential to minimize respondent recall
error by providing a means for near-real-time recording of individual payments. DCPC
respondents were asked to record their payments in detail each day, thus reducing the period of
recall to one day at most. The 2012 DCPC used sequential mixed-mode survey methodology.17 In
the first stage, respondents were asked to carry a paper memory aid and use it or some other
method of their choosing to record their transactions each day. In the second stage, respondents
completed an unassisted online survey questionnaire, entering their daily transactions data and
answering questions about recurring bill payments and other items that were not included in the
17 See Chapter 8 of Dillman, Smyth, and Christian (2009).
22
memory aids. To our knowledge, the DCPC is the only payment diary that has attempted to
collect data on recurring bill payments.
We decided to rely on respondents to enter diary data online based on the results from
pilot studies in 2010 and 2011, each of which involved 350 to 400 panelists. In 2010, respondents
were required to fill out their memory aids and complete the online survey. They were asked
(and paid) to mail their memory aids to the RAND Corporation, the survey vendor. RAND then
re-entered the memory-aid data into the online survey independently for cross-checking. A
comparison of the respondent-entered and RAND-entered data revealed only a few
discrepancies, and they were small and of minor consequence.18
The 2012 DCPC offered a choice of two paper memory aids: a long form and a short form.
Figure 6 shows a page of the long-form memory aid, on which respondents recorded seven core
variables for each nonbill payment every day.19 Respondents who chose not to use either paper
aid were encouraged to use some other form of recording, such as collecting receipts. Experience
from and experiments with the 2010 and 2011 DCPC pilot studies informed this flexible approach
to reporting.
18 The 2011 pilot study included some remedies to the questionnaire and data-entry process to reduce errors
and inconsistencies. 19 The memory aids are available online at https://www.bostonfed.org/publications/diary-of-consumer-
payment-choice/2012-diary.aspx.
23
Source: 2012 DCPC, Federal Reserve Bank of Boston.
Figure 6: Main page of the long-form memory aid in the 2012 DCPC
Recording of transactions appears to have been successful. Most respondents (85.9
percent) carried a paper memory aid (54.3 percent), collected receipts (71.4 percent), or did both
to support their nightly online data entry (Table 4). Some respondents saved their receipts from
all payments and cash management and stored them in a pouch provided to them. Other
24
respondents used their mobile phone, their own paper device, or some other method. It is possible
that some respondents didn’t use any recording device, in which case their diary responses would
be essentially the same as those from a one-day recall survey. About 28 percent of respondents
reported using the large paper diary, and about 37 percent reported using the smaller, checkbook-
size version. The majority saved their receipts and used them to record their transactions.
Percentage
Used paper memory aid and/or collected receipts 85.9
Used paper memory aid 54.3
Used large paper diary 27.5
Used small checkbook diary 37.1
Used paper memory aid, but did not collect receipts 14.4
Collected receipts 71.4
Referenced financial records 23.3
Used other memory aid 5.8
Did not use memory aid 9.8
Source: 2012 DCPC, Federal Reserve Bank of Boston. Note: Respondents could have used more than one type of memory aid.
These numbers are unweighted.
Table 4: Share of respondents using memory aids
Regardless of how they tracked their daily transactions, all respondents were asked to
answer an online survey that was expected to take as long as 20 minutes per day to complete.
Respondents were asked to go online at the end of each assigned diary day, or no longer than one
day later, to minimize recall error, lost records, or other problems. The online survey tracked the
time and day a respondent logged in, so it could be compared to his or her assigned calendar
starting day; respondents were asked to affirm that the data they entered was for the proper
calendar day. Both of these error checks were added to the DCPC as a result of the pilot studies.
Respondents were asked to enter their daily transactions into the online questionnaire,
which was designed to resemble the structure and formatting of the long-form memory aid. After
they entered their daily transactions, respondents were asked to answer as many as four
additional survey questions about their daily transactions (the number of questions depended on
the payment instrument used), such as whether their payment card had a Visa or MasterCard
25
logo and whether they received a discount or paid a surcharge for using their payment
instrument. In addition, respondents were asked to report their recurring bill payments, which
were not included in the paper memory aids.
Sampling Methodology
The DCPC was implemented in October 2012 with more than 2,500 respondents from the
American Life Panel (ALP) of the RAND Corporation. The 2012 DCPC used a random sampling
method designed to obtain a nationally representative sample of consumers for the month of
October 2012 within the structure of the ALP convenience panel. Respondents were randomly
selected in advance (September 2012) using age, race, and household income to generate
sampling probabilities (sampling was conducted jointly with the SCPC). Each respondent was
asked to complete the DCPC for three consecutive days starting on one of 33 days from September
29 through October 31 (with the final three-day period ending November 2). Thus, each day could
be expected to include about 225 diarists representative of the U.S. population evenly divided by
those filling out the first, second, and third days of the DCPC.20 This overlapping wave structure
was designed to smooth out potential variation in responses by day of diary participation caused
by issues such as diary fatigue (Figure 7).
Number Percentage of
previous row
American Life Panel members (September 2012) 5,093 —
Members accepting invitation to participate in the DCPC 3,427 67.3
Participants randomly selected for possible participation 2,721 79.4
Members agreeing to participate 2,547 93.6
Participants who completed all three days 2,468 96.9 Source: Federal Reserve Bank of Boston.
Table 5: Acceptance and participation rates for the 2012 DCPC
20 Diarists who declined to participate in their randomly selected assigned period were not allowed to
reschedule their assigned diary period. Instead, they were replaced by other randomly selected diarists.
Diarists who canceled their participation at the last minute were replaced, as best as possible, by other
demographically similar respondents. For more information on sample selection and participation, see the
technical appendix.
26
As documented by Table 5, about two-thirds (67.3 percent) of all ALP members accepted
the initial invitation to participate in the DCPC. About four-fifths (79.4 percent) of these members
were randomly selected to potentially populate the final DCPC sample and were sent invitations.
Of these invitees, 93.6 percent agreed to participate (“participation rate”); of those who agreed,
96.9 percent completed all three days of the DCPC (“completion rate”). The 2012 DCPC
respondents were chosen in such a way as to coincide as much as possible with the respondents
to the 2012 SCPC, which was implemented about the same time. Respondents who completed
both the SCPC and all three days of the DCPC provide the maximum information and data on
their consumer payment choices. Most respondents who participated in both surveys completed
the SCPC first. Table 5 shows the 2012 DCPC response rates, and Table 6 shows the number of
respondents in the 2012 SCPC and DCPC.
2012 Respondents
Total SCPC 3,176
Total DCPC 2,547
Total SCPC & DCPC 2,354
Official SCPC 2,065
Official DCPC 2,468 Source: Federal Reserve Bank of Boston.
Table 6: Number of respondents
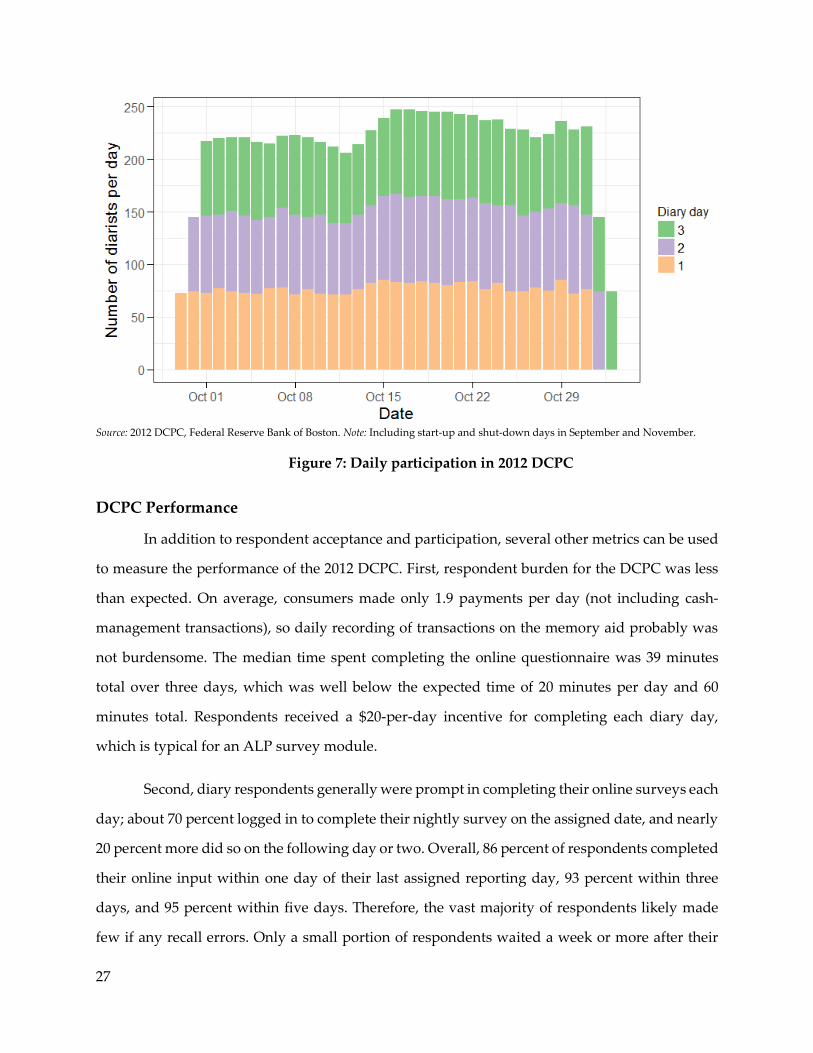
Figure 7 depicts the outcome of the DCPC sampling strategy. As expected, the number of
diarists participating on a typical day ranged from 200 to 250, except for the rolling start-up
(September 29 and 30) and shut-down (November 1 and 2) periods. Also as expected, the
proportion of diarists completing each of the three days was roughly equal (about one-third on
each of the three days).
27
Source: 2012 DCPC, Federal Reserve Bank of Boston. Note: Including start-up and shut-down days in September and November.
Figure 7: Daily participation in 2012 DCPC
DCPC Performance
In addition to respondent acceptance and participation, several other metrics can be used
to measure the performance of the 2012 DCPC. First, respondent burden for the DCPC was less
than expected. On average, consumers made only 1.9 payments per day (not including cash-
management transactions), so daily recording of transactions on the memory aid probably was
not burdensome. The median time spent completing the online questionnaire was 39 minutes
total over three days, which was well below the expected time of 20 minutes per day and 60
minutes total. Respondents received a $20-per-day incentive for completing each diary day,
which is typical for an ALP survey module.
Second, diary respondents generally were prompt in completing their online surveys each
day; about 70 percent logged in to complete their nightly survey on the assigned date, and nearly
20 percent more did so on the following day or two. Overall, 86 percent of respondents completed
their online input within one day of their last assigned reporting day, 93 percent within three
days, and 95 percent within five days. Therefore, the vast majority of respondents likely made
few if any recall errors. Only a small portion of respondents waited a week or more after their
28
assigned date to log in to the online survey; the data from these late respondents may have been
susceptible to recall errors, record loss, and other concerns. In addition to implementing the main
DCPC, following Hurricane Sandy in late October 2012, we fielded a short survey asking
respondents whether (and how) they were affected by Hurricane Sandy. The survey focused on
the hurricane’s impact on the respondents’ ability to make payments and/or withdraw cash.
Third, completion rates for the main DCPC questions were high, as shown in Table 7.
Each type of transaction—purchase, bill, and cash withdrawal or deposit—had several associated
questions. More than 94 percent of all questions were completed for each of the four transaction
types, leaving very few non-responses to these core questions.
Transaction type Number of Transactions
Percentage for which all questions
were answered
Purchase 12,647 94.1
Bills 1,353 95.2
Withdrawals 1,237 95.2
Deposits 202 98.0 Source: 2012 DCPC, Federal Reserve Bank of Boston.
Table 7: Share of complete responses by transaction type, 2012 DCPC
Concepts and Definitions
Many of the DCPC concepts are the same as those from the SCPC. These include
definitions of payment instruments, the consumer behavior that indicates adoption of payment
instruments, and transaction types. This section defines additional concepts underlying the data
collected in the DCPC.
Payment Instruments and Adoption
Schuh and Stavins (2014), Definitions Table 2, defines the nine payment instruments
covered by the SCPC and DCPC. The 2012 DCPC additionally distinguishes between debit card
payments made using a personal identification number (PIN) and those made without using a
PIN. This distinction helps separate debit card payments authorized by a PIN from those that
used other forms of authorization: signature, card-not-present (CNP), and neither signature nor
CNP. We included this simple distinction because consumers (partly as a result of merchants’
29
classification) sometimes refer to signature debit cards as “credit” or simply might not have been
aware of the distinction. Also, the retail scanner data used in previous studies on individual retail
payments (such as Klee 2008) does not make this distinction.
Schuh and Stavins (2014), Definitions Table 3, defines adoption of bank accounts, payment
instruments, and relevant technology (mobile phone, for example). Data on consumer adoption
of payment instruments and deposit accounts were obtained from the responses to the SCPC and
then brought in to the DCPC. In addition, the DCPC’s online questionnaire asked respondents to
report which payment instruments they carried with them each day, which might differ from
adoption. A decision about using a credit card, for example, depends crucially on whether the
consumer is carrying the instrument when making a payment in person at the point of sale.
Similarly, consumers need to carry cash in order to use it. Therefore, respondents were asked
each night to report cash balances in their wallet or purse by denomination.
Characteristics of Payments
DCPC respondents received detailed instructions about the additional characteristics of
payments—time, location, device, and merchant (that is, payee type)—in the long-form memory
aid and online questionnaire. Respondents were asked to record a location and device for each
payment because of the increasing complexity of the payment system. A consumer must be “in
person” to make certain types of payments. For example, cash cannot be used when the consumer
is not present. The device, sometimes called the payment “channel,” is of interest because it could
correlate with the choice of payment instrument. Also, it has become a necessity to ask about
devices because of the emergence of the mobile phone, which can be used not only for remote
payments (like a computer) but also as a replacement for a plastic card within certain apps.21 Table
8 shows the choices respondents were offered for designating device and location.
21 Having data about the use of a device also makes it possible to track changes in shopping patterns over
time, which may affect propensity to use cash in the future.
30
Device Location
Computer
Tablet
Mobile phone
Landline phone
Mail of delivery service
None of the above
In person
Not in person
Source: Federal Reserve Bank of Boston.
Table 8: Respondent choices for device and location
Transaction Types
Schuh and Stavins (2014), Definitions Table 5, describes transaction types (for example,
bill payments, purchases, and person-to-person payment). DCPC respondents were not asked to
record bill payments in the long-form memory aid, though some appear to have done so (as
observed by duplicate payments in the bill and nonbill sections). Each night, when they went
online, respondents were reminded that they may not pay bills every day; some reminders were
included to prompt better recall of bills. The online survey collected data about two categories of
bill payments: automatic payments for recurring bills and other (including regularly scheduled
recurring bills that are not automatically paid, irregularly timed bill payments, and one-time
bills).
Respondents were expected to record all other payments made in the United States each
day in their long-form memory aid or other recording device, regardless of whether they were
traveling, but excluding payments made in foreign countries.22 U.S. payments could take the form
of person to business (P2B), person to government (P2G), or person to person (P2P). P2B
Payments could be further classified into nonfinancial and financial businesses. Nonfinancial
payments were for the purchase of goods and services, which for the most part pertained to the
economic concept of consumption. Financial payments pertained to debt service, asset purchases,
22 Payments made during foreign travel were excluded, but local cross-border payments made in U.S.
dollars (at the U.S.-Canada border, for example) and remittances authorized in the United States may have
been reported by some respondents if they did not consider this to be “foreign travel.”
31
portfolio reallocation (asset transfers), fees to financial institutions, and the like. For the most part,
they pertained to savings (including debt reduction) or investment in assets such as real estate.
Payee and Expenditure Types
Another informative way to classify consumer payments is by the payee, that is, the
recipient of the consumer’s payment. Any exchange of money or credit for goods and services
involves two parties: the payer (for purposes of this report, a consumer) and the payee. Thus,
while a consumer may prefer a particular payment instrument, the payee also must agree to
accept payment with that instrument. For example, airlines do not accept cash for onboard food
and beverages, and small retailers sometimes do not accept credit cards. The 2012 DCPC
employed the North American Industry Classification System (NAICS) to classify merchants, but
it modified the system to incorporate other recipients of consumer payments.23 NAICS uniquely
assigns businesses into well-defined industries based on the products and services produced or
sold. The NAICS is related to expenditure types through the products that define the industry.
NAICS coding makes it possible to compare the DCPC data with benchmark values of
expenditure data from other sources (for example, “Retail Sales,” NAICS 44–45).
A related way to classify consumer payments is by the goods and services consumers buy
or receive in exchange for their payment, that is, the type of consumer expenditure. For example,
consumers may wish to pay for necessities (such as food and gas) out of their checking account
balance or cash holdings (currency) and use credit cards for larger expenses (such as airline
tickets) or durable goods (computers) to spread the cost over time. Minimal research has been
done to investigate the potential link between payment choices and specific types of goods and
services. Moreover, this idea is complicated by consumer shopping behavior that combines many
types of goods and services into one payment (for example, at grocery stores and general
merchandise stores such as Walmart and Target). Therefore, measuring consumer expenditures
by payment values (or the “shopping basket”) produces information that is less precise than data
from surveys that measure consumer expenditures at the level of individual products (such as
23 For more details about NAICS, see: https://www.census.gov/eos/www/naics/.
milk, eggs, and cereal). Most efforts to collect data on consumer expenditures use categories of
goods and services that are familiar to consumers and typically conform to the economic
definition of consumption.24
In the long-form memory aid for the DCPC and the online questionnaire, respondents
were asked to classify each of their payments into one of 45 merchant-expenditure categories. The
2012 DCPC employed a blended classification system for payees that aimed to combine the
merchant (NAICS industry) and consumer expenditure type categories (from the Bureau of Labor
Statistic’s Consumer Expenditure Survey and Bureau of Economic Analysis’s National Income
and Product Accounts personal consumption expenditures). Industry and expenditure category
definitions do not always align, so the merchant-expenditure category system has some
limitations.25 DCPC Tables 2, 3, 6, and 9 report payments by type of payee (“merchant”) or
consumer expenditure in 10 categories. Table 9 shows how these 10 categories relate to categories
offered in the questionnaire.26
24 The Consumer Expenditure Survey (CEX) by the Bureau of Labor Statistics is a leading example of this
approach (http://www.bls.gov/cex/). Another consumer study that also uses the American Life Panel is the
one by Hurd and Rohwedder (2010). The definitive classification of consumption is found in the National
Income and Product Accounts (NIPA) produced by the Bureau of Economic Analysis. Although broadly
similar, the sources exhibit some differences in classification. For more details about the measurement of
consumer expenditures using payment diaries, see Schuh (2017). 25 The mapping of merchant (payee or NAICS code) to consumer expenditure categories for the 2012 DCPC
is described in detail in Schuh (2017). 26 Schuh (2017) demonstrates that the aggregate U.S. DCPC payment values in these high-level expenditure
categories are considerably greater than aggregate U.S. CE expenditure values and relatively close to
estimates of personal consumption expenditures (PCE) in these categories.
Auto maintenance and repair 811 2. Vehicle purchases (net
outlay); Gasoline and motor
oil; Vehicle insurance; Vehicle
rental, leases, licenses, and
other charges; Air fare, taxis,
bus fares; Miscellaneous
transportation
.
Auto rental and leasing 532
Auto vehicle and parts dealers 441
Gas stations 447
Parking lots and garages 488
Tolls
48–49
Entertainment and
transportation
Transportation (includes public
transportation)
Entertainment, recreation, arts,
museums 71
3. Entertainment; Fees and
admissions; Audio and visual
equipment and services; Pets,
toys, hobbies and playground
equipment
Hotels, motels, RV parks, camps 72
Movie theaters 512
Phone/Internet
(wired/wireless/satellite), online
and print news, online games
51
4. Shelter; Utilities, fuels, and
public services; household
operations; Housekeeping
supplies; Household
furnishings and equipment Housing related
Building contractors
(electrical/plumbing/HVAC, tile,
painting, etc.)
81
Building services 561
Electric, natural gas, water and
sewage 22
Furniture and home goods stores,
appliance and electronics stores,
hardware and garden stores
44–45
Heating oil dealers, propane
dealers 454
Rent, real estate agents and
brokers 53
34
Mortgage
Trash collection 562
Medical, education,
and personal services
Child care, elder care, youth and
family services, emergency and
other relief services
62
Doctors, dentists, other health
professionals 62
5. Health insurance; Medical
services; Drugs; Medical
supplies Hospitals, residential care
Education 61
6. Tuition; Test prep; School
books and supplies for all
types of school
Veterinarians
81
3. Entertainment; Fees and
admissions; Audio and visual
equipment and services; Pets,
toys, hobbies and playground
equipment
Financial,
professional,
miscellaneous services
Personal care, dry cleaning, pet
grooming and sitting, photo
processing, death care
1. Food, general merchandise,
personal care supplies and
services
Rental centers 532 4. Shelter; Utilities, fuels, and
public services; household
operations; Housekeeping
supplies; Household
furnishings and equipment
Repair/maintenance of electronics
and personal and household
goods
811
Financial services, insurance 52 7. Personal insurance and
pensions
Employment services, travel
agents, security services, office
administrative services
561
8. Miscellaneous (includes legal
fees, funeral expenses, bank
service charges, etc.)
Legal, accounting, architectural,
and other professional services 54
Mail, delivery, storage 48–49
Government and
nonprofit
Taxes, fees, fines and other
payments to governments —
Charitable, religious,
professional, civic (not
government) organizations
813 9. Charity; Child support and
alimony; Donations to
charities, churches, educational
institutions, and political
organizations; Other gifts
Gifts and transfers to
people
Friends and family —
People who provide goods and
services 814
Other people —
Other/unknown
expenditure category.
Source: Schuh (2017), 2012 DCPC, Federal Reserve Bank of Boston. Note: Broad expenditure categories 1, 3, and 4 appear in more than
one row of this table.
Table 9: Mapping of DCPC Merchant Codes to NAICS and Broad CE Expenditure Categories
35
Developments Since 2012
Since 2012, the DCPC has been implemented three more times (2015, 2016, and 2017). The
newer versions of the DCPC incorporated several improvements compared to the 2012 version.
This section provides a high-level summary of changes to the DCPC since the 2012 version.27
Improvements include the collection of the following additional data:
Balances held in checking accounts and nonbank deposit accounts such as prepaid
cards, PayPal, etc.
Outstanding debt balances from credit card bill payments.
Adjusted classification of expenditures based on official National Income and Product
Account (NIPA) definitions.
Dollar values, types, and frequencies of personal income receipts.28
Details about the timing and nature of bill payments to improve classification of
expenditures.
Data from the 2015 and 2016 DCPC are described in Greene and Schuh (2017).
In 2015, the DCPC added a “Day 0” module that asked consumers to carefully count their
cash holdings by denomination before they started recording their daily transactions on Day 1.
On Day 0, they were also asked to report their bank account ownership and balances, as well as
their preferences regarding payment instruments. Also in 2015, detailed reminders about bill
payments and follow-up questions about the timing of bill payments, credit card management,
and other types of debt were added to the Day 3 module (the final day of the DCPC). In addition,
the 2015 DCPC questionnaire (and those that followed) explicitly mentioned large-value and
very-small-value transactions (such as tolls and purchases from vending machines) to facilitate
recall. Follow-up questions for all purchases were also added. These improvements were made
in order to increase the accuracy and reliability of the DCPC data.
27 For detail see Greene, O’Brien, and Schuh (2017). 28 The 2012 DCPC asked for the days on which the respondent received income, not the dollar amount of
income. In 2015 and following, respondents are asked to report the dollar amount of income received.
36
Because each type of survey has its own comparative advantages, we continued to
conduct the SCPC annually after launching the DCPC in 2012. The results of the two surveys are
qualitatively similar in terms of the shares of transactions conducted with each payment
instrument, but each collects data that the other cannot obtain.
Conclusion
Following two pilot studies conducted in 2010 and 2011, the 2012 DCPC was the first
official diary survey implemented as part of a long-term consumer survey program. The DCPC
complements the SCPC, adding detailed information about individual transactions, in particular,
the dollar value and merchant type for each transaction. The DCPC provides rich information on
consumer payment behavior, including types of merchants and locations for retail purchases and
bill payments conducted in person, online, or by mail. This detailed data can be used to improve
understanding of consumer payment preferences and decisions.
The DCPC shows that consumers’ choice of payment instrument strongly correlates with
the dollar value of the transaction. In particular, cash is often used for smaller-value transactions
and constitutes a value share that is smaller than its volume share for all consumer payments. In
October 2012, consumers made 4 of 10 payments using cash. By value, payments were evenly
distributed among paper (cash and checks), cards (debit, credit, and prepaid), and electronic
(BANP and OBBP) instruments.
37
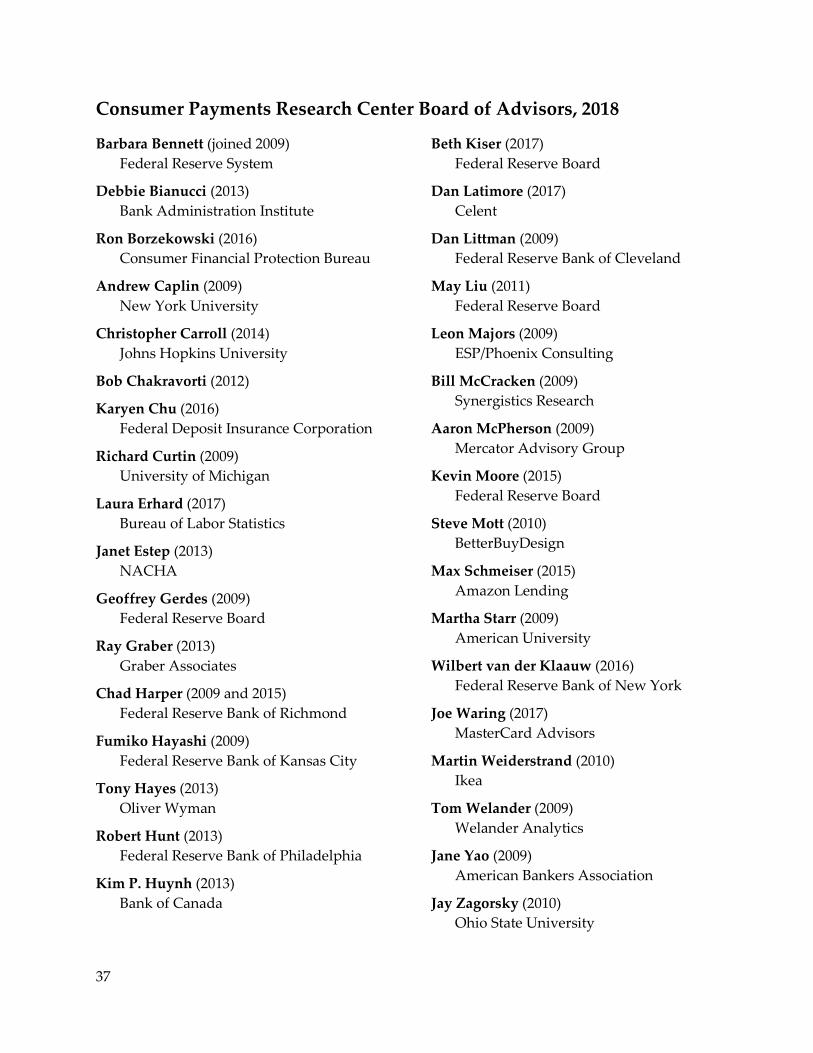
Consumer Payments Research Center Board of Advisors, 2018
Barbara Bennett (joined 2009)
Federal Reserve System
Debbie Bianucci (2013)
Bank Administration Institute
Ron Borzekowski (2016)
Consumer Financial Protection Bureau
Andrew Caplin (2009)
New York University
Christopher Carroll (2014)
Johns Hopkins University
Bob Chakravorti (2012)
Karyen Chu (2016)
Federal Deposit Insurance Corporation
Richard Curtin (2009)
University of Michigan
Laura Erhard (2017)
Bureau of Labor Statistics
Janet Estep (2013)
NACHA
Geoffrey Gerdes (2009)
Federal Reserve Board
Ray Graber (2013)
Graber Associates
Chad Harper (2009 and 2015)
Federal Reserve Bank of Richmond
Fumiko Hayashi (2009)
Federal Reserve Bank of Kansas City
Tony Hayes (2013)
Oliver Wyman
Robert Hunt (2013)
Federal Reserve Bank of Philadelphia
Kim P. Huynh (2013)
Bank of Canada
Beth Kiser (2017)
Federal Reserve Board
Dan Latimore (2017)
Celent
Dan Littman (2009)
Federal Reserve Bank of Cleveland
May Liu (2011)
Federal Reserve Board
Leon Majors (2009)
ESP/Phoenix Consulting
Bill McCracken (2009)
Synergistics Research
Aaron McPherson (2009)
Mercator Advisory Group
Kevin Moore (2015)
Federal Reserve Board
Steve Mott (2010)
BetterBuyDesign
Max Schmeiser (2015)
Amazon Lending
Martha Starr (2009)
American University
Wilbert van der Klaauw (2016)
Federal Reserve Bank of New York
Joe Waring (2017)
MasterCard Advisors
Martin Weiderstrand (2010)
Ikea
Tom Welander (2009)
Welander Analytics
Jane Yao (2009)
American Bankers Association
Jay Zagorsky (2010)
Ohio State University
CPRC Former Advisors
Carlos Arango (2009–2010)
Bank of Canada
Paul Bauer (2009)
Federal Reserve Bank of Cleveland
Marla Blow (2013–2014)
Consumer Financial Protection Bureau
Peter Burns (2009–2012)
Federal Reserve Bank of Philadelphia
(retired)
Jeff Carter (2009)
MIT Media Lab
David Evans (2011–2016)
Market Platform Dynamics
Dave Humphrey (2009–2014)
Florida State University
Peter Ireland (2009)
Boston College
Roger Johnston (2010–2016)
Fiserv
Beth Klee (2009)
Federal Reserve Board
Rich Oliver (2009–2011)
Federal Reserve Bank of Atlanta
William Roberds (2011–2012)
Federal Reserve Bank of Atlanta
Jay Ryan (2013–2014)
Bureau of Labor Statistics
John Sabelhaus (2012–2015)
Federal Reserve Board
Adam Safir (2014–2017)
Bureau of Labor Statistics
Peter Shortall (2013–2017)
MasterCard Advisors
Geoffrey Thomas (2011–2012)
Citizens Bank
Chris Van Steenberg (2013–2015)
Citizens Bank
Adrienne Wells (2009–2010)
Federal Reserve Bank of Atlanta
39
References
Angrisani, Marco, Kevin Foster, and Marcin Hitczenko. 2013. “The 2010 Survey of Consumer
Payment Choice: Technical Appendix.” Federal Reserve Bank of Boston Research Data Reports
No. 13-3.
Angrisani, Marco, Kevin Foster, and Marcin Hitczenko. 2014. “The 2011 and 2012 Surveys of
Consumer Payment Choice: Technical Appendix.” Federal Reserve Bank of Boston Research Data
Reports No. 14-2.
Angrisani, Marco, Arie Kapteyn, and Scott Schuh. 2015. “Measuring Household Spending and
Payment Habits: The Role of ‘Typical’ and ‘Specific’ Time Frames in Survey Questions.” In
Improving the Measurement of Consumer Expenditures. Chicago, IL: NBER and the University of
Chicago Press.
Avery, R. B., G. E. Elliehausen, A. B. Kennickell, and P. A. Spindt. 1986. “The Use of Cash and
Transaction Accounts by American Families.” Federal Reserve Bulletin 72(2): 87–108.
Avery, R. B., G. E. Elliehausen, A. B. Kennickell, and P. A. Spindt. 1987. “Changes in the Use of
Transaction Accounts and Cash from 1984 to 1986.” Federal Reserve Bulletin 73(3): 179–196.
Bagnall, John, David Bounie, Kim P. Huynh, Anneke Kosse, Tobias Schmidt, Scott Schuh, and
Helmut Stix. 2016. “Consumer Cash Usage: A Cross-Country Comparison with Payment Diary
Survey Data.” International Journal of Central Banking 12(4): 1–60.
Bounie, David, and Abel François. 2006. “Cash, Check or Bank Card? The Effects of Transaction
Characteristics on the Use of Payment Instruments.” Telecom Paris Economics and Social
Sciences Working Paper No. ESS-06-05.
Briglevics, Tamás and Scott Schuh. 2013. “U.S. Consumer Demand for Cash in the Era of Low
Interest Rates and Electronic Payments.” Federal Reserve Bank of Boston Research Department
Working Papers No. 13-23.
Cohen, Michael Andrew, and Marc Rysman. 2013. “Payment Choice with Consumer Panel Data.”
Federal Reserve Bank of Boston Research Department Working Papers No. 13-6.
Dillman, Don A., Jolene D. Smyth, and Leah Melani Christian. 2009. Internet, Mail and Mixed-Mode
Surveys: A Tailored Design Method. Hoboken, NJ: John Wiley & Sons, Inc.
Federal Reserve Bank of Atlanta. 1981. A Quantitative Description of the Check Collection System: A
Report of Research Findings on the Check Collection System. Volumes 1 and 2. Co-sponsored by
American Bankers Association, Bank Administration Institute, Federal Reserve System.
Federal Reserve Bank of Atlanta. 1983. “Displacing the Check.” Federal Reserve Bank of Atlanta
Proprietary and Confidential. Do not release or disclose to unauthorized parties without the prior written consent.
2012 Diary of Consumer Payment Choice - 2017-12-06
Table 1
All Payments by Type of Instrument in October 2012
Top: Number of transactions per consumer, dollar value per transaction, and dollar value per consumerBottom: Percent share of transactions and dollar value per consumer
Proprietary and Confidential. Do not release or disclose to unauthorized parties without the prior written consent.
2012 Diary of Consumer Payment Choice - 2017-12-06
Table 2
All Payments by Type of Consumer Expenditure in October 2012
Top: Number of transactions per consumer, dollar value per transaction, and dollar value per consumerBottom: Percent share of transactions and dollar value per consumer
per transaction per consumer
All payments 59.0 69 4043
Food and personal care supplies......................................... 28.1 22 619
Auto and vehicle related..................................................... 7.0 74 519
General merchandise.......................................................... 7.5 58 432
Entertainment and transportation........................................ 3.7 64 236
Proprietary and Confidential. Do not release or disclose to unauthorized parties without the prior written consent.
2012 Diary of Consumer Payment Choice - 2017-12-06
Table 5
Nonbill Payments by Type of Instrument in October 2012
Top: Number of transactions per consumer, dollar value per transaction, and dollar value per consumerBottom: Percent share of transactions and dollar value per consumer
Proprietary and Confidential. Do not release or disclose to unauthorized parties without the prior written consent.
2012 Diary of Consumer Payment Choice - 2017-12-06
Table 6
Nonbill Payments by Type of Consumer Expenditure in October 2012
Top: Number of transactions per consumer, dollar value per transaction, and dollar value per consumerBottom: Percent share of transactions and dollar value per consumer
per transaction per consumer
All nonbill payments 50.7 42 2122
Food and personal care supplies......................................... 28.0 21 601
Auto and vehicle related..................................................... 6.6 56 371
General merchandise.......................................................... 6.7 49 328
Entertainment and transportation........................................ 2.6 43 109
Proprietary and Confidential. Do not release or disclose to unauthorized parties without the prior written consent.
2012 Diary of Consumer Payment Choice - 2017-12-06
Table 7
Nonbill Payments by Device in October 2012
Top: Number of transactions per consumer, dollar value per transaction, and dollar value per consumerBottom: Percent share of transactions and dollar value per consumer
per transaction per consumer
All nonbill payments 50.7 42 2122
In-person 47.3 36 1687
No device........................................................................ 45.0 34 1541
Proprietary and Confidential. Do not release or disclose to unauthorized parties without the prior written consent.
2012 Diary of Consumer Payment Choice - 2017-12-06
Table 8
Bill Payments by Type of Instrument in October 2012
Top: Number of transactions per consumer, dollar value per transaction, and dollar value per consumerBottom: Percent share of transactions and dollar value per consumer
Proprietary and Confidential. Do not release or disclose to unauthorized parties without the prior written consent.
2012 Diary of Consumer Payment Choice - 2017-12-06
Table 9
Bill Payments by Type of Consumer Expenditure in October 2012
Top: Number of transactions per consumer, dollar value per transaction, and dollar value per consumerBottom: Percent share of transactions and dollar value per consumer
per transaction per consumer
All bill payments 8.3 231 1921
Food and personal care supplies......................................... 0.2 122 18
Auto and vehicle related..................................................... 0.4 343 149
General merchandise.......................................................... 0.8 134 104
Entertainment and transportation........................................ 1.1 112 127
Proprietary and Confidential. Do not release or disclose to unauthorized parties without the prior written consent.
2012 Diary of Consumer Payment Choice - 2017-12-06
Table 10
Bill Payments by Location in October 2012
Top: Number of transactions per consumer, dollar value per transaction, and dollar value per consumerBottom: Percent share of transactions and dollar value per consumer
per transaction per consumer
All bill payments 8.3 231 1,921
In-person 1.0 218 226
Not in-person 7.3 233 1,695
Automatic bill payment................................................... 3.1 221 680
per transaction per consumer
All bill payments 100.0 — 100.0
In-person 12.4 — 11.7
Not in-person 87.6 — 88.3
Automatic bill payment................................................... 37.0 — 35.4
Proprietary and Confidential. Do not release or disclose to unauthorized parties without the prior written consent.
2012 Diary of Consumer Payment Choice - 2017-12-06
Table 12
Cash Deposits by Location in October 2012
Top: Dollar value per transaction, dollar value per consumer and number of transactions per consumerBottom: Percent share of transactions and dollar value per consumer
Proprietary and Confidential. Do not release or disclose to unauthorized parties without the prior written consent.
2012 Diary of Consumer Payment Choice - 2017-12-06
Table 13
Cash Withdrawals by Location in October 2012
Top: Number of transactions per consumer, dollar value per transaction, and dollar value per consumerBottom: Percent share of transactions and dollar value per consumer
Proprietary and Confidential. Do not release or disclose to unauthorized parties without the prior written consent.
2012 Diary of Consumer Payment Choice - 2017-12-06
Table 14
Cash Withdrawals by Source of Funds in October 2012
Top: Number of transactions per consumer, dollar value per transaction, and dollar value per consumerBottom: Percent share of transactions and dollar value per consumer