26
The 2013-2014 Continuity Insights and KPMG LLP Global Business Continuity Management (BCM) Program Benchmarking Study
The2013-2014 Continuity Insights and KPMG LLP Global Business Continuity Management (BCM) Program Benchmarking Study
2
Table Of Contents
About This Report . . . . . . . . . . . . . . . . . . . . . . . . . . . . . . . . . . . . . . . . . . . . . . . . . . . 3
Research Methodology . . . . . . . . . . . . . . . . . . . . . . . . . . . . . . . . . . . . . . . . . . . . . . . 3
About Continuity Insights . . . . . . . . . . . . . . . . . . . . . . . . . . . . . . . . . . . . . . . . . . . . . 3
About KPMG LLP . . . . . . . . . . . . . . . . . . . . . . . . . . . . . . . . . . . . . . . . . . . . . . . . . . . . 4
Acknowledgements . . . . . . . . . . . . . . . . . . . . . . . . . . . . . . . . . . . . . . . . . . . . . . . . . 4
1 . Executive Summary . . . . . . . . . . . . . . . . . . . . . . . . . . . . . . . . . . . . . . . . . . . . . . . 5
2 . Respondent Profiles . . . . . . . . . . . . . . . . . . . . . . . . . . . . . . . . . . . . . . . . . . . . . . . 6
2.1.1 Type Of Entity Or Enterprise . . . . . . . . . . . . . . . . . . . . . . . . . . . . . . . . . . . . 6
2.1.2 Geographical Range Of Operations. . . . . . . . . . . . . . . . . . . . . . . . . . . . . . . 6
2.1.3 Country . . . . . . . . . . . . . . . . . . . . . . . . . . . . . . . . . . . . . . . . . . . . . . . . . . . 7
2.1.4 Industry . . . . . . . . . . . . . . . . . . . . . . . . . . . . . . . . . . . . . . . . . . . . . . . . . . 8
2.1.5 Size . . . . . . . . . . . . . . . . . . . . . . . . . . . . . . . . . . . . . . . . . . . . . . . . . . . . . . 9
3 . Survey Results . . . . . . . . . . . . . . . . . . . . . . . . . . . . . . . . . . . . . . . . . . . . . . . . . . 10
3.1 Program Governance . . . . . . . . . . . . . . . . . . . . . . . . . . . . . . . . . . . . . . . . 10
3.2 C-Level Executive With Ultimate Reporting Responsibility . . . . . . . . . . . . . 11
3.3 BCM Program Leader . . . . . . . . . . . . . . . . . . . . . . . . . . . . . . . . . . . . . . . . 12
3.4 Resource Management (Headcount, Budget and Training) . . . . . . . . . . . . . 14
3.5 Potential Operational Risks & Impact Of Adverse Events . . . . . . . . . . . . . . 15
3.6 Program Execution & Performance . . . . . . . . . . . . . . . . . . . . . . . . . . . . . . 16
3.7 Leveraging Standards To Support The Program . . . . . . . . . . . . . . . . . . . . . 18
3.8 Integration With Other Disciplines . . . . . . . . . . . . . . . . . . . . . . . . . . . . . . 18
3.9 Integration With Third Parties . . . . . . . . . . . . . . . . . . . . . . . . . . . . . . . . . . 19
3.10 Use Of Software . . . . . . . . . . . . . . . . . . . . . . . . . . . . . . . . . . . . . . . . . . . 20
3.11 IT Recovery Strategy & Disaster Recovery Capabilities . . . . . . . . . . . . . . . . 21
3.12 Cloud Applications . . . . . . . . . . . . . . . . . . . . . . . . . . . . . . . . . . . . . . . . . 22
3.13 Mobility Applications & Bring Your Own Device (BYOD) . . . . . . . . . . . . . . . 23
3.14 Social Media Integration . . . . . . . . . . . . . . . . . . . . . . . . . . . . . . . . . . . . . 23
3.15 Cybersecurity Integration . . . . . . . . . . . . . . . . . . . . . . . . . . . . . . . . . . . . . 24
4 . Closing Thoughts . . . . . . . . . . . . . . . . . . . . . . . . . . . . . . . . . . . . . . . . . . . . . . . . . 25
5 . Requests For Benchmarking Reports & Key Contact . . . . . . . . . . . . . . . . . . . . . . 26
3
About This Report
Statistics used in this report are based on anonymous survey responses from executives in public and private companies, government agencies and authorities, educational institutions and not-for-profit entities.
The online survey, conducted by Continuity Insights, explores changes to the global risk landscape, regulatory requirements and supply chain interdependencies, and compares the programs of orga-nizations with a steering committee in place against those without a steering committee in place, highlighting some dramatic differences.
This Report is based on and generated from the KPMG LLP sponsored survey entitled: The 2013-2014 Continuity Insights and KPMG LLP Global Business Continuity Management (BCM) Program Benchmarking Study.
Research Methodology
Respondents for The 2013-2014 Continuity Insights and KPMG LLP Global Business ContinuityManagement (BMC) Program Benchmarking Study were obtained from the Continuity Insights subscriber base by way of its newsletter, website, email deployments and social media channels, as well as from other professional organizations that supported the study. The 20-minute online survey included 55 questions and was fielded from January 2014 to February 2014. Information was collected from 434 respondents, of which 305 respondents completed the entire survey.
The information contained herein is of a general nature and is not intended to address the cir-cumstances of any particular individual or entity. Although Continuity Insights endeavor to provide accurate and timely information, there can be no guarantee that such information is accurate as of the date it is received or that it will continue to be accurate in the future. No one should act on such information without appropriate professional advice after a thorough examination of the particular situation. For more information on the study methodology, please contact Robert Nakao at [email protected].
About Continuity Insights
Continuity Insights is business continuity from management’s perspective. It speaks directly to the strategic view, embracing the issues and concerns of senior-level managers. With its results-orient-ed approach, Continuity Insights is a discussion of the “why’s” of business continuity and offers a comprehensive review of the vast continuity landscape. Its audience represents a wide range of businesses and industries, government and other public sector entities, and serves an array of profes-sional disciplines. It’s highly specialized portfolio includes Continuity Insights online/electronic media including its highly-trafficked website, e-Newsletters, webinars, and research project; and its annual Continuity Insights Management Conference and regional events.
Benchmarking has been
around for a long time,
without really catching too
much attention beyond
the U.S. It seems that there
is now an ever-increasing
demand for metrics to
justify BCM programs and
establish value for money.
Benchmarking does help
ensure that organizations
are comparing ‘like for
like’ rather than arbitrary
numbers based on largely
inappropriate ratios
(percentage of sales or
IT spend etc.). In terms
of the survey it is no
surprise that those with
steering committees are
much more interested in
benchmarking as it helps
them compare against
those similar companies in
their sector.”— Lyndon Bird,
Technical Director, The BCI
“
4
About KPMG LLP
KPMG LLP, the audit, tax and advisory firm www.kpmg.com/us, is the U.S. member firm of KPMG Interna-tional Cooperative (“KPMG International”). KPMG International’s member firms have 155,000 profes-sionals, including more than 8,600 partners, in 155 countries. The KPMG name, logo and “cutting through complexity” are registered trademarks of KPMG International.
KPMG Information Protection and Business Resilience services help clients effectively manage and control corporate information assets across a broad spectrum of evolving threats and scenarios. Companies today increasingly realize that security is not a one-time project, but instead a strate-gy that must be adaptive to changing threats, remain consistent with the organization’s business initiatives, and deliver benefits such as manageability, assurance, and efficiency. We help compa-nies identify their most important information assets, and work with them to develop an effective approach combining technology and business processes. We work with clients to maximize the value that can be obtained from their data while protecting key business processes, information assets, and the company’s brand and reputation.
To learn more about KPMG’s Information Protection and Business Resilience, please contact:
Greg BellNational Practice Leader,Information Protection and Business ResilienceKPMG LLPT: 404 222 7197E: [email protected]
Anthony BuffomantePrincipal, AdvisoryInformation Protection and Business ResilienceKPMG LLPT: 312 665 1748E: [email protected]
Robbie AtabaigiManager, AdvisoryInformation Protection and Business ResilienceKPMG LLPT: 404 222 3257E: [email protected]
Acknowledgments
Continuity Insights and KPMG LLP would like to acknowledge the following organizations for their contributions in helping raise the awareness — and hence the value — of this study.
In addition, we would like to acknowledge the subject-matter professionals who provided their point of view for use in this report, the companion article, the panel discussion at the 2014 Continuity Insights Management Conference and the June 2014 webinar.
A fully integrated BCM
program must engage
and collaborate with all
relevant stakeholders,
both internal and
external. Another
outcome of the survey
is that where a senior
management advisory
or steering committee
exists, this is most likely
to happen. From my
experience the most
effective BCM programs
thrived where a head
of BCM had assembled
the right advisory or
steering committee
representatives…”— Steve Mellish, Chairman, The BCI
“
• Association Of Contingency Planners (ACP)• Association Of Sacramento Area Planners (ASAP)• BC Management• BCI-USA• Business Continuity Institute (BCI) (UK)• Business & Industry Council For Emergency Plan-
ning & Preparedness (BICEPP)• Business Resumption Planners Association (BRPA)• Canadian Security Partners’ Forum• Contingency Planners Of Ohio (CPO)• Contingency Planning Exchange (CPE)• Continuity Central• DRI International
• Disaster Recovery Journal (DRJ)• Disaster Resource Guide• Forbes Calamity Prevention (Singapore/Asia)• Global Conference On Disaster Management• Mid Atlantic Disaster Recovery Association
(MADRA)• New England Disaster Recovery Information
Exchange (NEDRIX)• Risk & Insurance Management Society (RIMS)• Rothstein Business Survival• Southeastern Business Recovery Exchange (SEBRE)• Southeastern Contingency Planners Association
(SCPA)
5
1. Executive Summary
As the intricacies of risk evolve at an ever-rapid pace, business continuity management (BCM) programs need to address a wide range of threats, including natural disasters, technology issues and manmade incidents, while also aligning with their organization’s strategic goals.
The 2013-2014 Continuity Insights & KPMG LLP Global Business Continuity Management Program Benchmarking Study is a comprehensive look at the current state of BCM programs and the drivers for further program development. This year, we have chosen to compare and contrast certain study results in this final report and in additional custom reports. For instance, this year’s study highlights the business value for having a senior management advisory or steering committee in place to help drive program capabilities and effectiveness. To that end, we have compared and contrasted data from organizations that have a steering committee in place against those that do not have a steering committee in place.
The survey serves as an indication of how BCM programs and program capabilities have changed over the years, and highlights evolving trends that are impacting BCM programs. Readers of this report and the associated custom reports should consider using the reports to target underdevel-oped capabilities within their own BCM program and also increase their awareness of BCM program trends that are being addressed and reported by other organizations.
In addition to the report, readers can view the full collection of survey responses and various custom reports that are based on the following criteria on the Continuity Insights website: www.continuityinsights.com: • Annual revenue • Entity type (public companies, private companies, government agencies or authorities, and
not-for-profits) • Governance (Entities with an Advisory Steering Committee, Entities with no Advisory
Steering Committee) • Industries (Computers/IT hardware, software and services; Financial services; Government;
Healthcare; Manufacturing; Professional services and Utilities) • Number of employees
Since 26% of the
respondents will use the
survey results to generate
executive support and
74% will not, nearly 3/4
of the respondents may
not be using a variety
of methods to improve
the odds for continued
success. Since our industry
is growing in business
value exponentially, it may
be wise to review and use
multiple ways to state your
business case, continue to
build the importance of
and show business value
in your BC process” — Mike Janko,
Manager, Global Business Continuity,
The Goodyear Tire & Rubber Co.
“
6
2. Respondent Profiles
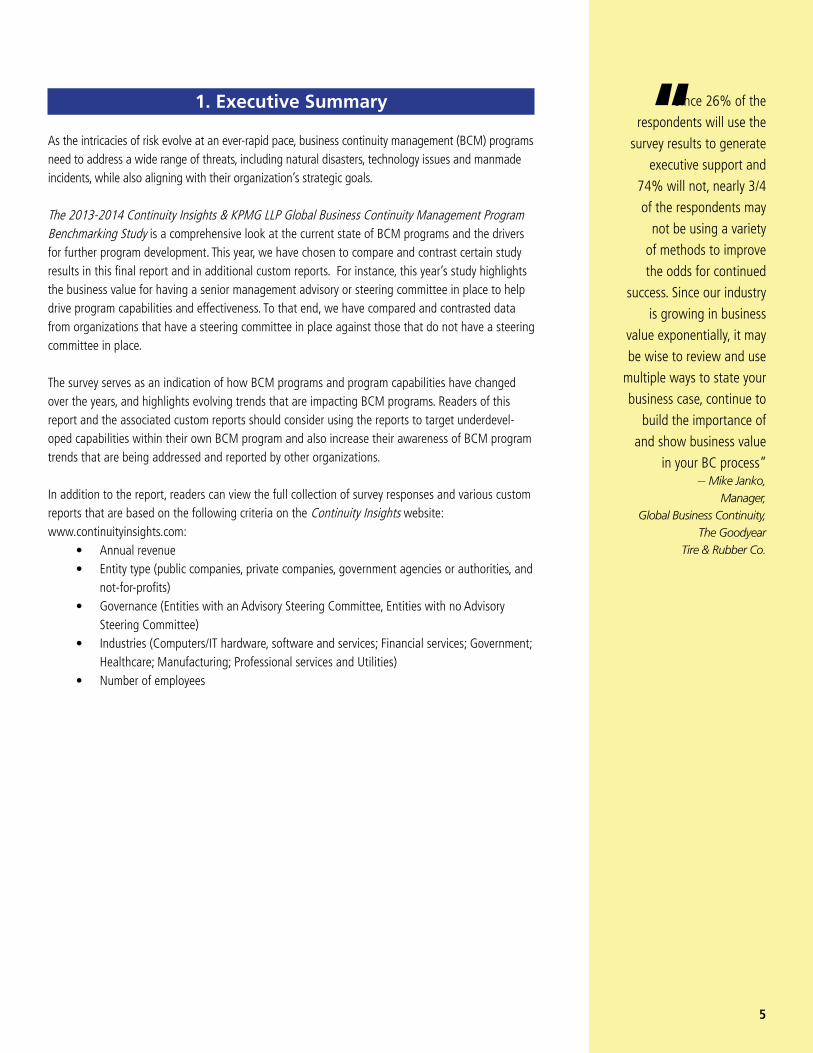
2 .1 .1 Type Of Entity Or Enterprise
This survey showed a higher percentage of public company respondents (+6%) and lower percent-age (-4%) of privately held companies compared to The 2011-2012 Global Business Continuity Management (BCM) Program Benchmarking Study.
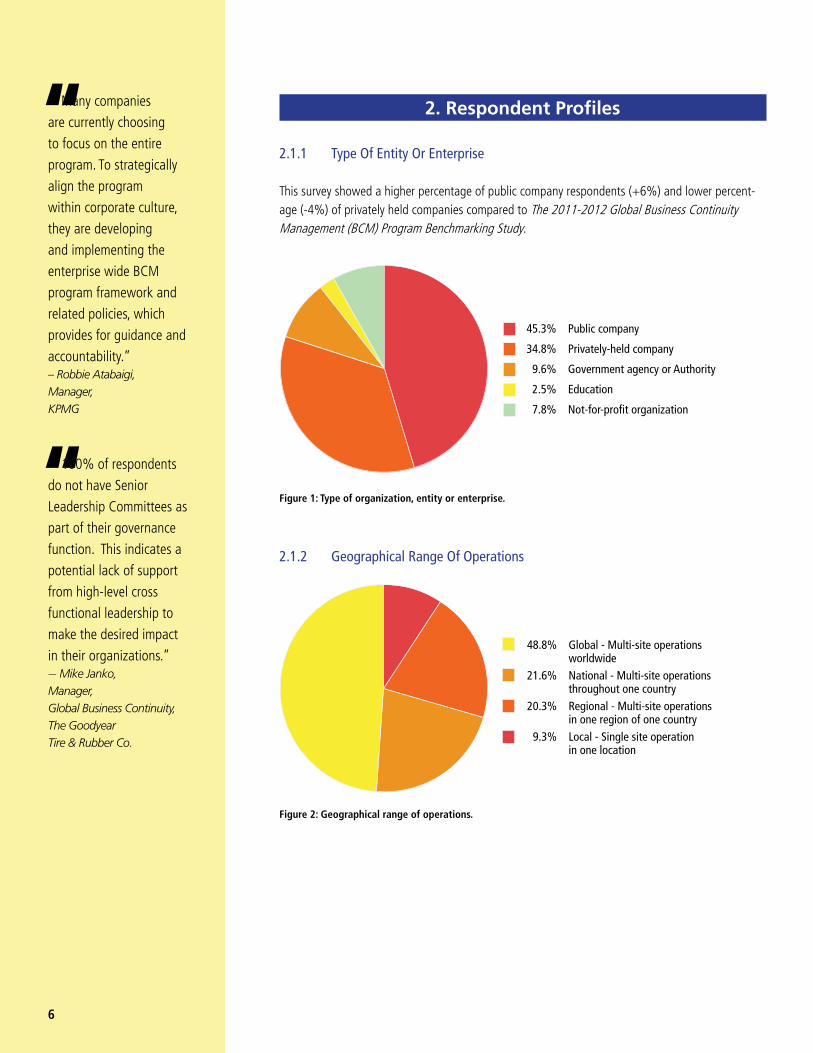
2 .1 .2 Geographical Range Of Operations
7.8% Not-for-profit organization
2.5% Education
9.6% Government agency or Authority
34.8% Privately-held company
45.3% Public company
Figure 1: Type of organization, entity or enterprise.
48.8% Global - Multi-site operations worldwide 21.6% National - Multi-site operations throughout one country 20.3% Regional - Multi-site operations in one region of one country 9.3% Local - Single site operation in one location
Figure 2: Geographical range of operations.
Many companies
are currently choosing
to focus on the entire
program. To strategically
align the program
within corporate culture,
they are developing
and implementing the
enterprise wide BCM
program framework and
related policies, which
provides for guidance and
accountability.” – Robbie Atabaigi, Manager, KPMG
100% of respondents
do not have Senior
Leadership Committees as
part of their governance
function. This indicates a
potential lack of support
from high-level cross
functional leadership to
make the desired impact
in their organizations.” — Mike Janko, Manager, Global Business Continuity, The Goodyear Tire & Rubber Co.
“
“
I believe all programs
should use benchmark
data for identifying and
analyzing performance.” – Ken Otis,
Director, Business Continuity
Management, CVS Caremark
7
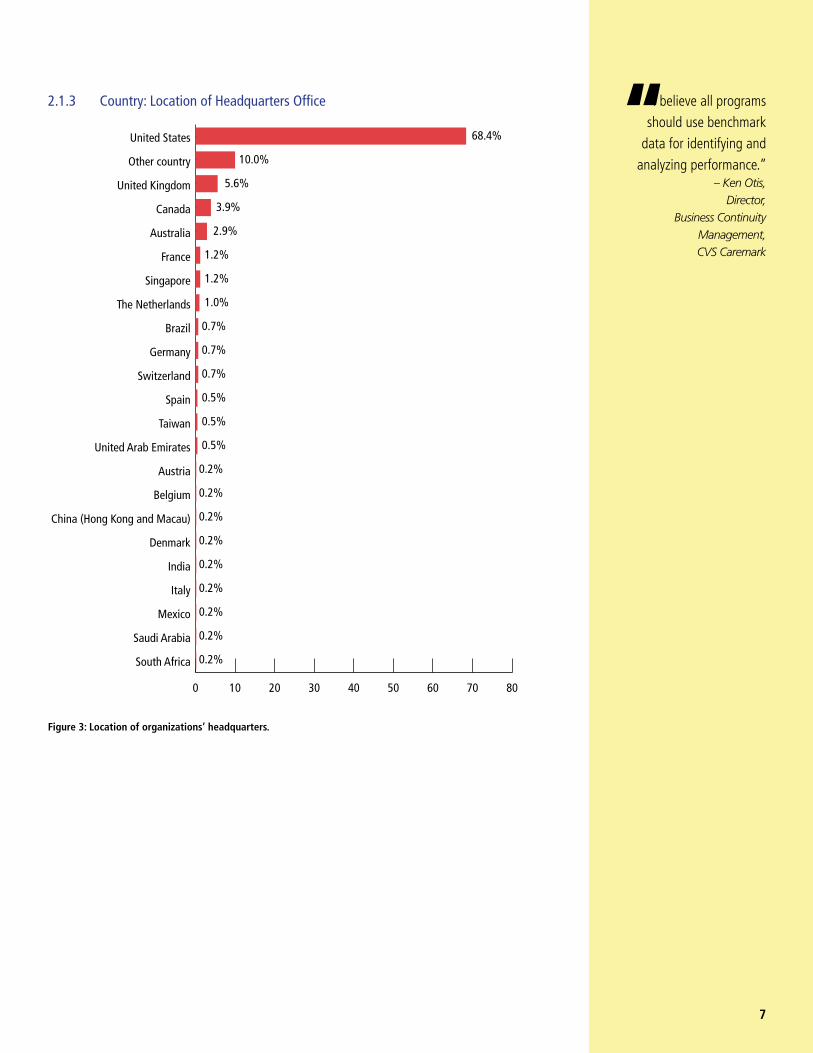
2 .1 .3 Country: Location of Headquarters Office
68.4%
10.0%
5.6%
3.9%
2.9%
1.2%
1.2%
1.0%
0.7%
0.7%
0.7%
0.5%
0.5%
0.5%
0.2%
0.2%
0.2%
0.2%
0.2%
0.2%
0.2%
0.2%
0.2%
0 10 20 30 40 50 60 70 80
South Africa
Saudi Arabia
Mexico
Italy
India
Denmark
China (Hong Kong and Macau)
Belgium
Austria
United Arab Emirates
Taiwan
Spain
Switzerland
Germany
Brazil
The Netherlands
Singapore
France
Australia
Canada
United Kingdom
Other country
United States
Figure 3: Location of organizations’ headquarters.
“
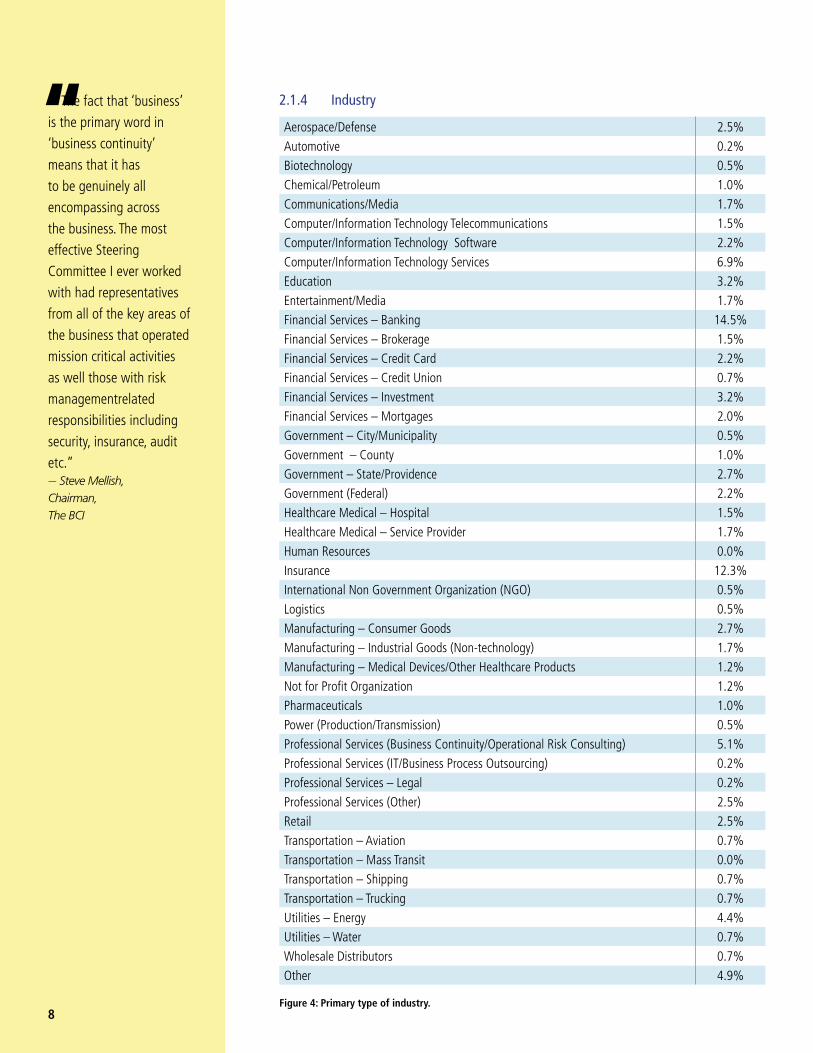
8Figure 4: Primary type of industry.
Aerospace/Defense 2.5%Automotive 0.2%Biotechnology 0.5%Chemical/Petroleum 1.0%Communications/Media 1.7%Computer/Information Technology Telecommunications 1.5%Computer/Information Technology Software 2.2%Computer/Information Technology Services 6.9%Education 3.2%Entertainment/Media 1.7%Financial Services – Banking 14.5%Financial Services – Brokerage 1.5%Financial Services – Credit Card 2.2%Financial Services – Credit Union 0.7%Financial Services – Investment 3.2%Financial Services – Mortgages 2.0%Government – City/Municipality 0.5%Government – County 1.0%Government – State/Providence 2.7%Government (Federal) 2.2%Healthcare Medical – Hospital 1.5%Healthcare Medical – Service Provider 1.7%Human Resources 0.0%Insurance 12.3%International Non Government Organization (NGO) 0.5%Logistics 0.5%Manufacturing – Consumer Goods 2.7%Manufacturing – Industrial Goods (Non-technology) 1.7%Manufacturing – Medical Devices/Other Healthcare Products 1.2%Not for Profit Organization 1.2%Pharmaceuticals 1.0%Power (Production/Transmission) 0.5%Professional Services (Business Continuity/Operational Risk Consulting) 5.1%Professional Services (IT/Business Process Outsourcing) 0.2%Professional Services – Legal 0.2%Professional Services (Other) 2.5%Retail 2.5%Transportation – Aviation 0.7%Transportation – Mass Transit 0.0%Transportation – Shipping 0.7%Transportation – Trucking 0.7%Utilities – Energy 4.4%Utilities – Water 0.7%Wholesale Distributors 0.7%Other 4.9%
2 .1 .4 Industry The fact that ‘business’
is the primary word in
‘business continuity’
means that it has
to be genuinely all
encompassing across
the business. The most
effective Steering
Committee I ever worked
with had representatives
from all of the key areas of
the business that operated
mission critical activities
as well those with risk
managementrelated
responsibilities including
security, insurance, audit
etc.” — Steve Mellish, Chairman, The BCI
“
Respondents to the
2013-2014 BCM Program
Benchmarking Study
seem to indicate that in
programs that are subject
to a governance structure
or have program oversight
may have better results
than those that are not
formally looked over.
Specifically, Question 53
asked ‘For which of the
following capabilities do
your IT Disaster Recovery
Plans have documented
procedures and written
guidelines?’ When
the notion of a Senior
Management Advisory
or Steering Committee is
introduced, respondents
replied much differently.
In a number of areas such
as supply chain, cloud
applications and social
media we see a positive
spread (13 to 5 points)
indicating that oversight
has positive effects on
programs.” — Mike Jennings,
Senior Director, Disaster Readiness
Program Office, Blue Cross Blue Shield Of
Massachusetts
9
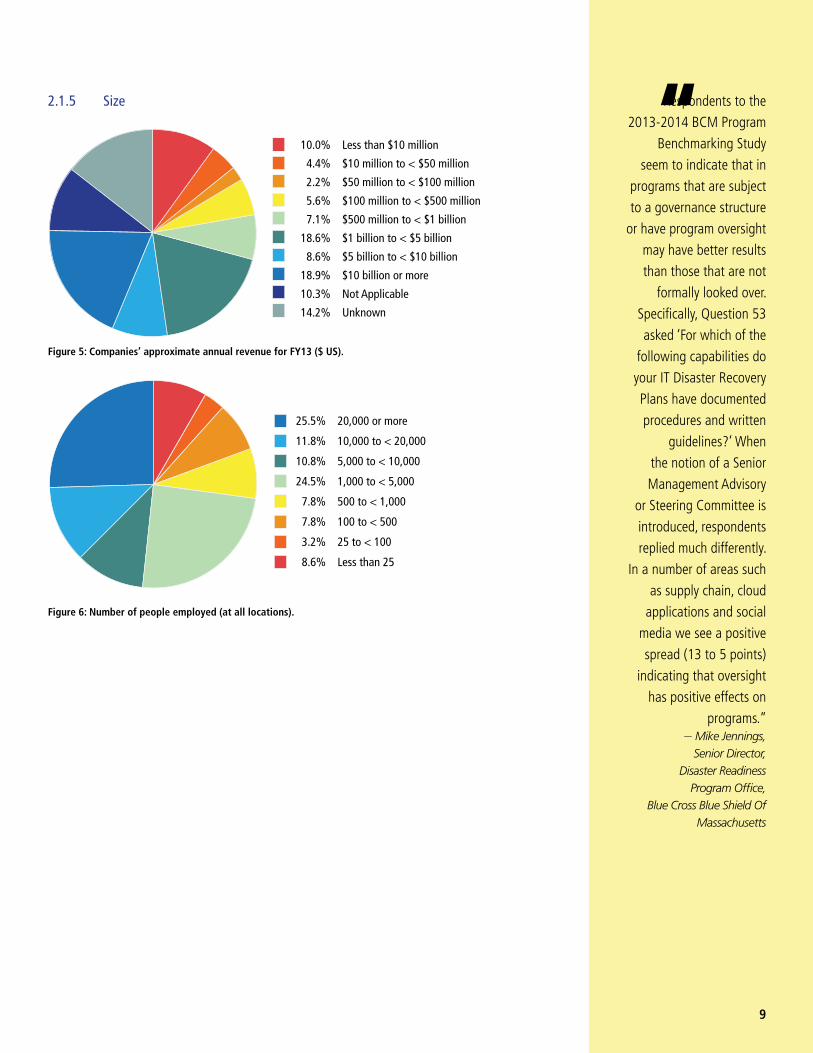
2 .1 .5 Size
10.0% Less than $10 million
4.4% $10 million to < $50 million
2.2% $50 million to < $100 million
5.6% $100 million to < $500 million
7.1% $500 million to < $1 billion
18.6% $1 billion to < $5 billion
8.6% $5 billion to < $10 billion
18.9% $10 billion or more
10.3% Not Applicable
14.2% Unknown
Figure 5: Companies’ approximate annual revenue for FY13 ($ US).
25.5% 20,000 or more
11.8% 10,000 to < 20,000
10.8% 5,000 to < 10,000
24.5% 1,000 to < 5,000
7.8% 500 to < 1,000
7.8% 100 to < 500
3.2% 25 to < 100
8.6% Less than 25
Figure 6: Number of people employed (at all locations).
“
There is significant value
in having a governance
committee that guides,
supports and holds the
BCM team accountable.
Many of the survey results
support advancement
or improvement in
key BCM areas over
previous surveys with the
engagement of a steering
committee.” – Chris Summerrow, Director, Business Continuity Management, UPS
The establishment of an
advisory board or steering
committee is essential
to a program’s success,
especially at the onset of
the program. They should
meet at least quarterly to
monitor the success of the
program implementation
and to help obtain support
where there may be
challenges.” – Ken Otis, Director, Business Continuity Management, CVS Caremark
“
“
10
3. Survey Results
3.1 Program GovernanceIn response to the question “Does your organization have a Senior Management Advisory or Steer-ing Committee that provides input and assistance to the BCM Program Coordinator and Team in the preparation, implementation, evaluation and revision of the program?”
• 71% said Yes (vs. 65% in 2011-2012) • 29% said No (vs. 35% in 2011-2012)
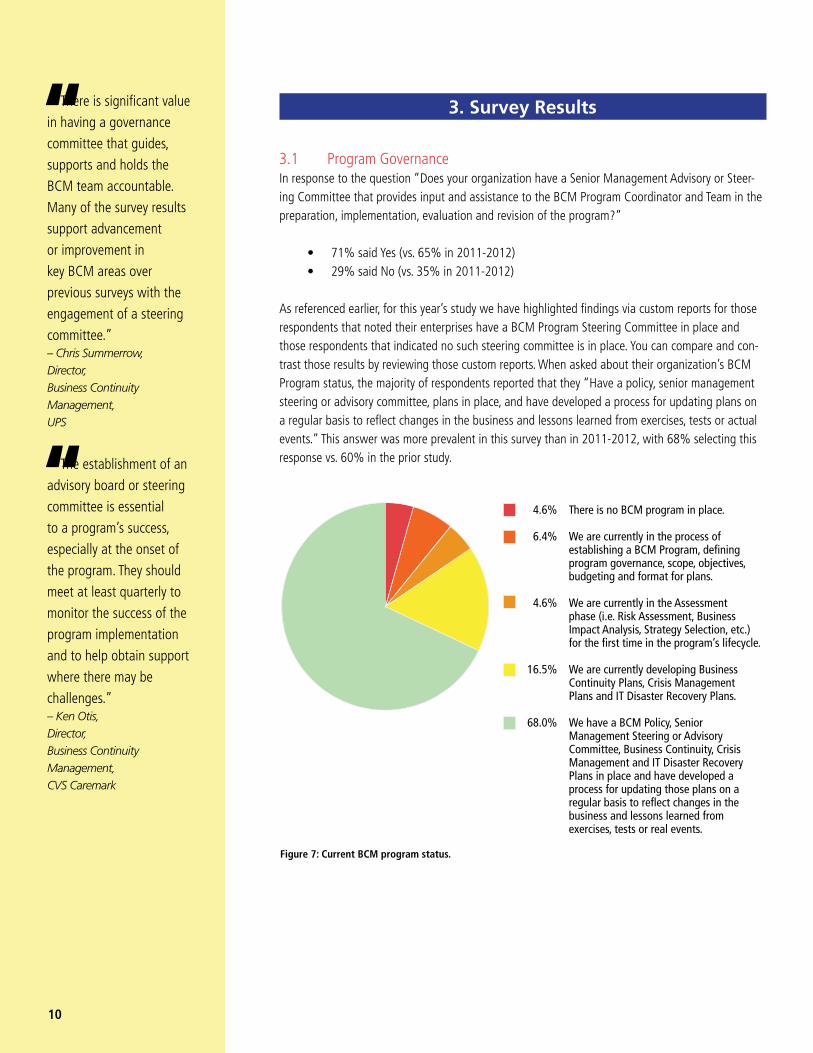
As referenced earlier, for this year’s study we have highlighted findings via custom reports for those respondents that noted their enterprises have a BCM Program Steering Committee in place and those respondents that indicated no such steering committee is in place. You can compare and con-trast those results by reviewing those custom reports. When asked about their organization’s BCM Program status, the majority of respondents reported that they “Have a policy, senior management steering or advisory committee, plans in place, and have developed a process for updating plans on a regular basis to reflect changes in the business and lessons learned from exercises, tests or actual events.” This answer was more prevalent in this survey than in 2011-2012, with 68% selecting this response vs. 60% in the prior study.
Figure 7: Current BCM program status.
4.6% There is no BCM program in place. 6.4% We are currently in the process of establishing a BCM Program, defining program governance, scope, objectives, budgeting and format for plans. 4.6% We are currently in the Assessment phase (i.e. Risk Assessment, Business Impact Analysis, Strategy Selection, etc.) for the first time in the program’s lifecycle. 16.5% We are currently developing Business Continuity Plans, Crisis Management Plans and IT Disaster Recovery Plans. 68.0% We have a BCM Policy, Senior Management Steering or Advisory Committee, Business Continuity, Crisis Management and IT Disaster Recovery Plans in place and have developed a process for updating those plans on a regular basis to reflect changes in the business and lessons learned from exercises, tests or real events.
Certification status
continues to the rise…
Most organizations
value confirmation of
knowledge in our industry.
Certification provides
distinction from the
general practitioner to a
recognized subject-matter
expert.” – Chris Summerrow,
Director, Business Continuity
Management, UPS
I am especially pleased
to see the overall
apparent increase in the
number of professionals
with certifications who
responded to the survey…
In general, I believe we
collectively should hold
ourselves to ever higher
standards. Our work is
critical and deserves the
best in the way of skills for
execution.” – Doug Weldon,
President, The BCI – USA
“
“
11
3.2 C-Level Executive With Ultimate Reporting Responsibility
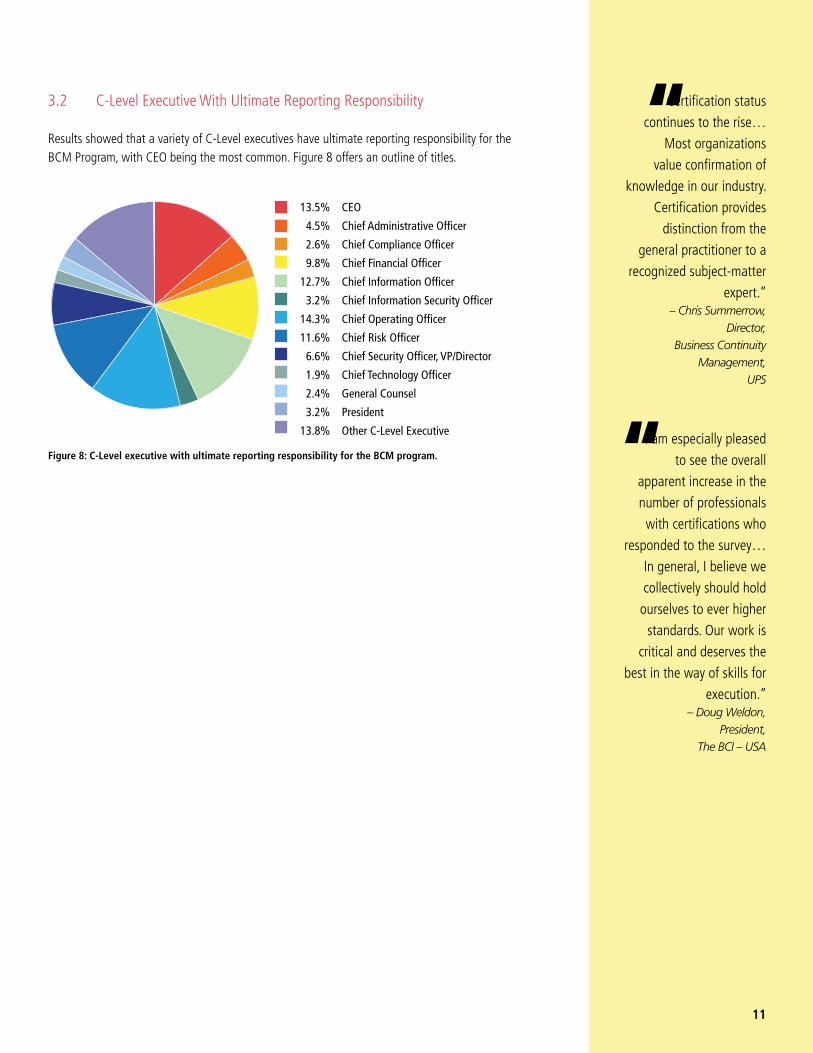
Results showed that a variety of C-Level executives have ultimate reporting responsibility for the BCM Program, with CEO being the most common. Figure 8 offers an outline of titles.
Figure 8: C-Level executive with ultimate reporting responsibility for the BCM program.
13.5% CEO
4.5% Chief Administrative Officer
2.6% Chief Compliance Officer
9.8% Chief Financial Officer
12.7% Chief Information Officer
3.2% Chief Information Security Officer
14.3% Chief Operating Officer
11.6% Chief Risk Officer
6.6% Chief Security Officer, VP/Director
1.9% Chief Technology Officer
2.4% General Counsel
3.2% President
13.8% Other C-Level Executive
It is very clear
certification is considered
a positive step, since
more than 50% of
respondents have
organizations desiring DRI
certification, 34% desiring
BCI certification and
others also interested in
certification.”– Mike Janko, Manager, Global Business Continuity, The Goodyear Tire & Rubber Co.
“
12
3.3 BCM Program Leader
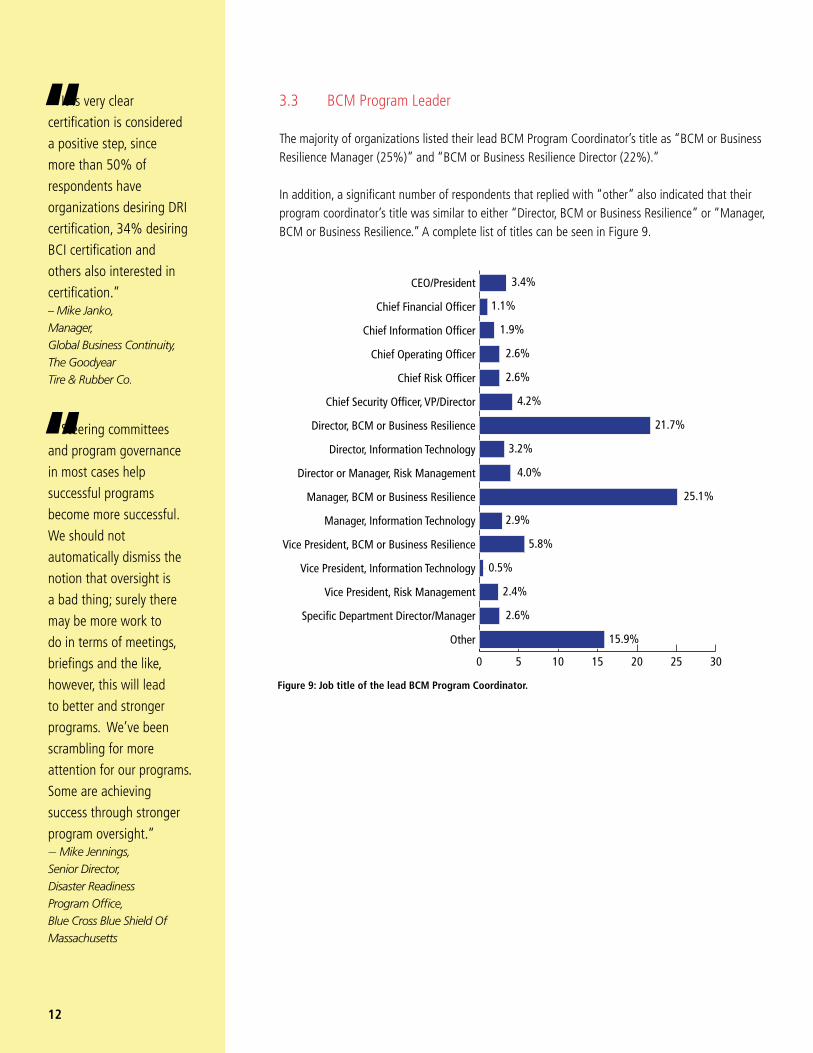
The majority of organizations listed their lead BCM Program Coordinator’s title as “BCM or Business Resilience Manager (25%)” and “BCM or Business Resilience Director (22%).”
In addition, a significant number of respondents that replied with “other” also indicated that their program coordinator’s title was similar to either “Director, BCM or Business Resilience” or “Manager, BCM or Business Resilience.” A complete list of titles can be seen in Figure 9.
Steering committees
and program governance
in most cases help
successful programs
become more successful.
We should not
automatically dismiss the
notion that oversight is
a bad thing; surely there
may be more work to
do in terms of meetings,
briefings and the like,
however, this will lead
to better and stronger
programs. We’ve been
scrambling for more
attention for our programs.
Some are achieving
success through stronger
program oversight.” — Mike Jennings, Senior Director, Disaster Readiness Program Office, Blue Cross Blue Shield Of Massachusetts
“
Figure 9: Job title of the lead BCM Program Coordinator.
3.4%
1.1%
1.9%
2.6%
2.6%
4.2%
21.7%
3.2%
4.0%
25.1%
2.9%
5.8%
0.5%
2.4%
2.6%
15.9%
0 5 10 15 20 25 30
Other
Specific Department Director/Manager
Vice President, Risk Management
Vice President, Information Technology
Vice President, BCM or Business Resilience
Manager, Information Technology
Manager, BCM or Business Resilience
Director or Manager, Risk Management
Director, Information Technology
Director, BCM or Business Resilience
Chief Security Officer, VP/Director
Chief Risk Officer
Chief Operating Officer
Chief Information Officer
Chief Financial Officer
CEO/President
For any organization
looking to implement or
maintain a good quality
BCM program it should
undoubtedly be seeking
the services of a suitably
certified professional.
In terms of business
continuity there are really
only two shows in town,
the DRII and the BCI. The
DRII will be most well-
known and established
in the U.S. whereas the
BCI has a more global
presence.” – Steve Mellish,
Chairman, The BCI
“
13
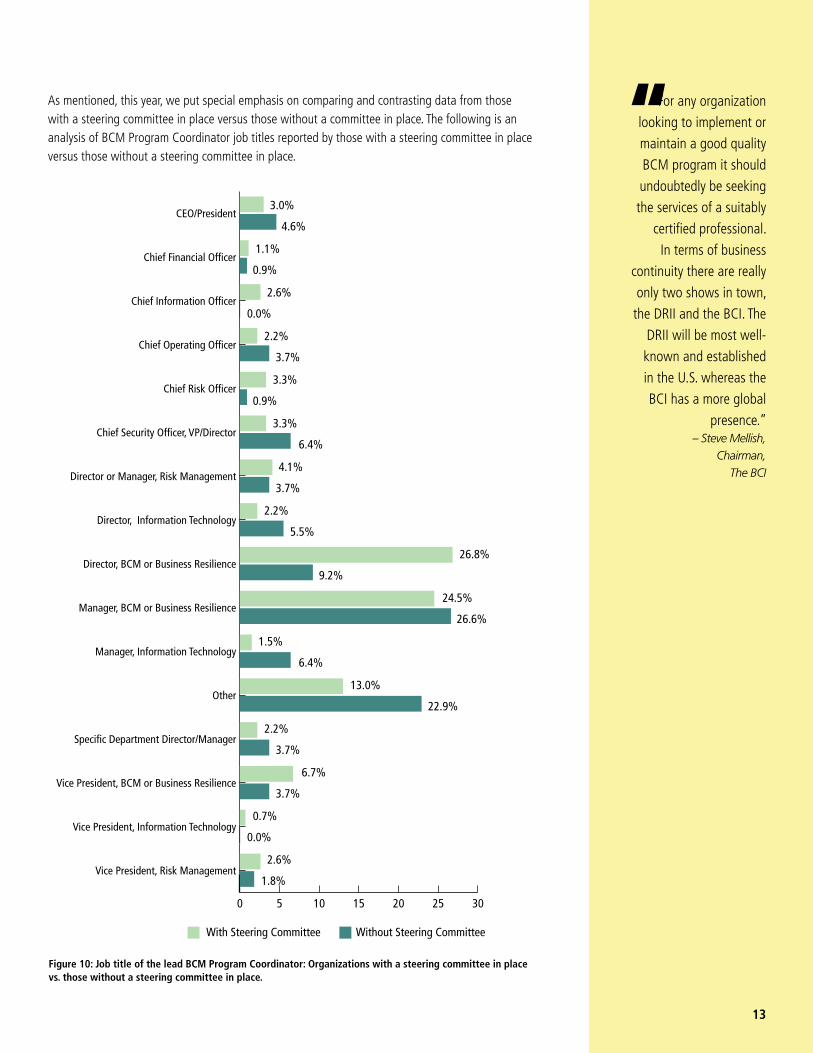
Figure 10: Job title of the lead BCM Program Coordinator: Organizations with a steering committee in place vs. those without a steering committee in place.
As mentioned, this year, we put special emphasis on comparing and contrasting data from those with a steering committee in place versus those without a committee in place. The following is an analysis of BCM Program Coordinator job titles reported by those with a steering committee in place versus those without a steering committee in place.
3.0%
4.6%
1.1%
0.9%
2.6%
0.0%
2.2%
3.7%
3.3%
0.9%
3.3%
6.4%
4.1%
3.7%
2.2%
5.5%
26.8%
9.2%
24.5%
26.6%
1.5%
6.4%
13.0%
22.9%
2.2%
3.7%
6.7%
3.7%
0.7%
0.0%
2.6%
1.8%
With Steering Committee Without Steering Committee
0 5 10 15 20 25 30
Vice President, Risk Management
Vice President, Information Technology
Vice President, BCM or Business Resilience
Specific Department Director/Manager
Other
Manager, Information Technology
Manager, BCM or Business Resilience
Director, BCM or Business Resilience
Director, Information Technology
Director or Manager, Risk Management
Chief Security Officer, VP/Director
Chief Risk Officer
Chief Operating Officer
Chief Information Officer
Chief Financial Officer
CEO/President
It is always important
to evaluate performance
against a standard,
against your peers. This
benchmarking study
allows for measuring
your own organizational
performance against
others. Internally
we conduct maturity
assessments to benchmark
our performance. And for
our organization, these
types of studies, whether
internal or external,
ignite good old fashioned
competition.” − Tonya T. York, VP, IT Service Continuity Management, McKesson Corp.
14
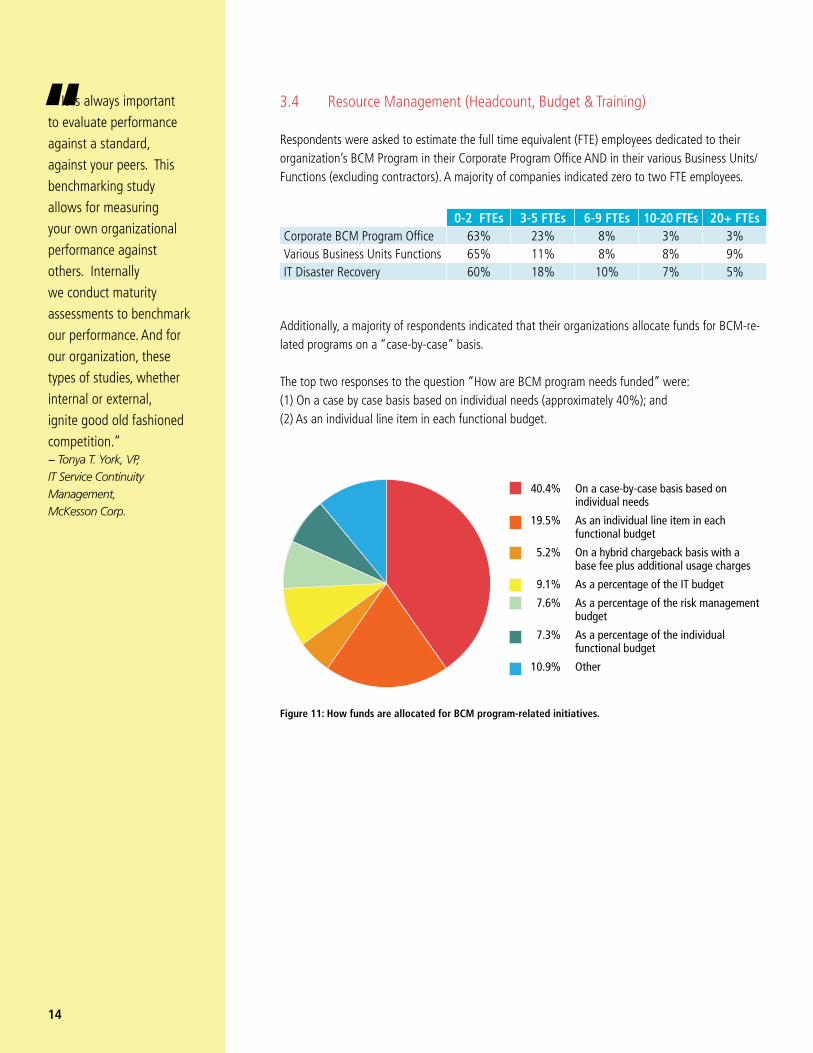
3.4 Resource Management (Headcount, Budget & Training)
Respondents were asked to estimate the full time equivalent (FTE) employees dedicated to their organization’s BCM Program in their Corporate Program Office AND in their various Business Units/Functions (excluding contractors). A majority of companies indicated zero to two FTE employees.
Additionally, a majority of respondents indicated that their organizations allocate funds for BCM-re-lated programs on a “case-by-case” basis.
The top two responses to the question “How are BCM program needs funded” were: (1) On a case by case basis based on individual needs (approximately 40%); and (2) As an individual line item in each functional budget.
40.4% On a case-by-case basis based on individual needs
19.5% As an individual line item in each functional budget
5.2% On a hybrid chargeback basis with a base fee plus additional usage charges
9.1% As a percentage of the IT budget
7.6% As a percentage of the risk management budget
7.3% As a percentage of the individual functional budget
10.9% Other
Figure 11: How funds are allocated for BCM program-related initiatives.
0-2 FTEs 3-5 FTEs 6-9 FTEs 10-20 FTEs 20+ FTEs Corporate BCM Program Office 63% 23% 8% 3% 3%Various Business Units Functions 65% 11% 8% 8% 9%IT Disaster Recovery 60% 18% 10% 7% 5%
“
15
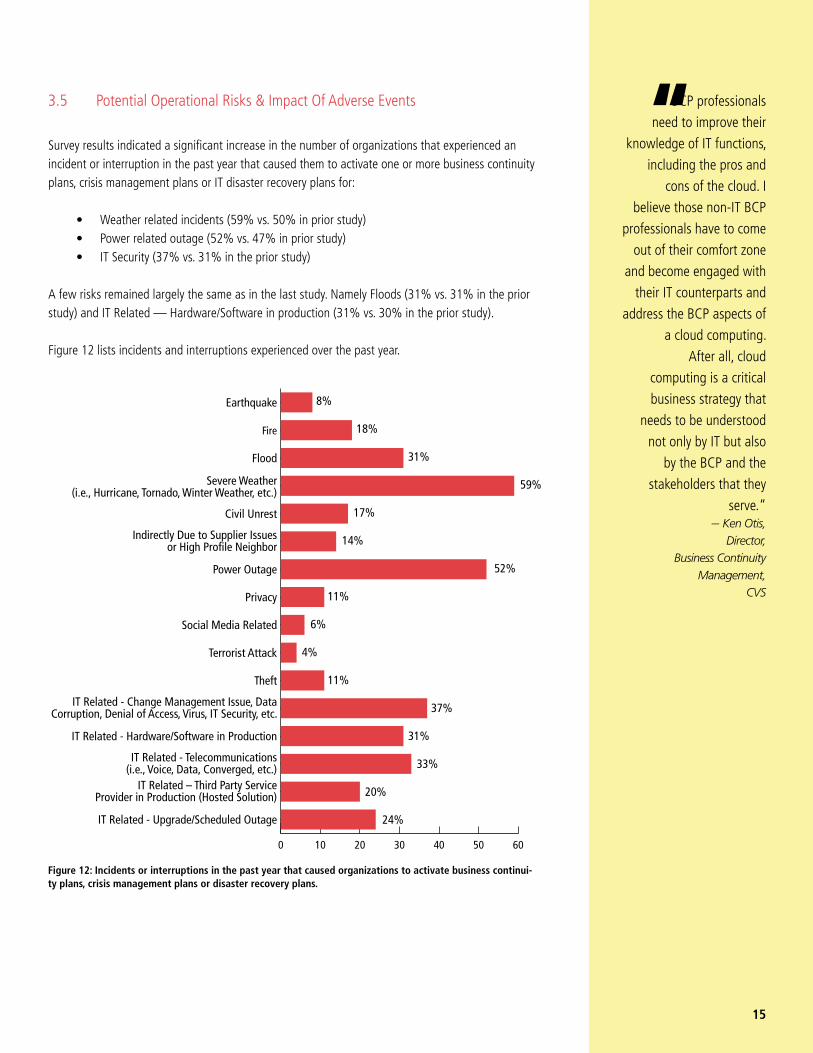
3.5 Potential Operational Risks & Impact Of Adverse Events
Survey results indicated a significant increase in the number of organizations that experienced an incident or interruption in the past year that caused them to activate one or more business continuity plans, crisis management plans or IT disaster recovery plans for:
• Weather related incidents (59% vs. 50% in prior study) • Power related outage (52% vs. 47% in prior study) • IT Security (37% vs. 31% in the prior study)
A few risks remained largely the same as in the last study. Namely Floods (31% vs. 31% in the prior study) and IT Related — Hardware/Software in production (31% vs. 30% in the prior study).
Figure 12 lists incidents and interruptions experienced over the past year.
8%
18%
31%
59%
17%
14%
52%
11%
6%
4%
11%
37%
31%
33%
20%
24%
0 10 20 30 40 50 60
IT Related - Upgrade/Scheduled Outage
IT Related – Third Party ServiceProvider in Production (Hosted Solution)
IT Related - Telecommunications(i.e., Voice, Data, Converged, etc.)
IT Related - Hardware/Software in Production
IT Related - Change Management Issue, DataCorruption, Denial of Access, Virus, IT Security, etc.
Theft
Terrorist Attack
Social Media Related
Privacy
Power Outage
Indirectly Due to Supplier Issuesor High Profile Neighbor
Civil Unrest
Severe Weather(i.e., Hurricane, Tornado, Winter Weather, etc.)
Flood
Fire
Earthquake
Figure 12: Incidents or interruptions in the past year that caused organizations to activate business continui-ty plans, crisis management plans or disaster recovery plans.
BCP professionals
need to improve their
knowledge of IT functions,
including the pros and
cons of the cloud. I
believe those non-IT BCP
professionals have to come
out of their comfort zone
and become engaged with
their IT counterparts and
address the BCP aspects of
a cloud computing.
After all, cloud
computing is a critical
business strategy that
needs to be understood
not only by IT but also
by the BCP and the
stakeholders that they
serve.“ — Ken Otis,
Director, Business Continuity
Management, CVS
“
Audit findings and
exercise/test results
continue to be the
measures of choice
for most BCMs. Given
the noted longevity of
programs and leadership
(more than 59% state
5-20 years in Q11and
Q21) and the self-reported
maturity (Q28 more that
78% claim level 3 or
greater), I would have
expected a greater than
25% response to Maturity
modeling in Q13. I am
surprised by the frequency
reported for BIA and
Risk Assessments given
the rate of change of
technology and threats.
BIA and Risk Assessments
should be moving more to
a perpetual model rather
than every 1-3 as noted. “— Tim Mathews, Executive Director, Enterprise Resiliency, Educational Testing Service (ETS)
“
16
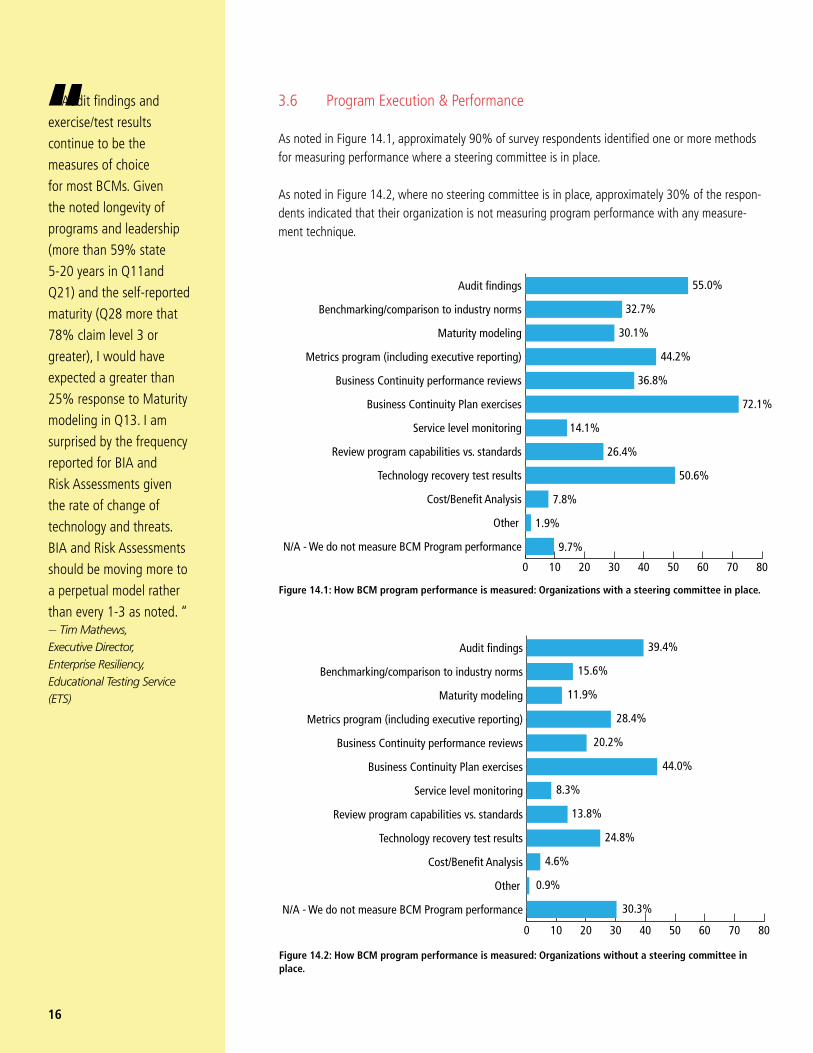
3.6 Program Execution & Performance
As noted in Figure 14.1, approximately 90% of survey respondents identified one or more methods for measuring performance where a steering committee is in place.
As noted in Figure 14.2, where no steering committee is in place, approximately 30% of the respon-dents indicated that their organization is not measuring program performance with any measure-ment technique.
Figure 14.2: How BCM program performance is measured: Organizations without a steering committee in place.
0 10 20 30 40 50 60 70 80
N/A - We do not measure BCM Program performance
Other
Cost/Benefit Analysis
Technology recovery test results
Review program capabilities vs. standards
Service level monitoring
Business Continuity Plan exercises
Business Continuity performance reviews
Metrics program (including executive reporting)
Maturity modeling
Benchmarking/comparison to industry norms
Audit findings 39.4%
15.6%
11.9%
28.4%
20.2%
44.0%
8.3%
13.8%
24.8%
4.6%
0.9%
30.3%
Figure 14.1: How BCM program performance is measured: Organizations with a steering committee in place.
0 10 20 30 40 50 60 70 80
N/A - We do not measure BCM Program performance
Other
Cost/Benefit Analysis
Technology recovery test results
Review program capabilities vs. standards
Service level monitoring
Business Continuity Plan exercises
Business Continuity performance reviews
Metrics program (including executive reporting)
Maturity modeling
Benchmarking/comparison to industry norms
Audit findings 55.0%
32.7%
30.1%
44.2%
36.8%
72.1%
14.1%
26.4%
50.6%
7.8%
1.9%
9.7%
17
In response to the question “For the most recent interruption that required you to activate one or more BCPs, how well were your Recovery Time Objectives (RTOs) met?, the results varied significantly when a senior management advisory or steering committee is in place compared to when a steering committee is not in place, with higher rates of success reported by those with a steering committee in place.
Steering Committee vs. No Steering Committee • Completely (38% vs. 21%) • Mostly (33% vs. 34%) • Somewhat (10% vs. 16%) • Not at all (4% vs. 5%) • Do not know (16% vs. 24%)
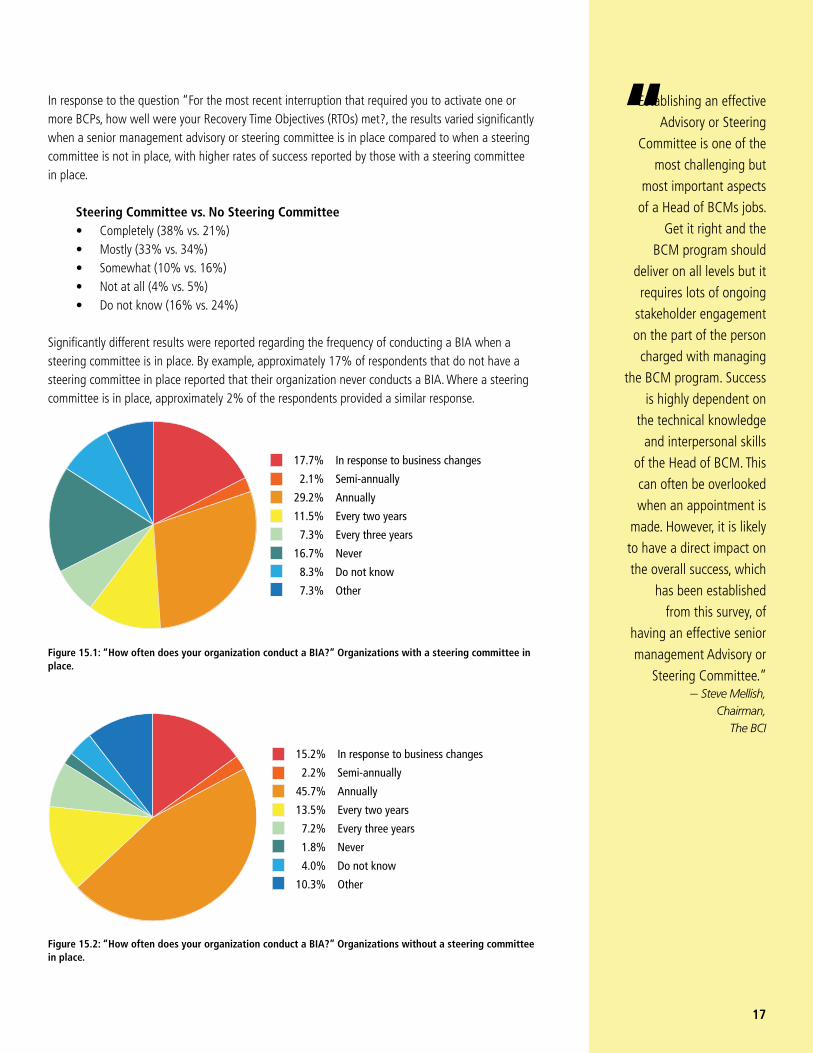
Significantly different results were reported regarding the frequency of conducting a BIA when a steering committee is in place. By example, approximately 17% of respondents that do not have a steering committee in place reported that their organization never conducts a BIA. Where a steering committee is in place, approximately 2% of the respondents provided a similar response.
17.7% In response to business changes
2.1% Semi-annually
29.2% Annually
11.5% Every two years
7.3% Every three years
16.7% Never
8.3% Do not know
7.3% Other
Figure 15.2: “How often does your organization conduct a BIA?” Organizations without a steering committee in place.
Figure 15.1: “How often does your organization conduct a BIA?” Organizations with a steering committee in place.
15.2% In response to business changes
2.2% Semi-annually
45.7% Annually
13.5% Every two years
7.2% Every three years
1.8% Never
4.0% Do not know
10.3% Other
Establishing an effective
Advisory or Steering
Committee is one of the
most challenging but
most important aspects
of a Head of BCMs jobs.
Get it right and the
BCM program should
deliver on all levels but it
requires lots of ongoing
stakeholder engagement
on the part of the person
charged with managing
the BCM program. Success
is highly dependent on
the technical knowledge
and interpersonal skills
of the Head of BCM. This
can often be overlooked
when an appointment is
made. However, it is likely
to have a direct impact on
the overall success, which
has been established
from this survey, of
having an effective senior
management Advisory or
Steering Committee.” — Steve Mellish,
Chairman, The BCI
“
It is not surprising
that the importance of
compliance to regulations
jumped to number two
among all reasons for
BCM, given the number
of responders from
regulated entities…It
is long overdue for our
professional organizations
to play a more key role in
guiding those regulations.” – Doug Weldon, President, The BCI – USA
[The results] show that
the influence of ISO 22301
is perhaps higher than
many might of thought in
North America. The rapid
decline in NFPA 1600 is
almost mirrored by the
growth in ISO 22301.” – Lyndon Bird, Technical Director, The BCI
Extremely surprised
and encouraged to see
that more than 42% of
respondents identified ISO
22301 as the standard
supporting their programs.
Given that the 2011-2012
survey combined response
for BS25999-2 and ASIS
BCM.01-2010 was only
16%. We’ve come a long
way in two years.”— Tim Mathews, Executive Director, Enterprise Resiliency, Educational Testing Service (ETS)
“
“
“
18
3.7 Leveraging Standards To Support The Program
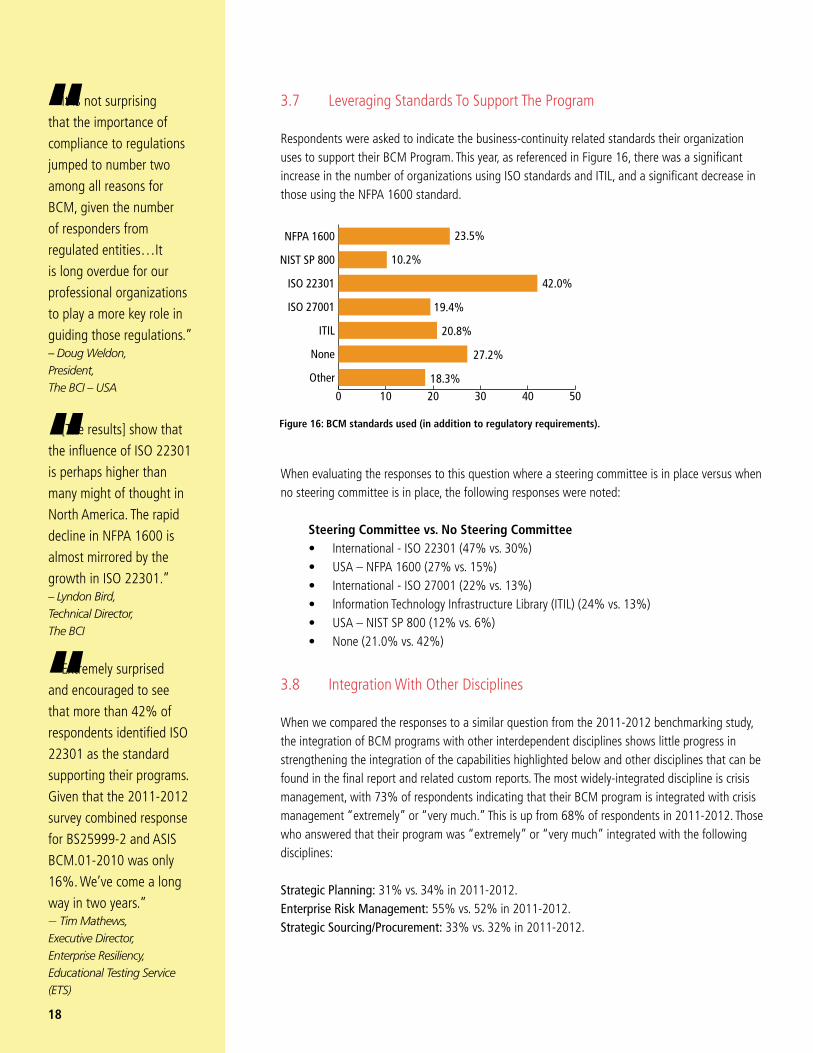
Respondents were asked to indicate the business-continuity related standards their organization uses to support their BCM Program. This year, as referenced in Figure 16, there was a significant increase in the number of organizations using ISO standards and ITIL, and a significant decrease in those using the NFPA 1600 standard.
When evaluating the responses to this question where a steering committee is in place versus when no steering committee is in place, the following responses were noted:
Steering Committee vs. No Steering Committee • International - ISO 22301 (47% vs. 30%) • USA – NFPA 1600 (27% vs. 15%) • International - ISO 27001 (22% vs. 13%) • Information Technology Infrastructure Library (ITIL) (24% vs. 13%) • USA – NIST SP 800 (12% vs. 6%) • None (21.0% vs. 42%)
3.8 Integration With Other Disciplines
When we compared the responses to a similar question from the 2011-2012 benchmarking study, the integration of BCM programs with other interdependent disciplines shows little progress in strengthening the integration of the capabilities highlighted below and other disciplines that can be found in the final report and related custom reports. The most widely-integrated discipline is crisis management, with 73% of respondents indicating that their BCM program is integrated with crisis management “extremely” or “very much.” This is up from 68% of respondents in 2011-2012. Those who answered that their program was “extremely” or “very much” integrated with the following disciplines:
Strategic Planning: 31% vs. 34% in 2011-2012. Enterprise Risk Management: 55% vs. 52% in 2011-2012.Strategic Sourcing/Procurement: 33% vs. 32% in 2011-2012.
Figure 16: BCM standards used (in addition to regulatory requirements).
0 10 20 30 40 50
Other
None
ITIL
ISO 27001
ISO 22301
NIST SP 800
NFPA 1600 23.5%
10.2%
42.0%
19.4%
20.8%
27.2%
18.3%
19
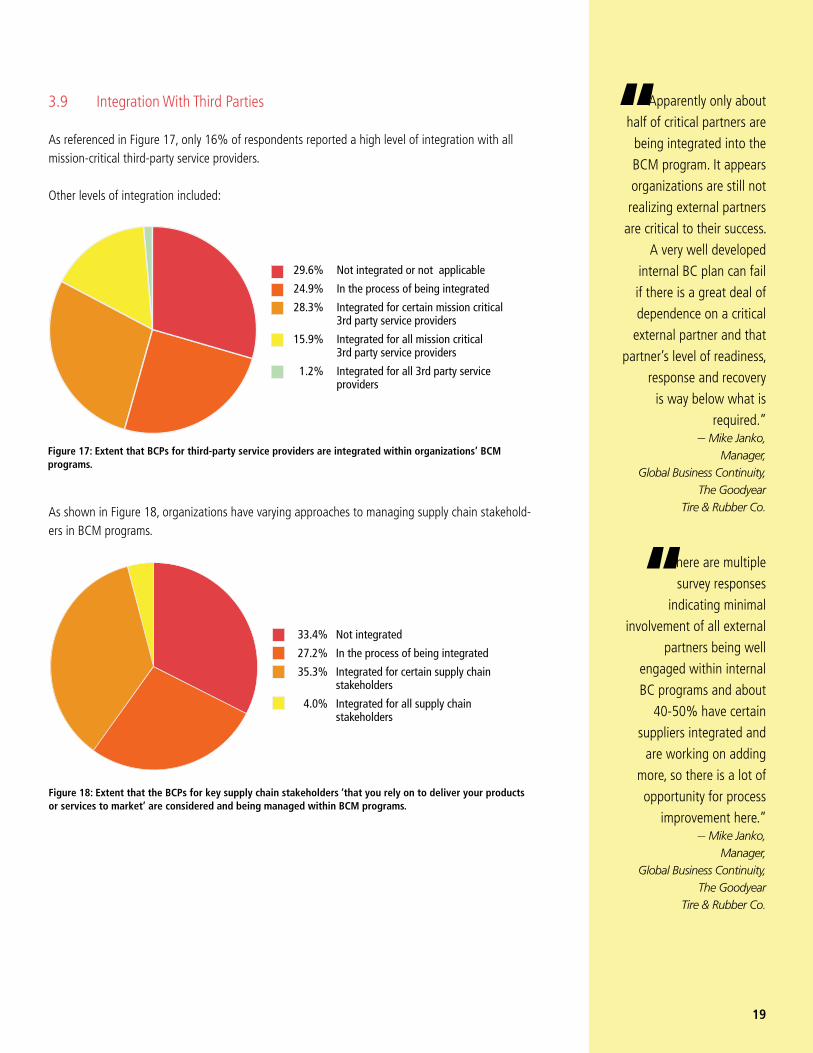
3.9 Integration With Third Parties
As referenced in Figure 17, only 16% of respondents reported a high level of integration with all mission-critical third-party service providers.
Other levels of integration included:
As shown in Figure 18, organizations have varying approaches to managing supply chain stakehold-ers in BCM programs.
Figure 18: Extent that the BCPs for key supply chain stakeholders ‘that you rely on to deliver your products or services to market’ are considered and being managed within BCM programs.
33.4% Not integrated
27.2% In the process of being integrated
35.3% Integrated for certain supply chain stakeholders
4.0% Integrated for all supply chain stakeholders
Figure 17: Extent that BCPs for third-party service providers are integrated within organizations’ BCM programs.
29.6% Not integrated or not applicable
24.9% In the process of being integrated
28.3% Integrated for certain mission critical 3rd party service providers
15.9% Integrated for all mission critical 3rd party service providers
1.2% Integrated for all 3rd party service providers
Apparently only about
half of critical partners are
being integrated into the
BCM program. It appears
organizations are still not
realizing external partners
are critical to their success.
A very well developed
internal BC plan can fail
if there is a great deal of
dependence on a critical
external partner and that
partner’s level of readiness,
response and recovery
is way below what is
required.”— Mike Janko,
Manager, Global Business Continuity,
The Goodyear Tire & Rubber Co.
There are multiple
survey responses
indicating minimal
involvement of all external
partners being well
engaged within internal
BC programs and about
40-50% have certain
suppliers integrated and
are working on adding
more, so there is a lot of
opportunity for process
improvement here.” — Mike Janko,
Manager, Global Business Continuity,
The Goodyear Tire & Rubber Co.
“
“
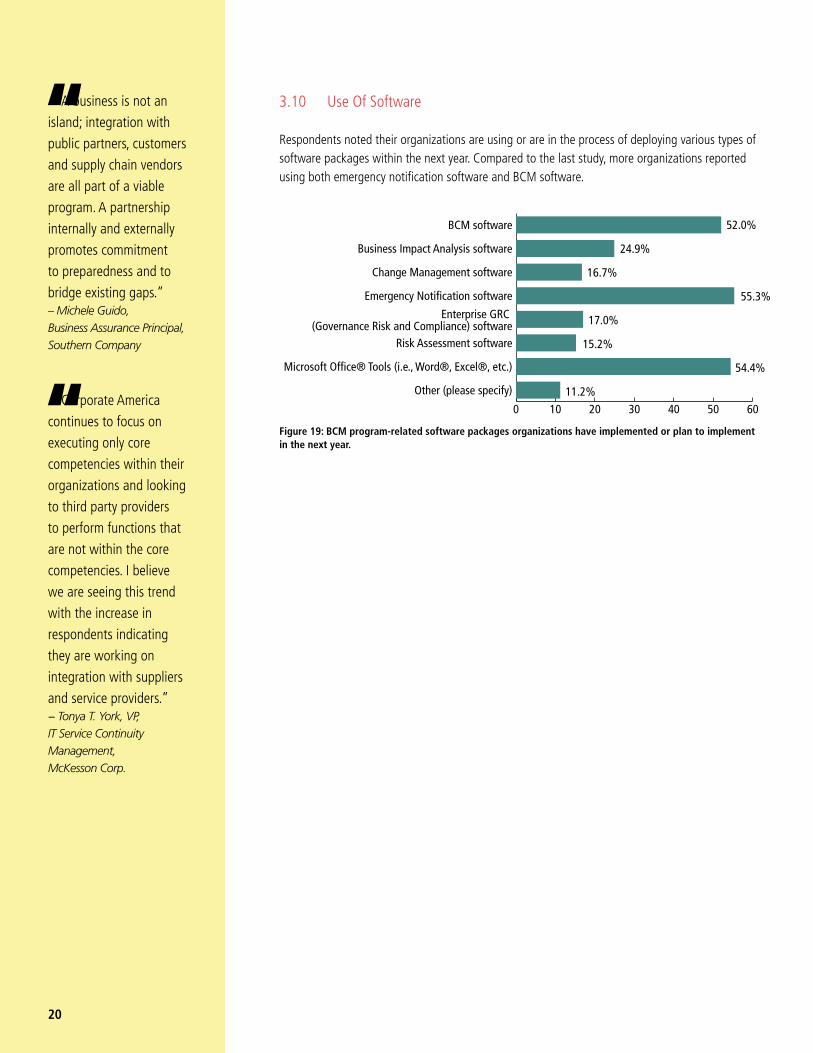
3.10 Use Of Software
Respondents noted their organizations are using or are in the process of deploying various types of software packages within the next year. Compared to the last study, more organizations reported using both emergency notification software and BCM software.
A business is not an
island; integration with
public partners, customers
and supply chain vendors
are all part of a viable
program. A partnership
internally and externally
promotes commitment
to preparedness and to
bridge existing gaps.” – Michele Guido, Business Assurance Principal, Southern Company
Corporate America
continues to focus on
executing only core
competencies within their
organizations and looking
to third party providers
to perform functions that
are not within the core
competencies. I believe
we are seeing this trend
with the increase in
respondents indicating
they are working on
integration with suppliers
and service providers.” − Tonya T. York, VP, IT Service Continuity Management, McKesson Corp.
“
“
20
Figure 19: BCM program-related software packages organizations have implemented or plan to implement in the next year.
52.0%
24.9%
16.7%
55.3%
17.0%
15.2%
54.4%
11.2% 0 10 20 30 40 50 60
Other (please specify)
Microsoft Office® Tools (i.e., Word®, Excel®, etc.)
Risk Assessment software
Enterprise GRC (Governance Risk and Compliance) software
Emergency Notification software
Change Management software
Business Impact Analysis software
BCM software
21
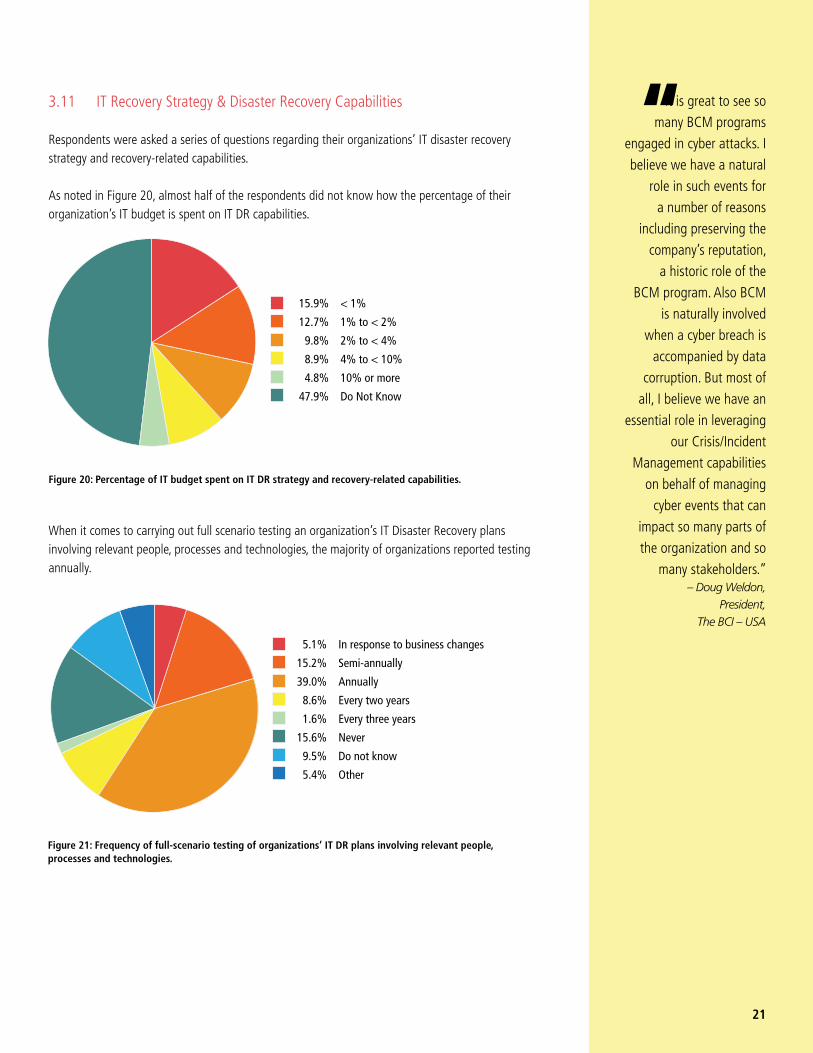
3.11 IT Recovery Strategy & Disaster Recovery Capabilities
Respondents were asked a series of questions regarding their organizations’ IT disaster recovery strategy and recovery-related capabilities.
As noted in Figure 20, almost half of the respondents did not know how the percentage of their organization’s IT budget is spent on IT DR capabilities.
When it comes to carrying out full scenario testing an organization’s IT Disaster Recovery plans involving relevant people, processes and technologies, the majority of organizations reported testing annually.
15.9% < 1%
12.7% 1% to < 2%
9.8% 2% to < 4%
8.9% 4% to < 10%
4.8% 10% or more
47.9% Do Not Know
Figure 20: Percentage of IT budget spent on IT DR strategy and recovery-related capabilities.
5.1% In response to business changes
15.2% Semi-annually
39.0% Annually
8.6% Every two years
1.6% Every three years
15.6% Never
9.5% Do not know
5.4% Other
Figure 21: Frequency of full-scenario testing of organizations’ IT DR plans involving relevant people, processes and technologies.
It is great to see so
many BCM programs
engaged in cyber attacks. I
believe we have a natural
role in such events for
a number of reasons
including preserving the
company’s reputation,
a historic role of the
BCM program. Also BCM
is naturally involved
when a cyber breach is
accompanied by data
corruption. But most of
all, I believe we have an
essential role in leveraging
our Crisis/Incident
Management capabilities
on behalf of managing
cyber events that can
impact so many parts of
the organization and so
many stakeholders.”– Doug Weldon,
President, The BCI – USA
“
I am surprised that 68%
responded ‘Do not know’
to Q50 regarding cloud
recovery strategies and
41% to Q51 regarding
application data in the
cloud. This is an important
and fast-moving trend that
must be understood by
continuity planners – not
just IT staff.” — Tim Mathews, Executive Director, Enterprise Resiliency, Educational Testing Service (ETS)
“
22
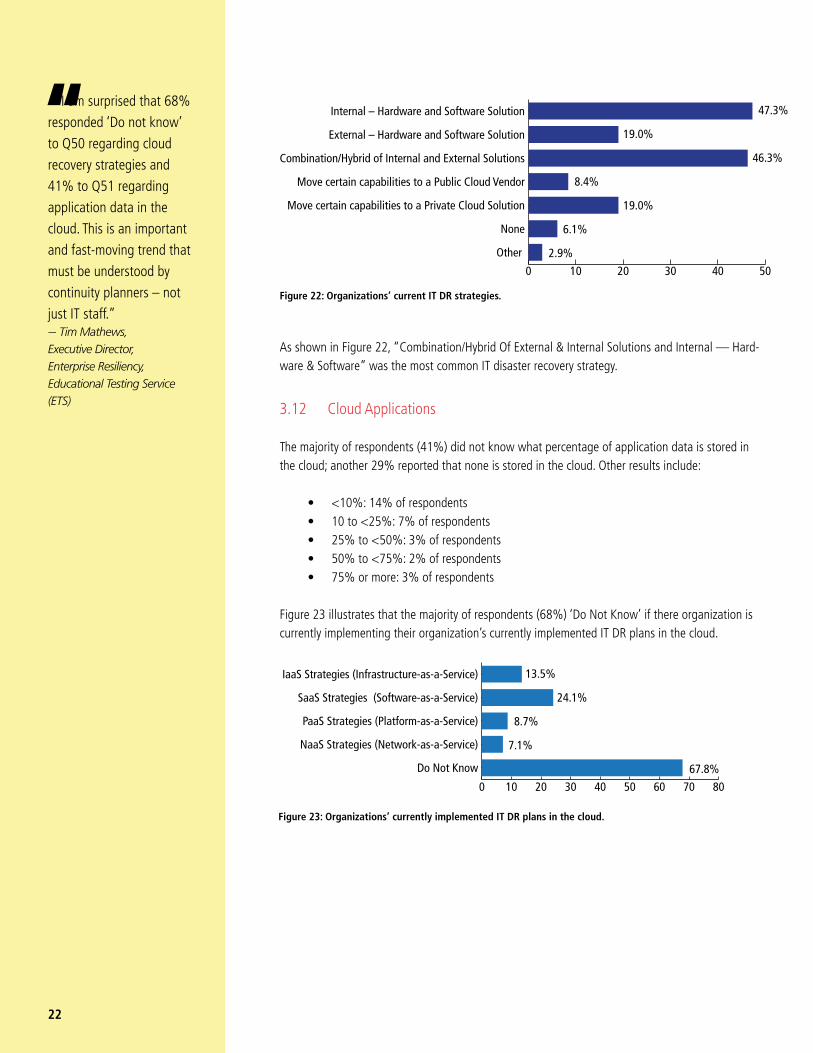
As shown in Figure 22, “Combination/Hybrid Of External & Internal Solutions and Internal — Hard-ware & Software” was the most common IT disaster recovery strategy.
3.12 Cloud Applications
The majority of respondents (41%) did not know what percentage of application data is stored in the cloud; another 29% reported that none is stored in the cloud. Other results include:
• <10%: 14% of respondents • 10 to <25%: 7% of respondents • 25% to <50%: 3% of respondents • 50% to <75%: 2% of respondents • 75% or more: 3% of respondents
Figure 23 illustrates that the majority of respondents (68%) ‘Do Not Know’ if there organization is currently implementing their organization’s currently implemented IT DR plans in the cloud.
13.5%
24.1%
8.7%
7.1%
67.8%
0 10 20 30 40 50 60 70 80
Do Not Know
NaaS Strategies (Network-as-a-Service)
PaaS Strategies (Platform-as-a-Service)
SaaS Strategies (Software-as-a-Service)
IaaS Strategies (Infrastructure-as-a-Service)
Figure 23: Organizations’ currently implemented IT DR plans in the cloud.
47.3%
19.0%
46.3%
8.4%
19.0%
6.1%
2.9%
0 10 20 30 40 50
Other
None
Move certain capabilities to a Private Cloud Solution
Move certain capabilities to a Public Cloud Vendor
Combination/Hybrid of Internal and External Solutions
External – Hardware and Software Solution
Internal – Hardware and Software Solution
Figure 22: Organizations’ current IT DR strategies.
23
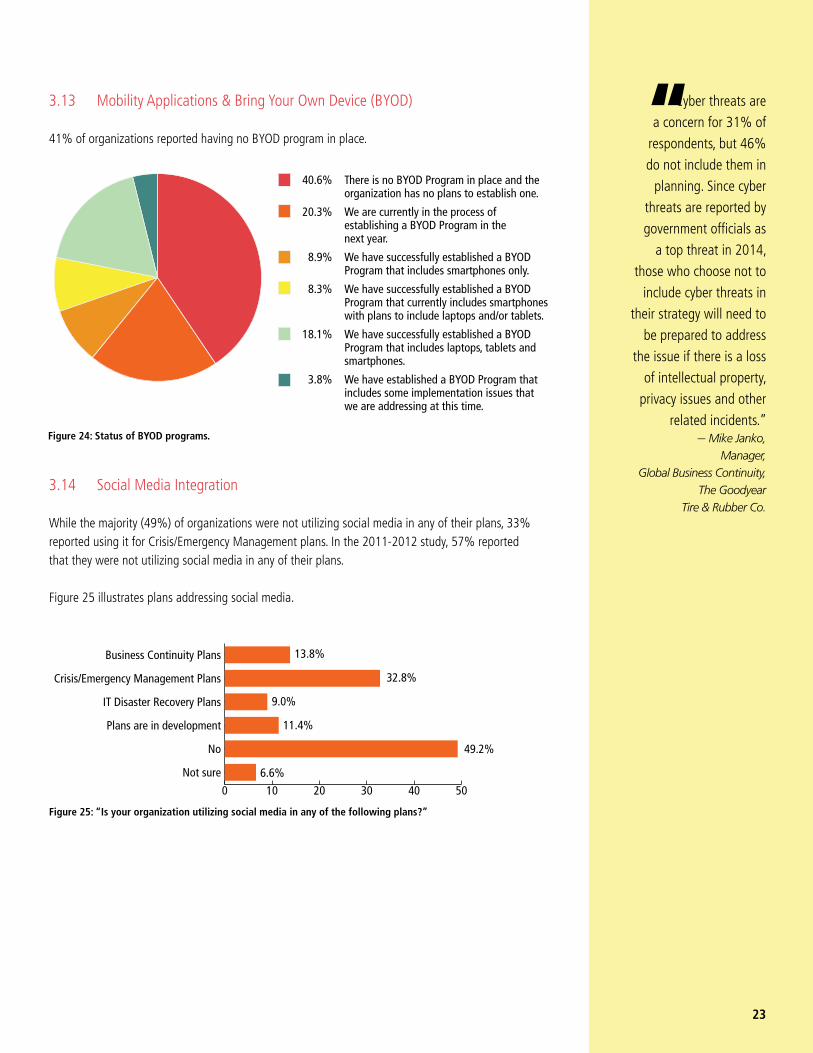
3.13 Mobility Applications & Bring Your Own Device (BYOD)
41% of organizations reported having no BYOD program in place.
3.14 Social Media Integration
While the majority (49%) of organizations were not utilizing social media in any of their plans, 33% reported using it for Crisis/Emergency Management plans. In the 2011-2012 study, 57% reported that they were not utilizing social media in any of their plans.
Figure 25 illustrates plans addressing social media.
40.6% There is no BYOD Program in place and the organization has no plans to establish one.
20.3% We are currently in the process of establishing a BYOD Program in the next year.
8.9% We have successfully established a BYOD Program that includes smartphones only.
8.3% We have successfully established a BYOD Program that currently includes smartphones with plans to include laptops and/or tablets.
18.1% We have successfully established a BYOD Program that includes laptops, tablets and smartphones.
3.8% We have established a BYOD Program that includes some implementation issues that we are addressing at this time.
Figure 24: Status of BYOD programs.
Figure 25: “Is your organization utilizing social media in any of the following plans?”
13.8%
32.8%
9.0%
11.4%
49.2%
6.6%
0 10 20 30 40 50
Not sure
No
Plans are in development
IT Disaster Recovery Plans
Crisis/Emergency Management Plans
Business Continuity Plans
Cyber threats are
a concern for 31% of
respondents, but 46%
do not include them in
planning. Since cyber
threats are reported by
government officials as
a top threat in 2014,
those who choose not to
include cyber threats in
their strategy will need to
be prepared to address
the issue if there is a loss
of intellectual property,
privacy issues and other
related incidents.” — Mike Janko,
Manager, Global Business Continuity,
The Goodyear Tire & Rubber Co.
“
It is concerning that the
proportion of respondents
whose plans include cyber
security response has not
increased significantly
since the last study, given
that 20% said that they
had plans in development
at that time.” — Ed Matley, Director, KPMG
This is an essential BC
issue and one that the
professional must address.
Imaginative approaches (in
conjunction with InfoSec
colleague) to harness
the strength of both
professions is urgently
needed.” — Lyndon Bird, Technical Director, The BCI
I see cyber terrorism as
one of the biggest threats
to most organizations. I
believe BCP professionals
have to get more involved
and become better
engaged.” — Ken Otis, Director, Business Continuity Management, CVS Caremark
“
“
“
24
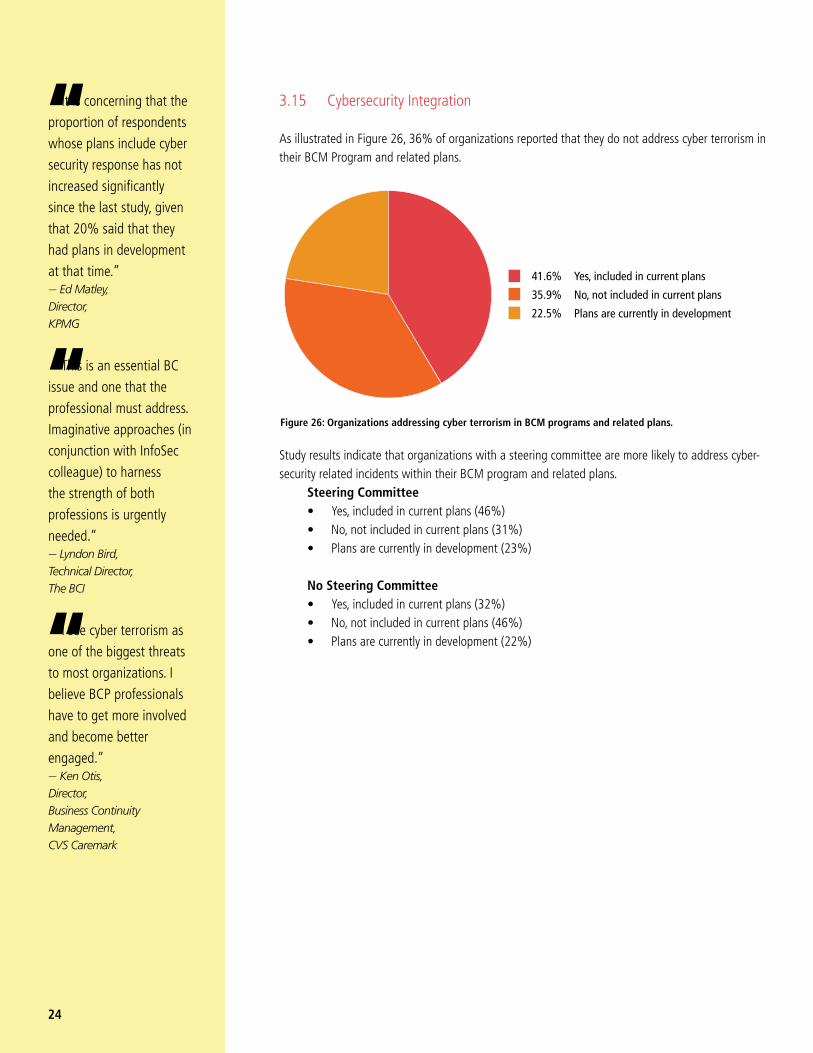
3.15 Cybersecurity Integration
As illustrated in Figure 26, 36% of organizations reported that they do not address cyber terrorism in their BCM Program and related plans.
Study results indicate that organizations with a steering committee are more likely to address cyber-security related incidents within their BCM program and related plans. Steering Committee • Yes, included in current plans (46%) • No, not included in current plans (31%) • Plans are currently in development (23%)
No Steering Committee • Yes, included in current plans (32%) • No, not included in current plans (46%) • Plans are currently in development (22%)
41.6% Yes, included in current plans
35.9% No, not included in current plans
22.5% Plans are currently in development
Figure 26: Organizations addressing cyber terrorism in BCM programs and related plans.
25
4. Closing Thoughts
As organizations continue to develop and/or refine new business models, and their use of enabling technologies such as cloud, social media, data and analytics increases, the need to effectively man-age the evolving threats and risks to their resiliency continues to be a focus of senior management and the board.
In this year’s survey, there was a significant increase in the number of organizations that experi-enced an incident or interruption in the past year that caused them to activate one or more business continuity plans, particularly around IT or Cyber Security, Social Media and Data Privacy. These results demonstrate how organizations are continually required to remain vigilant in the development, maintenance and monitoring for their business continuity programs as new business strategies and emerging threats change the game for business continuity professionals.
Our respondents told us that the establishment of a Senior Management Advisory or Steering Com-mittee and focused resources from the organization’s Program Management Office and other busi-ness groups were seen as critical considerations in driving program capabilities and effectiveness. While the BCM program governance, frameworks and some of the players and risks, have changed, it continues to be clear that some of the basic tenets of business continuity culture and organization remain key components to a successful and sustainable program.
– Tony Buffomante, KPMG
It is essential that the
BC program has proper
support from the top of the
organization. Without this it
has little possibility to gather
the interest it needs from
middle management and
operational business units.
How this support manifests
itself can vary but having it
formally recognized in an
Advisory Board or Steering
Committee structure is the
most practical approach.
The results of the survey
are unambiguous; those
organizations that have such
a group are more effective
than those who do not.
It is probably not just the
existence of the group that
is important, but also the
messages it sends to the
wider organization.With the
general acceptance that BCM
has to take a wider view and
move to a more pro-active
resiliency approach, it is
no surprise that those with
a Steering Committee are
more likely to integrate their
BCM Program with suppliers,
service providers and public
authorities … The belief that
corporate BCM programs can
operate in isolation of the
requirements of other actors
does need to be challenged.”— Lyndon Bird,
Technical Director, The BCI
“
It is often spoken about
the importance and value
of having a senior executive
on board to champion
business continuity within
an organization and this is
absolutely true. However, it
is only part of the story and
the findings from this survey
underline the importance
of establishing a group
of senior individuals in
an organization with key
ingredients to effectively
drive the BCM program
by representing the needs
of their respective areas
of the business. Some of
those key ingredients, from
my experience, are that
the people have to have
relevant knowledge and
experience of their area of
the business combined with
the skills to collaborate. This
of course has to be included
with the appropriate
authority to make decisions
on behalf of the business.
A trend throughout the
survey findings is that in all
cases, a better result for a
company’s BCM program is
achieved by having a Senior
Management Advisory
or Steering Committee in
place. — Steve Mellish, Chairman, The Business Continuity Institute (BCI)
26
5. Requests For Benchmarking Reports & Key Contact
A number of custom reports are available and can be accessed on the Continuity Insights website www.ContinuityInsights.com. Those custom reports are:
• Annual revenue • Entity type (public companies, private companies, government agencies or authorities, and
not-for-profits) • Governance (Entities with an Advisory Steering Committee, Entities with no Advisory
Steering Committee) • Industries (Computers/IT hardware, software and services; Financial services; Government;
Healthcare; Manufacturing; Professional services and Utilities) • Number of employees
If you would like to request a custom report that has not already been developed and available on the website , please provide the following information to Robert Nakao at [email protected]
Your name, organization, e-mail address, and the type of custom report(s) you would like to receive.
You will be provided the custom report(s) generally within five (5) business days of the receipt of your request.
“


