Wang et al. Geosci. Lett. (2017) 4:6 DOI 10.1186/s40562-017-0072-9
RESEARCH LETTER
The 2015 Mw 6.0 Mt. Kinabalu earthquake: an infrequent fault rupture within the Crocker fault system of East MalaysiaYu Wang1* , Shengji Wei1, Xin Wang1,3, Eric O. Lindsey1,2, Felix Tongkul4, Paul Tapponnier1, Kyle Bradley1, Chung‑Han Chan1, Emma M. Hill1 and Kerry Sieh1
Abstract
The Mw 6.0 Mt. Kinabalu earthquake of 2015 was a complete (and deadly) surprise, because it occurred well away from the nearest plate boundary in a region of very low historical seismicity. Our seismological, space geodetic, geomorphological, and field investigations show that the earthquake resulted from rupture of a northwest‑dipping normal fault that did not reach the surface. Its unilateral rupture was almost directly beneath 4000‑m‑high Mt. Kina‑balu and triggered widespread slope failures on steep mountainous slopes, which included rockfalls that killed 18 hik‑ers. Our seismological and morphotectonic analyses suggest that the rupture occurred on a normal fault that splays upwards off of the previously identified normal Marakau fault. Our mapping of tectonic landforms reveals that these faults are part of a 200‑km‑long system of normal faults that traverse the eastern side of the Crocker Range, parallel to Sabah’s northwestern coastline. Although the tectonic reason for this active normal fault system remains unclear, the lengths of the longest fault segments suggest that they are capable of generating magnitude 7 earthquakes. Such large earthquakes must occur very rarely, though, given the hitherto undetectable geodetic rates of active tectonic deformation across the region.
Keywords: 2015 Sabah earthquake, Mt. Kinabalu, Normal fault rupture, Teleseismic finite fault inversion, Landslides
BackgroundEast Malaysia has a very low earthquake hazard, as it is far away from major plate boundary faults (Simons et al. 2007) (Fig. 1a). Nonetheless, infrequent earthquakes generated by intraplate active faults do occur and have caused significant damage (e.g., Lim and Godwin 1992), in part because the rarity of historical damaging earth-quakes does not encourage implementation of seismic designs, preparation for earthquake-caused emergencies, and the systematic study of active faults.
Sabah is the northeastern province of East Malaysia and lies within the Sunda block, between the oceanic basins of the South China, Sulu, and Celebes Seas (Fig. 1a). The high Crocker and Trusmadi Ranges rise from Sabah’s
northwestern coast. Within that mountainous back-bone, by far the highest peak is Mt. Kinabalu, which con-sists of a granitic pluton that was rapidly exhumed since its crystallization about 5–6 Ma (Cottam et al. 2013) (Fig. 1b). These two mountain ranges are nearly paral-lel to an active deep-water fold-and-thrust belt that lies offshore to the northwest and has likely resulted from either gravity-driven mass movements or slow tectonic shortening (Hesse et al. 2009; King et al. 2010; Sapin et al. 2013; Simons et al. 2007). Although Sabah’s active tec-tonic setting remains unclear, recent GPS analyses sug-gest that the region is moving slowly westward relative to the stable Sunda block at a rate of just a few mm/year (e.g., Simons et al. 2007; Mustafar et al. 2014). This slow convergence between Sabah and the part of the Sunda block beneath the South China Sea, together with recent geomorphic analyses implies that Sabah is dominated by contractional tectonics (e.g., Mathew et al. 2016).
Open Access
*Correspondence: [email protected] 1 Earth Observatory of Singapore, Nanyang Technological University, Singapore, SingaporeFull list of author information is available at the end of the article
The Mw 6.0 Mt. Kinabalu earthquake occurred at 23:15 UTC, June 4, 2015, within this ambiguous tectonic envi-ronment. It was the largest earthquake to strike Sabah province in the past century (e.g., Engdahl and Villasenor 2002) and came as a surprise to local communities. Focal mechanisms calculated by the Global Centroid-Moment-Tensor (GCMT) project and the U.S. Geological Survey (USGS/NEID) suggest the focal depth of the mainshock was between 6 and 18 km on a normal fault striking nearly N-S or NE-SW (GCMT; Ekström et al. 2012). Prior to this event, the largest recorded earthquakes were mb 5.0 doublet in 1991 (Fig. 1b) that caused minor damage in the Ranau area, southeast of Mt. Kinabalu (Lim and Godwin 1992).
The Mt. Kinabalu mainshock produced intense ground shaking (IMMI ~ VII) in the vicinity of Ranau town, espe-cially in the area between the town and the summit of
Mt. Kinabalu (Fig. 1b, Additional file 1: Table S1). It also triggered extensive landslides along the steep slopes of Mt. Kinabalu, including rockfalls that killed 18 people and injured at least 21 more along climbing trails on the steep mountain face (Chan 2015). The mainshock was felt at least 300 km away, and the seismic intensity in the provincial capital, Kota Kinabalu, was strong enough (IMMI = IV) to awaken many residents in the early morning.
This Mw 6.0 event provides a rare opportunity to improve our understanding of the seismic hazards and tectonic context of East Malaysia. Here, we combine seismology, aftershock relocations, space-based geodesy, and tectonic geomorphology to understand earthquake, to place it in an active tectonic context, and to map the extensive landslides on Mt. Kinabalu.
Fig. 1 a (inset) Regional tectonic map of Southeast Asia. Red lines are primary plate boundary faults. Black dashed line is the active fold‑and‑thrust belt offshore Sabah. Color dot shows the M > 5 earthquakes from 1900 to 2015 from NEIC/USGS catalog. Red Arrow shows the general Sabah‑Sunda motion extracted from the Global Strain Rate Model, with rate (mm/year) labeled in front of the arrow (Simons et al. 2007). b Topography of Sabah and details of instrumentally recorded earthquakes and geomorphologically evident active faults in the region. Colored squares indicate seismic intensities from the mainshock, based on the USGS “Did You Feel It” (DYFI) dataset and our own field interviews. Red lines denote features inter‑preted as normal faults mapped from 30‑m SRTM data. Transparent colored lines show the approximate boundaries of major geological units, after (Hutchison 2005). G—granitic pluton of Mt. Kinabalu; U—ophiolitic basement
Page 3 of 12Wang et al. Geosci. Lett. (2017) 4:6
Point‑source focal mechanism and finite fault inversionImmediately after the Mw 6.0 mainshock, we performed a teleseismic waveform inversion to determine a moment tensor solution by the Cut-And-Paste (CAP) method (Zhu and Helmberger 1996). This yielded a normal fault mechanism similar to solutions from global seismic net-works (e.g., USGS and GCMT) and a centroid depth of 13–14 km (Fig. 2a; Additional file 1: Figure S1). The 209° strike of one of the fault-plane solutions is similar to the trend of normal fault scarps that appear clearly in the nearby topography (Fig. 2b).
We also conducted a finite fault inversion using broad-band teleseismic body waves with a simulated annealing inversion algorithm (Ji et al. 2002). We tested fault planes corresponding to both nodal planes of our point-source focal mechanism. Detailed inversion parameters and methods appear in the Additional file 1.
Of the two orthogonal finite fault models, the fault that strikes 209° and dips 63° fits the data much better than the more shallowly dipping fault (best waveform fits are shown in Additional file 1: Figure S2). Most of the rup-ture occurred at depths >5 km, and peak slip is <50 cm (Fig. 2b, c). Thus, our model predicts <3 cm of surface deformation (Additional file 1: Figure S3).
Most of the seismic energy was released in the first 5 s of the rupture process (Fig. 2d). The rupture propa-gated unilaterally NNE along strike and had only a small component of updip directivity. The unilateral propaga-tion is evident in the seismic waveform records, in that the waveforms from stations located to the south show longer durations than those to the north (Fig. 2e, dura-tion highlighted by rectangles). The northward propaga-tion of the rupture could have increased the shaking on Mt. Kinabalu and thus have increased the likelihood of landslides and rockfalls northeast of the fault rupture.
Relocation of aftershocksMore than one hundred aftershocks were recorded by the Malaysian seismic network. However, only seven are large enough to be included in the current global catalog (e.g., USGS/NEIC). The locations of these M ≥ 4 after-shocks differ appreciably between the USGS/NEIC and the Malaysian catalogs (Table 1; Additional file 1: Figure S4a). Since only two local stations (KKM and RNSM) within 50 km of the mainshock recorded these after-shocks, we use three-component waveform records at these two stations to relocate the aftershocks via single seismic station relocation.
To constrain aftershock locations using a single station, we estimate the backazimuth from the P-wave particle motion and the epicentral distance from the differen-tial travel time of S- and P-wave, assuming a modified
CRUST 2.0 layered velocity structure (Bassin 2000). The backazimuth of the event is determined by rotating the N-S and E-W component records to the radial and trans-verse components under the guiding principle that the best angle will minimize the P-wave energy on the trans-verse component (Jurkevics 1988; Niu and Li 2011). The epicentral distance is determined by the differential travel time of S- and P-wave with manually picked direct P- and S-wave arrival time (Additional file 1: Figure S5). The distance is then determined by matching the differential travel time with a theoretical travel time table derived from the 1D velocity model, assuming these events are located at a depth around 13 km, which is the depth of the mainshock hypocenter (Fig. 2a).
We are able to relocate the mainshock and seven after-shocks with backazimuth and distance from the single seismic station data. Two aftershocks epicenters deter-mined from station RSNM are highly consistent with their epicenters determined from station KKM. This suggests that the single station method works well in the Mt. Kinabalu area (Fig. 2b). These eight relocated events define in a zone ~15 km × 5 km, much narrower than the distribution determined without using the two local sta-tions (Additional file 1: Figure S4). This zone is consistent with the strike of our best-fitting finite fault model and is parallel to the generalized trend of normal fault scarps mapped at the surface.
ALOS‑2 observationWe use L-Band ScanSAR and stripmap data acquired by ALOS-2/PALSAR-2 to estimate surface deformation associated with the mainshock. Data from descending track 28 and ascending track 142 (Table 2) were pro-cessed using the GMTSAR software (Sandwell et al. 2011) with the application of a 100-m Gaussian filter. Overall, both ascending and descending InSAR results show surprisingly good coherence across Sabah’s densely vegetated surface (Additional file 1: Figure S6).
Neither interferogram shows significant line of sight (LOS) displacement of Mt. Kinabalu, which implies that ground deformation was no more than the noise level of the interferogram, ~5 cm (e.g., Lin et al. 2010). This is consistent with the ~3 cm amplitude of surface deforma-tion predicted from our finite fault model. Our InSAR results thus support our interpretation from the teleseis-mic inversion—that the earthquake resulted from a blind normal fault rupture that did not reach the surface.
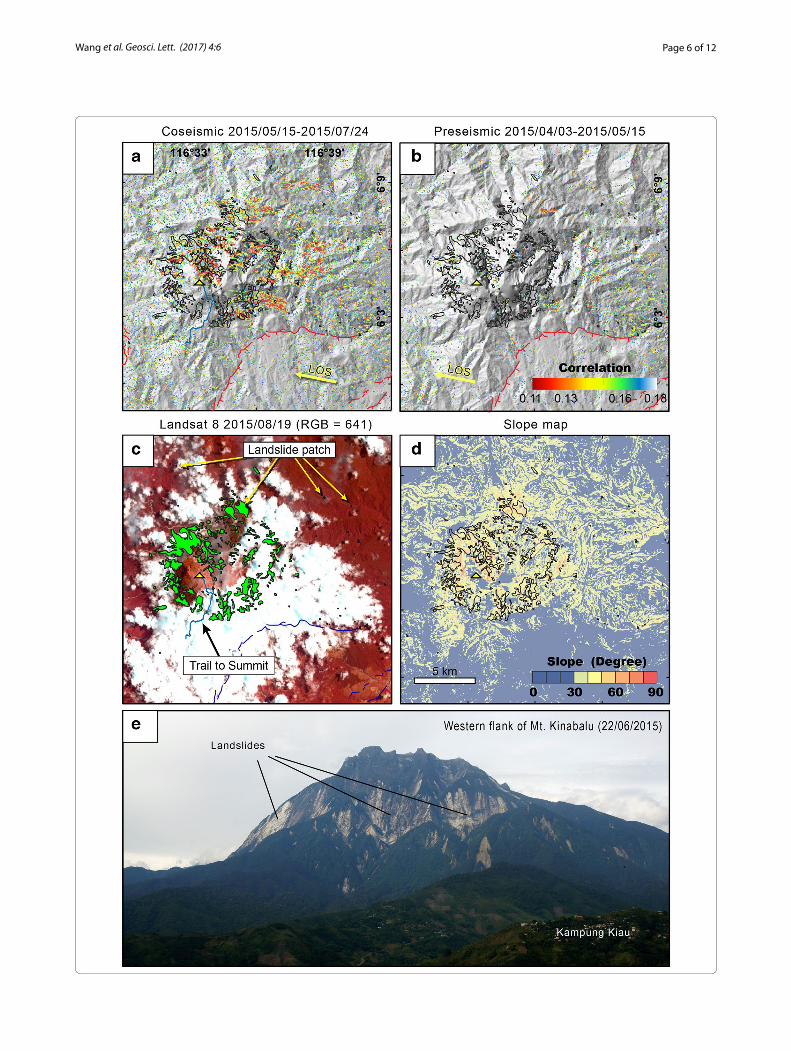
While the LOS displacement fields show no appreci-able tectonic ground deformation in the vicinity of Mt. Kinabalu, the interferograms contain some unusually large low-coherence patches on the slopes of Mt. Kina-balu (Fig. 3a). These may be the result of either radar overlay due to the steep topography of Mt. Kinabalu or
Page 4 of 12Wang et al. Geosci. Lett. (2017) 4:6
Page 5 of 12Wang et al. Geosci. Lett. (2017) 4:6
extensive slope failures triggered by the mainshock. The latter interpretation is more viable, because these or sim-ilar low-coherence patches that do not exist in the inter-ferogram formed from two pre-earthquake descending ALOS-2 ScanSAR images (Fig. 3b).
Landslide distributionInspections of post-earthquake optical Landsat 8 sat-ellite images and photos taken in the field after the mainshock confirm that many of these low-coherence patches are either associated with large landslides and rockfalls or smaller but tightly clustered rockfalls (Fig. 3c). Both the radar interferograms and the optical imagery and photographs show that most of the slope failures occurred where the flanks of Mt. Kinabalu are steeper than 30° (Fig. 3d). Our Landsat 8 observations also indicate that some of the earthquake-induced
landslides occurred more than 30 km from the epicenter.
One of the largest of slope failures is a 6 km2 patch within the river catchment on the northwestern side of Mt. Kinabalu. Another large failure is a 5 km2 patch on the southern flank of Mt. Kinabalu. The match between the radar and optical interpretations is better on the northern slope than on the southern slope. This likely results from the line of sight azimuth of the ALOS-2 data, as Mt. Kinabalu’s southern slope is nearly parallel to ALOS-2’s line of sight, so it is more likely that not all the incoherence reflects actual changes in the slope.
The ALOS-2’s descending interferogram also shows some low-coherence patches east of the Mt. Kinabalu (Fig. 3a). However, clouds obscure the optical satellite images in that region, so they cannot be used to confirm that these patches are the result of slope failures.
(See figure on previous page.) Fig. 2 Seismological evaluation of the 2015 Kinabalu earthquake. a Point‑source moment tensor solution from CAP analysis yields a best‑fit centroid depth of about 13–14 km. b Map view of the finite rupture model of Mt. Kinabalu earthquake and relocated epicenters of the mainshock and select aftershocks. Upper bound of the modeled rupture plane is indicated by a heavy line, about 4 km below the surface. Red lines are active normal faults mapped from SRTM topography. c Slip in the finite rupture model, including rake angles (white arrows) and timing (black contours, in 2‑second intervals). d Moment‑rate function of the finite fault model shows that rupture lasted about 5 s. e Teleseismic P‑wave fits for select stations. Red is synthetic and black is data; station names appear at the beginning of each waveform pair, as well as epicenter azimuth (above, in degrees) and distance (below, in degrees). Peak displacements (in micrometer) appear above the end of the waveform
Table 1 Mainshock and aftershock information
a “–” stands for no available information from USGS websiteb Latitude and Longitude are determined from KKM station by applied bandpass filter of 50 s-1 Hzc Latitude and Longitude are determined from RNSM station by applied bandpass filter of 50 s-1 Hz
Origin date Malaysia catalog USGS cataloga Relocationb
(YYYYMMDD_HHMM) Lat. Lon. Dep. Mag. Lat. Lon. Lat. Lon.
Overall, the distribution of the landslides mapped from the optical imagery and InSAR roughly coincides with seismic intensities of V and higher, consistent with the global landslide–intensity relationship com-piled by Keefer (1984) and Rodrıguez et al. (1999). The area affected by triggered landslides is mostly within a 15 × 15 km (225 km2) area near the epicenter. However, if we include other remote slope failures mapped from the post-quake Landsat 8 imagery, the total area affected by landslide is likely exceeds 500 km2 (26 × 21 km). This upper-bound estimate of the landslide-affected area is slightly smaller than the 650 km2 area affected by slope failures after the Mw 6.2 Coalinga, California, earthquake of 1983 (Rodrıguez et al. 1999), but much smaller than the area of slope failures associated with North American intraplate earthquakes: The Mw 5.8 Saguenay in 1988 and the Mw 5.8 Mineral earthquake in 2011 produced slope failures regions within areas of ~30,000 to 45,000 km2 (Jibson and Harp 2012; Rodrıguez et al. 1999). These differences likely reflect higher attenuation of ground motion in Sabah, as the two eastern North America earthquakes were felt over an extraordinary large area due to the low seismic attenuation of eastern North American lithosphere.
The directivity of the mainshock rupture may have also affected the landslide distribution. Although nearly all the mapped large landslides occurred on slopes of Mt. Kinabalu that average >30°, smaller landslides occurred primarily north of the mainshock epicenter, and few occurred on the steep slopes south of Mt. Kinabalu. This is consistent with the rupture propagation direc-tion determined by our finite fault inversion (Fig. 3c). We hypothesize that the unilateral rupture enhanced ground shaking north of Mt. Kinabalu and whereby triggered rel-atively extensive small landslides north of the mainshock epicenter and few to the south.
Active normal faults in northwestern SabahThe occurrence of the Sabah earthquake motivated us to inspect the mountainous terrain for geomorphologi-cal evidence of youthful tectonic deformation. Not only did we inspect the immediate region of the earthquake for evidence of coseismic fault rupture, but we also
examined the surrounding region for evidence of active faults, to see if the location and mechanism of the earth-quake could be related to a larger system of tectonic ele-ments. Shaded relief and 10-m contour maps made from the 30-m SRTM global dataset enabled and greatly facili-tated these local and regional inspections.
The topography of Sabah bears clear evidence for a 200-km-long system of active normal faults that extend northeast to southwest, through the epicentral region (Fig. 1b). The scarps of these normal faults bound five discrete valleys and exhibit hundreds of meters of topo-graphic relief between the valley floors and mountain crests. The topographic evidence for youthful normal faulting along these valley margins is typical—triangu-lar facets, scarps across alluvial terraces and other topo-graphic truncations best explained by normal faulting (Additional file 1: Figures S7, S8). These geomorphic interpretations of normal faulting are consistent with the field observations of Tjia (2007) who describes normal faulting of Quaternary sediments within this fault system.
We name this the Crocker fault system, because the Crocker Range extends along nearly half its length. It divides naturally into a set of five distinct graben and master faults, one associated with each of the Tenom, Keningau, Tambunan, Ranau, and Marak Parak valleys (Fig. 1b). Lengths of individual graben and associated fault zones range from about 20 to about 60 km. Four of these appear to be half-graben, in that they exhibit only one bounding fault or one of the bounding faults is domi-nant over the other. Of these four, two have dominant faults that dip southeast and the other two have domi-nant faults dipping northwest. The three grabens south-west of Mt. Kinabalu comprise about 120 km of the entire system, and the width of the system ranges from 10 to 20 km. The half-graben northeast of Mt. Kinabalu exhib-its a single, narrow fault that dips southeast. -Mt. Kina-balu clearly interferes with the regularity of the Crocker fault system, and the faulting immediately to the NE and SW and on the southern flank of the mountain is com-plex, with a variety of fault orientations and faults with opposing dips.
In particular, faulting near the mainshock epicenter is complex (Figs. 2a, 4). Two SE-dipping normal faults are
(See figure on previous page.) Fig. 3 ALOS‑2 coherence and slope maps show that loss of coherence is related to coseismic slope failures of slopes steeper than 30° on Mt. Kinabalu. a Post‑seismic image correlation map of the descending tracks. Black outlines are post‑seismic slope failures mapped from Landsat 8 images (Green polygons in panel c). Red lines are the active faults from this study. Blue line shows the trail to the summit of Mt. Kinabalu. b Preseis‑mic correlation map of the same track, showing good correlation throughout the Mt. Kinabalu. c Landsat 8 image of Mt. Kinabalu acquired in Aug 2016 overlaid by the mapped landslides (green polygons). The area covered by could is mapped by other Landsat 8 and optical satellite images. d Slope map generated from SRTM data overlain with optically mapped slope failures. This map shows that slope failures caused by the earthquake correlate well with slopes steeper than 30°. e The western flank of Mt. Kinabalu after the Sabah earthquake. White patches on the slope are the new landslides areas triggered by the Mw 6.0 mainshock
Page 8 of 12Wang et al. Geosci. Lett. (2017) 4:6
exposed along the eastern and the southern flank of Mt. Kinabalu, but the ~10-km-long, west-dipping Marakau Fault bounds the eastern margin of the Ranau basin (Fig. 2a). Mapping of triangular facets and field observa-tions suggest that the Marakau Fault truncates the Trus-madi formation (Figs. 1, 4). Streams within the Ranau basin systemically flow eastward until they reach the eastern margin of the basin, and fluvial terraces are well developed along the western margin of the basin (Fig. 4). These observations suggest that eastward tilt of its hang-ingwall block has accompanied late-Quaternary motion of the west-dipping Marakau fault.
The Mt. Kinabalu earthquake likely resulted from the rupture of the northwest-dipping Marakau fault or a closely associated fault beneath Mt. Kinabalu. Of the faults we see in the topography, the Marakau fault is the only plausible source of the earthquake. The fault trace lies about 16 km southeast of the epicenter and has a strike and dip that is similar to that of the earthquake’s focal mechanism. However, if our hypocenter of the
earthquake is correct, the Marakau fault cannot actually be the source of the earthquake, because the Marakau fault would need to have an average surface-to-hypo-central dip of only 40°, far shallower than the 60° dip we determined for the rupture. Moving the earthquake epi-center about 8 km toward the Marakau fault would allow the requisite 60° dip, but 8 km is well beyond the ~3 km uncertainty of our epicentral estimation. We therefore contend that the earthquake resulted from failure of a minor fault that splays upward from the Marakau Fault and does not break the surface.
Tectonic implicationsThe tectonic implications of the Mt. Kinabalu earthquake and the Crocker fault system remain uncertain. While the normal fault mechanism and the geometry of the regional fault system indicate crustal extension perpen-dicular to the coast of Sabah, offshore structures clearly show ongoing shortening (e.g., Ingram et al. 2004; Hesse et al. 2009). Moreover, the earthquake and the Crocker
Fig. 4 Geomorphic expressions of normal faults near the southeast flank of Mt. Kinabalu and the Ranau Basin. Red dashed line shows active fault trace inferred from geomorphology, with up‑thrown side marked by U and downthrown side marked by D. Blue-colored arrow indicates the flow direction of channel in the Ranau Basin. The only normal fault that dipping northwestward in this map is the Marakau Fault at the eastern edge of the Ranau Basin. Tri: Triangular facets; Wine: Wineglass canyon; Scr: Scarp; W: Wind gap; BR: Broken ridge. Black contour interval is 50 m, gray contour interval is 10 m
Page 9 of 12Wang et al. Geosci. Lett. (2017) 4:6
fault system imply subsidence of Mt. Kinabalu, whereas geological evidence indicates that the Mt. Kinabalu Granite has risen rapidly since its crystallization 5–6 Ma (Cottam et al. 2013). These contradictions suggest that the extensional forces that are creating the normal fault system are directly related neither to the forces creating the offshore fold-and-thrust belt nor to those that have created the edifice of Mt. Kinabalu.
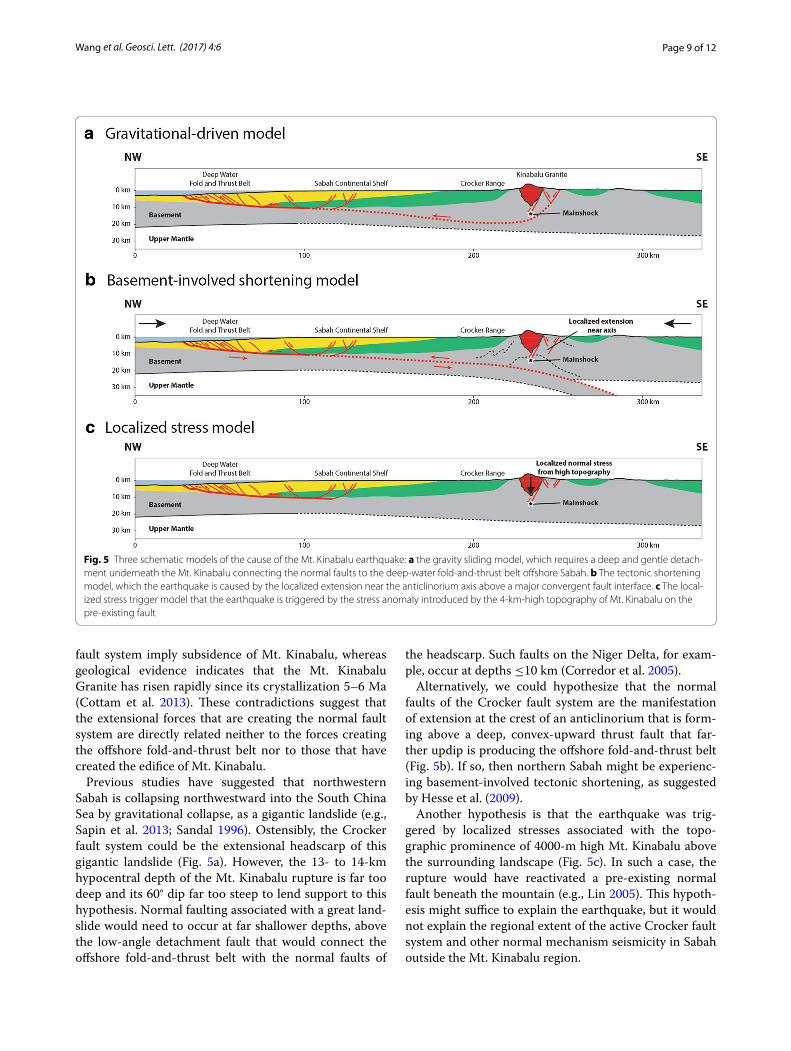
Previous studies have suggested that northwestern Sabah is collapsing northwestward into the South China Sea by gravitational collapse, as a gigantic landslide (e.g., Sapin et al. 2013; Sandal 1996). Ostensibly, the Crocker fault system could be the extensional headscarp of this gigantic landslide (Fig. 5a). However, the 13- to 14-km hypocentral depth of the Mt. Kinabalu rupture is far too deep and its 60° dip far too steep to lend support to this hypothesis. Normal faulting associated with a great land-slide would need to occur at far shallower depths, above the low-angle detachment fault that would connect the offshore fold-and-thrust belt with the normal faults of
the headscarp. Such faults on the Niger Delta, for exam-ple, occur at depths ≤10 km (Corredor et al. 2005).
Alternatively, we could hypothesize that the normal faults of the Crocker fault system are the manifestation of extension at the crest of an anticlinorium that is form-ing above a deep, convex-upward thrust fault that far-ther updip is producing the offshore fold-and-thrust belt (Fig. 5b). If so, then northern Sabah might be experienc-ing basement-involved tectonic shortening, as suggested by Hesse et al. (2009).
Another hypothesis is that the earthquake was trig-gered by localized stresses associated with the topo-graphic prominence of 4000-m high Mt. Kinabalu above the surrounding landscape (Fig. 5c). In such a case, the rupture would have reactivated a pre-existing normal fault beneath the mountain (e.g., Lin 2005). This hypoth-esis might suffice to explain the earthquake, but it would not explain the regional extent of the active Crocker fault system and other normal mechanism seismicity in Sabah outside the Mt. Kinabalu region.
Fig. 5 Three schematic models of the cause of the Mt. Kinabalu earthquake: a the gravity sliding model, which requires a deep and gentle detach‑ment underneath the Mt. Kinabalu connecting the normal faults to the deep‑water fold‑and‑thrust belt offshore Sabah. b The tectonic shortening model, which the earthquake is caused by the localized extension near the anticlinorium axis above a major convergent fault interface. c The local‑ized stress trigger model that the earthquake is triggered by the stress anomaly introduced by the 4‑km‑high topography of Mt. Kinabalu on the pre‑existing fault
Page 10 of 12Wang et al. Geosci. Lett. (2017) 4:6
The 13- to 14-km depth of the Mt. Kinabalu earthquake and the 200 km length of the Crocker fault system lead us to prefer the hypothesis that this narrow extensional fault system is part of a deeper tectonically driven con-vergent system that verges toward the offshore fold-and-thrust belt. Further tests of the hypothesis could include comparison of the modern rates of convergence and extension across the offshore and onshore zones of con-vergence and extension, and geophysical analysis of the crustal-scale structural geometry of northwestern Sabah.
The potential for larger earthquakes within the Crocker fault systemThe presence of youthful, geomorphically expressed nor-mal faults well beyond the source of the Mt. Kinabalu rupture implies that future seismic ruptures are plausi-ble well beyond the region of the 2015 earthquake. It also implies that past and future ruptures could be larger than the 2015 rupture. Indeed, the 40- to 60-km lengths of the larger faults within the Crocker fault system suggest that Mw 7+ earthquakes are plausible anywhere along the 200-km-long belt (cf. the length–magnitude relationships of Wells and Coppersmith 1994; Wesnousky 2008; Blaser et al. 2010).
The recurrence intervals of such large events are, how-ever, likely to be at least several thousand years, as the geological slip rates of these faults are likely lower than 1 mm/year (e.g., Mustafar et al. 2014). To explore plau-sible earthquake recurrence times for the Crocker fault system as a whole, we conduct a simple earthquake fre-quency model using the relationship between average fault slip rate (R) and seismic-moment accumulation rate (M0):
and
for which we assume a uniform 0.5 mm/year fault slip rate (R) across a fault with aggregate length (L) of 300 km, allowing for additional length from overlaps and splays within Crocker fault system, a seismogenic depth (W) of 15 km and a dip (d) of 70°. We also assume that the frequency of larger earthquakes along this normal fault system follows the truncated Gutenberg–Richter relationship:
where northern Sabah has a b value of 0.9, and maxi-mum magnitude about Mw 7.3 (MMax) from the empiri-cal fault length–magnitude relationship (e.g., Wells and
(1)M0 = µ
(
LW
sin(d)
)
R
(2)Mw =2
3log10M0 − 10.73; M0 in dyne · cm
(3)log10N (Mw) = a− bMw; Mw ≤ MMax
Coppersmith 1994). With an average crustal rigidity (µ ) of 3 × 10¹¹ dyne/cm2, this model yields a frequency for magnitudes ≥5 of about 20 years, for magnitudes ≥6 of nearly 150 years, and for magnitudes ≥7 of about 1300 years. This roughly coincides with actual earth-quake frequencies for the Sabah region, as seen in the global catalog of earthquakes since 1900—five magnitude ≥5 events from 1900 to 2015 and the lone magnitude 6 of 2015.
If we assume a much lower fault slip rate—only 0.1 mm/year—then a magnitude ≥7 earthquake would be expected far less frequently—about every 6300 years. An accurate measurement of geodetic strains across the region or paleoseismic investigations might enable deter-mination of which of these two estimates is closer to real-ity. Such knowledge could be quite important, because destructive strong ground motions from a M7+ earth-quake could extend well beyond nearby towns and vil-lages, to even as far as Sabah’s capital city, Kota Kinabalu, which currently has a population of over 500,000 people.
If the Crocker fault system is the expression of a bend-ing-moment fault above a tectonically driven thrust fault that verges into Sabah’s offshore faults, the potential for even larger earthquakes sourced from the underlying thrust fault would exist. This connection is so specula-tive, however, that we do not consider scenarios for such earthquakes.
Even if large earthquakes occur within the Crocker fault system only every few thousand years, prudence dictates that preparations for such events take place. Many of Earth’s most recent seismic disasters have resulted from the rupture of faults that have recurrence times measured in thousands of years. The average recur-rence interval of the Longmenshan Fault that produced the Mw 7.9 Wenchuan earthquake in 2008 may well be 3–4 kyear (e.g., Ran et al. 2013; Ren and Zhang 2013). The Greendale Fault, which produced the 2010 Mw 7.1 Darfield earthquake, has a mean recurrence interval of 10–60 kyear (Hornblow et al. 2014). In both of these examples, the average fault slip rate of the source faults has been difficult to estimate using modern geodetic data because they are so low. Thus, as in the case of Sabah, these faults drew scant or no attention before their dev-astating earthquakes.
The implication of future seismic hazard analysis of Southeast AsiaThe Sabah earthquake should also raise concerns about seismic potential of some Southeast Asian regions beyond East Malaysia, as very low slip rate faults are not limited to the Sabah region. Several other places in Southeast Asia with slowly slipping faults may also experience a similar level of the seismic hazard. Parts of
Page 11 of 12Wang et al. Geosci. Lett. (2017) 4:6
peninsular Malaysia, and western and southwestern Thai-land also exhibit evidence of active low slip rate faults or other evidence of recent tectonic movement (e.g., Fen-ton and Sutiwanich 2005; Pananont et al. 2011; Tjia 2010; Shuib 2011). Geodetic analyses within the past several decades suggest that ongoing tectonic strain accumula-tion in these regions is lower than can yet be resolved by space-based geodesy (i.e., less than a few mm/year). Nonetheless, recent seismic activity or the geological investigations in these regions suggests a potential for future damaging earthquakes. Although the average fre-quency of large, destructive earthquakes in these regions may—as in the case of Sabah—be low, rapid economic development and population growth have significantly increased their seismic risk. Vigorous efforts to quantify the seismic hazards and risks of Sabah and these other areas would be an important first step toward mitigating the potentially tragic effects of future earthquakes.
ConclusionsOur teleseismic waveform and finite fault inversion results suggest the Mw 6.0 Mt. Kinabalu earthquake resulted from rupture of a blind, northwest-dipping nor-mal fault that likely splay upward from the Marakau fault, which reaches the surface on the east side of the Ranau Valley. The maximum coseismic slip revealed by our finite fault model is <50 cm and at a depth of 13–14 km. This blind rupture area is consistent with aftershock reloca-tions and agrees with our field and ALOS-2 InSAR obser-vations of no appreciable surface deformation or surface rupture near Mt. Kinabalu. The landslides mapped from the optical satellite imagery and ALOS-2 InSAR together suggest the area affected by landslides is >225 km2, and may be as large as 500 km2. This area coincides roughly with the region of seismic intensities V and higher and with slopes exceeding 30°. The unilateral rupture of the mainshock likely enhanced the ground shaking in the area north of Mt. Kinabalu and triggered more landslides north of the mainshock epicenter than to the south.
Our geomorphological analysis indicates that the fault that caused the Mw 6.0 earthquake is part of the 200-km-long Crocker fault system, which follows the backbone of the Crocker Range. Although the tectonic significance of this narrow fault system is unclear, its scale implies that future seismic ruptures well beyond the region of the 2015 earthquake are plausible, and that this fault system may be capable of producing a magnitude ≥7 earthquake. Like other active faults with low slip rate, the recurrence interval of such large earthquakes along the Crocker fault system is likely to be in the order of several thousand years. However, the destructive strong ground motions from a M7+ earthquake could extend well beyond nearby towns and villages, and could bring significant
seismic hazard to Sabah’s coastal settlements, including its capital city, Kota Kinabalu.
Authors’ contributionsYW performed the landslide analysis from optical imagery, field survey, interviews, and organized the paper. KS and YW conducted the active fault mapping of Sabah from remote sensing data. SW and XW performed the seismological analysis and aftershock relocations. PT provided his insight of active tectonic model of Sabah, which forms one of the major part of our discussion. EOL did the ALOS‑2 InSAR analysis. FT, PT contributed extensively to the scientific discussion and data acquisition. PT, KB, and EMH shared their knowledge of this event and regional tectonics. CHC preformed the seismic catalog analysis of Sabah. All authors read and approved the final manuscript.
Author details1 Earth Observatory of Singapore, Nanyang Technological University, Sin‑gapore, Singapore. 2 Institute of Geophysics and Planetary Physics, Scripps Institute of Oceanography, University of California, San Diego, CA, USA. 3 Key Laboratory of Earth and Planetary Physics, Institute of Geology and Geophys‑ics, Chinese Academy of Sciences, Beijing, People’s Republic of China. 4 Natural Disaster Research Centre, Universiti Malaysia Sabah, Kota Kinabalu, Sabah, Malaysia.
AcknowledgementsWe deeply appreciate the help from Dr. Rosaidi Che Abas from the Malaysian Meteorological Department (MetMalaysia), who provided the raw data of local seismic stations for earthquake relocations. We also greatly appreciate the help of Yvonne Soon Yee Vun in conducting our field work. ALOS‑2 data are copyrighted by the Japanese Aerospace Exploration Agency. This research is supported by the National Research Foundation Singapore and the Singapore Ministry of Education under the Research Centres of Excellence initiative. This work comprises Earth Observatory of Singapore contribution no. 143.
Competing interestsThe authors declare that they have no competing interests.
Received: 13 October 2016 Accepted: 21 February 2017
ReferencesBassin C (2000) The current limits of resolution for surface wave tomography in
North America. EOS Trans AGU 81:F897Blaser L, Kruger F, Ohrnberger M, Scherbaum F (2010) Scaling relations
of earthquake source parameter estimates with special focus on subduction environment. Bull Seismol Soc Am 100(6):2914–2926. doi:10.1785/0120100111
Chan J (2015) All earthquake victims accounted for, Sabah cops confirm. The Malay Mail Online, Jun 10, 2015
Corredor F, Shaw JH, Bilotti F (2005) Structural styles in the deep‑water fold and thrust belts of the Niger Delta. AAPG Bull 89(6):753–780. doi:10.1306/02170504074
Cottam MA, Hall R, Sperber C, Kohn BP, Forster MA, Batt GE (2013) Neogene rock uplift and erosion in northern Borneo: evidence from the Kinabalu granite, Mount Kinabalu. J Geol Soc 170(5):805–816. doi:10.1144/jgs2011‑130
Ekström G, Nettles M, Dziewoński AM (2012) The global CMT project 2004–2010: centroid‑moment tensors for 13,017 earthquakes. Phys Earth Planet Inter 200–201:1–9. doi:10.1016/j.pepi.2012.04.002
Engdahl E, Villasenor A (2002) Global seismicity: 1900–1999, international handbook of earthquake and engineering seismology 81A. Elsevier Sci‑ence Ltd, Amsterdam
Fenton C, Sutiwanich C (2005) Paleoseismic investigation of the Ranong and Khlong Marui faults, Chumphon Province, Southern Thailand. In: AGU Fall Meeting Abstracts
Hesse S, Back S, Franke D (2009) The deep‑water fold‑and‑thrust belt offshore NW Borneo: gravity‑driven versus basement‑driven shortening. Geol Soc Am Bull 121(5–6):939–953. doi:10.1130/b26411.1
Hornblow S, Quigley M, Nicol A, Van Dissen R, Wang N (2014) Paleoseismology of the 2010 Mw 7.1 Darfield (Canterbury) earthquake source, Green‑dale Fault, New Zealand. Tectonophysics 637:178–190. doi:10.1016/j.tecto.2014.10.004
Hutchison CS (2005) Geology of north‑west Borneo: Sarawak, Brunei and Sabah. Elsevier, Amsterdam. ISBN: 9780080460895
Ingram GM, Chisholm TJ, Grant CJ, Hedlund CA, Stuart‑Smith P, Teasdale J (2004) Deepwater North West Borneo: hydrocarbon accumulation in an active fold and thrust belt. Mar Pet Geol 21(7):879–887. doi:10.1016/j.marpetgeo.2003.12.007
Ji C, Wald DJ, Helmberger DV (2002) Source description of the 1999 Hec‑tor Mine, California, earthquake, part I: wavelet domain inversion theory and resolution analysis. Bull Seismol Soc Am 92(4):1192–1207. doi:10.1785/0120000916
Jibson RW, Harp EL (2012) Extraordinary distance limits of landslides trig‑gered by the 2011 Mineral, Virginia, earthquake. Bull Seismol Soc Am 102(6):2368–2377
Jurkevics A (1988) Polarization analysis of three‑component array data. Bull Seismol Soc Am 78(5):1725–1743
Keefer DK (1984) Landslides caused by earthquakes. Geol Soc Am Bull 95(4):406–421. doi:10.1130/0016‑7606(1984)95<406:lcbe>2.0.co;2
King RC, Backé G, Morley CK, Hillis RR, Tingay MRP (2010) Balancing deforma‑tion in NW Borneo: quantifying plate‑scale vs. gravitational tectonics in a delta and deepwater fold‑thrust belt system. Mar Pet Geol 27(1):238–246. doi:10.1016/j.marpetgeo.2009.07.008
Lim P, Godwin P (1992) The Ranau Earthquake Swarm, May–July, 1991, SabahLin CH (2005) Seismicity increase after the construction of the world’s tallest
building: an active blind fault beneath the Taipei 101. Geophys Res Lett 32:L22313. doi:10.1029/2005GL024223
Lin Y‑N, Simons M, Hetland EA, Muse P, DiCaprio C (2010) A multiscale approach to estimating topographically correlated propagation delays in radar interferograms. Geochem Geophys Geosyst. doi:10.1029/2010GC003228
Mathew MJ, Menier D, Siddiqui N, Kumar SG, Authemayou C (2016) Active tectonic deformation along rejuvenated faults in tropical Borneo: infer‑ences obtained from tectono‑geomorphic evaluation. Geomorphology 267:1–15
Mustafar MA, Simons WJ, Omar KM (2014) Monitoring of local deformations in North Borneo. Paper presented at the FIG Congress 2014, Kuala Lumpur
Niu F, Li J (2011) Component azimuths of the CEArray stations estimated from P‑wave particle motion. Earthq Sci 24(1):3–13. doi:10.1007/s11589‑011‑0764‑8
Pananont P, Wechbunthung B, Putthapiban P, Wattanadilokkul D (2011) Seismic activities in Kanchanaburi: past and present. Songklanakarin J Sci Technol 33(3):355‑364
Ran Y‑K, Chen W‑S, Xu X‑W, Chen L‑C, Wang H, Yang C‑C, Dong S‑P (2013) Paleoseismic events and recurrence interval along the Beichuan‑Yingxiu fault of Longmenshan fault zone, Yingxiu, Sichuan, China. Tectonophysics 584:81–90. doi:10.1016/j.tecto.2012.07.013
Ren J, Zhang S (2013) Estimation of recurrence interval of large earth‑quakes on the Central Longmen Shan fault zone based on seis‑mic moment accumulation/release model. Sci World J 2013:8. doi:10.1155/2013/458341
Sandal ST (1996) The geology and hydrocarbon resources of Negara Brunei Darussalam. Syabas, Selangor
Sandwell D, Mellors R, Tong X, Wei M, Wessel P (2011) Open radar interferom‑etry software for mapping surface Deformation. EOS Trans Am Geophys Union 92(28):234. doi:10.1029/2011EO280002
Sapin F, Hermawan I, Pubellier M, Vigny C, Ringenbach J‑C (2013) The recent convergence on the NW Borneo Wedge—a crustal‑scale gravity gliding evidenced from GPS. Geophys J Int 193(2):549–556. doi:10.1093/gji/ggt054
Shuib MK (2011) Evidences for recent seismicities and dating of active faulting in NW Peninsular Malaysia. In; National geoscience conference 2011, Johor Bahru, p 64
Simons WJF, Socquet A, Vigny C, Ambrosius BAC, Haji Abu S, Promthong C, Subarya C, Sarsito DA, Matheussen S, Morgan P, Spakman W (2007) A decade of GPS in Southeast Asia: resolving Sundaland motion and boundaries. J Geophys Res Solid Earth 112(B6):B06420. doi:10.1029/2005JB003868
Tjia H (2007) Kundasang (Sabah) at the intersection of regional fault zones of Quaternary age. Geol Soc Malaysia Bull 53:59–66
Tjia H (2010) Growing evidences of active deformation in the malay basin region. Geol Soc Malaysia Bull 56:35–40
Wells DL, Coppersmith KJ (1994) New empirical relationships among magni‑tude, rupture length, rupture width, rupture area, and surface displace‑ment. Bull Seismol Soc Am 84(4):974–1002
Wesnousky SG (2008) Displacement and geometrical characteristics of earthquake surface ruptures: issues and Implications for seismic‑hazard analysis and the process of earthquake rupture. Bull Seismol Soc Am 98(4):1609–1632. doi:10.1785/0120070111
Zhu LP, Helmberger DV (1996) Advancement in source estimation tech‑niques using broadband regional seismograms. Bull Seismol Soc Am 86(5):1634–1641