26
20 trends you need to know when draf ting and executing your long term growth strategy THE 2016 WATCH LIST May 2016

20 trends you need to know when drafting and executing your long term growth strategy
THE 2016 WATCH LIST
May 2016

Assume the world will be fully connected by 2020
Source: United Nations, 2015; emarketer, December 2015; Internet World Stats, 2015 (as of December 2014); Experience Think, 2015; Ericsson Mobility Report, June 2015.
1
2010 2015F 2020E
Global Population
6.9Bn
26%
42%
7.3Bn
60%
7.7Bn
Internet penetration
Smartphone penetration
10%
20%
3.1Bn
4.6Bn
1.9Bn
5.0Bn
0.7Bn
1.4Bn
Connected World
66%

Soon most devices, products -even clothes- will be connected2
Source: Business Insider, 2014. Cisco IBSG.
2005 2010 2015E 2020E
PersonalComputers
Smartphones
Tablets
Internetof Things
WearablesSmart TVs
0.5Bn2Bn
12Bn
50Bn
Global connected device numbers grew 24X in just 10 years
Connected World

Consumer Business Security
Education Healthcare Government
All industries are playing the “digital catch-up” game to stay competitive
Source: KPCB, 2015.
3Estimated global digital penetration, by industry
Connected World

GENERATION ZGENERATION ZMILLENNIALSMILLENNIALS16 - 34 years old16 - 34 years oldweb firstweb first 0 - 15 years oldmobile firstmobile first
Young adults will redefine how we produce and sell our products and services
Source: Sparks & Honey, “Meet Generation Z:Forget Everything You Learned About Mille”nnials, 2014; Rob Norman’s, “Turning 13 in 2014”, BTIG, 2014, IAB México Teens, 2015.
Multimedia devices
Content focus
Socially integrated
TV prime-time chasm2012 - 2014 hours per week change
On demand vs. linearpaid vs. free
2
share / mostly text
78%
-6hrs
create / mostly image/video
-5hrs
89%
5
50/50 90 on demand mostly freePPV / DVR / ROD
( )from
23 ( )from
20
Millennials and Gen Z
4

People, values, incentives and global sourcing
5
Enhanced business intelligence
Source: PSFK Labs, “The Future of Work,”, 2013.
“Great spaces”
Future of Work
OpenKnowledgeConstant learning
On-DemandStaffing
Optimized skillsets
OptimalInteractionDigital + physical
employees-vendors-clients
The work enviroment must constantly adapt to an ever-shifting marketplace
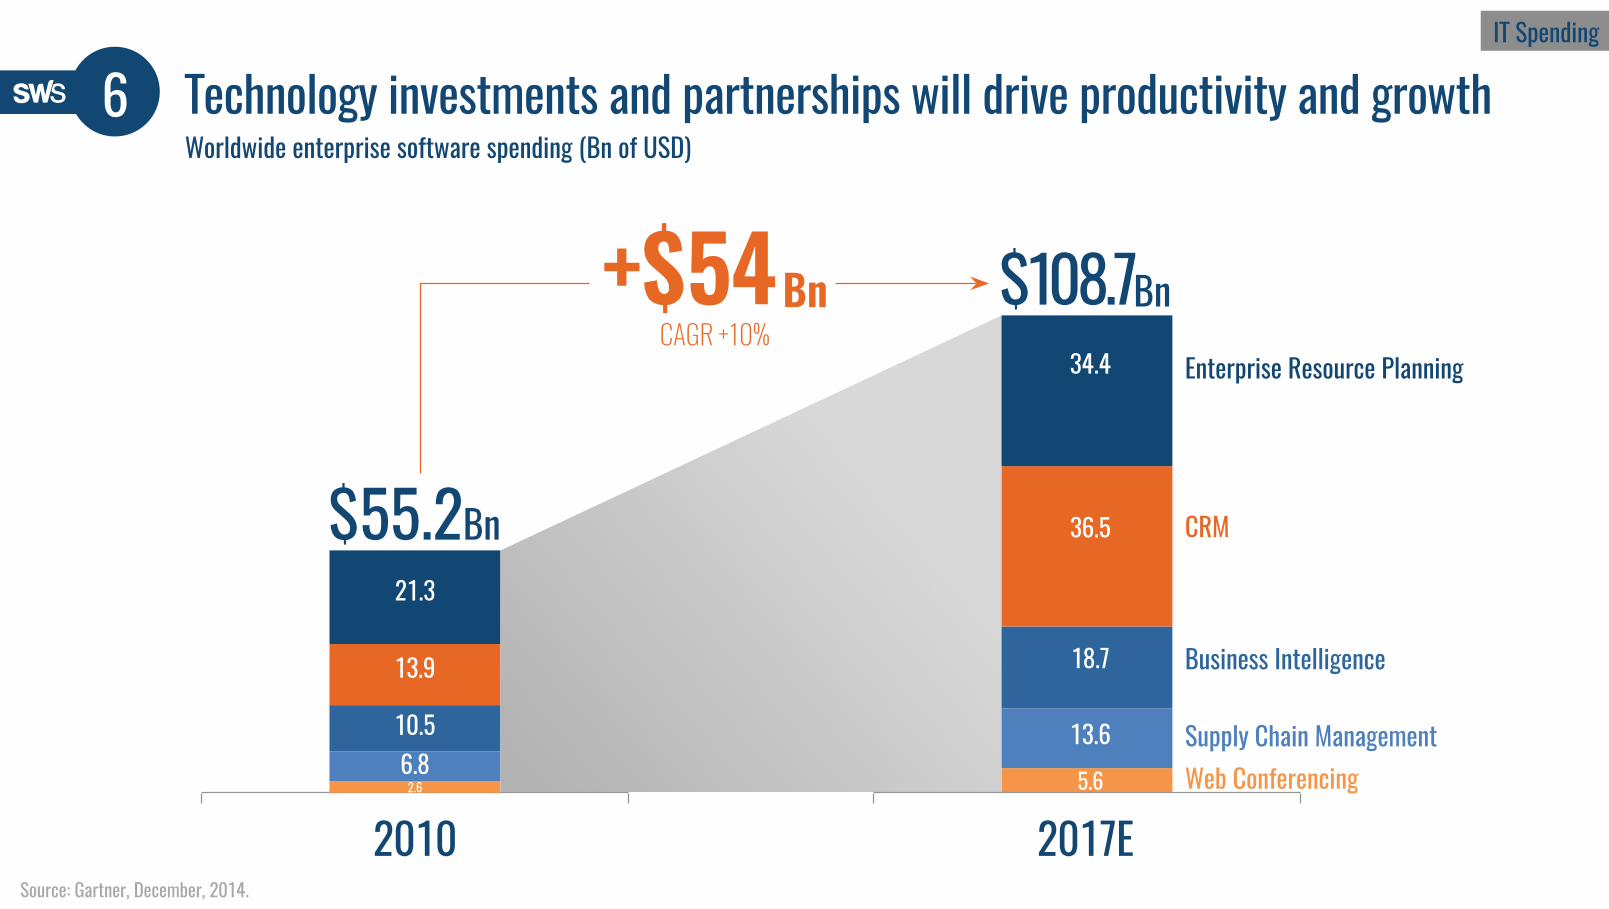
6 Technology investments and partnerships will drive productivity and growthWorldwide enterprise software spending (Bn of USD)
2010 2017E
$55.2
$108.7
21.3
34.4
13.9
36.5
10.56.8
18.7
13.6
2.6 5.6
Source: Gartner, December, 2014.
Enterprise Resource Planning
CRM
Business Intelligence
Supply Chain ManagementWeb Conferencing
IT Spending
+$54Bn Bn
Bn
CAGR +10%
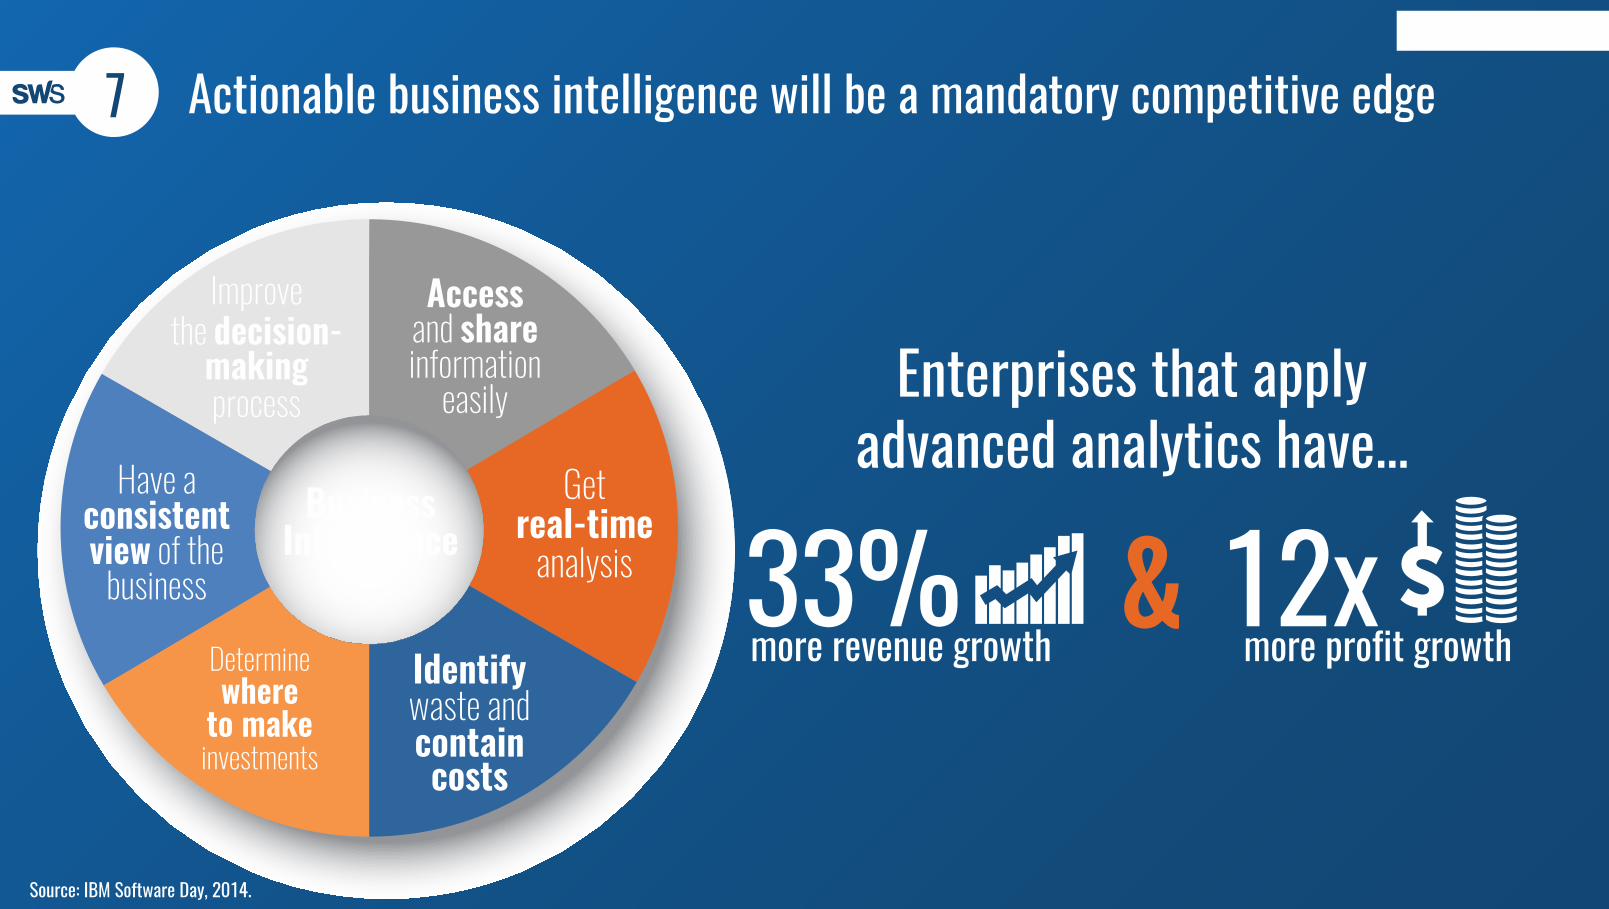
7 Actionable business intelligence will be a mandatory competitive edge
Source: IBM Software Day, 2014.
Enterprises that applyadvanced analytics have...
33%more revenue growth
12xmore profit growth
&
Business Intelligence
Have aconsistentview of the
business
Determinewhere
to makeinvestments
Getreal-time
analysis
Identifywaste andcontaincosts
Improvethe decision-
makingprocess
Accessand shareinformation
easily
BusinessIntelligence

Source: Forrester, eMarketer January, December; 2014; AMIPCI, 2015.
$2,541$491
$75$12
1998 2006 2014 2018E
Top 10 eCommercecompanies by revenue
eCommerce will enable accelerated growth and set new service standards Share of e-commerce as part of total retail sales (Bn of USD)
0.1%
8.9%8.5%
3.0%2.9%
0.05%0.2%0.3%
MEXICOLATAMGLOBALUSA
eCommerce
8
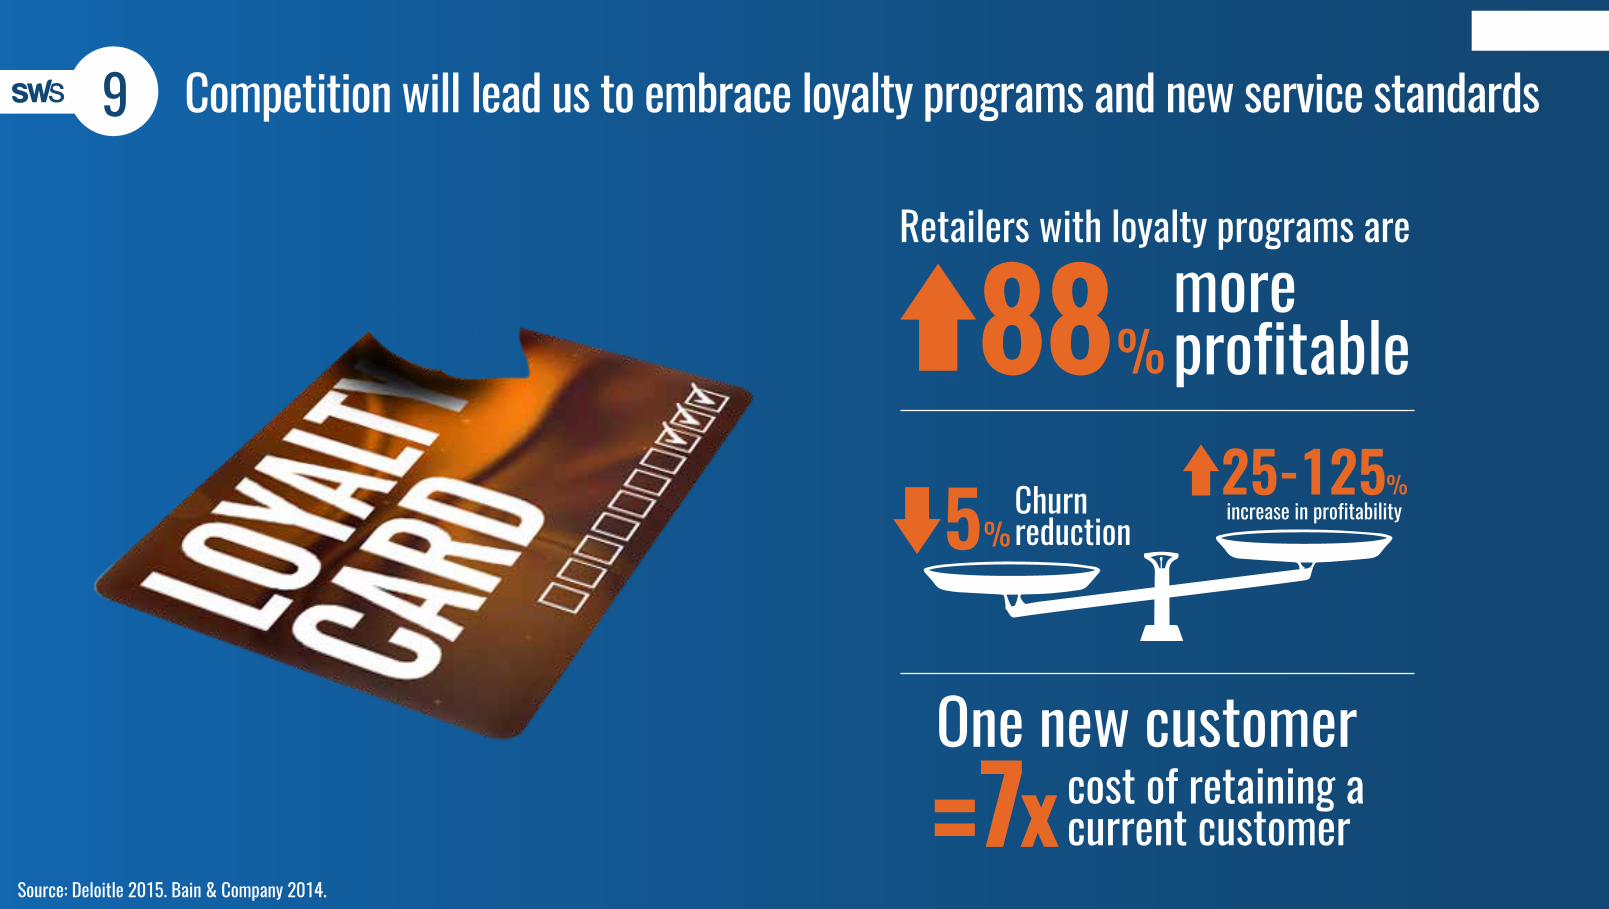
9
Source: Deloitle 2015. Bain & Company 2014.
Competition will lead us to embrace loyalty programs and new service standards
increase in profitabilityChurnreduction
Loyalty-CRM
5 %
%25-125
Retailers with loyalty programs are
88 %
x
moreprofitable
One new customer
= cost of retaining acurrent customer7

Recurrent revenue models generate exponential value based on lasting relationships10
Source: Gartner. BI, “Suscription Revenue Report ,” 2015 John Warrilow, “The automatic consumer,” 2015.
Higher multiples:Enterprise Value / EBITDA (Aug 15)
of all media and digital businessesembracing subscription services
incremental revenue of reported global 2000 companies
40% 35%
Subscription Models
4 in 5 CEOs believe customers are switching to new consumption models like sharing or subscribing
128 44 4.28

Advertising grows 6%/yr through 2020; digital and mobile capture the lion's share11Share of global marketing spend, 2004-2017 (% of total)
Source: Zenith Optimedia, 2014.
30%
12% 13%
0%4%
6%
20%
11%
38% 37%
9%6%
0.5%0.5%
6% 7%
@
2004
2017
E
TV Radio Film OOHMagazinesNewspaper Digital Mobile
31%31%31%
Marketing Re-Mix

37%41%
11% 11%
4%
18%
8%
24% 24%23%
TV Radio Print Internet Mobile
Mobile marketing represents the biggest opportunity in terms of time
Source: IAB, emarketer, 2014; KPCB, 2015.
AD S
PEND
TIME S
PENT
OPPO
RTUN
ITY
$25BN
The mobile catch-upopportunity
Time spent vs. ad spend (% of US 2015 total)
Marketing Re-Mix
11

11 Marketing experts will dramatically change their marketing mix
Email marketing
LESS MORE
Mobile marketing
Social media
Search (SEO/PPC)
Online display advertising
Tradeshows and events
Direct mail
Public relations
Print advertising
Radio/TV advertising
61%
49%
40%
38%
37%
18%
17%
17%
12%
8%
4%
5%
1%
6%
8%
17%
22%
33%
18%
6%
Source: Sensorpro, Strong View Survey 2014.
% spend% spend
Investment increase/decrease based on "affirmative answers" (according to a survey of 377 global CMOs)
Marketing Re-Mix

11 In Mexico alone, the “marketing re-mix” already happened
Source: CICOM, April 2015.
Marketing/advertising investment plus share change, 2005 vs. 2013 (Bn of USD)
Open TV$2.9
-31%Radio $ 0.5
-15%
Newspaper$ 0.4
-36%Pay TV$ 0.4 +20%
Outdoors$ 0.4 -48%
Internet $ 0.6
Magazines $ 0.2 -58%Movies$ 0.1 -51%
DirectMarketing $ 2.1
Research$ 0.4
PR$ 0.4
Grap
hic D
esign
$ 0
.1
Promotions and BTL$ 3.8
+729%
+46% +85%-37%
+40%
Marketing Re-Mix

33HRS
5HRS
22Min
29HRS
Hours spent watching video per weekDigital video is starting to compete head-to-head with live and linear TV
2010 2012 2014 2016 2018 2020 2022Source: The Diffusion Group, 2014.
Digital Video
Live TV
Online Video
12

Mobile screens already capture one-third of all viewers13Hours spent watching video, per day (adults 18+, USA)
2010 2015
7.2hrs
9.5hrs
0.4 6%
2.4 2.4
4.4
33%
61%
29%
26%
Source: eMarketer, April, 2015.
Mobile spikes from
6 to 29%of screen share
Mobile spikes fromMobile spikes fromMobile spikes from
6 to 29%of screen shareof screen shareof screen share
TV & Desktopshare drops 24%total hours viewed remains flat!
Mobile
Desktop/laptop
TV
2.9
4.345%
Online Video

14
Source: PwC, 2015.
Shared economy sector
Traditional rental sectorPeer-to-peer lendingand crowdfunding
Peer-to-peeraccommodations
Onlinestaffing
Car-sharing
Music and videostreaming
Equipmentrental
B&Bs/hostels
Lending libraries
Car rental
DVD rental
Global shared economy growth (Bn of USD)
Limited supply
Unlimited idle capacity
The sharing economy is impacting most service industries
$255
$670
50%$335
50%$335
94%$240
6% $15
2014 2025E
The Sharing Economy
15
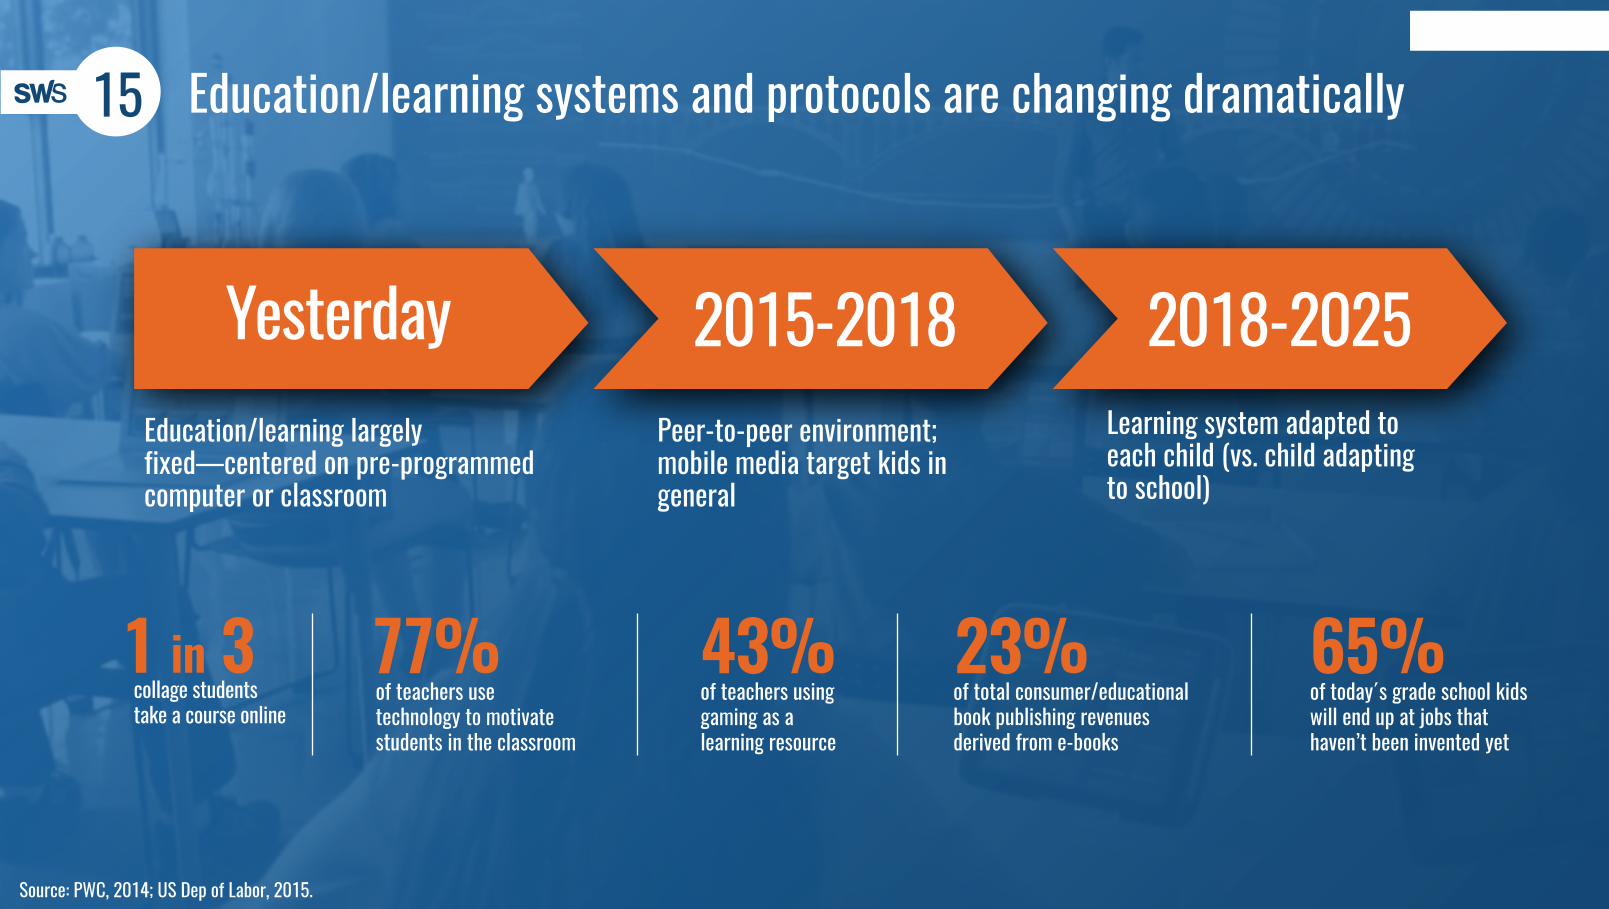
Source: PWC, 2014; US Dep of Labor, 2015.
Future of Education
Education/learning systems and protocols are changing dramatically
77% of teachers use technology to motivate students in the classroom
43% of teachers using gaming as a learning resource
23% of total consumer/educational book publishing revenues derived from e-books
65% of today´s grade school kids will end up at jobs that haven’t been invented yet
1 in 3 collage students take a course online
Yesterday 2015-2018 2018-2025Education/learning largely fixed—centered on pre-programmed computer or classroom
Peer-to-peer environment; mobile media target kids in general
Learning system adapted to each child (vs. child adapting to school)

16
Source: Singularity 2015.
Artificial Intelligence
Machine learning is displacing numerous human tasks at accelerated speeds
1026
1020
1015
1010
105
0.0001
204520202015200019801960194019201900
1
Surpasses brainpowerof single human
Surpasses brainpowerof Insect
Surpasses brainpowerof mouse
Calcu
lation
s per
seco
nd pe
r $10
00
Surpasses brainpowerequivalent to that of all human brains combined
Exponentialgrowth of computing
The accelerating pace of changeAgriculturalRevolution
8000years
120years
90years
22 years
IndustrialRevolution
LightBulb
MoonLanding
WorldWide Web
Human genomesequenced
9 years
Data -
Information
-
Wisdom
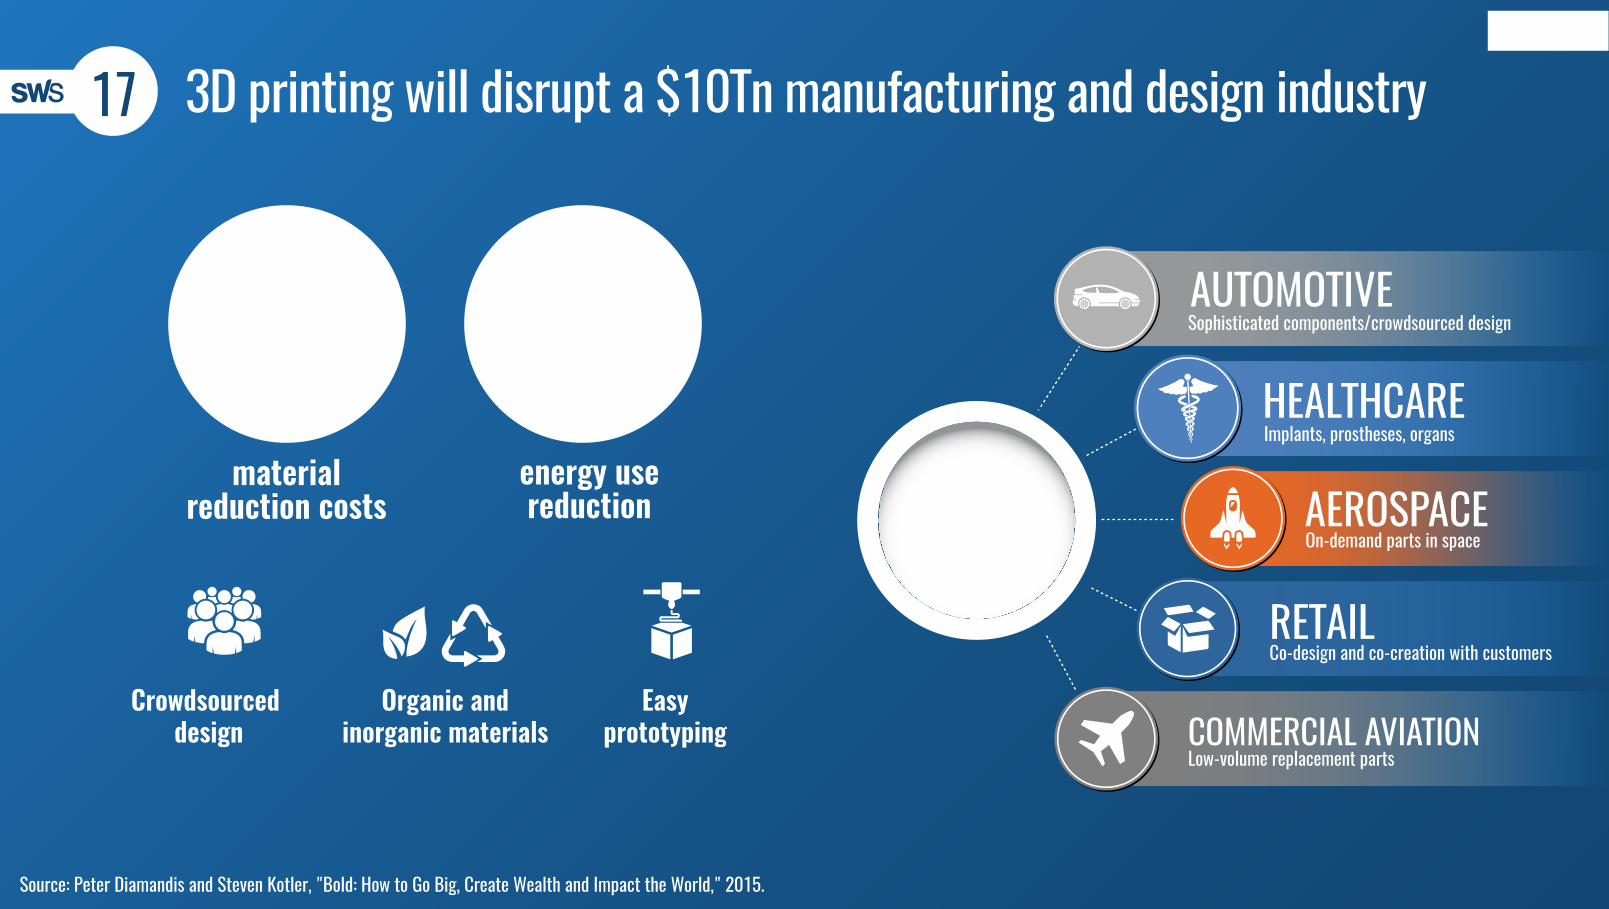
17 3D printing will disrupt a $10Tn manufacturing and design industry
Source: Peter Diamandis and Steven Kotler, "Bold: How to Go Big, Create Wealth and Impact the World," 2015.
On-demand parts in spaceAEROSPACE
Co-design and co-creation with customersRETAIL
AUTOMOTIVESophisticated components/crowdsourced design
HEALTHCAREImplants, prostheses, organs
COMMERCIAL AVIATIONLow-volume replacement parts
Disrupted industries
3D Printing
materialreduction costs
energy usereduction
Organic andinorganic materials
Crowdsourced design
Easyprototyping
90 % 50 %

Gaming
18 The gaming industry will revolutionize how people interact, learn, love...
Source: Newzoo, 2014 Global Games Market Report & Service.
online population1.8Bn 60%gamers
2000$8Bn
$103Bn
3x Box Office$32Bn
Gaming Industry
Revenue byscreen
24%
TV/Console
22%
Mobile
40%
PC
14%
Tablet
2017

Source: Rock Health funding database, 2015.
ANALYTICS AND BIG DATA DIGITAL MEDICAL DEVICES
Software/hardware designedto treat a specific diseaseor condition.
HEALTHCARE CONSUMER ENGAGEMENT
Consumer tools for thepurchasing of healthcareservices or health insurance(B2B and B2C).
PAYER ADMINISTRATION
Management andadministration toolsfor payers.
POPULATION HEALTH MANAGEMENT
Comprehensive platformsfor managing the health ofpopulations under the shiftto risk-based payment models.
TELEMEDICINE
Delivery of healthcareservices through non-physicalmeans (e.g. telephone, digitalimaging, videoconferencing).
Future of Health
The healthcare industry seeks to extend/improve quality-of-life
$381M $280M $238M
$223M $195M $172M
Data aggregation and analysis to support a wide range of healthcare use cases.
19
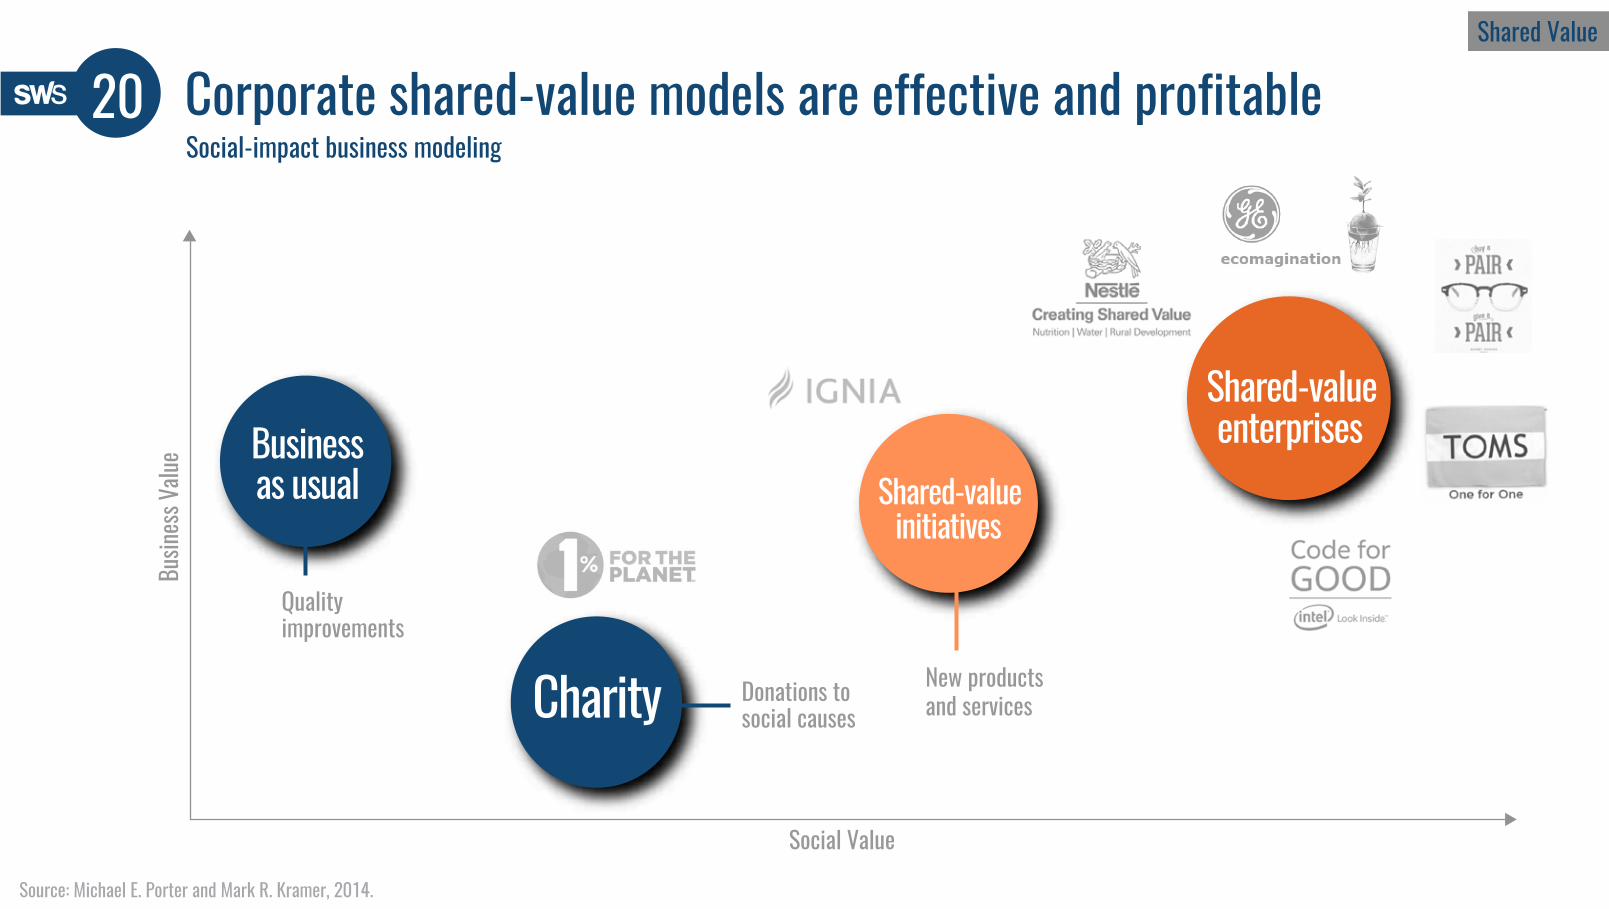
New productsand servicesDonations to
social causes
Qualityimprovements
Social Value
Busin
ess V
alue
Source: Michael E. Porter and Mark R. Kramer, 2014.
Corporate shared-value models are effective and profitable20Shared Value
Social-impact business modeling
Businessas usual
Charity
Shared-valueenterprises
Shared-valueinitiatives

2016TRENDS TO
WATCH
MEDIA& MKT
RE-MIX
DATA &ANALYTICSEXPLOSION
GAMING
3DPRINTING
SUBSCRIPTIONBUSINESS MODELS
GLOBALCONNECTIVITY
THE FUTURE OF HEALTH
NEW CONSUMPTION
SHIFTSMILLENNIALS
GEN Z
THE SHAREECONOMY
THE NEWWAY TO SHOP:
E-COMMERCE
INTERNET &SMARTPHONEPENETRATION
DIGITAL VIDEO TRUMPS
TRADITIONAL TV
MOBILEFIRST
CORPORATESHAREDVALUE
DIGITALGROWTH VS.TRADITIONAL
MEDIA
THE FUTUREOF WORK
ARTIFICIALINTELLIGENCE
/ MACHINELEARNING
ITSPENDINGGROWTH
BUSINESSINTELLINGENCE
FOR COMPETITIVEADVANTAGE
LOYALTY@THE CORE
INTERNETOF THINGS

ABOUT
[email protected] sws.ms
SWS is a hands-on consulting firm specialized in disruptive and results-oriented strategy. Our client list includes global players and local industry leaders in search for solid future positions that embrace the powerful benefits the connected world can offer.
Focused on both the US Latino and Mexican markets, our strengths comprise proven expertise in the telecom, media, marketing and digital space.


