50
The 2017-2018 APPA National Pet Owners Survey Debut Presented by: Julie Springer Trusted Data for Smart Business Decisions.
| Date post: | 17-Sep-2018 |
| Category: |
Documents |
| Upload: | truongnhan |
| View: | 213 times |
| Download: | 0 times |

1
The 2017-2018 APPA National Pet Owners Survey Debut
Presented by: Julie Springer
Trusted Data for Smart Business Decisions.

2
2017-2018 APPA National Pet Owners Survey©By the American Pet Products Association, Inc.
All rights reserved.255 Glenville Road, Greenwich, CT 06831Phone: 203-532-0000 Fax: 203-532-0551
www.americanpetproducts.org
No portion of these books may be reproduced in any form,by any means, without the prior written consent of APPA.
Cover Design by Mark Gilchrist, Bulldog Studios, Inc.

3
The American Pet Products Association (APPA) is the foremost not-for-profit trade association serving the interests of the pet products industry in the U.S. and internationally.
APPA was founded in 1958 with 35 member firms. Today APPA’s membership currently includes over 1,000 pet product manufacturers, importers, manufacturers’ representatives and livestock suppliers representing both large corporations and growing enterprises worldwide.
APPA was established to promote, develop and advance responsible pet ownership and the pet products industry. To this end, APPA supports industry-related market research; monitors and responds to industry legislation and regulation; and sponsors educational seminars, networking and PR opportunities, giving members the tools they need to make important business decisions.
APPA also works closely with other major organizations dedicated to similar goals to accomplish these and other important objectives.
Each year, APPA hosts Global Pet Expo, the largest annual pet products trade show in the world. Global Pet Expo is the premier event in the pet products industry and enables APPA members to showcase their latest pet product lines. This year’s show is sold out!
About The American Pet Products Association

4
In 1988, APPA began gathering quantified data from pet owners about pet ownership, pet care practices, purchasing behavior of pet-related products and sources of pet-related goods and services. These studies are conducted every other year. The current Survey was conducted in 2016 and is the fifteenth in the series.
APPA’s objective is to monitor consumer habits on an on-going basis to identify short and long-term trends, as well as new opportunities in pet ownership and pet product and service consumption.
The National Pet Owners Survey is over 600 pages of detailed data. It begins with an Executive Summary and continues with a section for each species researched – dog, cat, freshwater and saltwater fish, bird, small animal, reptile and horse. The final section in the report is the Lifestyle & Media Survey, which explores the personal habits and attitudes of pet owners, as well as their media habits.
Background and Objective

5
The 2017-2018 National Pet Owners Survey was conducted by Ipsos, Inc. Invitations to the current Survey were distributed online to a nationally representative sample from the Ipsos Online Panel. Prior to 2012, the Survey was conducted via their mail panel.
The Survey was divided into two parts – a screener and detailed pet owner module (questionnaire). 22,202 respondents completed the screener, of which 12,581 were current pet owners.
Following the screener, there were eight different modules, each corresponding to a different type of pet – dog, cat, freshwater fish, saltwater fish, bird, small animal, reptile and horse. Upon completing the screener, pet owners selected for one of the eight follow-up modules were then directed to complete the appropriate module based on the type of pet they owned.
A total of 2,559 completed pet owner surveys are included in the tabulations.
For the generational analysis, the following definitions for each generation apply. ‘Gen Y’ (1994-1980) includes respondents aged 18-36; ‘Gen X’ (1979-1965) respondents are 37-51 years old; ‘Baby Boomers’ (1964-1946) are between 52-70 and ‘Builders’ (1945-1920) are 71+ years old.
Methodology

6
The online sample was balanced by gender, age, household size, income and region. A quota system was used to ensure proper representation of sample groups.
The table below shows the number of completed surveys and the margin of error for each species.
The margin of error represents the percentage point difference were every pet owner in the U.S. to be interviewed.
Sample and Margin of Error
Pet Type Completed Surveys Margin of Error
Dog 505 +/- 4.4%
Cat 451 +/- 4.6%
Freshwater Fish 300 +/- 5.7%
Saltwater Fish 151 +/- 8.0%
Bird 301 +/- 5.7%
Small Animal 300 +/- 5.7%
Reptile 301 +/- 5.7%
Horse 250 +/- 6.2%
7
There are many benefits of The National Pet Owners Survey --- it is the complete knowledge center for information about the habits, attitudes and buying practices of pet owners in the U.S.
FIRST AND FOREMOST…..Read the Table of Contents! It tells you in precise detail the questions that are included in the report.
The information in this presentation, as well as that in the Executive Summary, is an overview and does not include all of the questions for each species or every response option.
By reading each species section the reader will obtain a more in-depth, detailed analysis of the questions asked in the Survey.
Get Maximum Benefits From The National Pet Owners Survey!

8
Every Survey year, the questionnaires undergo a revision process to ensure we include new trends in pet care, as well as new items in the pet market.
Some examples of new and/or revised questions included in the 2017-2018 Pet Owners Survey are:
Limited ingredient pet food, raw pet food and freeze-dried pet food (for dogs and cats
Grain-free and freeze-dried treats (for dogs and cats) and grass treats (for cats)
Calming products for pets BPA-free products Lightweight litter How often dog owners walk their pets Pet-monitoring systems The amount pet owners spend on wild bird feed/seed Importance of made in the USA products
What’s New in the Pet Owners Survey?

9
Currently, pet ownership stands at 68% of all U.S. households.
With the U.S. Census reporting 124.587 million households, the number of pet-owning households is 84.6 million.
Pet Ownership by Species (as a Percentage of the U.S. Population): Dog: 48% Cat: 38% Freshwater fish: 10% Bird: 6% Small animal: 5% Reptile: 4% Horse: 2% Saltwater fish: 2%
Pet ownership displays a consistent upward trend over more than two decades.
Pet Ownership in the U.S.

10
Number of Pets Owned in the U.S. (millions)
2016 Dog Cat FWFish
SWFish
Bird Small Animal
Reptile Horse
# # # # # # # #
Average # of pets owned per household - 2016:
1.49 2.00 11.14 7.50 2.57 2.09 2.01 2.91
# of households own pet type –2016 (millions):
60.2 47.1 12.5 2.5 7.9 6.7 4.7 2.6
Total # of pets in the U.S. – 2016 (millions):
89.7 94.2 139.3 18.8 20.3 14.0 9.4 7.6
The number of pets owned in the U.S. is calculated by multiplying the number of households that own the pet by the average number of pets owned per household.

11
The generational makeup of pet owners is starting to shift. In 2014, Baby Boomers were the largest segment of pet owners (37%). In 2016, that percentage declined to 32%.
Where previously Baby Boomers accounted for the largest segments of dog, cat and bird owners, the current data shows that Gen Y has supplanted Baby Boomers as the largest group of owners of these pets.
Pet Ownership by Generation
49%
62%
43%
53%
50%
46%
35%
38%
35%
21%
28%
32%
26%
32%
24%
27%
26%
27%
26%
10%
22%
19%
16%
28%
32%
31%
32%
4%
3%
2%
2%
2%
6%
5%
6%
0% 20% 40% 60% 80% 100%
Horse
Saltwater Fish
Freshwater Fish
Reptile
Small Animal
Bird
Cat
Dog
Current Pet Owners
Gen Y Gen X Baby Boomers Builders

12
This table is based on total current pet owners. It shows combinations of any two types of pets owned but does not show those who own more than one of the same type of pet or those who own more than two types of pets.
46% of current pet-owning households have multiple types of pets. A combination of dogs and cats is still the most common (32% of current pet
owners). 11% own dogs and fish, followed by cats and fish (9%) and dogs and birds (7%).
Pet Combinations Owned
2016 Dog Cat TotalFish
Bird SmallAnimal
Reptile Horse
% % % % % % %Dog X 32 11 7 6 4 3Cat 32 X 9 6 5 3 2Total Fish 11 9 X 3 3 2 1Bird 7 6 3 X 2 2 1Small Animal 6 5 3 2 X 2 1Reptile 4 3 2 2 2 X 1Horse 3 2 1 1 1 1 X

13
To ensure a representative group of respondents, the sample is designed to mirror the US Census numbers for certain variables. However, when the data is examined by specific species, there are notable demographic differences.
There is a higher percentage of bird owners in the Mid-Atlantic, South Atlantic and Pacific regions; a higher percentage of small animal owners in the Mid- Atlantic; a higher percentage of reptile owners in the Pacific region and a higher percentage of horse owners in the South Central regions.
Horse owners live in more rural areas, while bird owners live in large urban areas and reptile owners live in urban areas with 2.5-4.9 million people.
Horse owners have the highest average household incomes, followed by bird, fish, dog and small animal owners. Reptile owners have the lowest average household income.
Owners of small animals, fish, birds and reptiles demonstrate a higher percentage of having young children at home. Therefore, these owners also have larger households that are defined as family households.
Fish, small animal and reptile owners report the youngest average age, while cat, dog and horse owners report the oldest.
While pet owners in general report a higher percentage of home ownership than the total U.S. population, horse owners indicate the highest level of home ownership of a single family house.
Dog, fish and bird owners have the highest levels of being married, while cat and reptile owners actually fall below the levels reported for the general population.
Demographics of Pet Owners
14
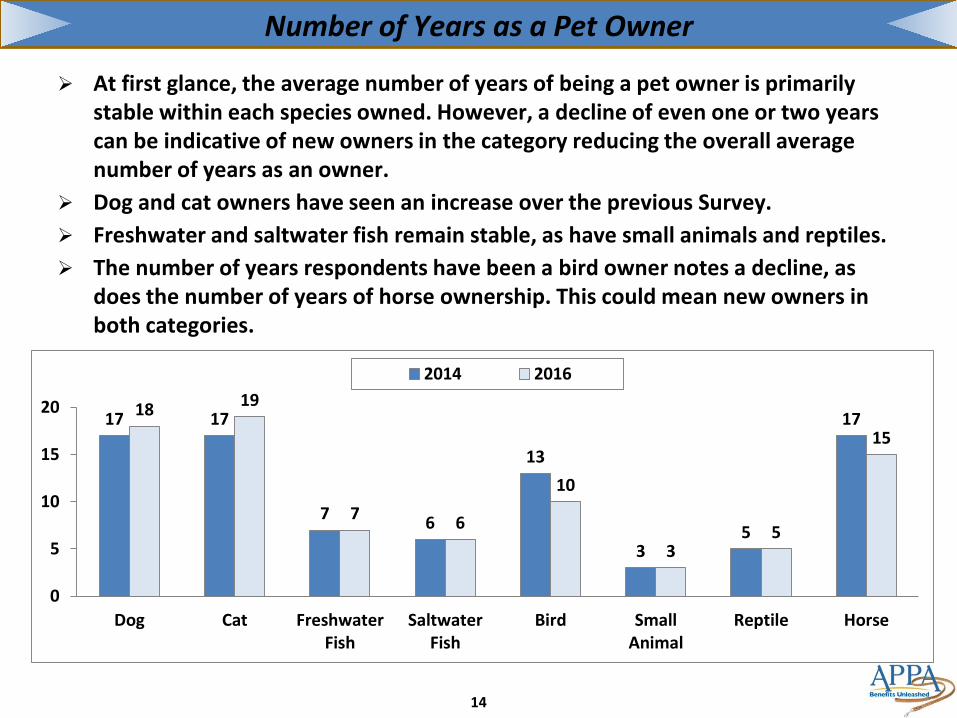
At first glance, the average number of years of being a pet owner is primarily stable within each species owned. However, a decline of even one or two years can be indicative of new owners in the category reducing the overall average number of years as an owner.
Dog and cat owners have seen an increase over the previous Survey. Freshwater and saltwater fish remain stable, as have small animals and reptiles. The number of years respondents have been a bird owner notes a decline, as
does the number of years of horse ownership. This could mean new owners in both categories.
Number of Years as a Pet Owner
17 17
7 6
13
35
1718 19
7 6
10
35
15
0
5
10
15
20
Dog Cat FreshwaterFish
SaltwaterFish
Bird SmallAnimal
Reptile Horse
2014 2016
15
2016 Dog Cat TotalFish
Bird SmallAnimal
Reptile
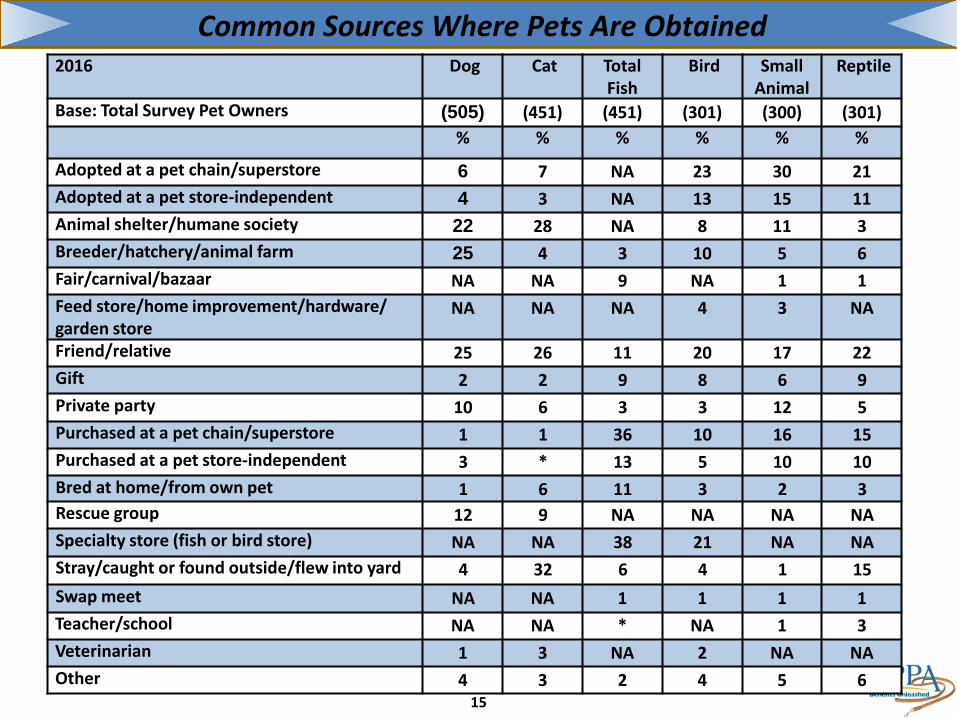
Base: Total Survey Pet Owners (505) (451) (451) (301) (300) (301)% % % % % %
Adopted at a pet chain/superstore 6 7 NA 23 30 21Adopted at a pet store-independent 4 3 NA 13 15 11Animal shelter/humane society 22 28 NA 8 11 3Breeder/hatchery/animal farm 25 4 3 10 5 6Fair/carnival/bazaar NA NA 9 NA 1 1Feed store/home improvement/hardware/ garden store
NA NA NA 4 3 NA
Friend/relative 25 26 11 20 17 22Gift 2 2 9 8 6 9Private party 10 6 3 3 12 5Purchased at a pet chain/superstore 1 1 36 10 16 15Purchased at a pet store-independent 3 * 13 5 10 10Bred at home/from own pet 1 6 11 3 2 3Rescue group 12 9 NA NA NA NASpecialty store (fish or bird store) NA NA 38 21 NA NAStray/caught or found outside/flew into yard 4 32 6 4 1 15Swap meet NA NA 1 1 1 1Teacher/school NA NA * NA 1 3Veterinarian 1 3 NA 2 NA NAOther 4 3 2 4 5 6
Common Sources Where Pets Are Obtained

16
Word of mouth is the most effective tool to communicate a pet’s availability. The Internet is a leading resource for dogs, fish, birds and small animals. The
percentage of pet owners who learned their fish, bird or small animal was available via the Internet has increased from the previous Survey.
Close to one-half of cat, fish and reptile owners learned about their pet from an “other” undefined source.
How Owners Learn of Pet’s Availability
2016 Dog Cat TotalFish
Bird SmallAnimal
Reptile
Base: Total Survey Pet Owners
(505) (451) (451) (301) (300) (301)
% % % % % %Internet/online 33 19 32 31 35 21Newspaper/magazine/ publication
10 5 17 11 5 2
Sign/bulletin board 3 2 10 8 6 1Word of mouth 46 45 39 46 42 47Other 25 49 47 33 32 44
17
Dog and cat owners report spending the most on the same categories –boarding/kennel, food and all types of veterinarian visits (sick, routine, surgical and emergency). While the amounts spent are comparable for food, for the other expenses, cat owners tend to spend less than dog owners.
Freshwater fish owners spend more on ponds, tanks, stands and aquariums, while saltwater fish owners’ top expenses are tanks, filtration, water conditioners and other supplies.
Bird owners spend the most on treats, followed by food, sick veterinarian visits and cages.
Horse expenditures are clearly in a category of their own, with the top items being boarding and food. Other expenses topping $1,000 per year are stable help, trainers and saddles.
Please note that these expenses are based on consumer recollection and not syndicated sales data.
The chart on the next page compares some common expenses but does not include every item related to pet ownership.
Pet-Related Expenses

18
2016 Dog Cat FWFish
SWFish
Bird Horse
Base: Total Survey Pet Owners (505) (451) (300) (151) (301) (250)
$ $ $ $ $ $
Beds (bowls-fish; blankets/wraps/sheets-horse) 43 29 80 86 NA 204Boarding/kennel (ponds-fish) 322 164 376 NA 56 2,645Books/pamphlets/videos on care/training 27 17 NA NA 30 NACages/crates (desktop aquariums-fish; stable help-horse) 62 NA 100 99 129 2,418Carriers (tanks-fish; trainers-horse) 86 38 234 192 NA 1,131Emergency veterinarian visits 349 154 NA NA 107 471Food 235 235 41 101 169 1,776Food treats (live plants-fish) 72 56 78 75 378 261Groomer/grooming aids (filtration-fish) 84 30 60 118 45 225Heartworm medication (hoof care-horse) 102 65 NA NA NA 540Leashes (lighting-fish; training aids-horse) 23 28 73 83 NA 337Medicated flea & tick control products (medicated shampoo-bird; insect control-horse)
85 77 NA NA 49 102
Non-medicated collars/decorative collars (stands-fish; bridle/bridle accessories-horse)
21 18 190 74 NA 288
Other expenses (saddles-horse) 104 91 NA NA 63 1,168Other medications 132 82 92 66 89 366Other supplies (farrier-horse) 71 71 75 117 51 612Routine veterinarian visits (test kits-fish) 257 182 67 47 102 549Shampoo/conditioner (non-medicated) 25 24 NA NA 34 110Sick veterinarian visits 204 244 NA NA 138 NASurgical veterinarian visits 474 245 NA NA 45 NAToys (decorations-fish) (rider gear/boots/helmets-horse) 47 30 50 80 35 388Vitamins/supplements (chemicals/water conditioners-fish) 58 46 43 132 40 NA
Pet-Related Expenses

19
Caring for a Pet’s Health2016 Dog Cat BirdBase: Total Survey Pet Owners (505) (451) (301)
# # #Average number of veterinarian visits in the past 12 months: 2.7 2.2 3.1
Services received at the veterinarian’s office: % % %Rabies vaccinations 48 31 NA
Routine physical 68 49 45Other vaccine(s) 58 42 23Flea/tick protection/prevention/cure products 39 19 NAFor specific illness/only when sick 28 20 11
Boarding 4 2 10Food 10 7 39Food treats 6 3 28Dental care products/services 16 8 NAEmergency visit 11 6 15Grooming 14 5 27Grooming supplies 3 2 14
Surgery 10 8 8
Other 4 2 5
% % %
Pets spayed/neutered: 85 93 NA
Pets groomed (any type, professional or at home): 84 9 35
Pets given homeopathic remedies: 8 6 NA
Pets given flavored oral medication: 29 18 NA
Pets ever put in hospice care at a veterinarian’s: 5 6 NA
20
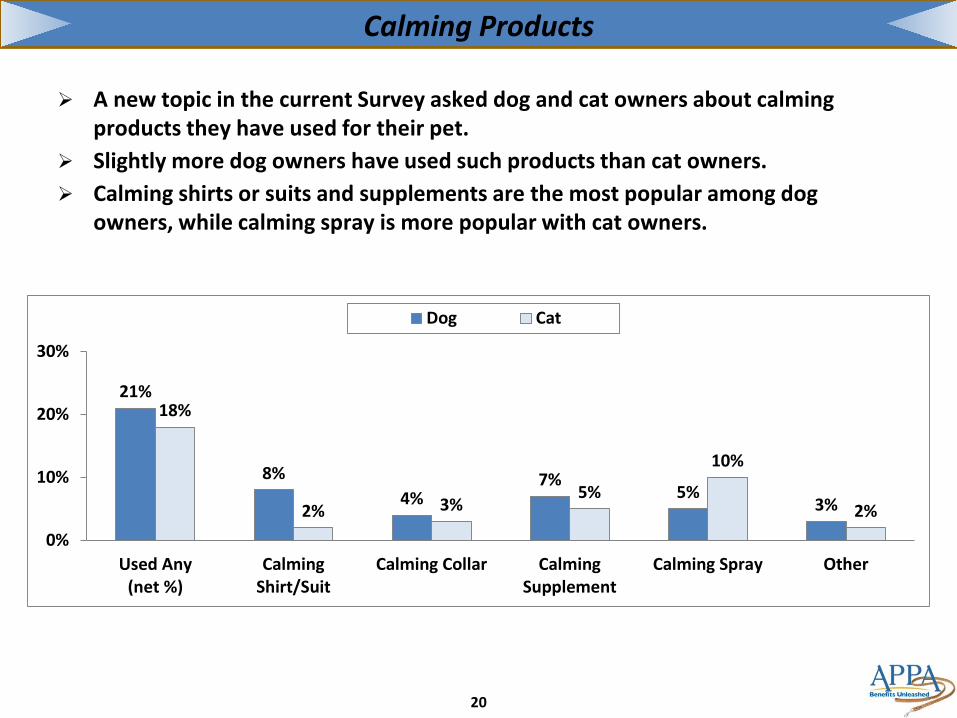
A new topic in the current Survey asked dog and cat owners about calming products they have used for their pet.
Slightly more dog owners have used such products than cat owners. Calming shirts or suits and supplements are the most popular among dog
owners, while calming spray is more popular with cat owners.
Calming Products
21%
8%4%
7%5%
3%
18%
2% 3%5%
10%
2%0%
10%
20%
30%
Used Any(net %)
CalmingShirt/Suit
Calming Collar CalmingSupplement
Calming Spray Other
Dog Cat

21
Almost half of dog owners have an electronic tracking device for their pet. This is an increase from the last Survey’s level of 36%.
More than one-quarter of cat owners have such a device. The other four pet categories have all noted increases from the past Survey.
Electronic Tracking Devices
43%
27%
5%9%
5%
15%
0%
10%
20%
30%
40%
50%
Dog Cat Bird Small Animal Reptile Horse

22
10% of dog owners and 5% of cat owners have health insurance for their pets. Based on the total number of dogs and cat in the US that equates to nearly 9 million
dogs and over 4.5 million cats with insurance. Gen Y dog and cat owners are more likely than older pet owners to have insurance
policies for their pets. Most policies cost between $250-$499 per year.
Health Insurance for Dogs and Cats
1% 1%2%
3% 3% 3%4%
5%4%
10%
1% 1% 1% 1%
3%4%
5%
0%
2%
4%
6%
8%
10%
12%
1998 2000 2002 2004 2006 2008 2010 2012 2014 2016
Dog Cat

23
The current Survey shows across the board increases in the use of vitamins and other supplements for pets.
26% of bird owners give their pet vitamins only. 15%-20% of bird, small animal and reptile owners give their pets both vitamins and
other supplements. Dog owners tend to use vitamins and supplements equally, while cat owners lean
more toward vitamins only.
Pets Given Vitamins and/or Other Supplements
9%6%
26%
11% 10%10%
3%
8%5%
9%8%4%
16% 15%19%
0%
5%
10%
15%
20%
25%
30%
Dog Cat Bird Small Animal Reptile
Vitamins Only Other Supplements Only Both Vitamins and Other Supplements

24
Food Purchased for Dogs and Cats
Dog Cat
2012 2014 2016 2012 2014 2016
Base: Total Survey Pet Owners (527) (521) (505) (461) (457) (451)% % % % % %
Food with added vitamins or minerals (such as calcium or vitamin E)
19 16 12 17 18 18
Food with added glucosamine and/or chondroitin 8 5 6 2 4 3Food with added herbs and/or botanicals 3 3 3 5 6 5Food with added prebiotics or probiotics 5 5 6 5 7 4Organic food (food made in accordance with acertification process which limits the amount of chemicals used in production)
7 7 8 4 6 7
Natural food (food with no synthetic material, but no certification process)
18 19 22 14 19 18
Gourmet food (food considered upscale or fancy) 8 6 5 15 19 17Premium food (food with more nutrients, less preservatives & metabolized more efficiently than lower grade food)
45 47 41 40 42 39
Grain-free/gluten-free food 7 11 19 4 9 15Raw food NA NA 3 NA NA 4Specialty food (e.g., kosher, vegetarian, frozen, fresh, etc.) 3 5 5 4 7 2Limited ingredient food (for pets with food sensitivities) NA NA 12 NA NA 10Other pet food 20 16 16 31 23 23Human food (either cooked or raw) 19 17 17 10 9 9Bottled water for pets (plain/flavored/nutrient enhanced) 3 4 4 2 3 4

25
The percentage of pet owners giving treats to their pets has increased from the previous Survey across all pet types.
New to this year’s Survey are grain-free treats and freeze-dried treats (for dogs and cats) and grass treats for cats.
More specific treat information can be found in the individual species sections of the Survey.
Pets Given Treats
93%
73%
87% 82%
56%
32%
94%
78% 82% 81%
51%39%
95%
80%92% 88%
54%43%
0%
20%
40%
60%
80%
100%
Dog Cat Bird Small Animal Reptile Horse
2012 2014 2016

26
Gifts for Pets2016 Dog Cat Total
FishBird Small
AnimalReptile Horse
Base: Total Survey Pet Owners (505) (451) (451) (301) (300) (301) (250)
% % % % % % %Any Gift Purchased (net %): 78 67 46 69 74 46 62Anytime/no special occasion 44 42 27 35 44 32 38Birthday 28 17 14 19 24 9 19Chanukah 2 1 7 6 4 1 4Christmas 48 38 13 26 33 14 25Easter 5 2 9 8 8 1 8Halloween 7 4 6 9 6 3 5Valentine’s Day 6 5 7 8 7 1 6Other holiday 2 2 3 4 4 * 3When pet is good 12 6 - 12 8 3 10When we go on vacation 6 3 5 6 7 4 6Other occasions 7 5 2 6 8 3 7Do not purchase gifts for pet 22 33 54 31 26 54 38
% of Pets Who Share Gifts 70% 87% NA NA NA NA NA
Base: Purchased Gift for Pet (396) (304) (205) (209) (223) (138) (154)Average spent per gift: $14 $12 $80 $56 $26 $22 $72# of gifts purchased per year: 5.0 4.9 3.9 4.0 4.5 3.2 6.6

27
11% of dog owners and 5% of cat owners hold holiday or birthday parties for their pet. The percentage of dog owners has increased from 7% in 2014.
Horse owners are the most likely to have purchased “pet-themed” merchandise (61%), while dog owners are the least likely (25%).
Pet Parties and Pet-Themed Merchandise
11%
25%
5%
33%39% 39% 38% 38%
61%
0%
10%
20%
30%
40%
50%
60%
70%
Hold Holiday/Birthday Parties Bought "Pet-Themed" Merchandise
Dog Cat Fish Bird Small Animal Reptile Horse

28
Most pet owners indicate equal patronage of independent pet stores and pet superstores, with 70% or more visiting both within the past 12 months.
Owners of saltwater fish, small animals and reptiles visit independent pet stores and pet superstores between 6 and 8.5 times per year. Owners of other species report between 5 and 6 visits to each.
Local/Independent Pet Stores vs. Pet Chains/Superstores
80%70%
86% 99%79% 73%
87% 95%
0%20%40%60%80%
100%
Dog Cat Freshwater Fish Saltwater Fish
Pet Store - Independent Pet Chain/Superstore
90% 90% 88%90% 91% 89%
0%20%40%60%80%
100%
Bird Small Animal Reptile
Pet Store - Independent Pet Chain/Superstore

29
The previous Survey indicated close to one-third of pet owners had purchased food, treats, medications and supplies online. The current Survey shows closer to one-half are doing so.
The average number of purchases of each item per year has remained consistent with the previous Survey.
Items Purchased Online
2016 Current Pet Owners
Dog Cat FWFish
SWFish
Bird SmallAnimal
Reptile Horse
Base: Total Pet Owners (12,581) (8,701) (6,773) (1,689) (227) (881) (729) (553) (289)Items Purchased: % % % % % % % % %Food 48 50 48 51 72 75 56 53 56Treats 45 50 44 45 72 61 55 48 58Medication 37 44 37 39 69 51 42 41 60Other Supplies 47 49 48 50 72 59 61 57 66
2016 Current Pet Owners
Dog Cat FWFish
SWFish
Bird SmallAnimal
Reptile Horse
Base: Total Pet Owners (12,581) (8,701) (6,773) (1,689) (227) (881) (729) (553) (289)Average # of Purchases:
# # # # # # # # #
Food 7.6 7.5 7.9 7.0 7.5 7.1 7.1 7.4 8.3Treats 6.0 6.1 6.0 5.7 5.9 5.4 5.6 5.8 6.7Medication 3.4 3.5 3.5 3.4 4.0 3.9 3.7 3.6 4.1Other Supplies 4.5 4.4 4.9 4.7 5.2 5.1 5.2 5.1 5.9

30
Brand name is very important to 50% of saltwater fish owners. Brand name importance has increased among all pet owners (except dog
owners). Across all pet types owned, significantly more Gen Y pet owners feel that brand
name is very important when shopping for pet care items
Importance of Brand Name
2016 Dog Cat FWFish
SW Fish
Bird SmallAnimal
Reptile Horse
Base: Total Survey Pet Owners
(505) (451) (300) (151) (301) (300) (301) (250)
% % % % % % % %Very important 15 16 14 50 33 22 12 24Somewhat important 54 54 45 40 44 39 44 50Not at all important 31 30 41 10 23 39 44 25

31
The amount of time spent on each media outlet is fairly consistent across the different pet types owned.
By generation, media habits exhibit differences. For example, time spent on the Internet increases as the age of the pet owner decreases. Gen Y spends 3.5 hours per day, while Builders spend 2.8 hours per day.
Television watching patterns are the reverse of the Internet pattern, with the amount of time spent watching television greater among older pet owners.
Media Habits
3.22.8
1.2
0.5 0.5
3.5
2.5
1.4
0.6 0.6
3.2
2.7
1.3
0.4 0.5
3.1 3.1
1.1
0.5 0.5
2.8
3.5
0.90.7
0.5
0
1
2
3
4
Internet Television Radio Newspapers Magazines
Current Pet Owners Gen Y Gen X Baby Boomers Builders

32
2016 Dog Cat TotalFish
Bird SmallAnimal
Reptile Horse
Base: Total Survey Pet Owners (505) (451) (451) (301) (300) (301) (250)
% % % % % % %
Advertising 5 4 8 6 8 2 10Animal shelter personnel (clinicians-horse) 5 5 NA NA NA NA 22Bird store/fish store/tack store (horse) NA NA 37 18 NA NA 22Books/library/videos 9 12 12 20 19 20 31Breeder 7 1 5 9 NA 7 15Friends/relatives 28 35 25 20 36 27 46Groomer (groom/barn manager-horse) 14 3 NA NA NA NA 16Internet/online 42 48 42 52 61 71 43Kennel/breed club/societies 3 4 11 11 NA 9 23Magazines (sports organizations-horse) 9 12 9 14 11 6 6Other store personnel (feed store-horse) 2 3 6 6 9 8 31Past experience 32 38 25 21 40 29 58Pet store personnel 13 17 39 31 39 45 8Radio 3 3 3 2 4 1 6Television 11 11 10 13 10 4 11Trainer/farrier (horse) 3 NA NA NA NA NA 47Veterinarian 60 49 10 26 28 21 70Other 8 10 6 7 2 8
Information Sources

33
26%29%32%41%48%43%
0%20%40%60%80%
Horse
2006 2008 2010 2012 2014 2016
Information Sources – The Internet
23% 20% 27%27% 28% 34%34% 32%44%43% 41% 41%44% 42% 47%42% 48% 42%
0%20%40%60%80%
Dog Cat Fish
2006 2008 2010 2012 2014 2016
30% 38% 45%30%
48% 52%39%
55% 59%53% 61% 66%58% 64% 62%52%
61%71%
0%20%40%60%80%
Bird Small Animal Reptile
2006 2008 2010 2012 2014 2016

34
Browsing in a store is the number one way a pet owner becomes aware of new pet products.
While television ads have softened, they are still the number two source of new products, followed by the Internet at number three.
How a Pet Owner Becomes Aware of New Pet Products
2016 Current Pet Owners
Dog Cat TotalFish
Bird SmallAnimal
Reptile Horse
Base: Total Pet Owners (12,581) (8,701) (6,773) (1,790) (881) (729) (553) (289)
% % % % % % % %Any Internet (net)% 38 40 40 44 51 50 50 52Internet/Web surfing 32 34 34 37 43 42 44 44Online banner ads 8 9 9 10 15 13 12 19Link from another site 9 11 11 13 19 17 16 54
Browse in a store 58 58 60 60 59 66 66 68Direct mail 11 12 13 13 19 17 16 25Friend/Relative 31 34 32 34 34 37 41 41Pet store personnel 21 23 21 31 32 33 32 30Print ad 23 23 25 22 24 25 24 24Radio 5 6 6 7 11 8 9 14Television ad 39 41 42 37 37 36 38 36Veterinarian 25 30 25 25 32 28 26 42Other 3 3 4 4 5 4 4 5

35
Those using the Internet to learn about new pet products usually do so through a pet product company website.
The use of Facebook pages has significantly increased from the previous Survey. Other social media outlets (Instagram, Twitter, YouTube, etc.) have all noted
increases over the previous Survey.
How a Pet Owner Learns About Pet Products on the Internet
2016 Current Pet Owners
Dog Cat TotalFish
Bird SmallAnimal
Reptile Horse
Base: Total Pet Owners Who Became Aware of Products via the Internet
(4,721) (3,485) (2,673) (778) (451) (364) (276) (150)
% % % % % % % %Blogs 19 21 21 23 32 33 30 37Facebook pages 47 50 51 51 54 57 50 58Instagram 14 17 17 19 29 25 21 27Pet product company websites
63 63 64 67 67 69 68 69
Pinterest 22 24 23 27 24 30 34 37Product review sites 43 44 42 46 45 48 50 56Twitter 12 15 16 17 27 20 15 21YouTube 25 28 28 35 45 37 33 36Other 13 11 13 10 10 9 14 13

36
Owners of all types of pets recognize the benefits of companionship/love/company/ affection, that pets are fun to have in the home, pets are like a family member and pets can relieve stress.
Fish owners enjoy their pets for their appearance and as a hobby. Bird and reptile owners feel their pets are a conversation piece. Reptile, cat and small animal owners appreciate the convenience of their pets. Nearly half of all small animal and horse owners feel their pet is good for teaching
children responsibility. Health benefits are noted by owners of horses, dogs and cats. Drawbacks to pet ownership are often species specific (for example, keeping water
clean for fish, noise for birds or shedding for dogs and cats). In general terms, some universal drawbacks mentioned are sadness when the pet
dies, cleaning up, the cost for food/care/medicine and finding care when away from home.
Some pet owners feel there are no drawbacks to pet ownership. Dog and reptile owners are the most likely to say there are no drawbacks (24% and 23%, respectively).
Benefits and Drawbacks of Owning Pets

37
2016 Dog Cat TotalFish
Bird SmallAnimal
Reptile Horse
Base: Total Survey Pet Owners (521) (457) (452) (301) (300) (300) (250)% % % % % % %
Appearance NA NA 44 NA NA NA NABreed for money (breeding-horse) NA NA 5 5 5 2 15Brings my family closer together 38 35 18 29 35 21 38Companionship, love, company, affection 81 83 NA 46 62 29 62Convenience, easy to maintain 14 37 29 31 36 46 NAConversation piece (entertainment-horse) NA NA 32 40 32 49 46Educational (dog shows; for profit-horse) 1 NA 18 21 24 31 13Fun to watch, have in household 73 76 64 67 76 73 62Good for children, teach responsibility 25 22 33 34 52 36 46Good for my health or my family’s health 53 46 20 28 37 20 59Provides therapy/assistance to handicapped/elderly
12 8 NA NA NA NA NA
Hobby (manual labor-horse) NA NA 34 22 26 32 30Keep undesirable animals/rodents away 14 33 NA NA NA 3 NALike a child/family member 59 56 NA 45 44 28 46Quiet (trail/pleasure riding-horse) NA NA 36 NA NA 53 62Relaxation/relieves stress 67 68 51 48 55 40 71Security 49 NA NA NA NA NA 10Walking/jogging/exercise 48 NA NA NA NA NA 58
Benefits of Owning a Pet

38
2016 Dog Cat TotalFish
Bird SmallAnimal
Reptile Horse
Base: Total Survey Pet Owners (521) (457) (452) (301) (300) (300) (250)% % % % % % %
Algae NA NA 28 NA NA NA NABad around other pets 5 4 NA 7 6 4 14Bad around small children/biting (safety issues-horse) 3 2 NA 8 5 2 19Cleaning up (time consuming-horse) 26 28 38 43 45 36 29Cost for food, care, medicine (maintenance-horse) 31 31 16 19 25 16 46Damage to furniture, carpets, floors 18 37 NA 12 17 2 NADamage to outdoor property 5 2 NA NA 12 1 NAEscape from cage NA NA NA 11 11 9 NAFamily member allergy 4 7 NA 6 10 1 9Finding care when away from home 28 23 20 24 25 23 40Fleas and ticks 14 18 NA NA NA NA NAGetting children to accept responsibility 3 2 NA 9 16 10 8Health problems (dog, cat, horse)/sanitary conditions (bird, small animal, reptile)/keep water clean (fish)
14 14 40 12 8 7 18
Noise 26 14 NA 25 7 NA 4Odor 12 29 NA 15 36 23 8Sadness when they die/die too easily 48 54 23 38 53 35 59Shedding 32 40 NA NA NA NA NAToo great a responsibility (daily responsibility-horse) 3 3 8 9 7 3 30Veterinarian not knowledgeable NA NA 7 10 7 9 46No drawbacks to ownership 24 19 16 18 15 23 10
Drawbacks of Owning a Pet

39
80% of total pet owners derive happiness and emotional support from their pets. Stress relief and lower anxiety or depression are reported by 66% and 55% of pet
owners, respectively. Physical benefits such as lower blood pressure and more exercise are noted by
one-third of pet owners.
Specific Health Benefits From Pet Ownership
2016 Current Pet Owners
Dog Cat FWFish
SWFish
Bird SmallAnimal
Reptile Horse
Base: Total Pet Owners (12,581) (8,701) (6,773) (1,790) (1,689) (227) (881) (729) (553)% % % % % % % % %
Better mental acuity 32 35 32 34 33 45 40 40 40Happiness/Emotional support
80 81 81 76 76 66 76 80 80
Exercise more 33 44 27 34 34 45 41 37 37Improvedcardiovascular health
18 22 17 18 18 30 25 22 22
Improved immunity 14 16 15 16 16 32 22 19 21Less anxiety/ depression
55 57 57 55 56 52 55 62 63
Lower blood pressure 34 35 37 33 34 37 38 38 40Stress relief 66 67 68 67 67 65 64 72 70Other 4 4 4 4 4 5 5 5 5No health benefits 8 6 7 10 10 2 6 7 9

40
Personal Attitude Statements2016 Current Pet
OwnersDog Cat Total
FishBird Small
AnimalReptile Horse
Base: Total Survey Pet Owners (12,581) (8,701) (6,773) (1,790) (881) (729) (553) (289)
% % % % % % % %People should only have pets if committed to spending time with it
85 85 85 83 82 84 85 85
Pets are a good source of affection 85 85 85 81 82 84 87 87
Exercising with a pet is more enjoyable than exercising alone
59 68 54 62 65 63 67 72
I am aware that owning a pet can be beneficial to my health
81 82 82 79 80 82 84 85
Buying eco-friendly products is important to me
45 46 47 48 54 51 49 50
Interacting with a pet can help me relax 82 83 84 79 83 83 85 86
Pets bring family members closer together 71 74 71 71 74 75 78 76
I want my children to have the experience of growing up with a pet
64 68 63 69 68 77 77 73
Pets are easier to take care of now than in the past
41 42 43 43 53 48 46 45
Pets are happier with another pet at home 52 54 58 57 63 62 65 66
The health benefits of pet ownership are very important to me
66 69 66 63 69 66 72 71
It’s important to me to shop for the best deal/use coupons
68 68 69 70 68 72 71 65
Having a pet is a conversation starter 66 68 65 65 69 69 72 68
Buying BPA-free pet products is important to me
42 45 43 45 53 49 47 44
Buying pet products made in the USA is important to me
61 64 60 60 65 60 61 68

41
2016 Current Pet Owners
Dog Cat TotalFish
Bird SmallAnimal
Reptile Horse
Base: Total Pet Owners (12,581) (8,701) (6,773) (1,790) (881) (729) (553) (289)
% % % % % % % %Spend less money on pet
15 17 16 17 20 20 21 24
Spend more money on pet
10 11 11 13 21 17 14 21
Didn’t get a pet 3 3 3 5 7 4 5 7Had to give up pet 2 2 2 3 5 5 5 9Not influenced by economy
73 70 72 69 61 64 65 58
Influence of the Economy on Pet Ownership
Compared to 2014, the percentage of pet owners spending less on their pet because of the economy has gone down slightly and the percentage spending more on their pet has risen slightly.
Most pet owners say their pet ownership is not influenced by the state of the economy.
42
2016 Current Pet Owners
Dog Cat TotalFish
Bird SmallAnimal
Reptile Horse
Base: Total Pet Owners (12,581) (8,701) (6,773) (1,790) (881) (729) (553) (289)
% % % % % % % %Yes 11 13 12 15 23 17 16 31No 47 48 46 47 39 47 45 34Don’t know/Not sure 4 4 4 5 5 5 6 5Not applicable 38 35 38 34 33 31 33 31
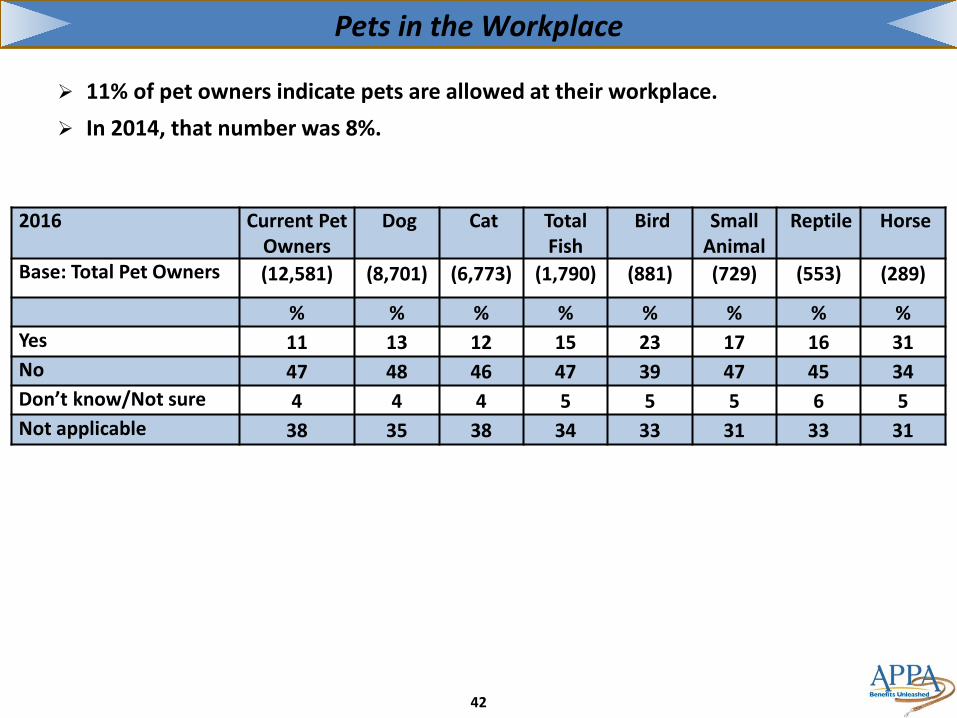
Pets in the Workplace
11% of pet owners indicate pets are allowed at their workplace. In 2014, that number was 8%.

43
Making provisions (either financial or naming a caretaker) for pets in the owners’ wills is becoming more common, especially among Gen Y owners.
Owners of horses, birds and fish are the most likely to financially provide for their pets.
Caretakers have been named by more than half of all horse owners and close to 40% of dog, cat, bird, small animal and reptile owners.
Provisions for Pet in Owner’s Will
2016 Dog Cat Total Fish
Bird SmallAnimal
Reptile Horse
Base: Total Survey Pet Owners (505) (451) (451) (301) (300) (301) (250)% % % % % % %
Financially provided for your pet
12 12 21 25 18 7 29
Have a caretaker/guardian for your pet
37 39 25 39 39 38 56
Neither of these 56 57 60 46 54 60 35

44
What Owner Would Buy Upon Death of Pet
2%
28%
2%4%
19%
2%
12% 12% 13%8%
11%8%
3%6% 4%
8% 8%
0%
10%
20%
30%
40%
Casket Urn For Ashes Headstone
Dog Cat Bird Small Animal Reptile Horse
17%
3% 4%
16%
2% 2%
25%
7% 7%
24%
7%
24%
2%
19% 19%
0%
10%
20%
30%
40%
Memorial Stone ForHome/Yard
Grief Book/Kit Plot In A Pet Cemetery
Dog Cat Bird Small Animal Reptile Horse

45
What Owner Would Do if Their Pet Died 41% of pet owners would get another
pet of the same type if their current pet died.
5% would get a different type of pet. Both numbers are higher than
previously reported.
How Long Would Pet Owner Wait to Get a New Pet
20% of those who would get another pet would do so within a week, while 27% would do so within a month.
One-quarter would get a new pet within six months.
What Owner Would Do If Their Pet Died
Get Another Pet Of Same
Type 41%
Get Another Type Of Pet 5%Would Not Get
Another Pet 16%
Not Sure What We Would Do
38%
Within A Week 20%
Within A Month 27%Within Six
Months 26%
Within A Year 11%
More Than A Year 3%
Not Sure 13%

46
Previous Pet Ownership (by Current Pet Owners)
2016 Dog Cat Total Fish
Bird SmallAnimal
Reptile Horse
Base: Total Survey Pet Owners (505) (451) (451) (301) (300) (301) (250)% % % % % % %
Owned a Previous Pet 85 93 89 85 91 93 98
Base: Total Pet Owners Who Previously Owned a Pet
(429) (418) (401) (256) (274) (280) (245)
% % % % % % %Length of Time Between Previous and Current Pet:One week or less 5 4 12 8 7 3 9One month or less 10 9 13 16 12 8 5Six months or less 18 18 18 22 21 17 19One year or less 8 7 12 8 10 9 8More than a year 35 28 19 17 24 19 11Got current pet while I stillhad my previous pet
17 27 19 20 20 35 38
85% or more of all pet owners indicate they have previously owned a pet. More than one-third of reptile and horse owners and one-quarter of cat owners
got their current pet while they still had their previous one.

47
Reasons for Owning Multiple Pets
2016 Dog Cat Total Fish
Bird SmallAnimal
Reptile Horse
Base: Total Pet Owners with Multiple Pets
(208) (334) (439) (275) (269) (277) (249)
% % % % % % %Pets are companions for each other 65 64 39 45 48 33 53Enjoy having multiple pets 50 53 55 52 67 70 63Companionship for me/my family 43 52 43 48 54 46 56Rescued from a shelter 26 24 19 26 23 18 35Health benefits for me/my family 16 18 25 25 29 16 34Pets are related/Didn’t want to separate them
12 18 13 15 13 8 16
Blending families/Moved in together
6 7 11 14 10 5 8
Other 9 12 12 7 9 9 11
Dog and cat owners with multiple pets say the primary reason for owning more than one pet is companionship for each other, followed by the owner’s enjoyment of multiple pets.
Companionship for the owner is given as a reason by close to half of all pet owners with multiple pets.

48
The humanization of pets continues to be a driving factor for the pet industry. More than ever before pet owners are: Feeding their pets as they do themselves, with more turning to organic or
grain-free options. Giving their pets vitamins/other supplements. Purchasing treats for their pets.
Millennials (Gen Y), in particular, are taking the humanization of their pets to the next level. For example, Gen Y dog owners are more likely to: Take their pet to the vet more often, give them flavored oral medication and
give them vitamins Pay for any pet service (day care, boarding, pet sitting at home) Have been to a pet-friendly restaurant Take their dog with them on errands and to a dog park Own designer items for their pet and hold parties for their dog Buy gifts for more occasions, spending more per gift and getting more gifts in
total
Interesting Facts We Learned from This Survey…

49
Once a pet owner, always a pet owner! More pet owners say they will get another pet when the time comes.
Pets will be taken care of when their owner dies, with financial arrangements and a caretaker named for them.
The use of electronic tracking devices continues to increase – pet owners want to keep their pet safe.
The role of the Internet continues to expand, with more pet owners shopping online for pet supplies and social media playing an increasing role in educating pet owners on new pet products.
Brand name is very important to more pet owners than ever and more pet owners are spending more money on their pet.
Pets continue to be an important part of their owners’ lives, providing companionship and love, relieving stress and offering a host of other health benefits. In turn, pet owners are humanizing pets more than ever!
Unleash the Benefits of Pet Ownership!

50
The 2017-2018 APPA National Pet Owners Surveyis ready for release!
Global Pet Expo Special Pre-Order PricingMembers $1,000
Non-Members $3,000
Other reports currently available from APPA:- APPA Generational Report
- APPA National Pet Market Opportunity Study- Customized Reports
Please see Julie Springer at the APPA Member Services Booth to order or contact APPA’s Member Relations Department
anytime for more information.203-532-0000
APPA – The Complete Knowledge Center


