The 2017 Canadian UFO Survey Summary Since 1989, Ufology Research (formerly Ufology Research of Manitoba) has solicited UFO case data from known and active investigators and researchers in Canada. The goal has been to provide data for use by researchers trying to understand this controversial phenomenon. 2017 marks the 29th year of collecting and analyzing Canadian UFO report data by Ufology Research. Previous Canadian UFO Surveys are available online at: http://survey.canadianuforeport.com There were 1,101 UFO sightings reported in Canada in 2017, or more than three each day. This is the fifth year in a row that UFO reports in Canada are at or above this level. Quebec had an all-time record high number of UFOs reported in 2017, with 518 reports, up from 430 cases in 2016. In comparison, Ontario had 241 reports, BC had 128, and both New Brunswick and Nova Scotia had 27 cases each. There were even two reports from Northwest Territories and three from Yukon. In 2017, about eight per cent of all UFO reports were judged unexplained. This percentage of “unknowns” falls to less than one per cent when only higher-quality cases are considered. There is an overall average of two witnesses per UFO sighting. The typical UFO sighting lasted approximately 15 minutes in 2017. The study found that 43 per cent of all UFO sightings were of simple lights in the sky. Witnesses also reported point sources of light, spheres and boomerangs. Results of this study show that many people continue to report unusual objects in the sky, and some of these objects do not have obvious explanations. Many witnesses are pilots, police and other individuals with reasonably good observing capabilities and good judgment. Numbers of reported UFO sightings remain high. Several theories for this can be suggested: more UFOs are present and physically observable by witnesses; more secret or classified military exercises and overflights are occurring over populated areas; more people are unaware of the nature of conventional or natural objects in the sky; more people are taking the time to observe their surroundings; more people are able to report their sightings with easier access to the Internet and portable technology; or even that the downturn in the economy is leading to an increased desire by some people to look skyward for assistance.
Transcript
The 2017 Canadian UFO Survey
Summary
Since 1989, Ufology Research (formerly Ufology Research of Manitoba) has solicited UFO casedata from known and active investigators and researchers in Canada. The goal has been toprovide data for use by researchers trying to understand this controversial phenomenon. 2017marks the 29th year of collecting and analyzing Canadian UFO report data by Ufology Research.
Previous Canadian UFO Surveys are available online at: http://survey.canadianuforeport.com
There were 1,101 UFO sightings reported in Canada in 2017, or more than three eachday. This is the fifth year in a row that UFO reports in Canada are at or above this level.
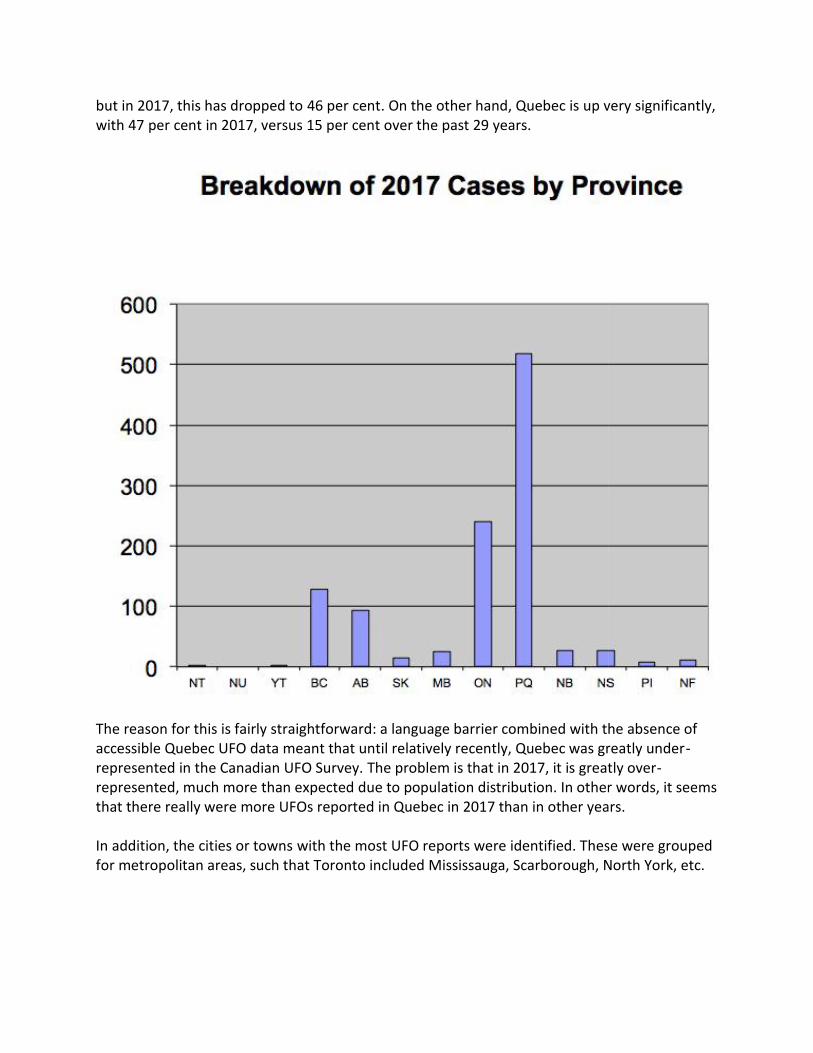
Quebec had an all-time record high number of UFOs reported in 2017, with 518 reports,up from 430 cases in 2016. In comparison, Ontario had 241 reports, BC had 128, andboth New Brunswick and Nova Scotia had 27 cases each. There were even two reportsfrom Northwest Territories and three from Yukon.
In 2017, about eight per cent of all UFO reports were judged unexplained. Thispercentage of “unknowns” falls to less than one per cent when only higher-quality casesare considered.
There is an overall average of two witnesses per UFO sighting.
The typical UFO sighting lasted approximately 15 minutes in 2017.
The study found that 43 per cent of all UFO sightings were of simple lights in the sky.Witnesses also reported point sources of light, spheres and boomerangs.
Results of this study show that many people continue to report unusual objects in the sky, andsome of these objects do not have obvious explanations. Many witnesses are pilots, police andother individuals with reasonably good observing capabilities and good judgment.
Numbers of reported UFO sightings remain high. Several theories for this can be suggested:more UFOs are present and physically observable by witnesses; more secret or classifiedmilitary exercises and overflights are occurring over populated areas; more people are unawareof the nature of conventional or natural objects in the sky; more people are taking the time toobserve their surroundings; more people are able to report their sightings with easier access tothe Internet and portable technology; or even that the downturn in the economy is leading toan increased desire by some people to look skyward for assistance.
Although the largest percentage of reported UFOs is simply lights in the night sky, a smallnumber are objects with definite shapes observed within the witnesses’ frame of reference.
Popular opinion to the contrary, there is no incontrovertible evidence that some UFO casesinvolve extraterrestrial contact. The continued reporting of UFOs by the public and the yearlyincrease in numbers of UFO reports suggests a need for further examination of thephenomenon by social, medical and/or physical scientists.
For further information, contact:Ufology ResearchSurvey.canadianuforeport.come-mail: [email protected]: @ufologyresearch
Details of the 2017 Canadian UFO Survey
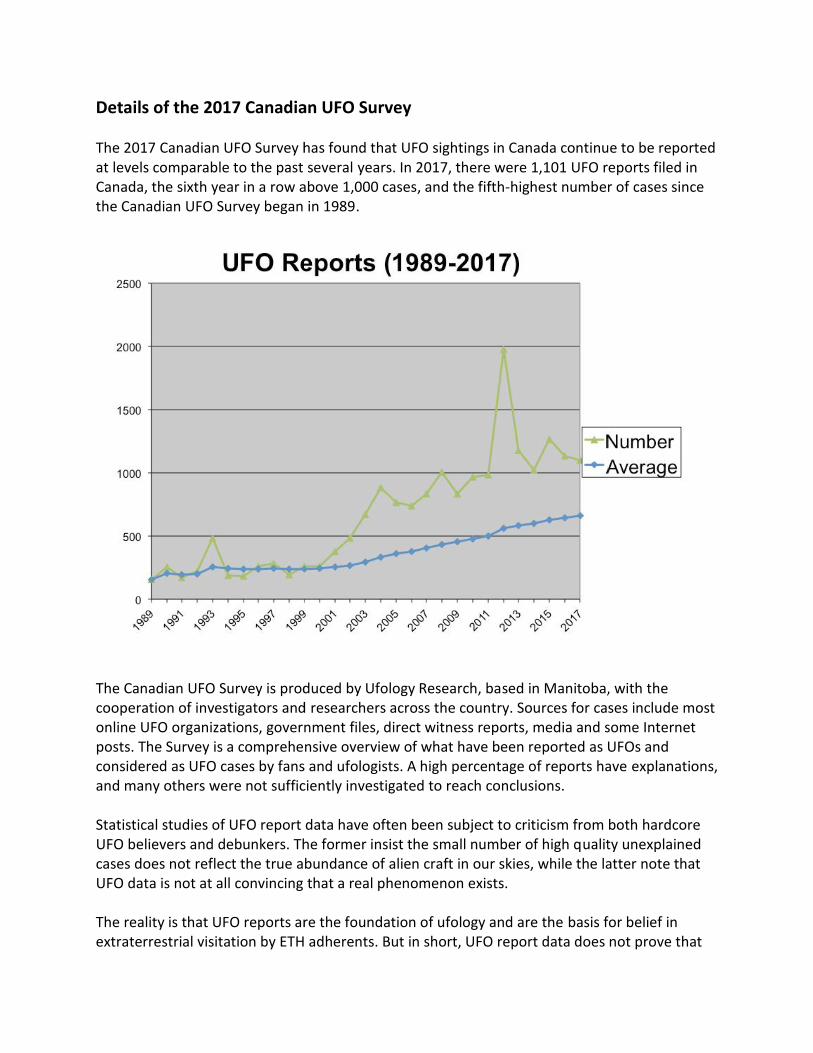
The 2017 Canadian UFO Survey has found that UFO sightings in Canada continue to be reportedat levels comparable to the past several years. In 2017, there were 1,101 UFO reports filed inCanada, the sixth year in a row above 1,000 cases, and the fifth-highest number of cases sincethe Canadian UFO Survey began in 1989.
The Canadian UFO Survey is produced by Ufology Research, based in Manitoba, with thecooperation of investigators and researchers across the country. Sources for cases include mostonline UFO organizations, government files, direct witness reports, media and some Internetposts. The Survey is a comprehensive overview of what have been reported as UFOs andconsidered as UFO cases by fans and ufologists. A high percentage of reports have explanations,and many others were not sufficiently investigated to reach conclusions.
Statistical studies of UFO report data have often been subject to criticism from both hardcoreUFO believers and debunkers. The former insist the small number of high quality unexplainedcases does not reflect the true abundance of alien craft in our skies, while the latter note thatUFO data is not at all convincing that a real phenomenon exists.
The reality is that UFO reports are the foundation of ufology and are the basis for belief inextraterrestrial visitation by ETH adherents. But in short, UFO report data does not prove that
Details of the 2017 Canadian UFO Survey
The 2017 Canadian UFO Survey has found that UFO sightings in Canada continue to be reportedat levels comparable to the past several years. In 2017, there were 1,101 UFO reports filed inCanada, the sixth year in a row above 1,000 cases, and the fifth-highest number of cases sincethe Canadian UFO Survey began in 1989.
The Canadian UFO Survey is produced by Ufology Research, based in Manitoba, with thecooperation of investigators and researchers across the country. Sources for cases include mostonline UFO organizations, government files, direct witness reports, media and some Internetposts. The Survey is a comprehensive overview of what have been reported as UFOs andconsidered as UFO cases by fans and ufologists. A high percentage of reports have explanations,and many others were not sufficiently investigated to reach conclusions.
Statistical studies of UFO report data have often been subject to criticism from both hardcoreUFO believers and debunkers. The former insist the small number of high quality unexplainedcases does not reflect the true abundance of alien craft in our skies, while the latter note thatUFO data is not at all convincing that a real phenomenon exists.
The reality is that UFO reports are the foundation of ufology and are the basis for belief inextraterrestrial visitation by ETH adherents. But in short, UFO report data does not prove that
aliens are visiting Earth. In fact, if anything, the UFO report data show that most often, theaverage witness is misidentifying conventional objects or ordinary phenomena.
One common objection to the reality of UFOs, as defined by skeptics, is that if UFOs were“real,” then the abundance of cellphones with cameras throughout the world implies that clearimages of UFOs must be available. In addition, the number of traffic cams, dashboard cams andstreaming video of building exteriors is increasing rapidly, so the lack of clear images of arrivingor departing UFOs is puzzling if Earth is being visited regularly.
Given the thousand or so cases in Canada every year, this view seems to make sense. It is truethat the percentage of reports submitted with accompanying photographs has been slowlyincreasing. However, almost all photos and videos examined are either jittery pinpoints of lightmoving in a dark sky, or textbook lens flares or internal sensor reflections within the optics ofthe cameras themselves. In other words, when it comes to UFOs, a picture is not worth 1,000words.
Since the annual Canadian UFO Survey was initiated in 1989, 19,138 Canadian UFO reports havebeen catalogued during the past 29 years. This is much more than the files of the United StatesAir Force’s infamous Project Blue Book, which investigated and recorded 12,618 UFO reportsfrom around the world between 1947 and 1969. And, while Blue Book listed 701 cases asUnexplained, there are 2,234 Unexplained cases in the Canadian UFO Survey database.
It should be emphasized the classification of Unknown does not imply alien visitation. Each casemay still have an explanation following further investigation. And of those that remainunexplained, some may remain unexplained, but still are not incontrovertible proof ofextraterrestrial intervention or some mysterious natural phenomenon.
In short, witnesses are seeing real things, and the challenge remains to identify theconventional astronomical objects, aircraft, and other terrestrial objects in order to winnow outthe truly unexplained UFOs, if any.
Other results from the 2017 Canadian UFO Survey
Annual Distribution
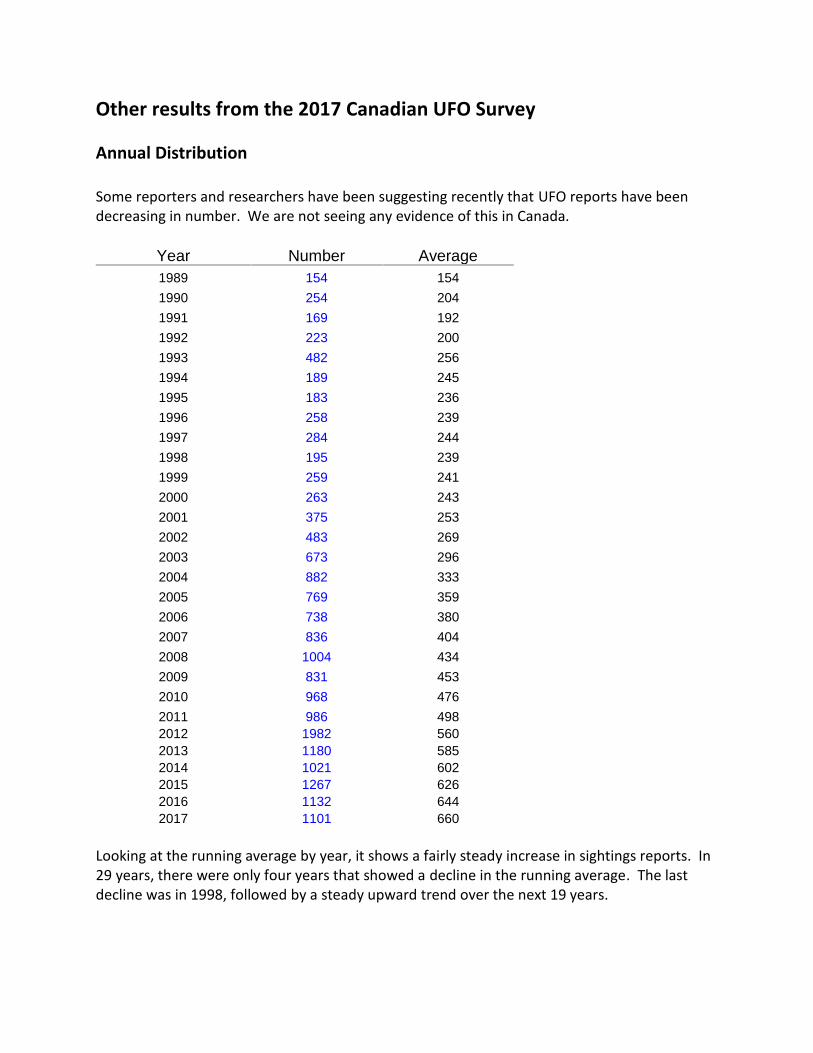
Some reporters and researchers have been suggesting recently that UFO reports have beendecreasing in number. We are not seeing any evidence of this in Canada.
Looking at the running average by year, it shows a fairly steady increase in sightings reports. In29 years, there were only four years that showed a decline in the running average. The lastdecline was in 1998, followed by a steady upward trend over the next 19 years.
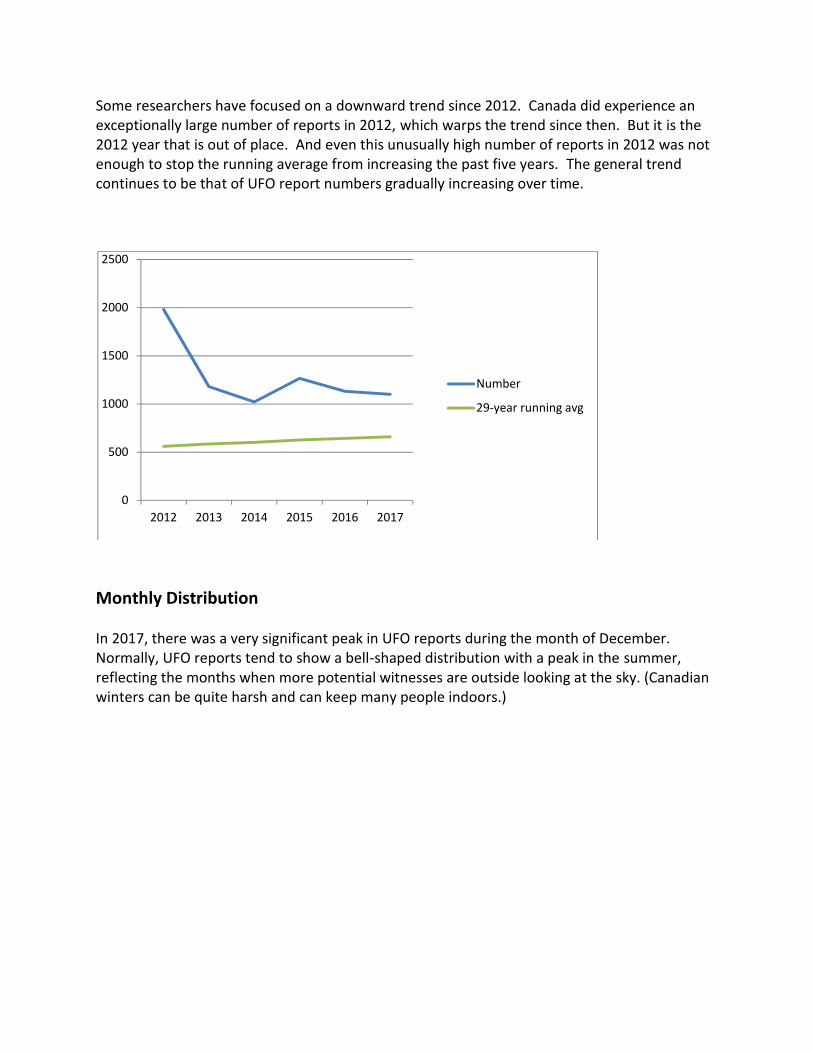
Some researchers have focused on a downward trend since 2012. Canada did experience anexceptionally large number of reports in 2012, which warps the trend since then. But it is the2012 year that is out of place. And even this unusually high number of reports in 2012 was notenough to stop the running average from increasing the past five years. The general trendcontinues to be that of UFO report numbers gradually increasing over time.
Monthly Distribution
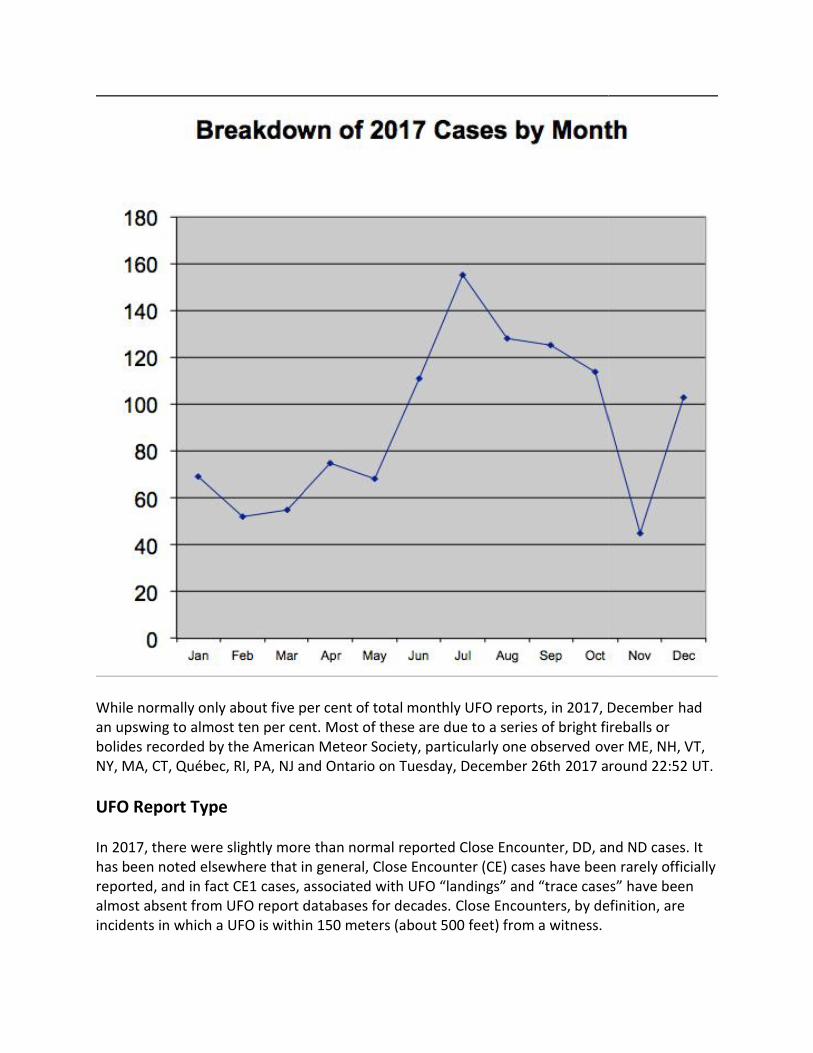
In 2017, there was a very significant peak in UFO reports during the month of December.Normally, UFO reports tend to show a bell-shaped distribution with a peak in the summer,reflecting the months when more potential witnesses are outside looking at the sky. (Canadianwinters can be quite harsh and can keep many people indoors.)
0
500
1000
1500
2000
2500
2012 2013 2014 2015 2016 2017
Number
29-year running avg
While normally only about five per cent of total monthly UFO reports, in 2017, December hadan upswing to almost ten per cent. Most of these are due to a series of bright fireballs orbolides recorded by the American Meteor Society, particularly one observed over ME, NH, VT,NY, MA, CT, Québec, RI, PA, NJ and Ontario on Tuesday, December 26th 2017 around 22:52 UT.
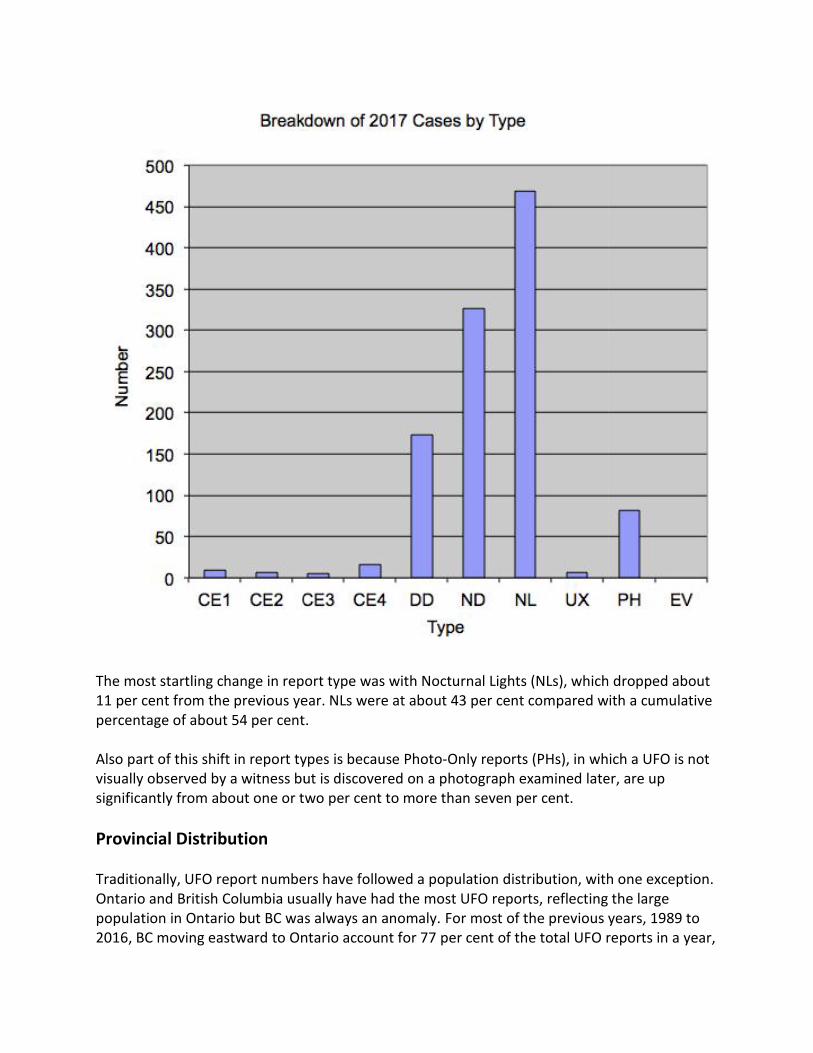
UFO Report Type
In 2017, there were slightly more than normal reported Close Encounter, DD, and ND cases. Ithas been noted elsewhere that in general, Close Encounter (CE) cases have been rarely officiallyreported, and in fact CE1 cases, associated with UFO “landings” and “trace cases” have beenalmost absent from UFO report databases for decades. Close Encounters, by definition, areincidents in which a UFO is within 150 meters (about 500 feet) from a witness.
While normally only about five per cent of total monthly UFO reports, in 2017, December hadan upswing to almost ten per cent. Most of these are due to a series of bright fireballs orbolides recorded by the American Meteor Society, particularly one observed over ME, NH, VT,NY, MA, CT, Québec, RI, PA, NJ and Ontario on Tuesday, December 26th 2017 around 22:52 UT.
UFO Report Type
In 2017, there were slightly more than normal reported Close Encounter, DD, and ND cases. Ithas been noted elsewhere that in general, Close Encounter (CE) cases have been rarely officiallyreported, and in fact CE1 cases, associated with UFO “landings” and “trace cases” have beenalmost absent from UFO report databases for decades. Close Encounters, by definition, areincidents in which a UFO is within 150 meters (about 500 feet) from a witness.
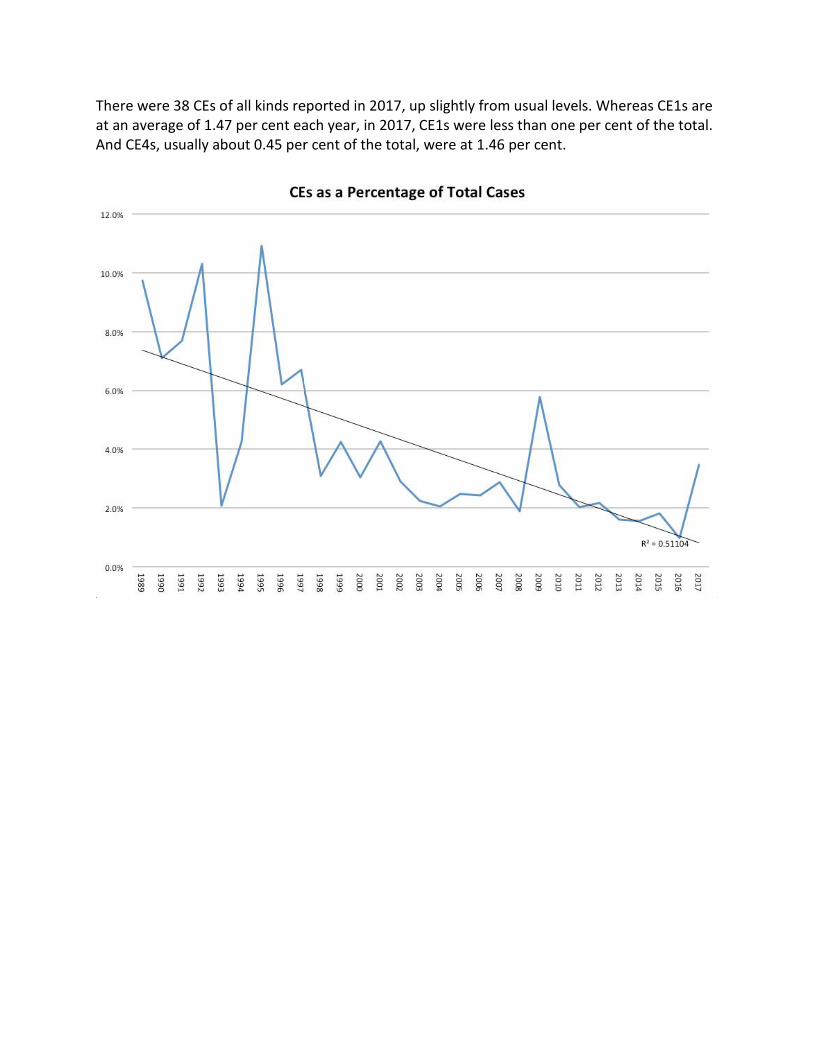
There were 38 CEs of all kinds reported in 2017, up slightly from usual levels. Whereas CE1s areat an average of 1.47 per cent each year, in 2017, CE1s were less than one per cent of the total.And CE4s, usually about 0.45 per cent of the total, were at 1.46 per cent.
There were 38 CEs of all kinds reported in 2017, up slightly from usual levels. Whereas CE1s areat an average of 1.47 per cent each year, in 2017, CE1s were less than one per cent of the total.And CE4s, usually about 0.45 per cent of the total, were at 1.46 per cent.
There were 38 CEs of all kinds reported in 2017, up slightly from usual levels. Whereas CE1s areat an average of 1.47 per cent each year, in 2017, CE1s were less than one per cent of the total.And CE4s, usually about 0.45 per cent of the total, were at 1.46 per cent.
The most startling change in report type was with Nocturnal Lights (NLs), which dropped about11 per cent from the previous year. NLs were at about 43 per cent compared with a cumulativepercentage of about 54 per cent.
Also part of this shift in report types is because Photo-Only reports (PHs), in which a UFO is notvisually observed by a witness but is discovered on a photograph examined later, are upsignificantly from about one or two per cent to more than seven per cent.
Provincial Distribution
Traditionally, UFO report numbers have followed a population distribution, with one exception.Ontario and British Columbia usually have had the most UFO reports, reflecting the largepopulation in Ontario but BC was always an anomaly. For most of the previous years, 1989 to2016, BC moving eastward to Ontario account for 77 per cent of the total UFO reports in a year,
but in 2017, this has dropped to 46 per cent. On the other hand, Quebec is up very significantly,with 47 per cent in 2017, versus 15 per cent over the past 29 years.
The reason for this is fairly straightforward: a language barrier combined with the absence ofaccessible Quebec UFO data meant that until relatively recently, Quebec was greatly under-represented in the Canadian UFO Survey. The problem is that in 2017, it is greatly over-represented, much more than expected due to population distribution. In other words, it seemsthat there really were more UFOs reported in Quebec in 2017 than in other years.
In addition, the cities or towns with the most UFO reports were identified. These were groupedfor metropolitan areas, such that Toronto included Mississauga, Scarborough, North York, etc.
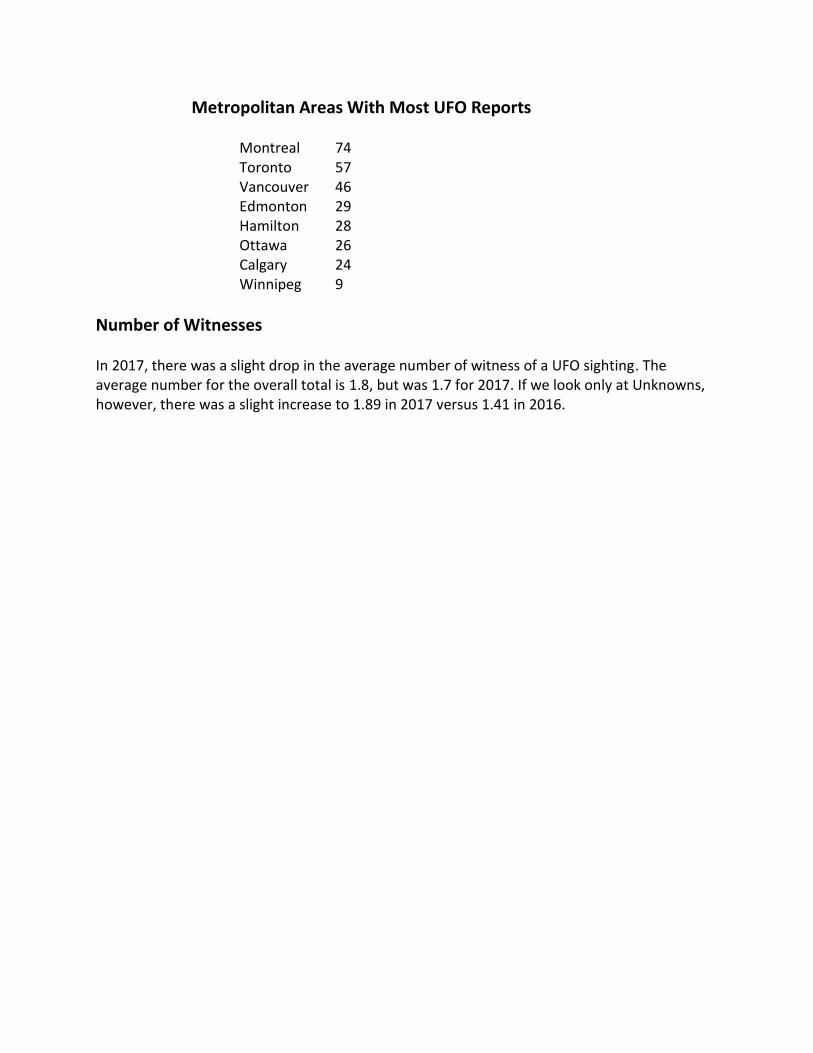
Metropolitan Areas With Most UFO Reports
Montreal 74Toronto 57Vancouver 46Edmonton 29Hamilton 28Ottawa 26Calgary 24Winnipeg 9
Number of Witnesses
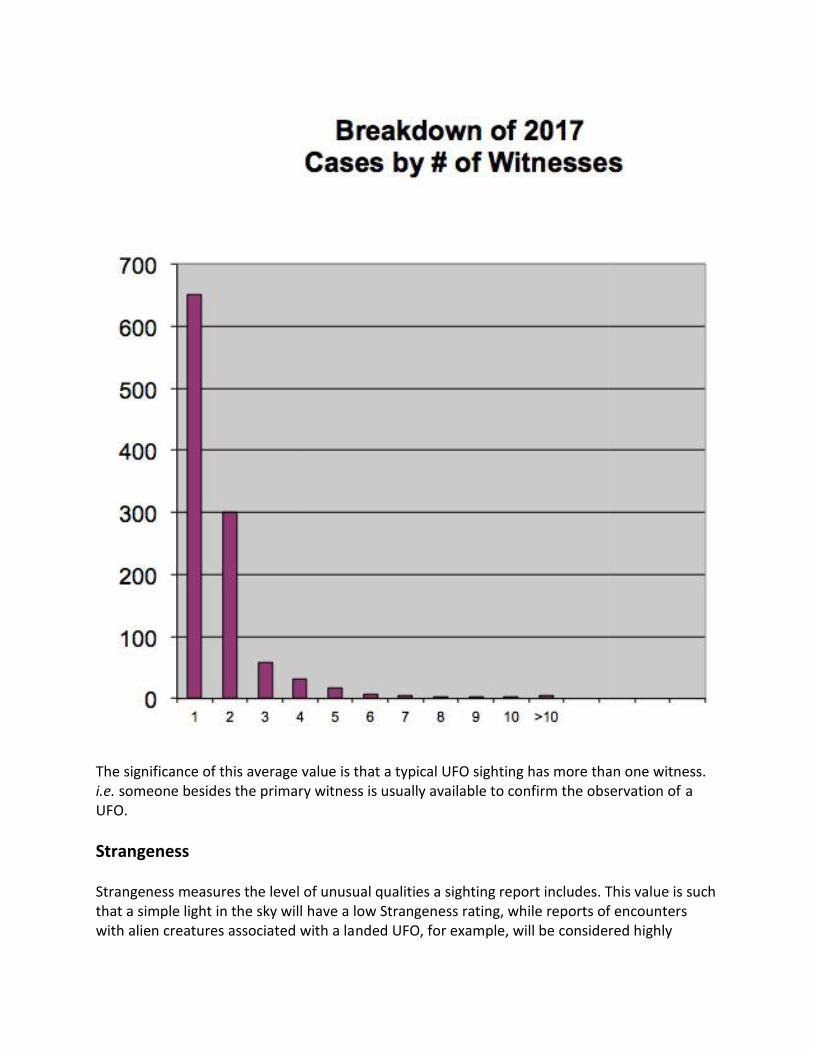
In 2017, there was a slight drop in the average number of witness of a UFO sighting. Theaverage number for the overall total is 1.8, but was 1.7 for 2017. If we look only at Unknowns,however, there was a slight increase to 1.89 in 2017 versus 1.41 in 2016.
The significance of this average value is that a typical UFO sighting has more than one witness.i.e. someone besides the primary witness is usually available to confirm the observation of aUFO.
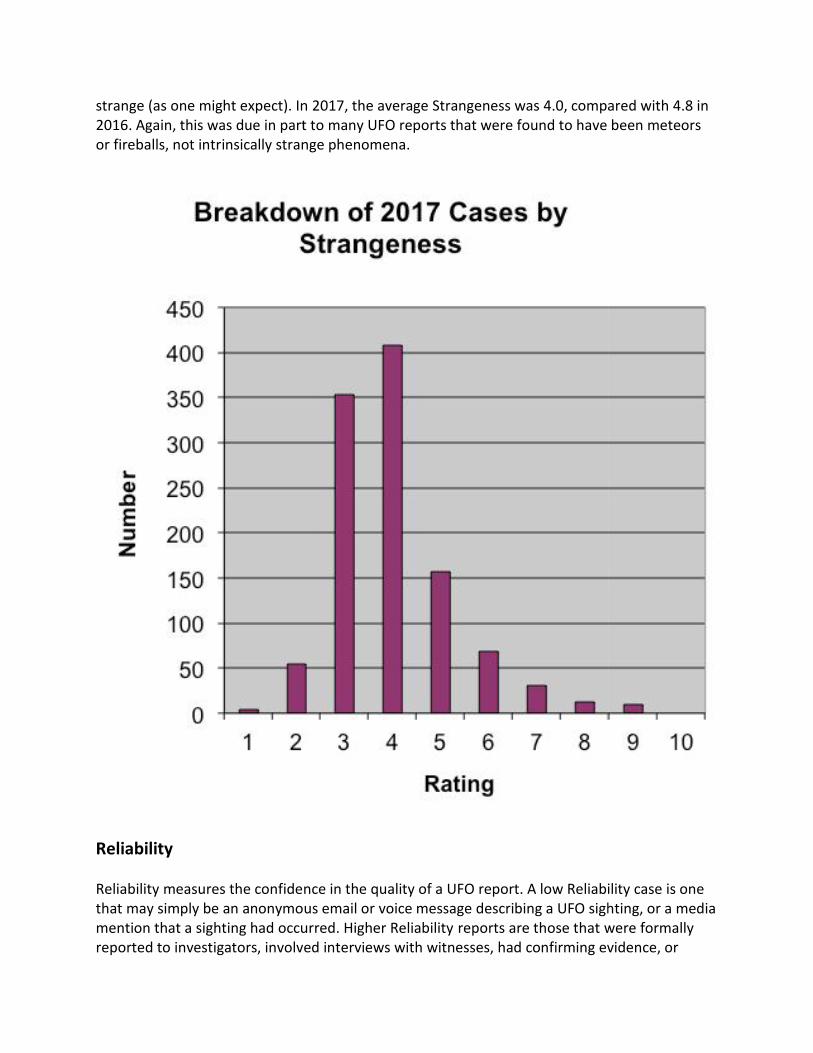
Strangeness
Strangeness measures the level of unusual qualities a sighting report includes. This value is suchthat a simple light in the sky will have a low Strangeness rating, while reports of encounterswith alien creatures associated with a landed UFO, for example, will be considered highly
The significance of this average value is that a typical UFO sighting has more than one witness.i.e. someone besides the primary witness is usually available to confirm the observation of aUFO.
Strangeness
Strangeness measures the level of unusual qualities a sighting report includes. This value is suchthat a simple light in the sky will have a low Strangeness rating, while reports of encounterswith alien creatures associated with a landed UFO, for example, will be considered highly
strange (as one might expect). In 2017, the average Strangeness was 4.0, compared with 4.8 in2016. Again, this was due in part to many UFO reports that were found to have been meteorsor fireballs, not intrinsically strange phenomena.
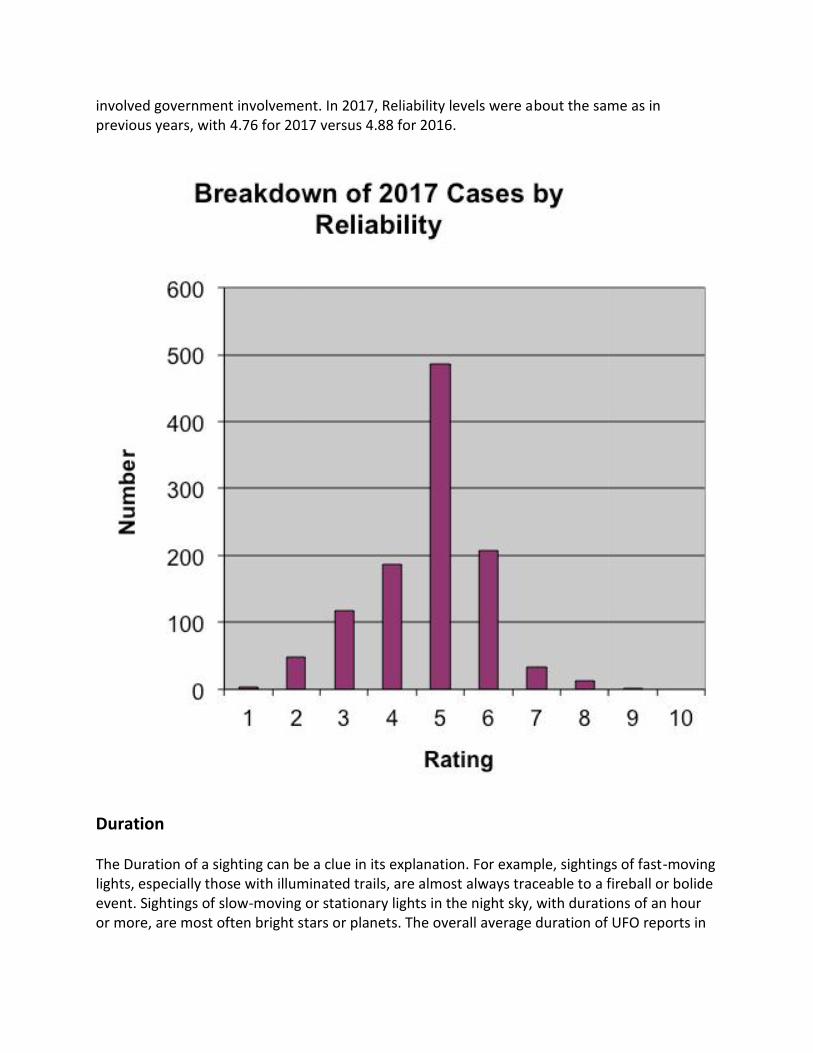
Reliability
Reliability measures the confidence in the quality of a UFO report. A low Reliability case is onethat may simply be an anonymous email or voice message describing a UFO sighting, or a mediamention that a sighting had occurred. Higher Reliability reports are those that were formallyreported to investigators, involved interviews with witnesses, had confirming evidence, or
strange (as one might expect). In 2017, the average Strangeness was 4.0, compared with 4.8 in2016. Again, this was due in part to many UFO reports that were found to have been meteorsor fireballs, not intrinsically strange phenomena.
Reliability
Reliability measures the confidence in the quality of a UFO report. A low Reliability case is onethat may simply be an anonymous email or voice message describing a UFO sighting, or a mediamention that a sighting had occurred. Higher Reliability reports are those that were formallyreported to investigators, involved interviews with witnesses, had confirming evidence, or
involved government involvement. In 2017, Reliability levels were about the same as inprevious years, with 4.76 for 2017 versus 4.88 for 2016.
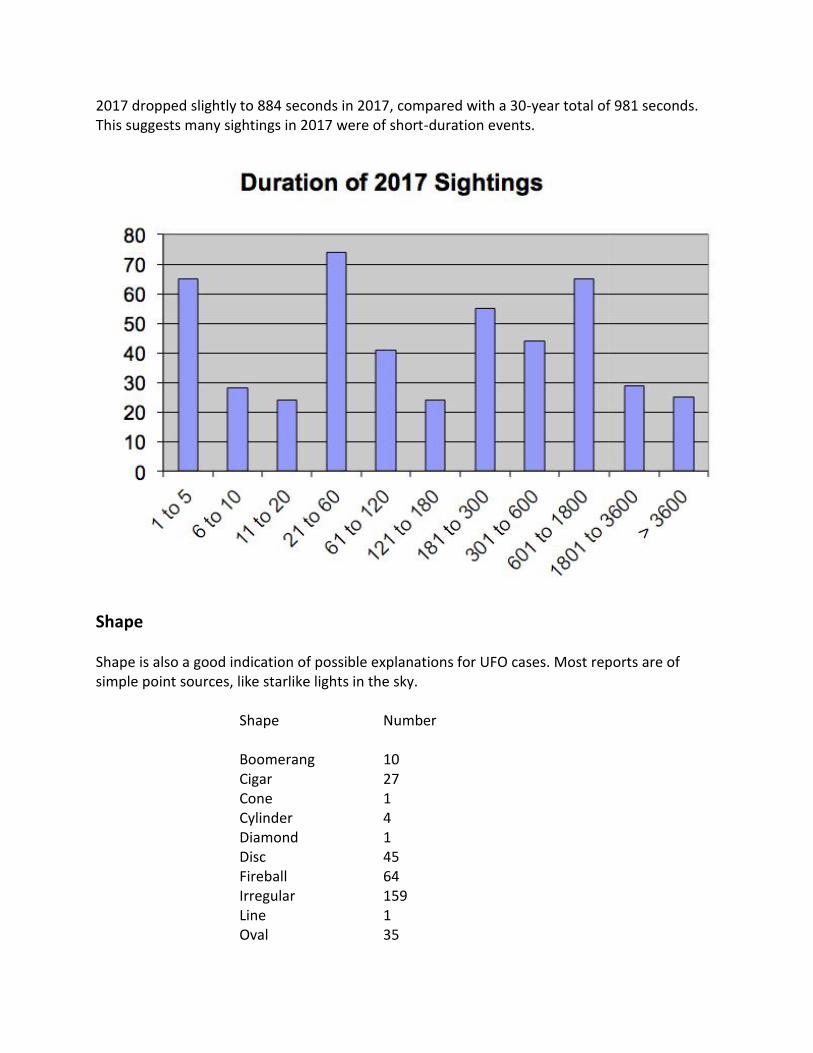
Duration
The Duration of a sighting can be a clue in its explanation. For example, sightings of fast-movinglights, especially those with illuminated trails, are almost always traceable to a fireball or bolideevent. Sightings of slow-moving or stationary lights in the night sky, with durations of an houror more, are most often bright stars or planets. The overall average duration of UFO reports in
involved government involvement. In 2017, Reliability levels were about the same as inprevious years, with 4.76 for 2017 versus 4.88 for 2016.
Duration
The Duration of a sighting can be a clue in its explanation. For example, sightings of fast-movinglights, especially those with illuminated trails, are almost always traceable to a fireball or bolideevent. Sightings of slow-moving or stationary lights in the night sky, with durations of an houror more, are most often bright stars or planets. The overall average duration of UFO reports in
2017 dropped slightly to 884 seconds in 2017, compared with a 30-year total of 981 seconds.This suggests many sightings in 2017 were of short-duration events.
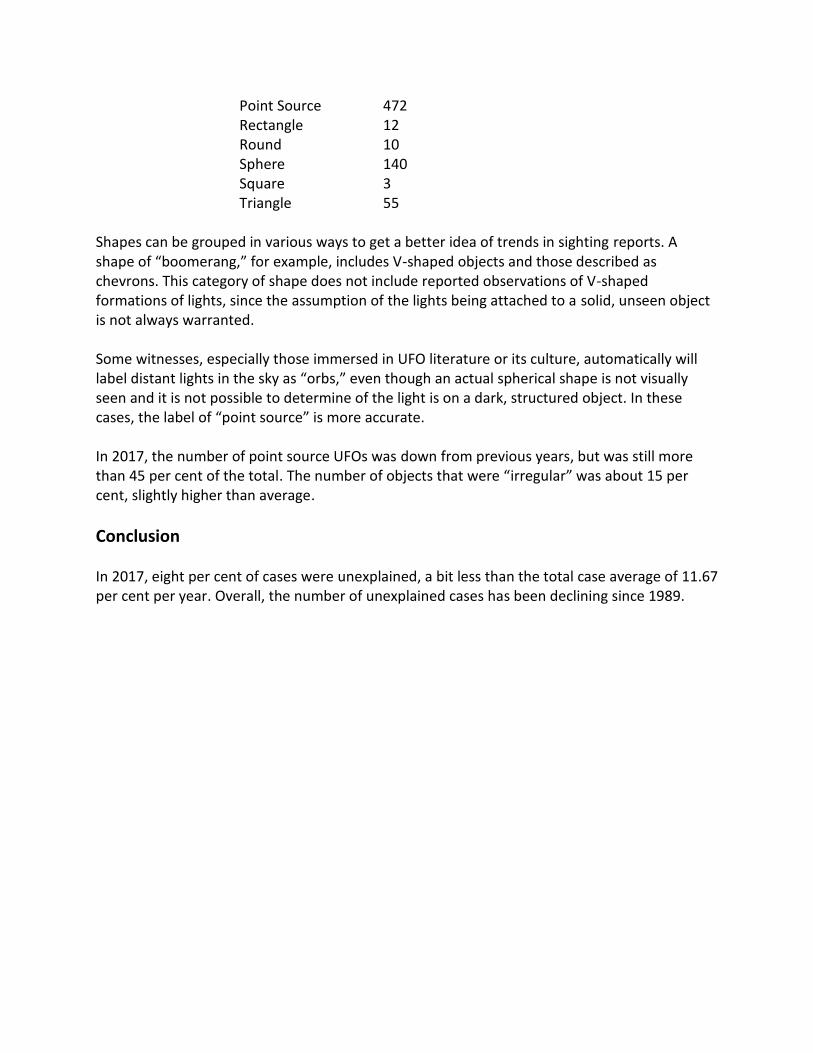
Shape
Shape is also a good indication of possible explanations for UFO cases. Most reports are ofsimple point sources, like starlike lights in the sky.
2017 dropped slightly to 884 seconds in 2017, compared with a 30-year total of 981 seconds.This suggests many sightings in 2017 were of short-duration events.
Shape
Shape is also a good indication of possible explanations for UFO cases. Most reports are ofsimple point sources, like starlike lights in the sky.
Point Source 472Rectangle 12Round 10Sphere 140Square 3Triangle 55
Shapes can be grouped in various ways to get a better idea of trends in sighting reports. Ashape of “boomerang,” for example, includes V-shaped objects and those described aschevrons. This category of shape does not include reported observations of V-shapedformations of lights, since the assumption of the lights being attached to a solid, unseen objectis not always warranted.
Some witnesses, especially those immersed in UFO literature or its culture, automatically willlabel distant lights in the sky as “orbs,” even though an actual spherical shape is not visuallyseen and it is not possible to determine of the light is on a dark, structured object. In thesecases, the label of “point source” is more accurate.
In 2017, the number of point source UFOs was down from previous years, but was still morethan 45 per cent of the total. The number of objects that were “irregular” was about 15 percent, slightly higher than average.
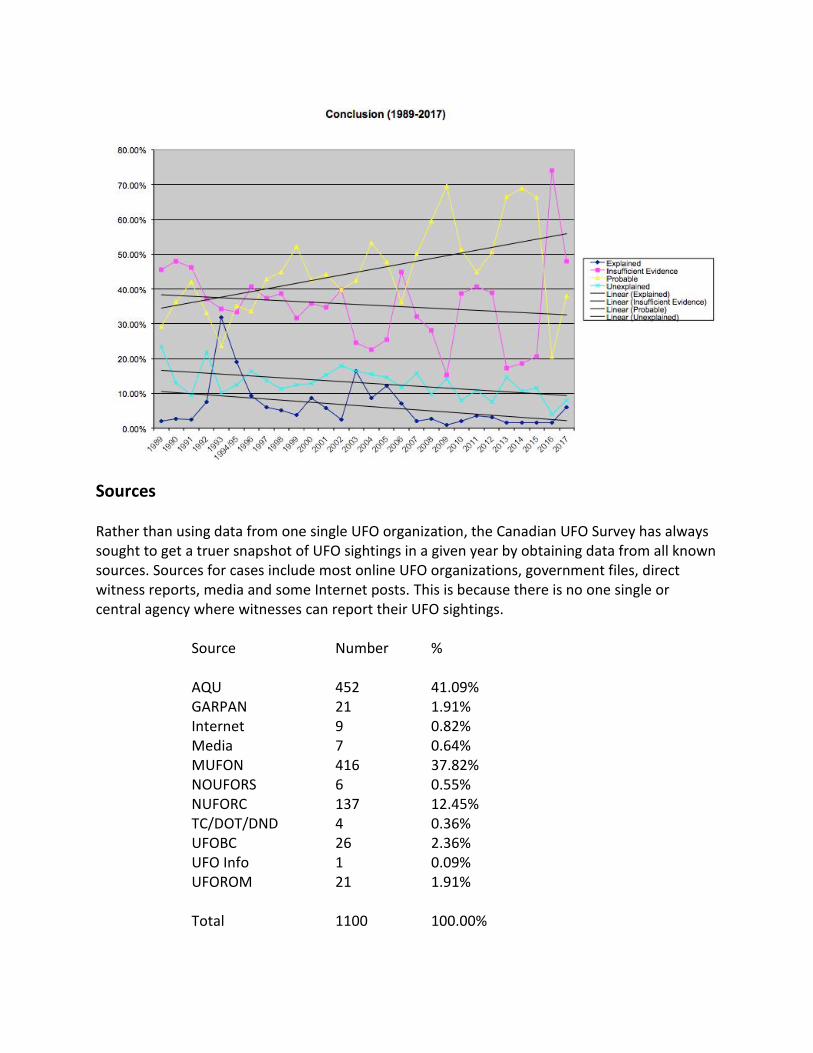
Conclusion
In 2017, eight per cent of cases were unexplained, a bit less than the total case average of 11.67per cent per year. Overall, the number of unexplained cases has been declining since 1989.
Sources
Rather than using data from one single UFO organization, the Canadian UFO Survey has alwayssought to get a truer snapshot of UFO sightings in a given year by obtaining data from all knownsources. Sources for cases include most online UFO organizations, government files, directwitness reports, media and some Internet posts. This is because there is no one single orcentral agency where witnesses can report their UFO sightings.
Rather than using data from one single UFO organization, the Canadian UFO Survey has alwayssought to get a truer snapshot of UFO sightings in a given year by obtaining data from all knownsources. Sources for cases include most online UFO organizations, government files, directwitness reports, media and some Internet posts. This is because there is no one single orcentral agency where witnesses can report their UFO sightings.
Rather than using data from one single UFO organization, the Canadian UFO Survey has alwayssought to get a truer snapshot of UFO sightings in a given year by obtaining data from all knownsources. Sources for cases include most online UFO organizations, government files, directwitness reports, media and some Internet posts. This is because there is no one single orcentral agency where witnesses can report their UFO sightings.
High Quality Unknowns 2017High-quality unexplained UFO reports are those that have a Reliability of 7 or greater and aStrangeness of 6 or greater. The emphasis is therefore on the reliability of the report first, andthe unusual nature of the case second.
January 5, 2017 6:00 pm French River, ONNocturnal Light seen for 600 seconds, multiple colours, 2 witnesses, point sourceStrangeness=7 Reliability=7 Source=MUFONSeveral coloured “orbs” approached witnesses, hovered, moved away. Witnesses were veryfrightened by experience.
January 13, 2017 7:48 pm Pakenham, ONNocturnal disc seen for 900 seconds, white in colour, 1 witnessStrangeness=6 Reliability=8 Source=MUFONOdd lights were discovered on consecutive photos from trail cam. Witness was weatherobserver at airport, and used to identifying aircraft and weather phenomena.
March 5, 2017 2:00 pm Anola, MBDaylight disc seen for 60 seconds, black in colour, 1 witness, sphericalStrangeness=6 Reliability=7 Source=NUFORCWitness saw two black, spinning spheres, reflecting sunlight, zooming over trees. The medicine-ball-sized objects hovered, then vanished.
March 15, 2017 7:20 pm Enderby, BCNocturnal Light, white in colour, 4 witnessesStrangeness=6 Reliability=8 Source=DOTAt a point 65 kilometres NNE of Enderby, crews on two separate airliners reported a bright,white strobing light above them. Radar indicated no other known aircraft were in the vicinity.
April 23, 2017 4:30 am Ottawa, ONNocturnal Disc, seen for 5 seconds, white in colour, seen by 1 witness, cigar-shapedStrangeness=6 Reliability=7 Source=MUFONA cigar-shaped object was seen to the right of the waning crescent Moon. The object was tiltedslight off the horizontal, with its leading edge upward. It emitted a pulse of light and movedforward very quickly. Another pulse from the front of the object was seen, and the entire objectvanished without a trace.
July 11, 2017 3:12 pm Smithville, ONDaylight disc, silver, one witnessStrangeness=6 Reliability=7 Source=MUFON
A shiny object with a raised dome moved slowly and silently over nearby trees. It appeared tobe 500 feet from the witness and only 60 feet off the ground. It seemed to hover, thenascended rapidly out of sight.
July 22, 2017 10:15 pm Montreal, PQNocturnal Disc, seen for 45 seconds, green in colour, 3 witnesses, irregular shapeStrangeness=6 Reliability=7 Source=NUFORCThree witnesses, including a particle physicist at a local university, were on the roof of a condoin downtown Montreal. They observed a stationary, “illuminated V, about ½ inch at arm’slength, with arms of the V consisting of a number of bright, pinpoint emerald green lights, eachsurrounded by small halos.” It all faded within a minute of observation.
August 25, 2017 9:50 am Stewiacke, NSClose Encounter of the First Kind, seen for 180 seconds, white in colour, 2 witnesses, triangularshapedStrangeness=6 Reliability=7 Source=MUFONTwo witnesses saw a dark triangular object silhouetted against the sky. It had three white lightsin a triangular formation and an orange/red light in the centre, with two strobe lights on twosides. . The object flew over the witnesses, making a humming noise.
September 23, 2017 8:30 pm Saint-Jean-Baptiste, PQNocturnal disc, red in colour, 10 witnesses, triangle-shapedStrangeness=7 Reliability=7 Source=AQUA group of 10 people watched as a triangular object approached from the northeast and cameto a stop above them. It was stationary for several seconds, then its red lights intensified,flickered, then the object moved away.
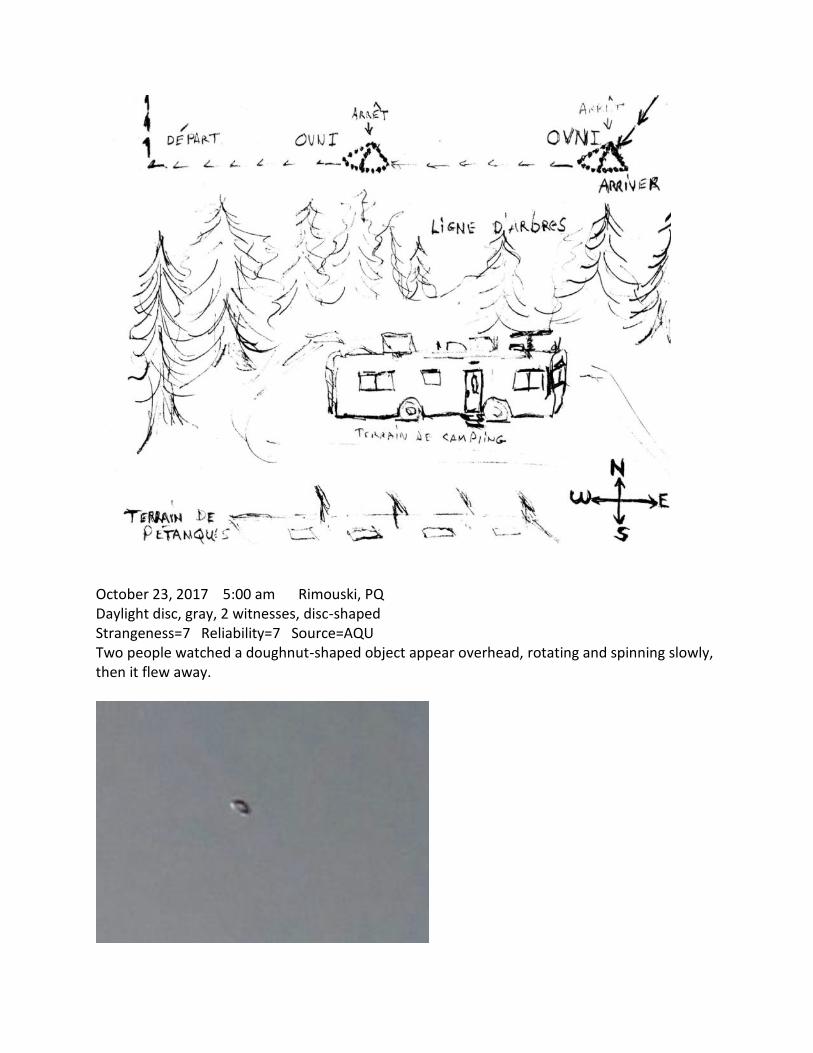
October 23, 2017 5:00 am Rimouski, PQDaylight disc, gray, 2 witnesses, disc-shapedStrangeness=7 Reliability=7 Source=AQUTwo people watched a doughnut-shaped object appear overhead, rotating and spinning slowly,then it flew away.
October 23, 2017 5:00 am Rimouski, PQDaylight disc, gray, 2 witnesses, disc-shapedStrangeness=7 Reliability=7 Source=AQUTwo people watched a doughnut-shaped object appear overhead, rotating and spinning slowly,then it flew away.
October 23, 2017 5:00 am Rimouski, PQDaylight disc, gray, 2 witnesses, disc-shapedStrangeness=7 Reliability=7 Source=AQUTwo people watched a doughnut-shaped object appear overhead, rotating and spinning slowly,then it flew away.