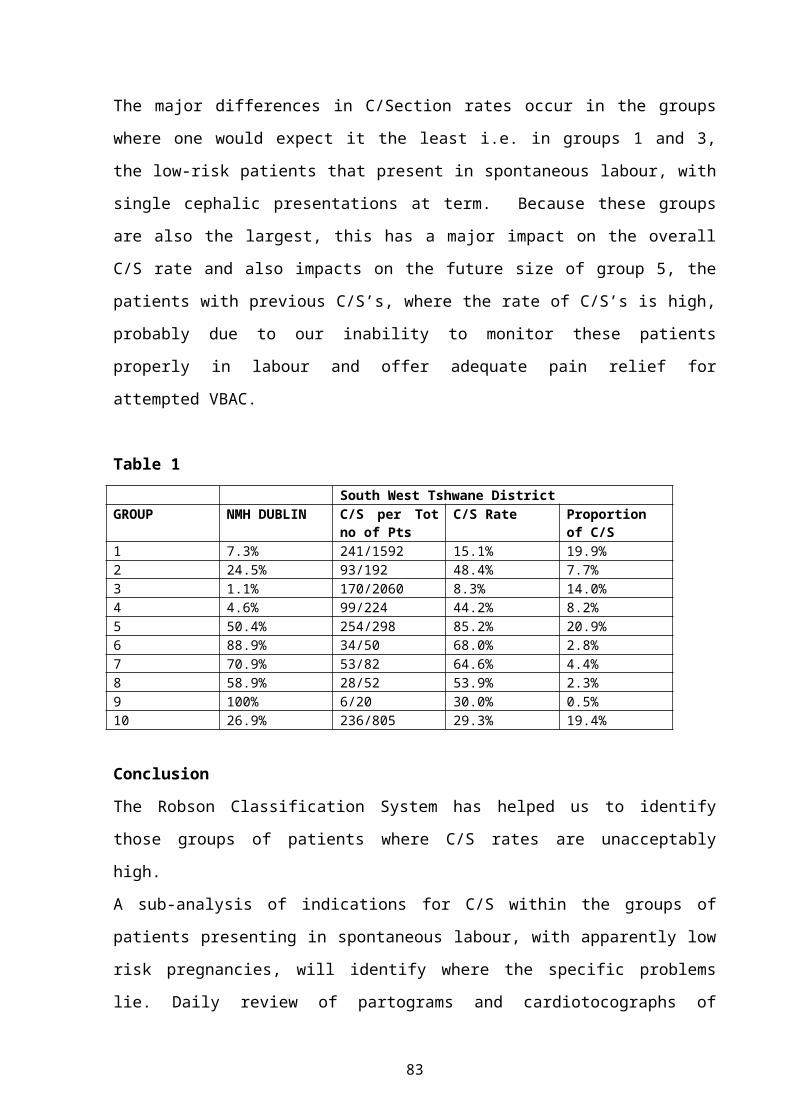
The 25 th Conference on Priorities in Perinatal Care in South Africa was held under the auspices of the Priorities in Perinatal Care Association and sponsored by Abbott Laboratories SA (Pty) Ltd
Transcript
The 25th Conference on Priorities in Perinatal Care in South Africa was held under the auspices of the Priorities in Perinatal Care Association and
sponsored by Abbott Laboratories SA (Pty) Ltd
Editor’s Note:
The articles included in these Proceedings were, mostly, received electronically and have been included as submitted by the presenter/author. Faxed articles have been retyped.Some articles have been shortened.Abstracts were included where articles were not submitted.References are available from the authors.Articles have not been included for presentations, which were withdrawn and not presented at Priorities.
ii
INDEX
MIDWIFERY STAFFING NEEDS IN A MATERNITY WARD. DH Greenfield1
COMMUNITY BASED SITUATION ANALYSIS OF MATERNAL AND NEONATAL FOLLOW-UP CARE. P Tlebere 5
NO WONDER WE ARE STRUGGLING! CHANGING BURDEN OF DISEASE IN THE ATTERIDGEVILLE COMMUNITY OVER A DECADE. MZ Shaik
13
POSTPARTUM HAEMORRHAGE AUDIT (abstract). M Mabenge18
CHIP: CHILDHOOD DEATHS ONE YEAR ON. CR Stephen 19
TYING UP LOOSE ENDS: A RESPONSE TO THE CHALLENGES OF PPIP AND CHIP.ME Patrick 26
THE RELATIONSHIP BETWEEN STAFFING OF LABOUR WARDS AND DEATHS DUE TO INTRAPARTUM ASPHYXIA. RC Pattinson
30
AN ANALYSIS OF THE IMPLEMENTATION OF THE 10 RECOMMENDATIONS OF THE SAVING MOTHERS 2 REPORT IN THE ETHEKWINI HEALTH DISTRICT OF KZN (abstract). G Bartlett
33
A CRITICAL REVIEW OF THE MATERNAL MORTALITY IN SOUTH AFRICA COMPARED WITH THE FORCEFIELD OF NURSING OF THE WHO. JM Dippenaar 34
BIRTH ASPHYXIA – WRESTLING WITH WORDS. DL Woods41
FIFTHS, STATION, SAGITTAL AND LAMBDOID MOULDING: DO THEY PREDICT CEPHALOPELVIC DISPROPORTION? E J Buchmann
48
ROBSON’S CLASSIFICATION OF CAESAREAN SECTIONS: DOES IT HELP?A Nuzhat 51
USING THE ROBSON CLASSIFICATION SYSTEM OF CAESAREAN SECTIONS TO AUDIT CAESAREAN SECTION RATES AND IMPROVE CARE. E Farrell
56
iii
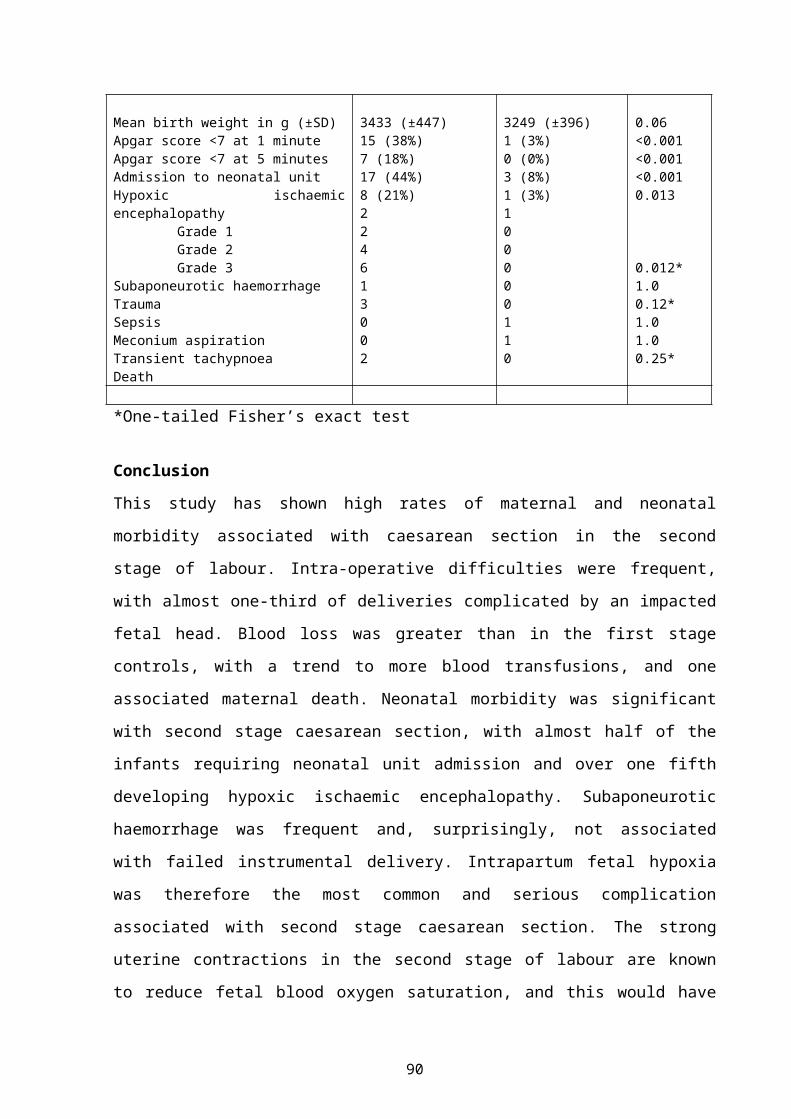
COMPLICATIONS ASSOCIATED WITH CAESAREAN SECTION DONE IN THE SECOND STAGE OF LABOUR. L Cebekulu
60
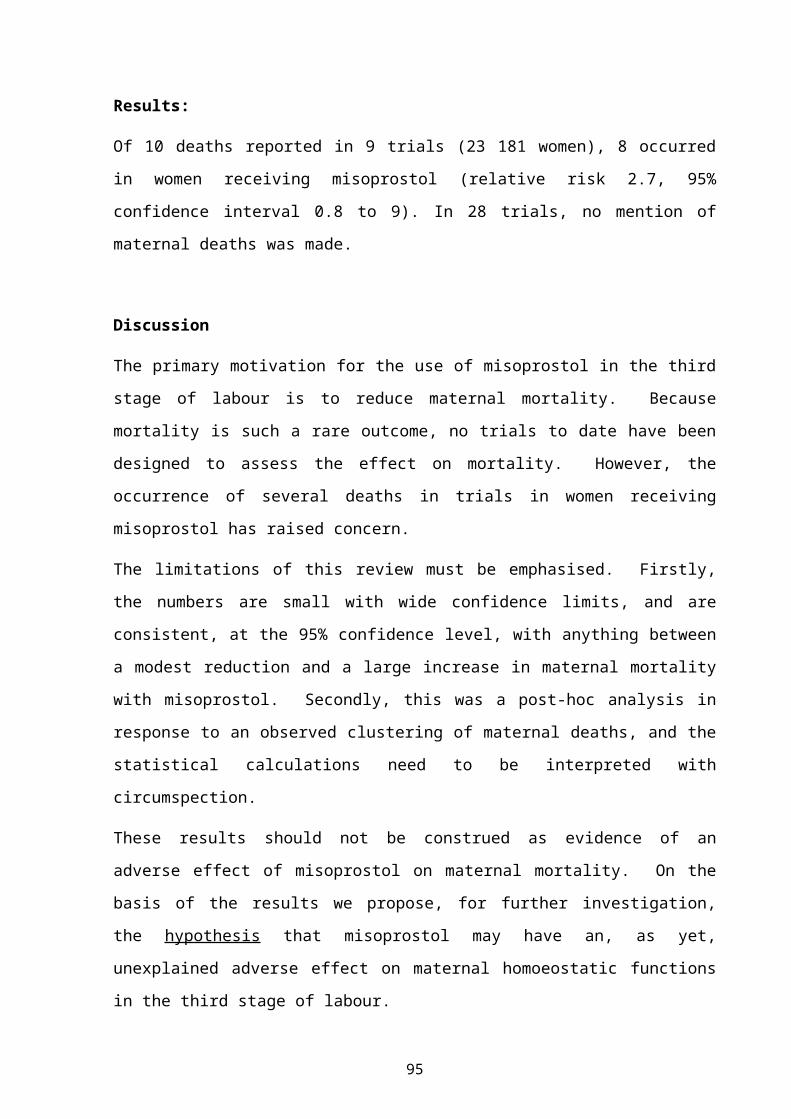
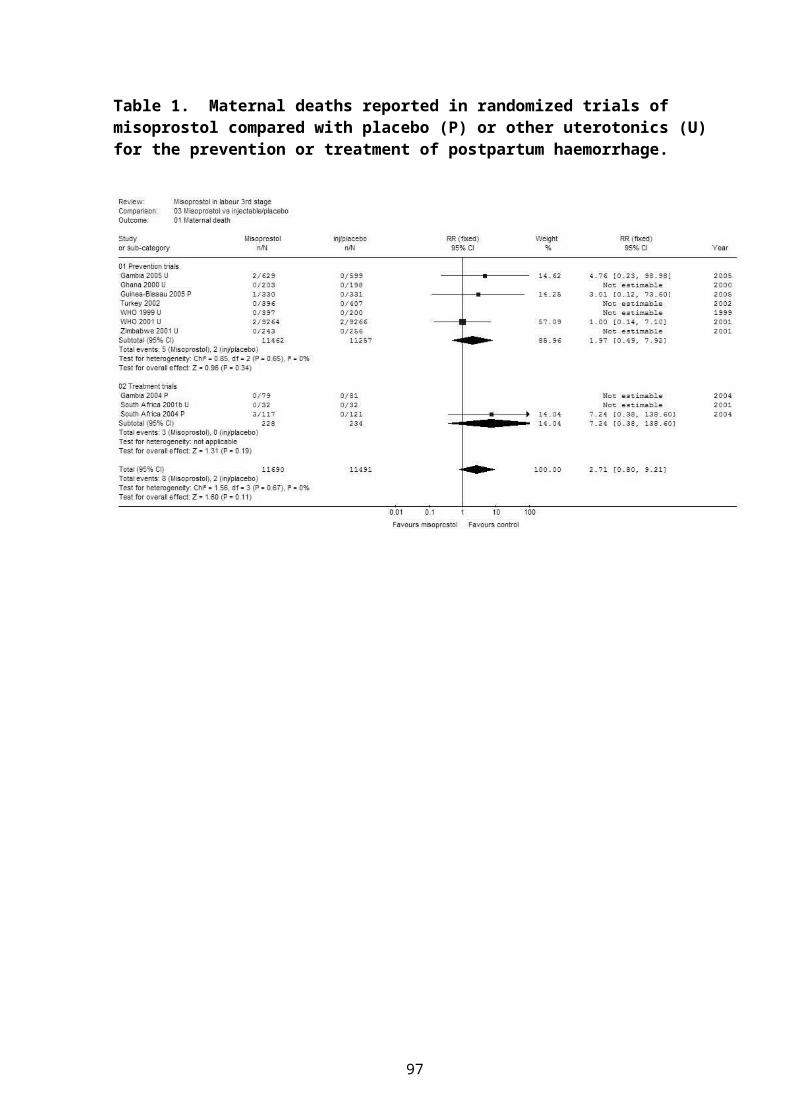
MISOPROSTOL IN THE THIRD STAGE OF LABOUR AND MATERNAL MORTALITY: A SYSTEMATIC REVIEW. GJ Hofmeyr
65
EXPLORING MIDWIFE AND CONSUMER VIEWS ON SOCIAL SUPPORT DURING CHILDBIRTH IN THE PENINSULA MATERNAL AND NEONATAL SERVICE.S Fawcus 69
FUNDAL PRESSURE DURING THE SECOND STAGE OF LABOUR: PROTOCOL FOR A RANDOMISED CLINICAL TRIAL. M Singata
75
UTERINE MASSAGE TO REDUCE POSTPARTUM HAEMORRHAGE, A RANDOMISED TRIAL. M Singata
79
WOMEN’S ATTITUDE TOWARDS MODE OF DELIVERY IN THE WESTERN CAPE.A Manthata 84
PRETERM DELIVERIES ARE A SERIOUS PROBLEM (abstract). N Madumo88
DEVELOPING A COMPREHENSIVE LABOUR MANAGEMENT GUIDELINE FOR SAFE INTRAPARTUM CARE IN SOUTH AFRICA. E Farrell
89
IUGR – A DIAGNOSTIC DILEMMA. DL Woods97
AUDIT OF NEONATAL TRANSFERS TO A TERTIARY CENTRE IN THE TSHWANE METROPOLITAN AREA (abstract). R Masekela.
104
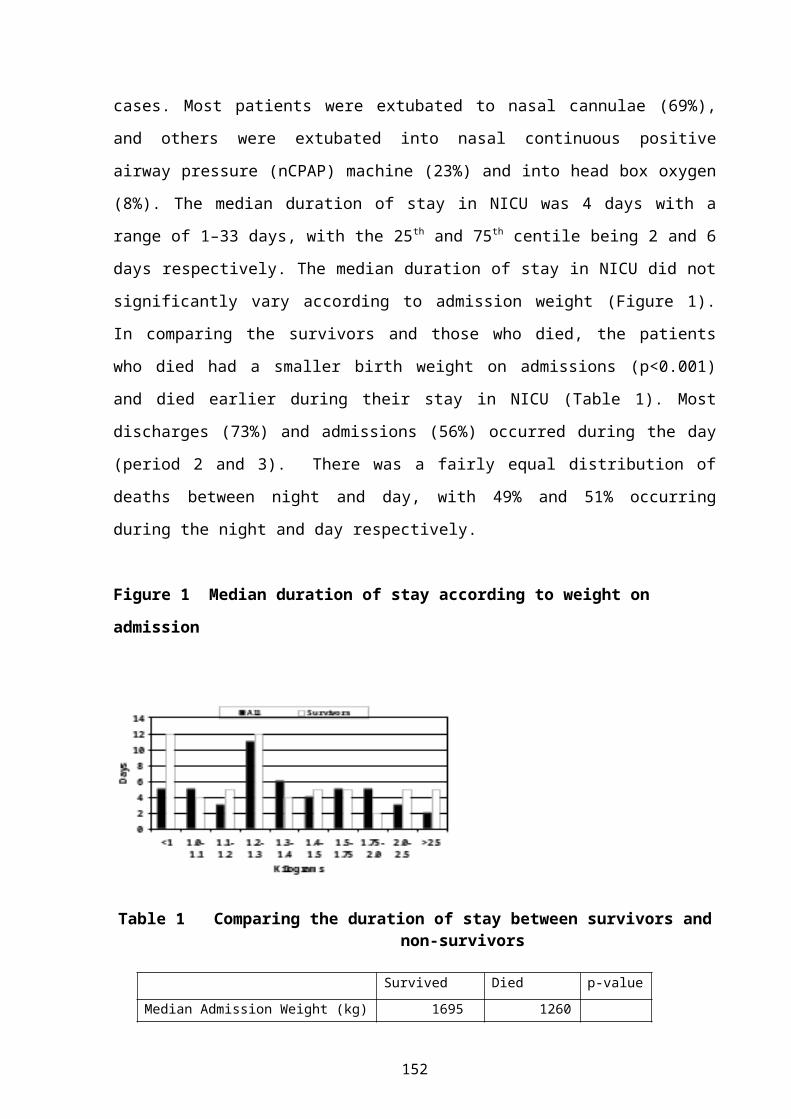
DURATION OF STAY, TIME OF DEATHS AND DISCHARGES IN A NEONATAL INTENSIVE CARE UNIT. P Mphakoba
105
AN EVALUATION OF NEONATAL NURSING CARE IN SELECTED HOSPITALS IN THE WESTERN CAPE. H Barlow
109
iv
TOXIC PAEDIATRIC HOME REMEDIES IN BOTSWANA: POISIONING THE FUTURE? FW Chinhoyi
113
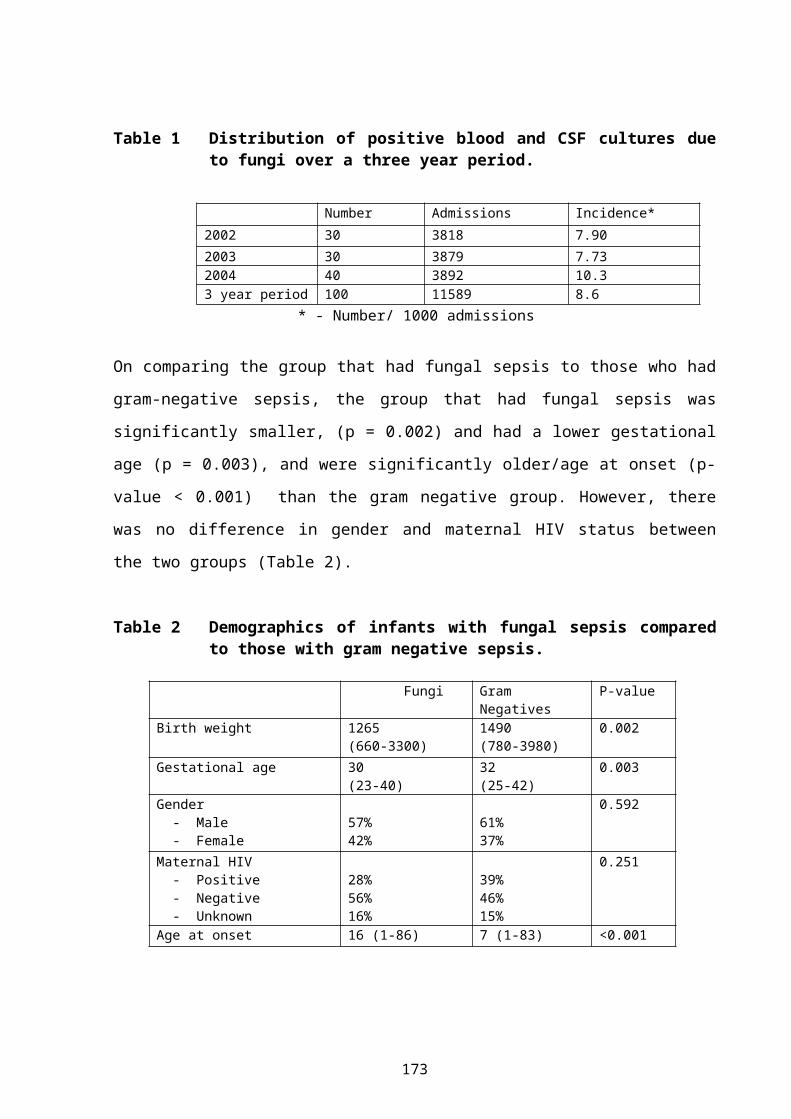
FUNGAL SEPSIS IN A NEONATAL UNIT: RISK FACTORS, LABORATORY FINDINGS, FUNGAL SPECIES AND CASE FATALITY RATES. F Nakwa
120
BACTERIAL PATHOGENS ISOLATED FROM INFANTS ADMITTED TO A NEONATAL UNIT: EMERGENCE OF RESISTANT BACTERIA. S Velaphi
125
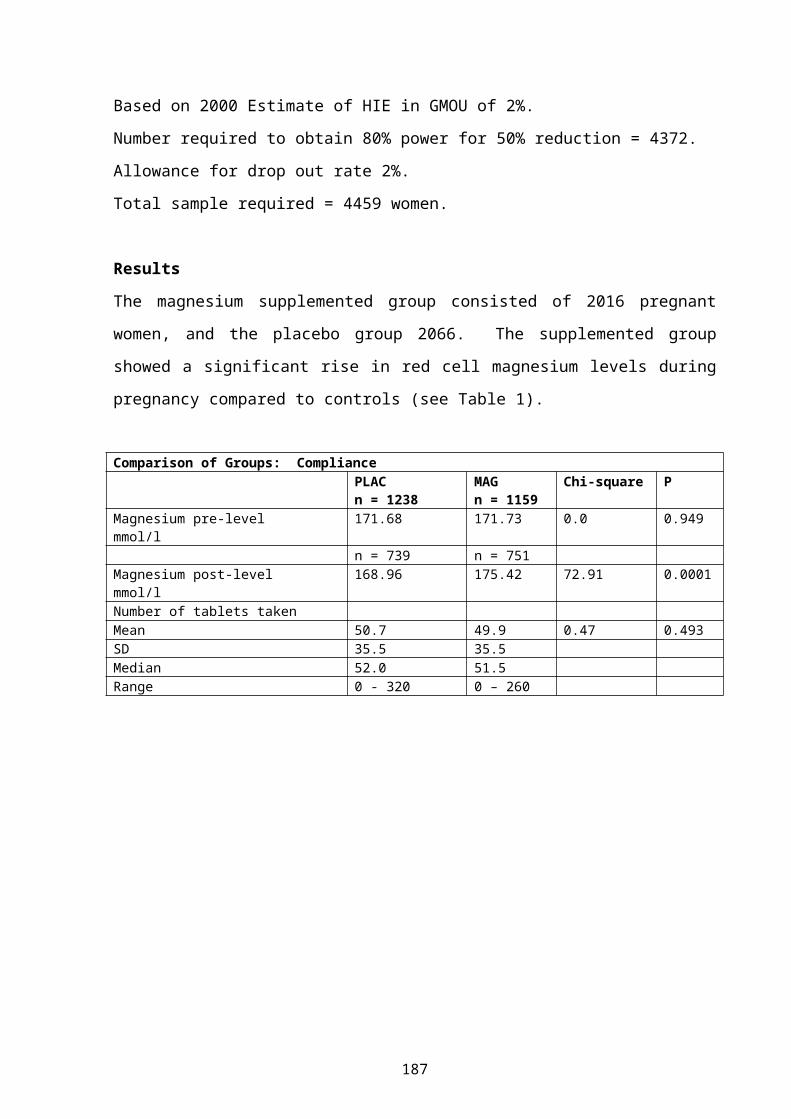
MAGNESIUM SUPPLEMENTATION IN PREGNANCY: DOES IT REDUCE THE INCIDENCE OF HYPOXIC ISCHAEMIC ENCEPHALOPATHY? S Fawcus
130
IMPLEMENTING ON-SITE TESTING FOR SYPHILIS IN BOLAND/OVERBERG REGION: CONSTRAINTS ENCOUNTERED AND LESSONS LEARNT. S Neethling 135
INTERVENTIONS FOR LEG OEDEMA AND VARICOSITIES IN PREGNANCY. WHAT EVIDENCE? AA Bamigboye
139
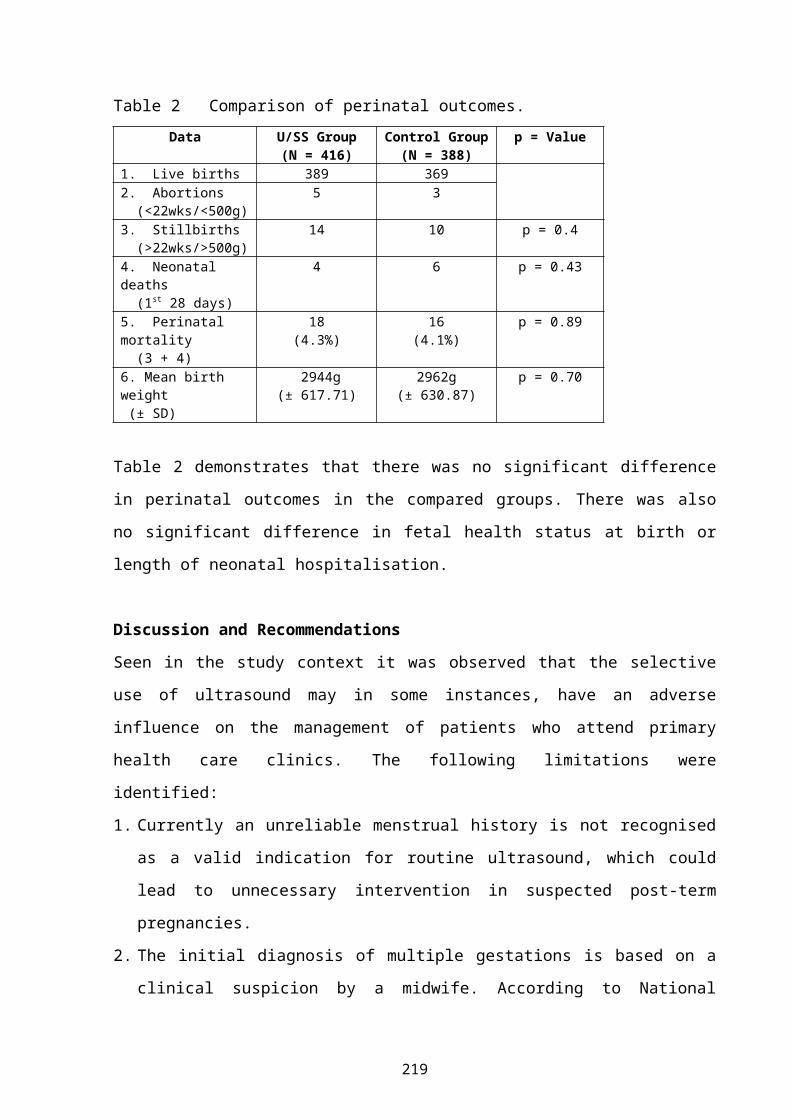
THE VALUE OF MID-TRIMESTER ULTRASOUND AT PRIMARY HEALTH CARE LEVEL. B van Dyk
148
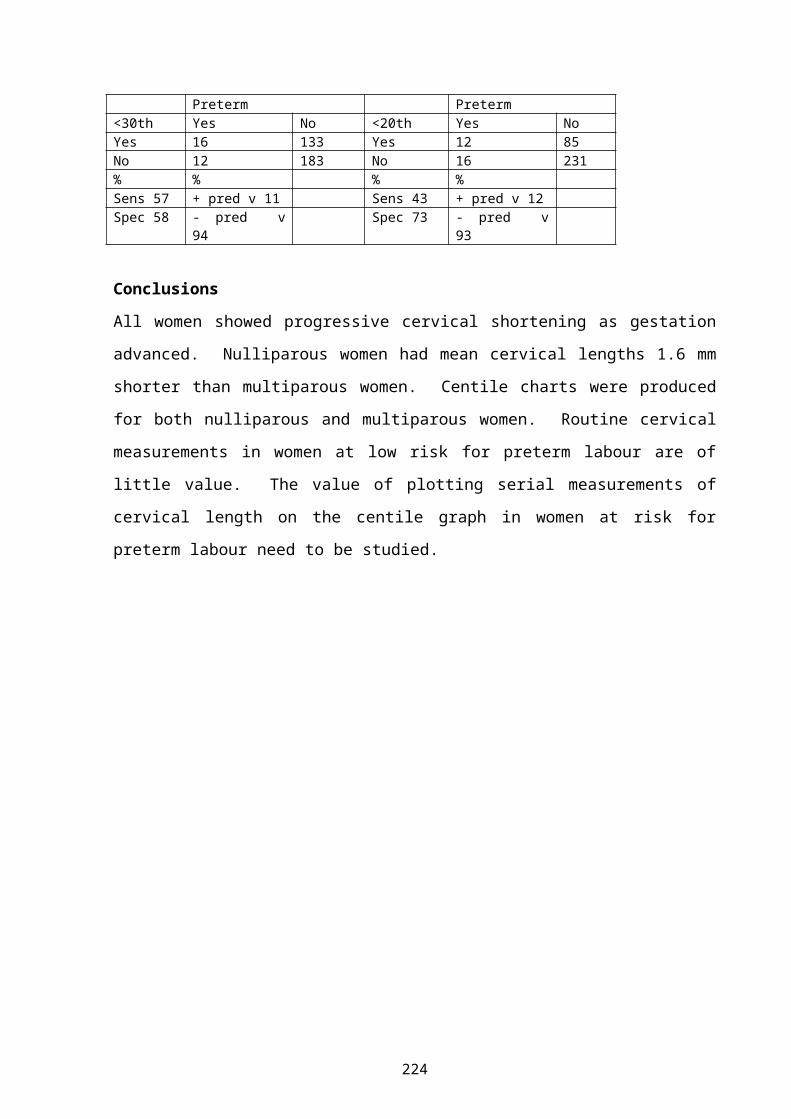
CENTILE CHARTS FOR CERVICAL LENGTH AT A GESTATIONAL AGE OF 16 TO 32 WEEKS. GB Theron
153
A CENTILE CHART FOR BIRTH WEIGHT FOR A GESTATIONAL AGE FROM 24 TO 28 WEEKS. GB Theron
155
BANC: BASIC ANTENATAL CARE PROGRAMME (abstract). E Etsane158
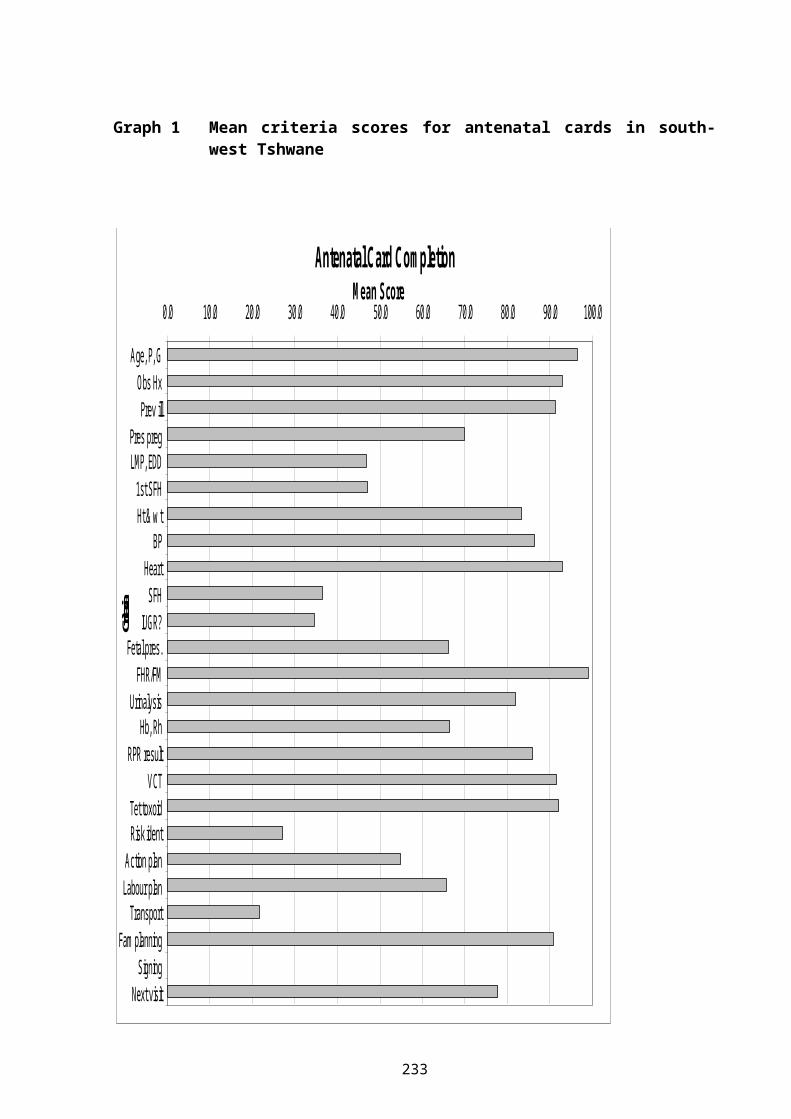
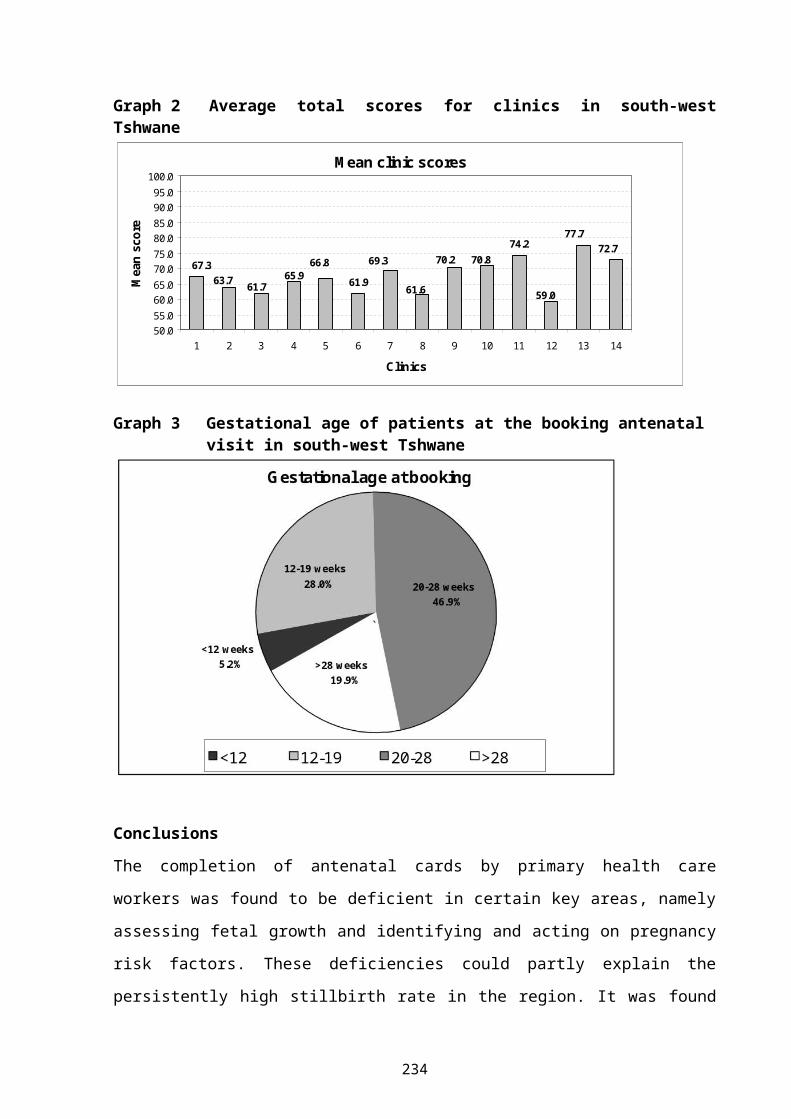
AUDITING ANTENATAL CARE IN SOUTH-WEST TSHWANE. V Sutton159
THE MICROLIFE 3AC1: AN ACCURATE BLOOD PRESSURE MEASUREMENT DEVICE IN PREGNANCY & PRE-ECLAMPSIA. A de Greeff
163
TETANUS IMMUNISATION IN PREGNANCY: IS OUR PROTOCOL OUT OF DATE?
v
WJ Steinberg167
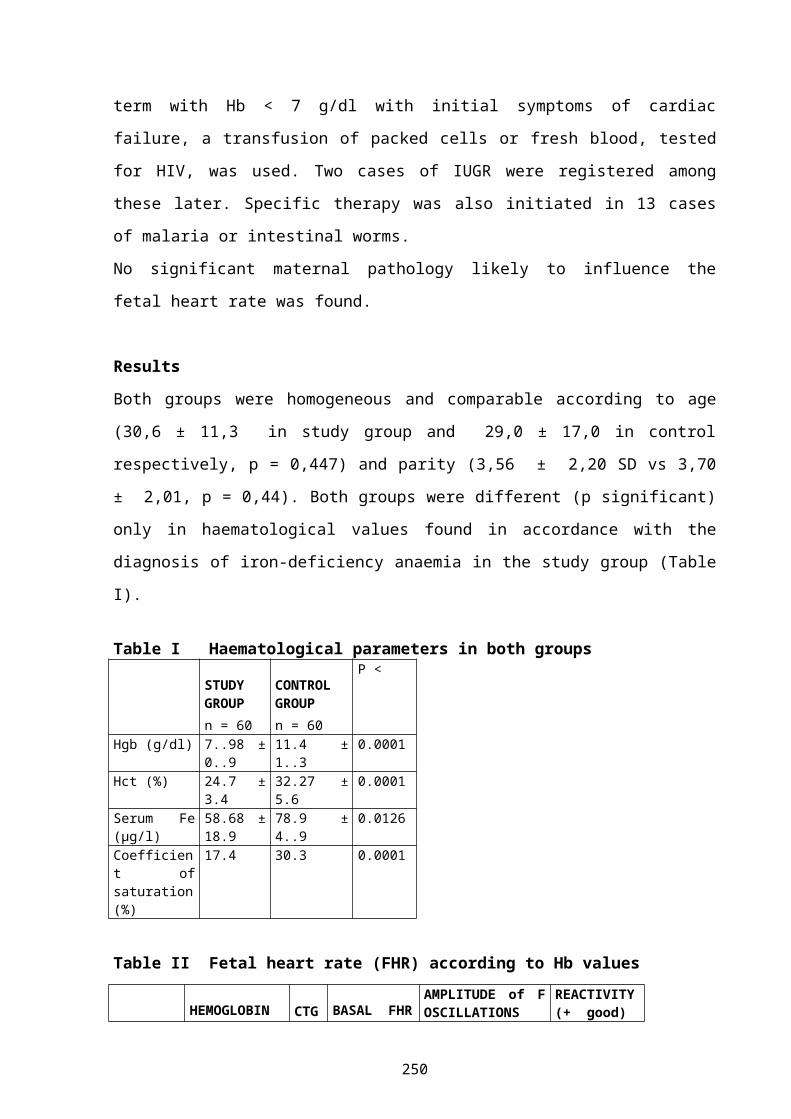
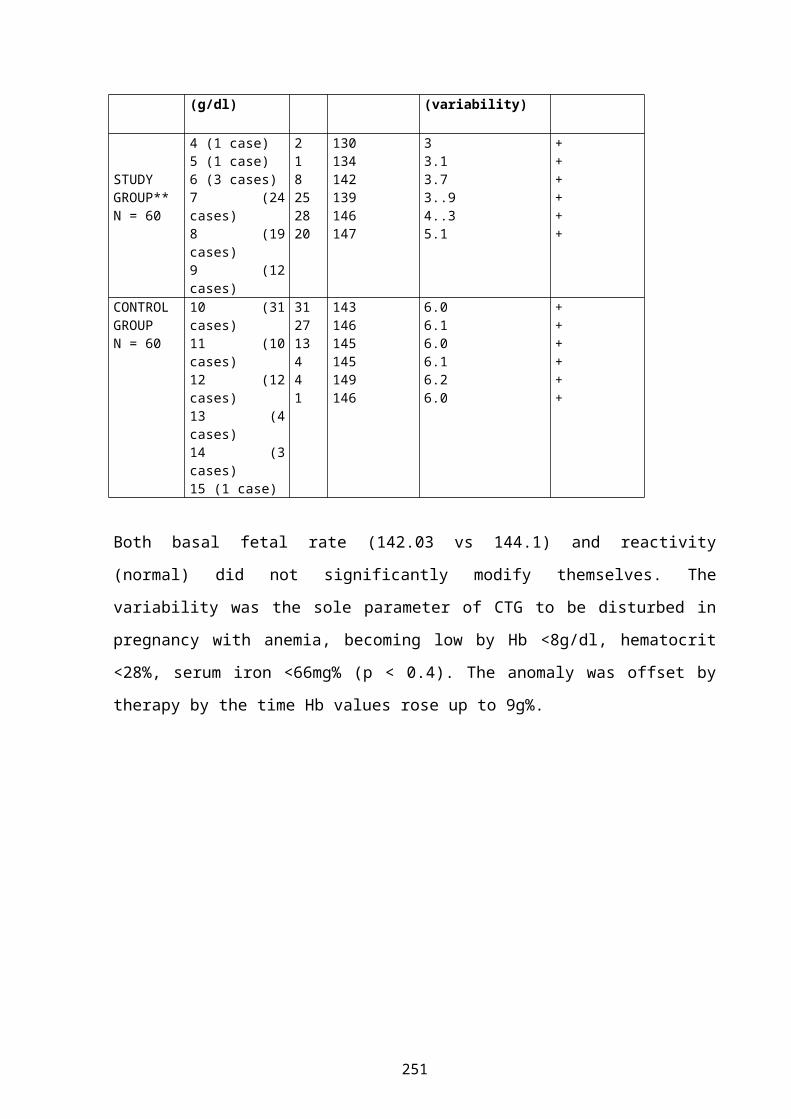
CTG DURING MATERNAL ANAEMIC SITUATION IN THE UNIVERSITY CLINICS, KINSHASA, DRC. NFB Tandu-Umba
171
PREVENTION OF MOTHER-TO-CHILD TRANSMISSION OF HIV: CHALLENGES (abstract). TJ Mashamba
174
GOOD START STUDY RESULTS: EARLY HIV TRANSMISSION, HIV-FREE SURVIVAL AND INFANT FEEDING ISSUES. M Colvin
175
ATTITUDE OF PREGNANT WOMEN TOWARDS THE USE OF CONDOMS (abstract).RP Mojapelo
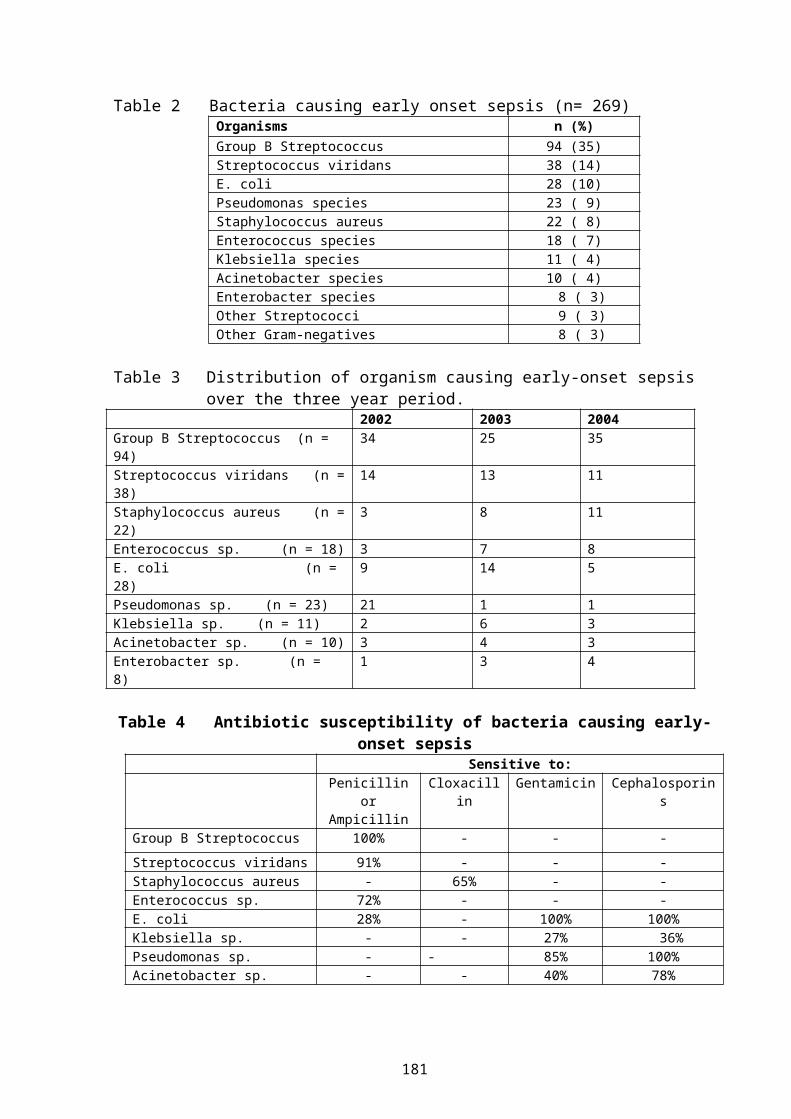
181
DOES MATERNAL HIV INFECTION CAUSE INTRAUTERINE GROWTH RESTRICTION. A COMMUNITY-BASED ULTRASOUND STUDY (abstract). EJ Coetzee 182
A COMPARATIVE CASE STUDY ANALYSIS OF TWO PMTCT FOLLOW-UP PROGRAMS. M Loveday
183
REVIEW OF BEST PRACTICES: DIFFERENCES BETWEEN DEVELOPED AND DEVELOPING HEALTHCARE SETTINGS FOR THE PREVENTION OF MATERNAL-TO-CHILD (PMTCT) TRANSMISSION OF HIV/AIDS. JM Dippenaar
188
RECOMMENDATIONS FOR SAFE INTRAPARTUM PRACTICES TO LIMIT VERTICAL TRANSMISSION OF HIV (abstract). A du Preez
190
IS THE BABY FRIENDLY HOSPITAL INITIATIVE (BFHI) STILL POSSIBLE WITHIN THE CONTEXT OF RISING HIV TRANSMISSION RATES AND THE USE OF FREE FORMULA? (abstract) L Glynn
191
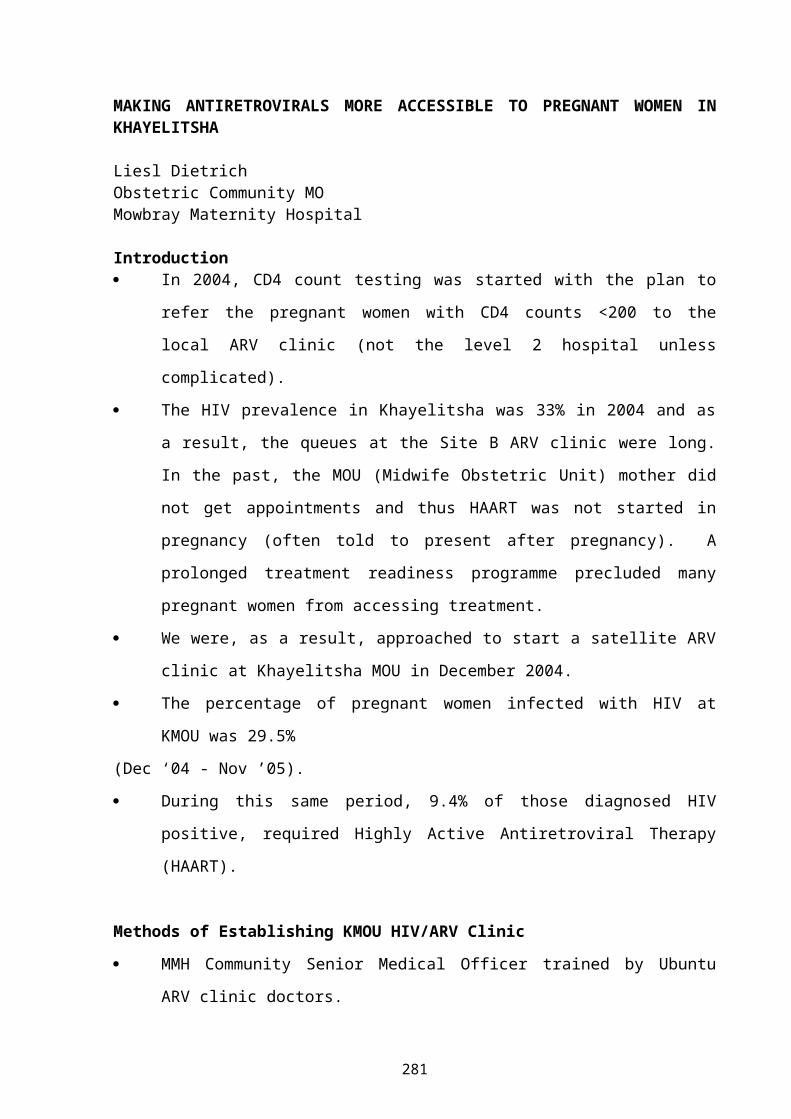
MAKING ANTIRETROVIRALS MORE ACCESSIBLE TO PREGNANT WOMEN IN KHAYELITSHA. L Dietrich
192
vi
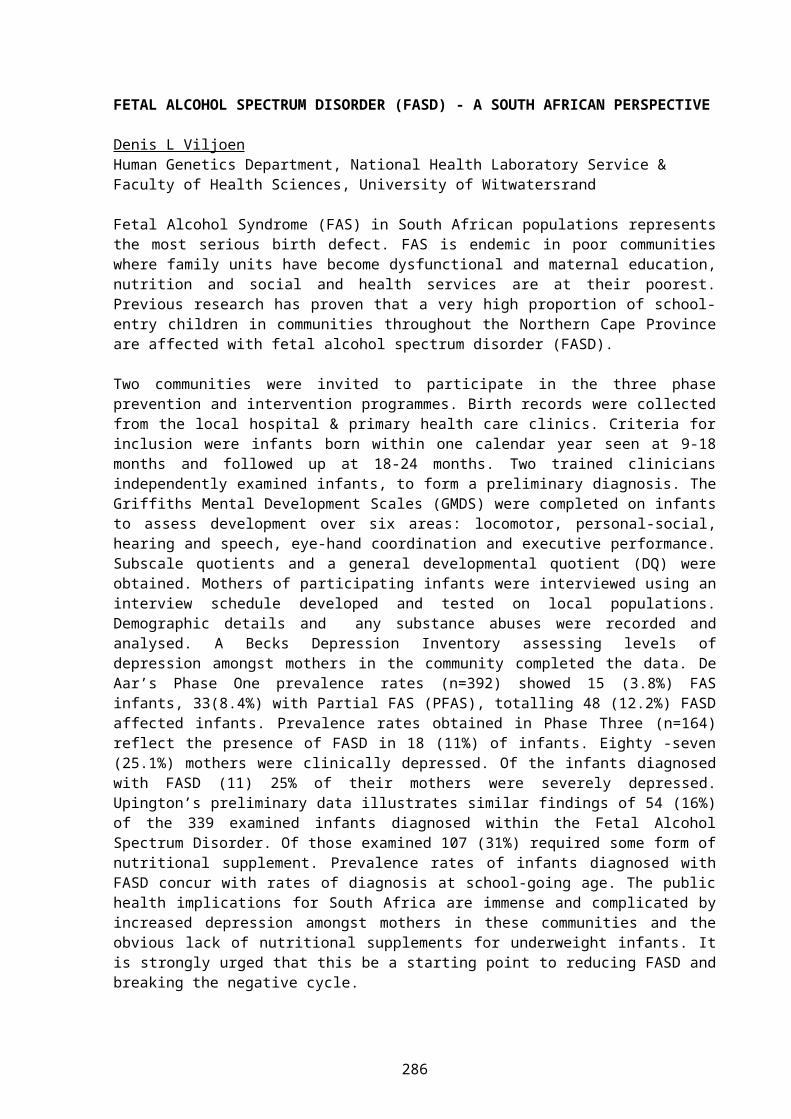
FETAL ALCOHOL SPECTRUM DISORDER (FASD) - A SOUTH AFRICAN PERSPECTIVE (abstract). DL Viljoen
196
A REVIEW OF 482 NEONATAL DEATHS AT A LEVEL II HOSPITAL. FS Bondi197
TREND IN SURVIVAL OF NON-VENTILATED VERY LOW BIRTH WEIGHT INFANTS (1993-2005) AT MADADENI HOSPITAL. FS Bondi
201
NEONATAL CHARACTERISTICS AND OUTCOME OF BABIES WEIGHING ≤1250 GMS AT BIRTH FOR 2003-2004 AT KING EDWARD VIIITH HOSPITAL, DURBAN, SOUTH AFRICA. Adhikari M
205
PERINATAL MORTALITY, NEONATAL MORTALITY AT KING EDWARD VIIITH HOSPITAL, DURBAN, 2004. Adhikari M
208
MATERNAL AND NEONATAL PROFILE AND IMMEDIATE OUTCOME OF EXTREMELY LOW BIRTHWEIGHT BABIES – IMPORTANT LESSONS. MPB Mawela 211
HUMAN MILK BANKING IN SOUTH AFRICA. L Goosen214
INFANT FEEDING PRACTICES IN A HIGH HIV PREVALENCE RURAL DISTRICT OF KWAZULU-NATAL. MR Ghuman
217
JOEYS LIVE – KANGAROO MOTHER CARE SAVES LIVES. RC Pattinson223
UKUBAMBA UMTWANA KUWE OUTREACH: IMPLEMENTATION OF KANGAROO MOTHER CARE IN MPUMALANGA. E van Rooyen
226
DEVELOPING AN EVIDENCE-BASED EARLY COMMUNICATION INTERVENTION PROGRAMME FOR VERY LOW BIRTH WEIGHT NEONATES AND THEIR MOTHERS.A Kritzinger
230
AN ONGOING AUDIT OF THE KANGAROO MOTHER CARE UNIT AT KALAFONG HOSPITAL. E van Rooyen
235
vii
FARA NGWANA OUTREACH: IMPLEMENTATION OF KANGAROO MOTHER CARE IN GAUTENG. D Tsotsetsi
243
"ON-SITE" VERSUS "OFF-SITE" FACILITATION: A RANDOMISED TRIAL OF OUTREACH STRATEGIES. A-M Bergh
245
TREATMENTS FOR BREAST ENGORGEMENTS DURING LACTATION: A SYSTEMATIC REVIEW (abstract). L Mangesi
249
EFFECTIVENESS OF THE IMPLEMENTATION OF THE BASIC ANTENATAL CARE (BANC) PACKAGE IN THE NELSON MANDELA METRO. JS Snyman
250
CERVICAL DILATATION, DESCENT, MOULDING AND POSITION – HOW GOOD ARE OBSTETRICIANS WITH CLINICAL SIGNS OF LABOUR PROGRESS?EJ Buchmann
256
IMPROVING THE QUALITY OF OBSERVATIONS, RECORDINGS AND DECISIONS DURING LABOUR (abstract). A Voce
259
CHANGES IN NEONATAL MORTALITY AFTER THE INTRODUCTION OF A NEONATAL OUTREACH PROGRAMME IN LIMPOPO PROVINCE. PL Mashao
260
ACCREDITATION OF NEWBORN CARE – THE NEXT STEP. AF Malan264
DO INITIATIVES LIKE: THE BETTER BIRTH INITIATIVE (BBI), THE WHO/UNICEF BABY FRIENDLY HOSPITAL INITIATIVE (BFHI) AND KANGAROO MOTHER CARE (KMC) IMPROVE THE QUALITY OF PERINATAL CARE? L Goosen 266
CLINICAL DECISION-MAKING IN LABOUR - HOW DO PART-TIME MIDWIVES FARE? S Clow
269
viii
MIDWIFERY STAFFING NEEDS IN A MATERNITY WARD
DH GreenfieldSub-directorate; Maternal, Women’s and Child Health, West Cape Provincial Administration
IntroductionUnderstaffing is continually brought forward as a limiting factor in the provision of adequate health care. This is especially so in perinatal care which is stressful for the staff, both in the care of the mothers and the infants. The staffing norms for midwives in a maternity unit appear to be unknown in the South African context. When recommendations have been made, there does not always appear to be a logical way of determining or calculating the needs, and they have been related to bed rather than patient numbers. This study was done to try to calculate the needs by:
Assessing the work done, andAssessing the time taken for the various activities/procedures.
MethodsThe calculations were made based on the assessed needs of a level 1 maternity unit. The needs of a level 2 or 3 unit will probably be more than are shown in this study. Some assumptions needed to be made. These were:
1. The time taken for observations.2. The time taken for procedures.3. The time taken for interviews.
4. The amount of leave taken by midwives.
The proportion of patients needing transfer out of a level 1 unit was based on statistics derived from the Midwife Obstetric Units in the Peninsula Maternal and Neonatal Service in Cape Town.
1
The results were expressed as the number of midwives needed per 100 bookings per month (antenatal care) or per 100 deliveries per month (labour and postnatal care).
Results1. Antenatal care
Calculations based on: Booking visit = ½ hour. Each subsequent antenatal visit takes = 10 minutes x 4 visits
per pregnancy. Transfer of the patient takes ½ hour. 24.5% of bookings are transferred out.
Therefore: for 100 bookings per month, there will be 129 hours work per
month. for a 5 day week, this will be 21.75 working days per month. or: 5.94 hours per day.
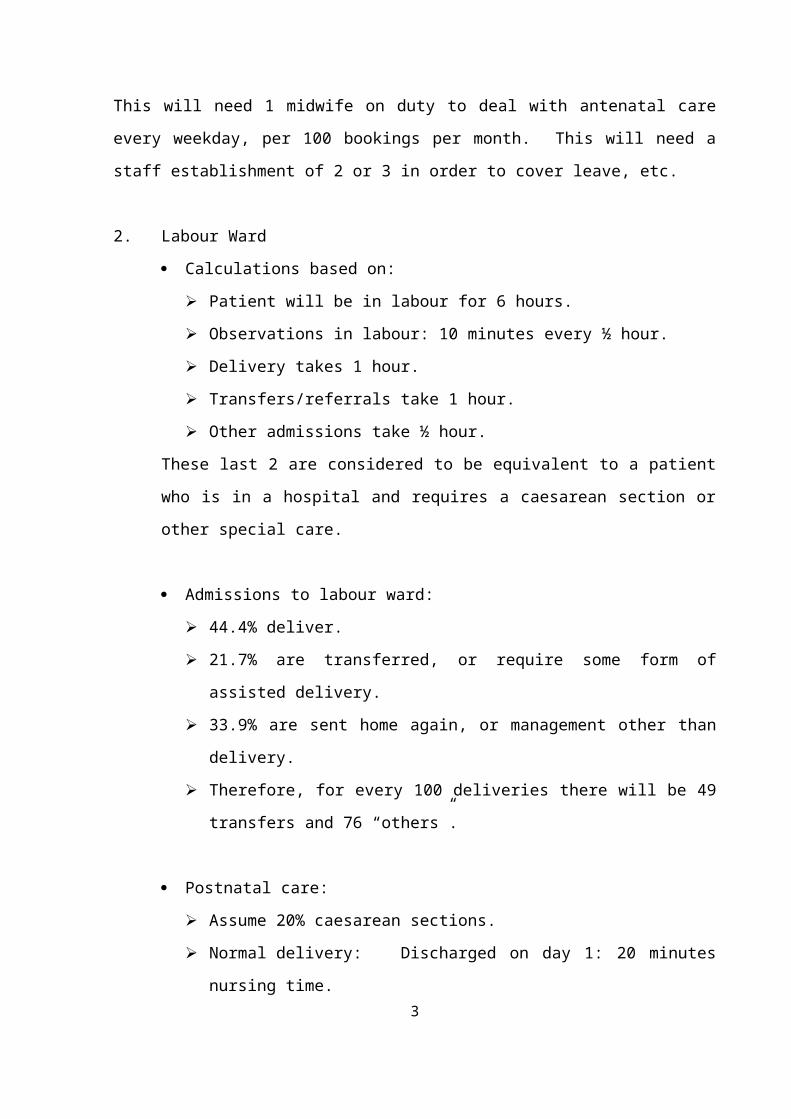
This will need 1 midwife on duty to deal with antenatal care every weekday, per 100 bookings per month. This will need a staff establishment of 2 or 3 in order to cover leave, etc.
2. Labour Ward Calculations based on:
Patient will be in labour for 6 hours. Observations in labour: 10 minutes every ½ hour. Delivery takes 1 hour. Transfers/referrals take 1 hour. Other admissions take ½ hour.
These last 2 are considered to be equivalent to a patient who is in a hospital and requires a caesarean section or other special care.
2
Admissions to labour ward: 44.4% deliver. 21.7% are transferred, or require some form of assisted
delivery. 33.9% are sent home again, or management other than
delivery. Therefore, for every 100 deliveries there will be 49 transfers
and 76 “others”.
Postnatal care: Assume 20% caesarean sections. Normal delivery: Discharged on day 1: 20 minutes nursing
time. Caesarean section: 60 minutes nursing time on day 1.
20 minutes nursing time daily x 3 days.Total nursing time = 0.7 hours per delivery.
Time needed in labour ward: Observations: 2 hours per delivery Delivery: 1 hour Transfers: 0.49 hours per delivery Other admissions: 0.38 hours per delivery Postnatal care: 0.7 hours per delivery
Therefore, delivery related time = 4.57 hours per “delivery” = 4.57 x 3.3 (15.1) hours per day per 100 deliveries per month
Nursing time: A midwife works 40 hours per week. Annual leave is 36 days. Other forms of leave have not been included.
3
Therefore 1 midwife works on average 4.9 hours per dayI midwife on duty for 24 hours per day requires (24/4.9 = 4.9 (5) midwives on the staff establishment.There are 15.1 hours of work per day (for 100 deliveries per month) 15.1 /4.9 = 3.1 midwives.1 midwife on duty for 24 hours = staff establishment of 5 midwivesTherefore 3.1 midwives on duty per day = staff establishment of 3.1 x 5 = 15.5 (16) midwives per 100 deliveries per month. In addition, there needs to be 1 staff member for administration/management.
ConclusionsA delivery service needs a staff establishment of: 16 midwives per 100 deliveries per month. 2-3 midwives per 100 bookings per month. 1 manager, who should, when needed, be part of the work force. There has been no assessment made of the needs for staffing a
newborn care service.
Critical questions.1. Where are these midwives going to come from?2. What are we going to do about it?3. When are we going to do something about it?
4
COMMUNITY-BASED SITUATION ANALYSIS OF MATERNAL AND NEONATAL FOLLOW-UP CARE
Pulani Tlebere, National Department of Health; Debra Jackson, School of Public Health, UWC; Marian Loveday, Health Systems Trust; Lyness Matizirofa, Statistics Dept, UWC; Tanya Doherty, Health Systems Trust; Nomafrench Mbombo, School of Nursing, UWC; Latasha Treger, CDC South Africa
OBJECTIVES OF THE SITUATION ANALYSISThis research was commissioned by the South African National Department of Health and the US Centers for Disease Control & Prevention, South Africa. The study objectives were:
1. To determine factors influencing utilisation of maternal health services and barriers to utilisation of maternal health services (including loss to follow-up of mothers and infants in the PMTCT programme).
2. To determine the level of awareness of risk factors associated with poor maternal and perinatal health outcomes among women and men.
3. To determine the health seeking behaviours of HIV-positive and HIV-negative pregnant women.
Study Methods• Semi-structured Household Interviews:
• HIV+ve mothers already enrolled in national PMTCT cohort study (N=60).
• HIV-ve mothers already enrolled in national PMTCT cohort study (N=60).
• Mothers of unknown HIV status (N=58).
5
• Case Studies: No ANC &/or Home Birth (N=23).• Verbal Autopsies: Maternal (N=18) & Infant Deaths (N=40) – using
adapted WHO tools.
Data Capturing & Data Analysis Semi-structured HH interviews – entered into Excel, analysed using
descriptive frequencies & crosstabs, analytic crosstabs & p-values in EpiInfo.
Qualitative Case Studies & Verbal Autopsies – each type reviewed by 2 independent researchers using content-theme analysis.
All analysis done independently then triangulated to identify common themes & issues
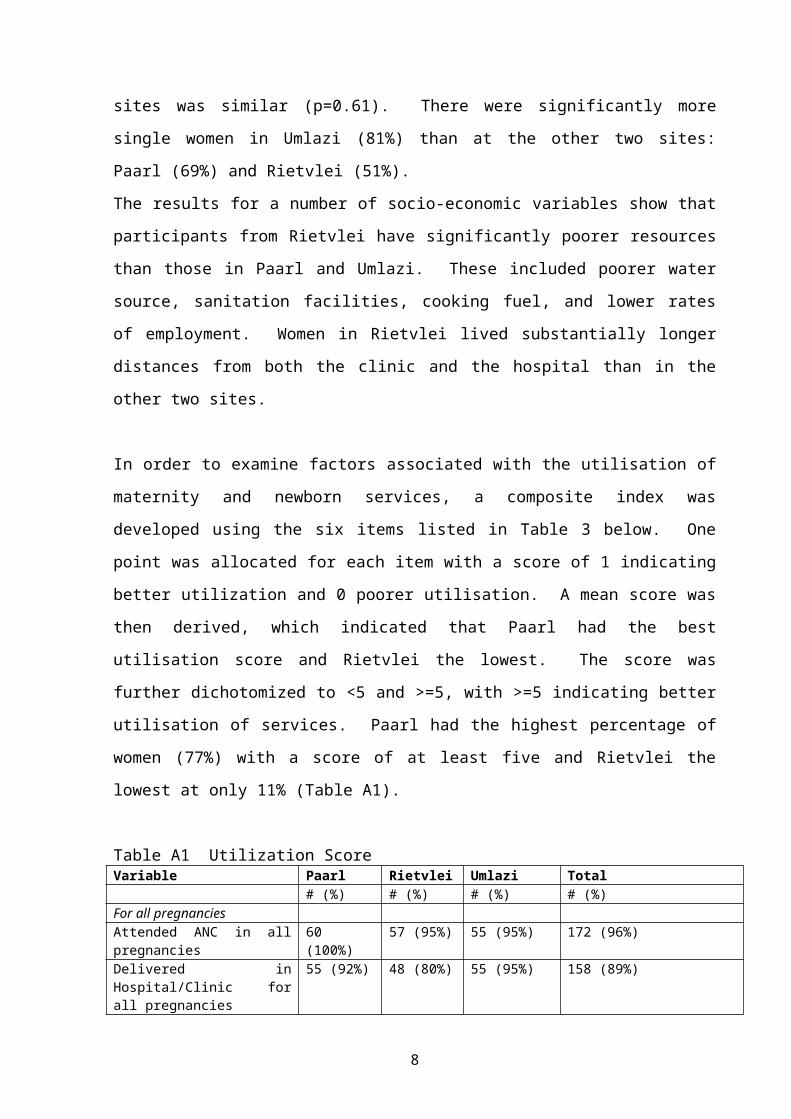
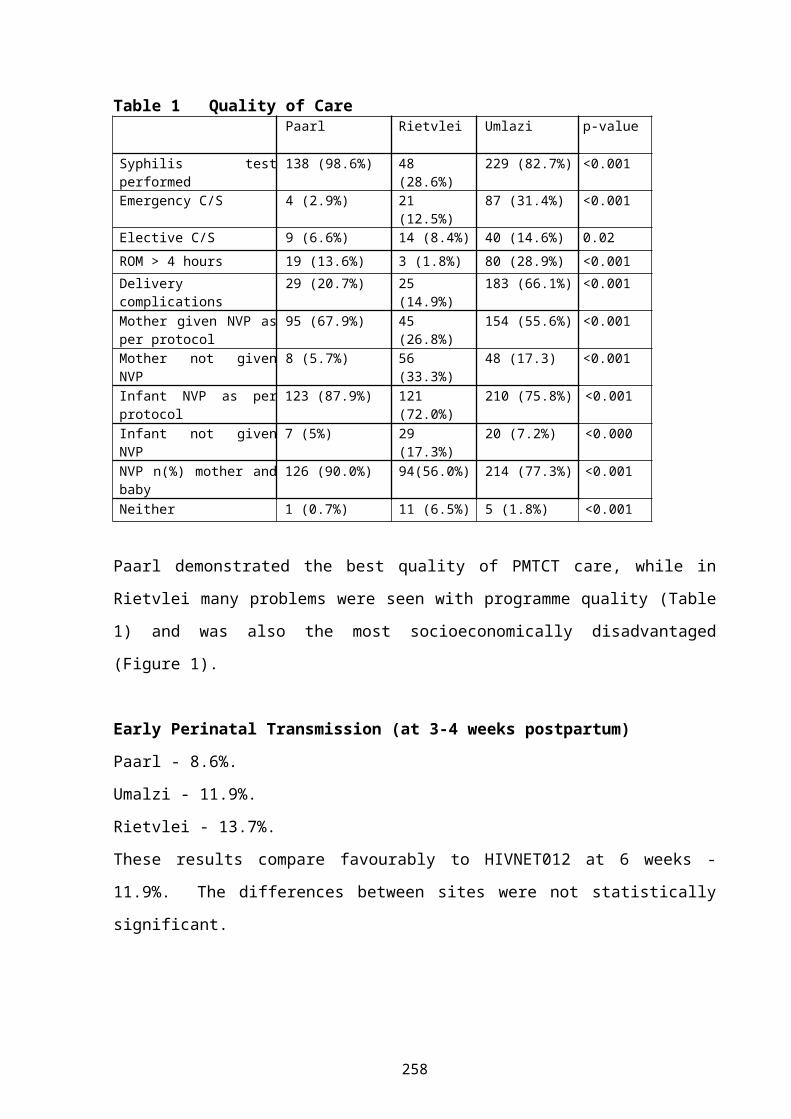
RESULTSHousehold InterviewsIn total, there were 226 respondents. Of these 68 were in Paarl, 78 in Rietvlei and 81 in Umlazi. Of the 226 respondents, 178 were involved in semi-structured interviews and 48 in in-depth studies. In addition, 178 household members were interviewed. The average age of the women interviewed (not household members) was similar across the sites between 25 and 27 years. The mean infant age across sites was similar (p=0.61). There were significantly more single women in Umlazi (81%) than at the other two sites: Paarl (69%) and Rietvlei (51%).The results for a number of socio-economic variables show that participants from Rietvlei have significantly poorer resources than those in Paarl and Umlazi. These included poorer water source, sanitation facilities, cooking fuel, and lower rates of employment. Women in Rietvlei lived substantially longer distances from both the clinic and the hospital than in the other two sites.
In order to examine factors associated with the utilisation of maternity and newborn services, a composite index was developed using the six items listed in Table 3 below. One point was allocated for each item with a score
6
of 1 indicating better utilization and 0 poorer utilisation. A mean score was then derived, which indicated that Paarl had the best utilisation score and Rietvlei the lowest. The score was further dichotomized to <5 and >=5, with >=5 indicating better utilisation of services. Paarl had the highest percentage of women (77%) with a score of at least five and Rietvlei the lowest at only 11% (Table A1).
Table A1 Utilization Score Variable Paarl Rietvlei Umlazi Total
# (%) # (%) # (%) # (%)For all pregnanciesAttended ANC in all pregnancies
60 (100%)
57 (95%) 55 (95%) 172 (96%)
Delivered in Hospital/Clinic for all pregnancies
55 (92%) 48 (80%) 55 (95%) 158 (89%)
For last pregnancyBegan ANC in months 0-4 34 (57%) 20 (34%) 26 (46%) 80 (46%)1st infant follow-up visit prior to 6 weeks of age
56 (93%) 16 (27%) 48 (84%) 120 (68%)
1st maternal follow-up visit prior to 6 weeks post-delivery
55 (92%) 10 (18%) 21 (38%) 86 (49%)
Currently using Family Planning
47 (78%) 43 (73%) 47 (89%) 137 (80%)
Mean Utilization Score (1 point for each of above)
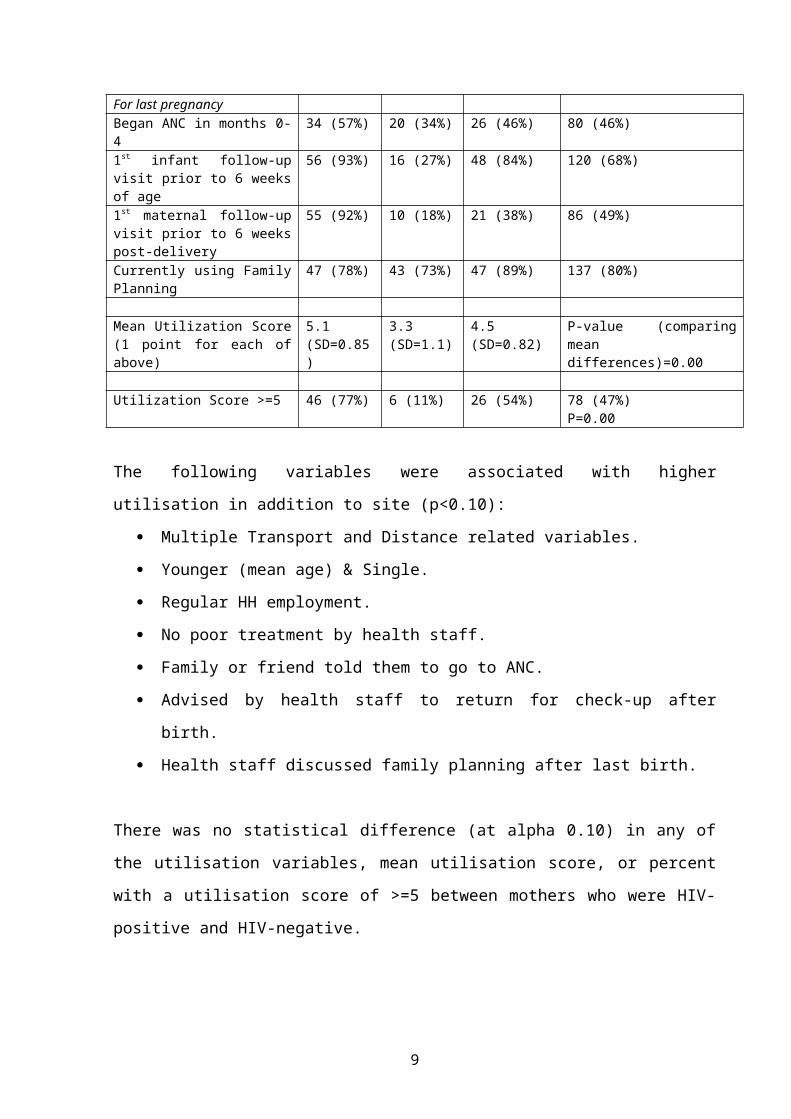
The following variables were associated with higher utilisation in addition to site (p<0.10):
Multiple Transport and Distance related variables. Younger (mean age) & Single. Regular HH employment. No poor treatment by health staff. Family or friend told them to go to ANC. Advised by health staff to return for check-up after birth. Health staff discussed family planning after last birth.
7
There was no statistical difference (at alpha 0.10) in any of the utilisation variables, mean utilisation score, or percent with a utilisation score of >=5 between mothers who were HIV-positive and HIV-negative.
Specifically examining stated barriers to care, in Paarl 27%, Umlazi 28% and in Rietvlei 38% of women indicated they had problems attending antenatal care. A lack of financial resources for transport was the barrier most cited by women. Although money was listed as the biggest barrier to care, having money was not cited as a promoter of ANC attendance. Support of family and friends was the strongest promoter of ANC attendance. This support varied from encouragement to assistance with transport and money. Eleven to fifteen percent of women cited friendly staff and good quality care as promoters of ANC attendance.
With regard to late antenatal attendance the two main reasons for not starting ANC early were the distance to services, and that pregnant women felt fine, so they thought it was all right to access ANC services later in their pregnancy. The proportion of women who cited the latter reason was substantially higher in Rietvlei (61%), compared to 14% in Umlazi and none in Paarl.
With regard to knowledge of risk factors by the women, the most well-known factors for pregnancy and delivery were hypertension and oedema (75%); for postpartum it was bleeding (75%), and for newborns chronic diarrhoea (75%). The majority of other risk factors were mentioned by less than 50% of women. Knowledge in household members was similar to that of the women.
The predominant source of information on pregnancy at each of the three sites was the health workers (over 80% in all sites), followed by the radio and friends or family. The most trusted source of information for making health decisions was also health workers.
8
Qualitative Case StudiesNo Antenatal Care and Home BirthsThe following themes related to health systems barriers to antenatal care were identified from the in-depth interviews: Accessibility of health services was a major issue, including time services offered, distance/time to services, and money to travel to services. Another major theme was the attitude of nurses with some nurses being very positive, but unfortunately not all. Community factors raised by the women who did not attend ANC included: limited financial resources, influence of family members, family responsibilities, women don’t realise they are pregnant, and difficulty in obtaining time off work
Examining themes from the home births, women mention transport, attitude of nurses and nurses not recognizing labour, as health systems issues which prevented them from making it to the hospital or clinic for delivery. With regard to community issues related to place of delivery, women discussed fear of problems in labour as the primary reason for wanting to deliver in a health facility but that fear of labour ward nurses, family responsibilities and themselves not recognizing labour as reasons why they did not make it to the health facility for delivery.
There are a number of barriers to accessing both antenatal and maternity services. In many cases, multiple reasons for not attending antenatal or maternity services were given. It is concerning to note the number of home deliveries which took place with only children present.
Verbal Autopsies of Maternal DeathsThe causes of death for the 18 cases were: AIDS = 12 (67%); Other Non-Pregnancy Related Infection = 3 (16.5%); and Direct Perinatal Causes = 3 (16.5%). All but one mother died postpartum, and all of the AIDS deaths died after a prolonged period of illness. The majority (12 of 18) of the deaths occurred in the hospital. In only one of the non-hospital deaths, was lack of transport considered a possible contributor.
9
The majority of women had sought heath care without delay at the beginning of their illness. The women with chronic conditions clearly had regular contact with the public health care system, and many also had contact with private and traditional health systems. These women appeared to go first to the clinic or hospital in the public sector and when they did not get better, consulted with either a private doctor, traditional healer or both.
The majority of deaths to mothers in this study were due to AIDS-related causes. These deaths were accompanied by several months of chronic illness and deterioration in health status until the women were no longer able to take care of themselves. Most described poor health as starting during pregnancy or around the time of delivery suggesting pregnancy may have contributed to a deterioration in health in HIV-positive women. Many of these deaths involved extensive care by family members and continuous health seeking to multiple providers during the course of the illness. However, family members received very little if any communication from health providers about the condition of the terminally ill woman or her care. Denial and/or hopelessness were seen in many of these cases. Interestingly, hopelessness, denial and lack of disclosure was not seen in the cases in Paarl where hospice care was available and the health care and system has been previously described to be of a higher quality with more resources.
Although the majority of deaths appeared to be HIV and AIDS related, there were still deaths due to direct obstetric causes. One involved patient-related avoidable factors and in the other two, health provider-avoidable factors. Care must be taken not to overlook basic maternity service quality in the face of an often overwhelming HIV and AIDS pandemic.
10
Verbal Autopsies of Infant DeathsThe mean age of the infants who died was 16.7 weeks, ranging from one day to 48 weeks. Three babies died under one week of age. Causes of death were primarily infectious. The HIV status of many of the infants is unknown as they died before an HIV test was done. To place the above deaths in context - overall there were 75 infant deaths in the Good Start Cohort Study. Nine month mortality rates in infants born to HIV-positive women was 10.1% while for those born to HIV-negative women it was 3.7% (p=0.003).
Themes that emerged from the qualitative results regarding factors that influenced utilisation of child health services included:
Socioeconomic constraints - once again this focuses on transportation issues, such as no money for transport to clinic or hospital.
Beliefs about causes of illness - “Ishawe Yinyoni" (witchcraft) was blamed for the infant death in one case.
Lack of awareness of danger signs in infants - several mothers stated that they did not realize the seriousness of the child's condition and therefore delayed seeking care.
Poor quality of care - in several cases, the infants had been seen at the clinic or hospital and been sent home without recognition of the seriousness of the illness as the child died later that day.
Role of traditional healers - traditional healers were used, but again this was only after the mothers had taken the infant to the clinic or hospital and the infants condition did not improve or the clinic was out of stock of medicines.
No difference in health seeking behaviour between HIV-positive and HIV-negative mothers.
These in-depth interviews made it possible to highlight the complex pathways and underlying mechanisms that precede the majority of infant deaths in high risk communities. They also highlighted many missed
11
opportunities and poor quality of care that suggests many of the deaths were potentially avoidable.
DISCUSSION: TRIANGULATION AND SUMMARY OF RESULTSIn triangulating the results across the various sources of data in this study, many consistent themes emerged. This section provides a short summary of the primary themes that were seen in this analysis:• Transport & Distance to Care are the biggest problems faced by
women and families in accessing health services.• Communication by health workers with families was shown to be
inadequate, leading to a decreased confidence in the health services.
• Health Seeking Behaviour is good, and despite often poor treatment and lack of communication by the health services, the study showed that most people first seek help from the clinic or hospital and only when failed by the Western medical system did they access traditional medicine. Women and families appear to only delay or not access services when they cannot get there (see transport above) not because they do not want to access services, or do not feel the services are valuable.
• Treatment by health providers & quality of care as reported by the mothers and families was mixed, as examples of both good and poor treatment and care were cited by respondents.
• HIV/AIDS is a major issue but we cannot overlook basic maternity & neonatal service quality.
• Families & Communities are untapped resources that play a crucial role in determining health seeking behaviour and utilisation of services.
RECOMMENDATIONS1. Twenty four-hour emergency transport services must be available
within each community for emergency obstetric and paediatric care.
12
2. Community education about maternal and infant health and danger signs is imperative.
3. Hospital protocols for assessment and treatment of women and infants must be reviewed and current standards must be implemented.
4. All facilities must be adequately supplied with essential medicines and supplies to promote maternal and infant health.
5. Sensitivity training for hospital staff working with mothers and infants should be explored and communication with families needs to be enhanced.
6. Given that Nevirapine is successful in reducing the transmission of HIV to newborns, it is essential that the PMTCT programme functions well and is monitored effectively.
7. HIV and AIDS services need to be expanded, integrated and comprehensive.
8. Cooperation and communication with families and communities needs to be enhanced.
13
NO WONDER WE ARE STRUGGLING! CHANGING BURDEN OF DISEASE IN THE ATTERIDGEVILLE COMMUNITY OVER A DECADE
MZ Shaik, G Mantel, L Pistorius, RC PattinsonMRC Unit for Maternal and Infant Health Care Strategies, Kalafong Hospital and University of Pretoria
AimTo compare the pattern of disease between 1996 and 2005 in pregnant women from the Atteridgeville community. Atteridgeville is an urban, historically disadvantaged community situated west of Pretoria. Kalafong Hospital is the only delivery site for this population and provides primary, secondary and tertiary care for pregnant women.
MethodIn 1996, the month of May was selected by computer randomisation. All Atteridgeville residents giving birth in May were identified by the computer database. Records were retrieved from medical archives and classified as needing primary, secondary or tertiary care. Levels of care were defined by guidelines published in the Perinatal Education Programme. The same process was repeated for May 2005 to enable comparison.
ResultsMay 1996 May 2005
Total 157 230Excluded 5 26Analysed 152 204
* 46.5% increase in births
DemographicsMay 1996 May 2005 P
N % N %Age
<18 9 6 16 8 NS>35 14 9 19 9
Parity0 44 29 73 36 <0.02
>4 11 7 2 1Antenatal care
Attended 139 91 200 98 <0.01
14
1. Age – no significant change.2. Parity – trends towards lower parity.3. Antenatal care – 44% increase in actual number of women
attending ANC.
Highest Level of Care
Level of careMay 1996 May 2005
N % NN %Primary 57 33 66 32Secondary 81 56 90 44Tertiary 16 11 48 24
1. 16% increase in number of women classified PRIMARY.2. 11% increase in number of women classified SECONDARY.3. 200% increase in number of women classified TERTIARY.
Graph 1 Comparison of highest level of care required: Number of women
Trend towards the right
15
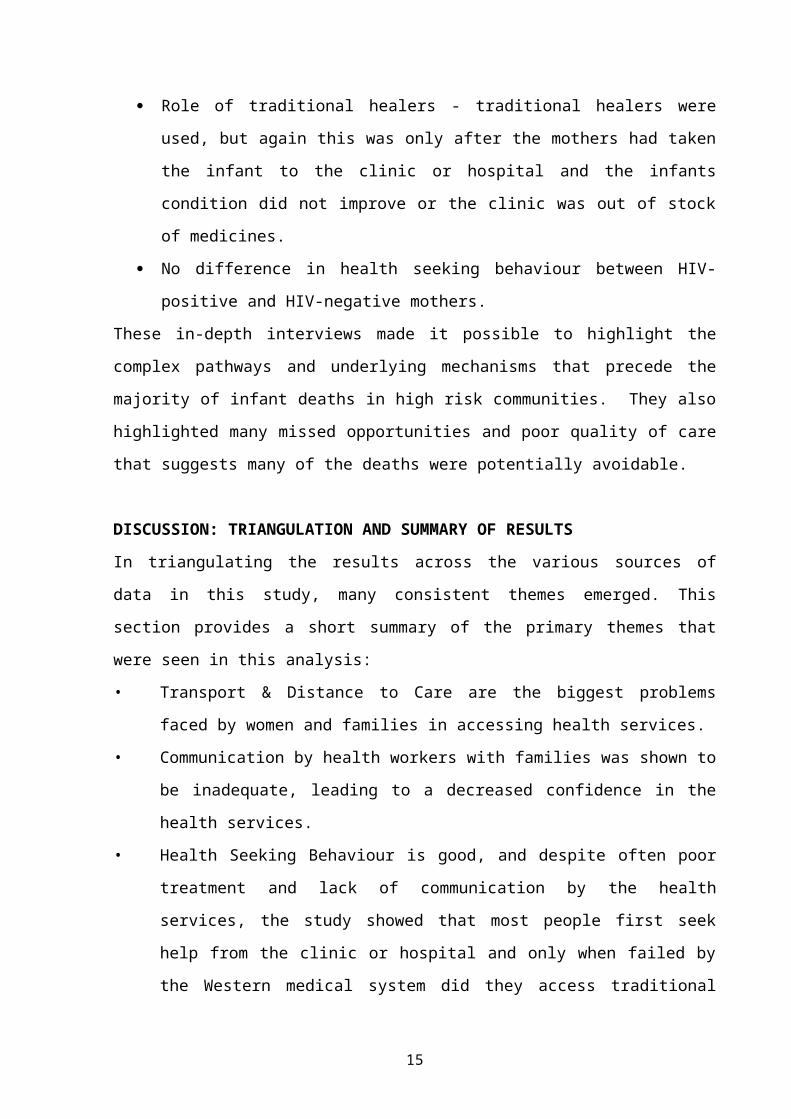
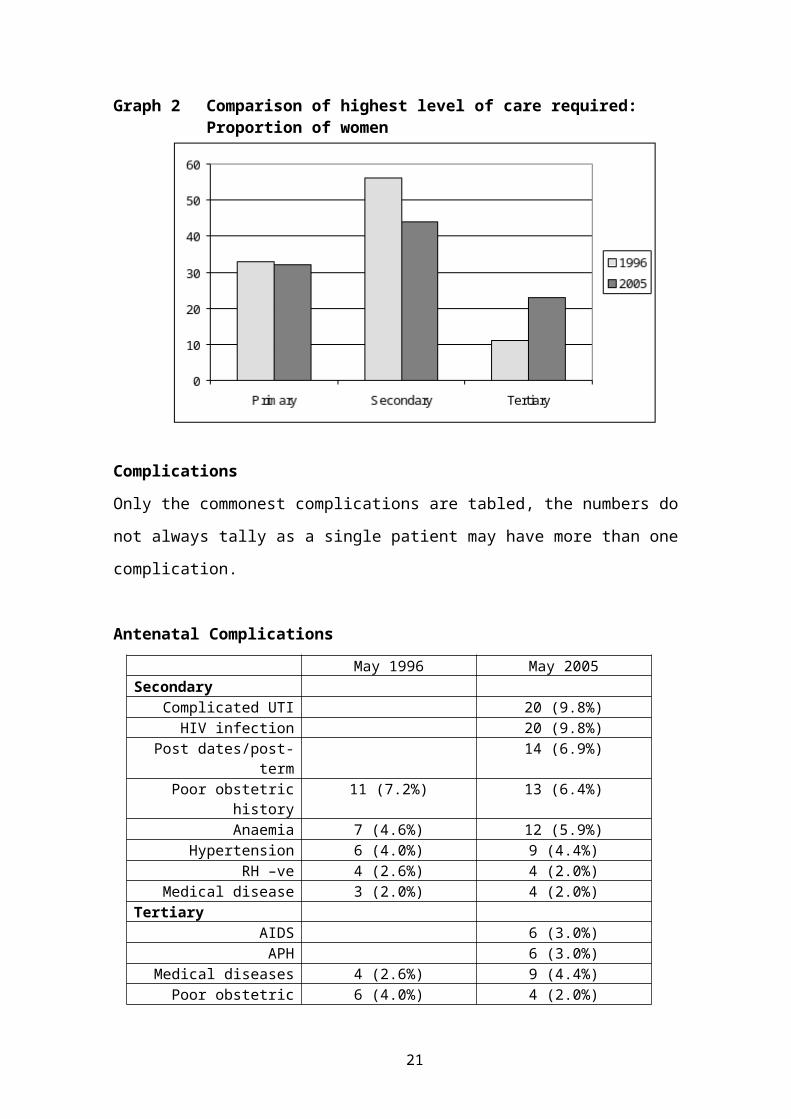
Graph 2 Comparison of highest level of care required: Proportion of women
ComplicationsOnly the commonest complications are tabled, the numbers do not always tally as a single patient may have more than one complication.
Antenatal ComplicationsMay 1996 May 2005
SecondaryComplicated UTI 20 (9.8%)
HIV infection 20 (9.8%)Post dates/post-term 14 (6.9%)Poor obstetric history 11 (7.2%) 13 (6.4%)
1. In terms of complications, we are still seeing relatively the same proportions, with an increase in actual numbers.
2. We see the emergence of a new category of patient, the HIV-infected group, a category that did not feature in 1996. There is no comparative data for this category in the previous study as there was no active screening for the disease, and the disease was thought to have a low prevalence.
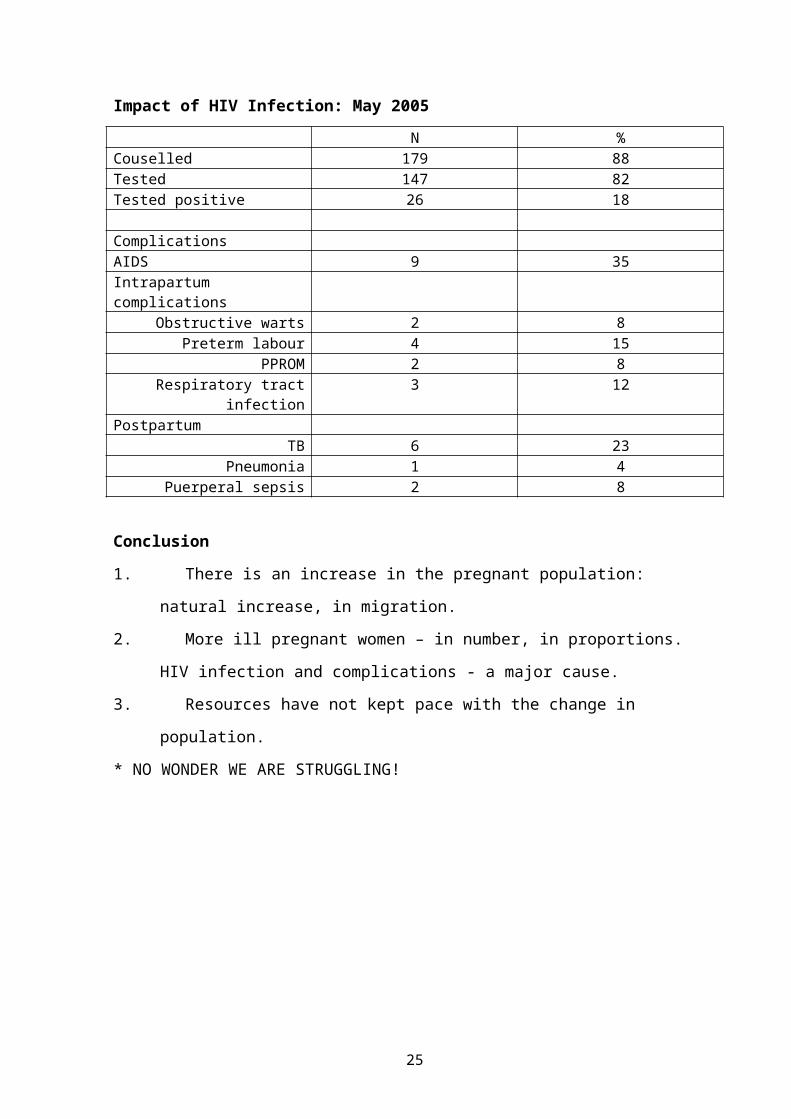
Conclusion1. There is an increase in the pregnant population: natural increase,
in migration.2. More ill pregnant women – in number, in proportions. HIV
infection and complications - a major cause.3. Resources have not kept pace with the change in population.* NO WONDER WE ARE STRUGGLING!
18
POSTPARTUM HAEMORRHAGE AUDIT
M Mabenge, HA LombaardKalafong Hospital, Department Obstetrics and Gynaecology, University of Pretoria
Aim:To determine what percentage of deliveries are complicated by postpartum haemorrhage. The study also aimed to evaluate hoe many of patients with postpartum haemorrhage had induction of labour. The study also aimed to determine how successful conservative surgical procedures were to prevent hysterectomy.
Method:From the 1st of February 2005 until 30th of November 2005 all women who had a post-partum haemorrhage and who delivered in Kalafong Hospital were enrolled in the study. Data were collected at the daily audit meetings. Postpartum haemorrhage was defined as a bleeding after delivery that was so severe that the attending physician felt the need to intervene.
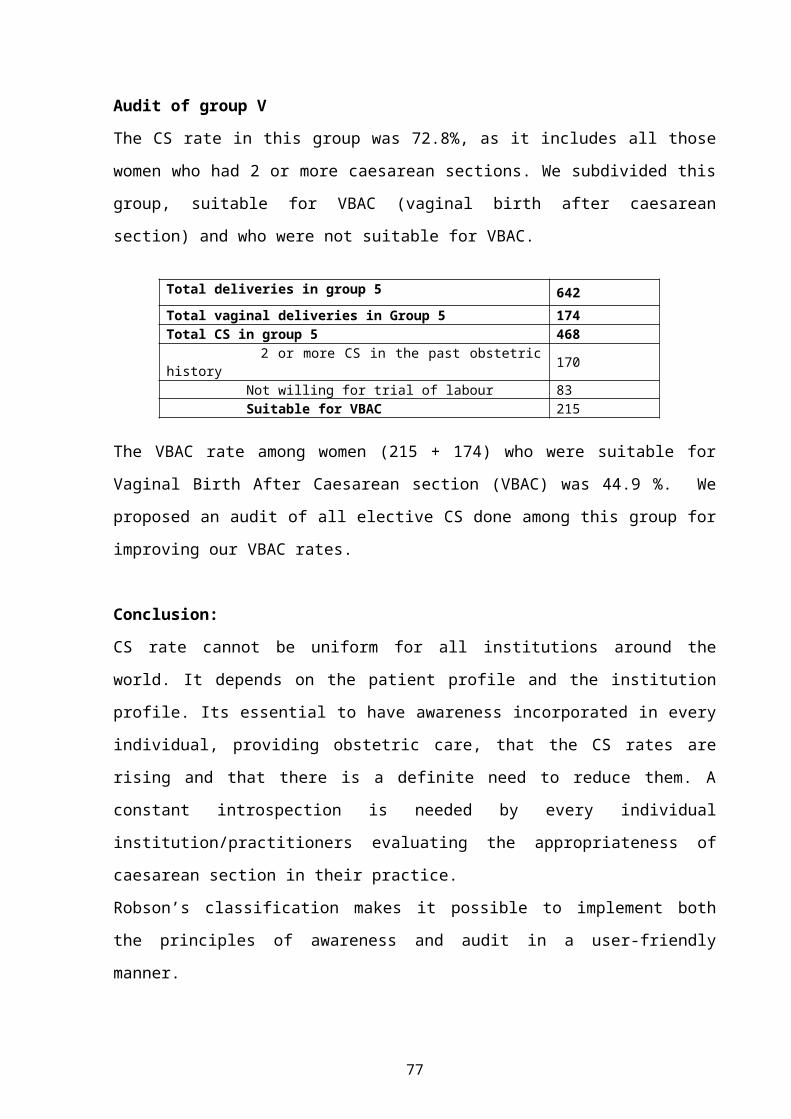
Results:During this period, there were 462 women who qualified. That is 8.6% of the total deliveries. Women who had a postpartum bleeding after a normal vaginal delivery made up 70% of the postpartum bleeding and women who had a postpartum bleeding after caesarean section made up 30%. This included women who had an induction of labour. In total, 76 (16%) of women who had postpartum bleeding, had induction of labour. Out of the total of 950 inductions, 8% of women had postpartum bleeding. In this group of women, 24 (32%) of them required surgical intervention to control the bleeding and 7 women (9%) had a hysterectomy. If only the group of women who had an induction of labour were analysed 4.7% had a postpartum bleeding that required medical treatment, 2.5% had a postpartum bleeding that required conservative surgical treatment and 0.7% had a postpartum bleeding that required hysterectomy. Out of the total of 462 women with postpartum bleeding, 311 (67%) responded to medical treatment, 117 women (25%) required conservative surgical intervention and 34 women (7%) had hysterectomy to control the bleeding. As a percentage of the total number of deliveries 5.7% of women required medical treatment, 2.1% required conservative surgical treatment and 0,6% required hysterectomy.
Conclusion:The prevalence on postpartum haemorrhage in the Kalafong Hospital is 8.6%. In our practice, medical therapy remains the mainstay of treatment. Conservative surgical management is successful procedures in conserving future fertility. Induction of labour is not associated with an increased risk for postpartum bleeding.
19
CHIP: CHILDHOOD DEATHS ONE YEAR ON
CR Stephen, ME Patrick and Child PIP GroupMRC Maternal and Infant Health Care Strategies Research Unit, Department of Paediatrics, Pietermaritzburg Hospitals Complex
AimTo determine, in children admitted to hospital, the in-patient mortality rate, causes of death, and the occurrence of modifiable factors (MF’s) in the care of children who died, and to compare findings with data from the pilot study (Saving Children 2004: A Survey of Child Healthcare in South Africa).
SettingThe data was gathered using the Child Healthcare Problem Identification Programme (ChIP), a mortality-auditing tool which audits not only the causes and demographics of childhood deaths but also the quality of care received by children in our health system. ChIP is currently being used by 21 public hospitals in all 9 provinces of South Africa, but data analysed in this article came from 12 sites, mostly for the period January 2005 to June 2005.
Methods1. Identify all paediatric deaths in the participating hospitals.2. Ascertain primary and associated causes of death.3. Look for modifiable factors (i.e. instances of sub-optimal care or missed opportunities that adversely affected the outcome for a particular child).
Based on findings, describe the size and nature of the problem of paediatric in-patient deaths, and thereafter seek reasons, in order to suggest strategies for improvement.
20
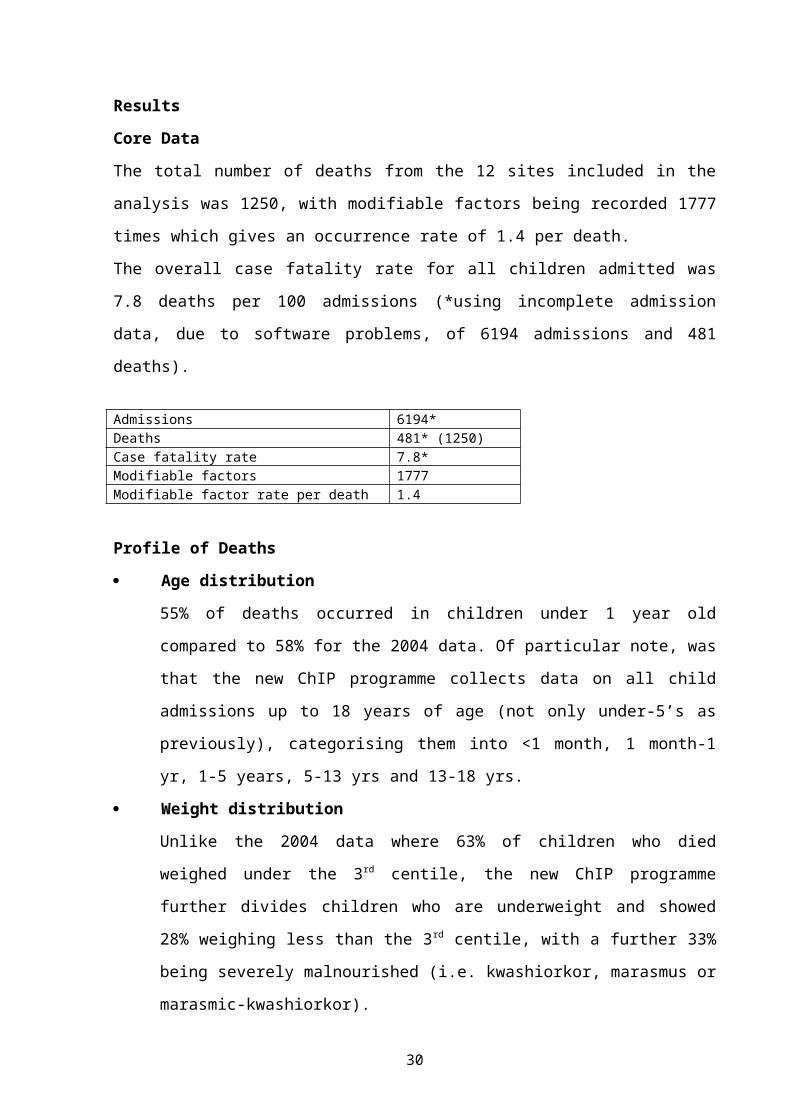
ResultsCore DataThe total number of deaths from the 12 sites included in the analysis was 1250, with modifiable factors being recorded 1777 times which gives an occurrence rate of 1.4 per death.The overall case fatality rate for all children admitted was 7.8 deaths per 100 admissions (*using incomplete admission data, due to software problems, of 6194 admissions and 481 deaths).
Admissions 6194*Deaths 481* (1250)Case fatality rate 7.8*Modifiable factors 1777Modifiable factor rate per death 1.4
Profile of Deaths Age distribution
55% of deaths occurred in children under 1 year old compared to 58% for the 2004 data. Of particular note, was that the new ChIP programme collects data on all child admissions up to 18 years of age (not only under-5’s as previously), categorising them into <1 month, 1 month-1 yr, 1-5 years, 5-13 yrs and 13-18 yrs.
Weight distributionUnlike the 2004 data where 63% of children who died weighed under the 3rd centile, the new ChIP programme further divides children who are underweight and showed 28% weighing less than the 3rd centile, with a further 33% being severely malnourished (i.e. kwashiorkor, marasmus or marasmic-kwashiorkor).
Parent’s wellbeingLooking at both the mother’s and father’s wellbeing, information about the mother remained unknown in 28% of cases (compared to 83% in 2004) whereas information about fathers remained poor (75% unknown in 2005 compared to 97% in 2004).
21
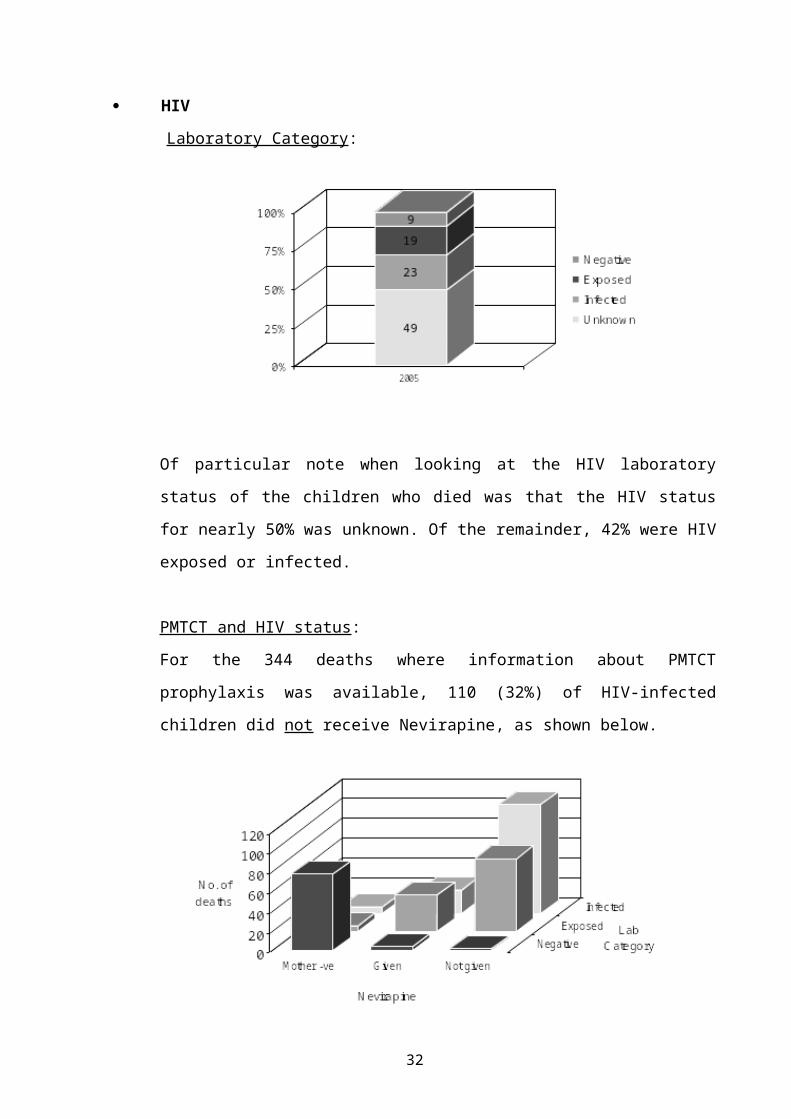
HIVLaboratory Category:
Of particular note when looking at the HIV laboratory status of the children who died was that the HIV status for nearly 50% was unknown. Of the remainder, 42% were HIV exposed or infected.
PMTCT and HIV status:For the 344 deaths where information about PMTCT prophylaxis was available, 110 (32%) of HIV-infected children did not receive Nevirapine, as shown below.
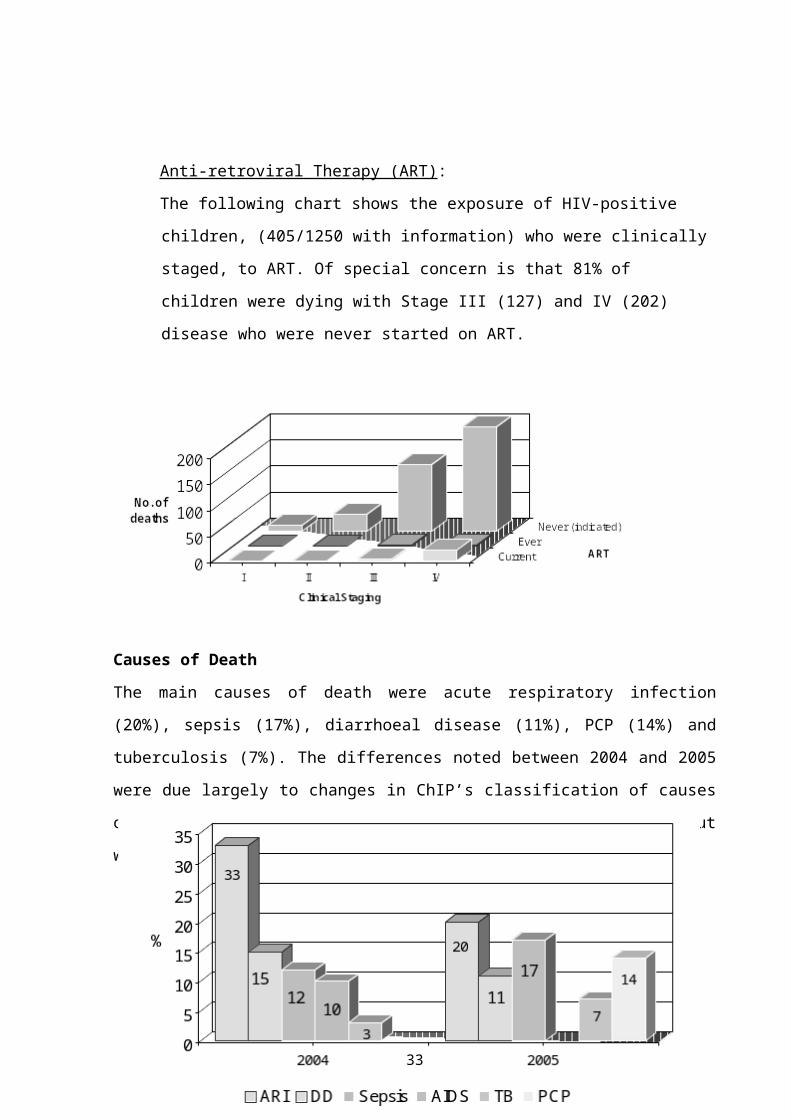
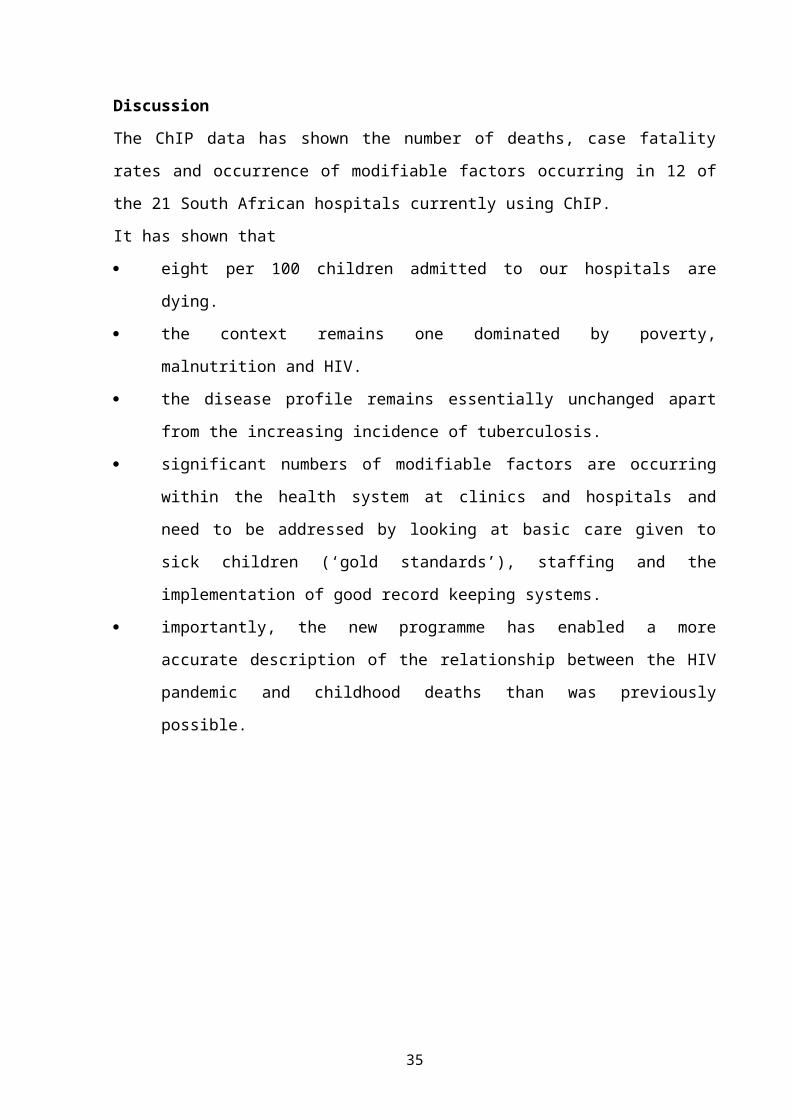
Anti-retroviral Therapy (ART):The following chart shows the exposure of HIV-positive children, (405/1250 with information) who were clinically staged, to ART. Of
22
special concern is that 81% of children were dying with Stage III (127) and IV (202) disease who were never started on ART.
Causes of DeathThe main causes of death were acute respiratory infection (20%), sepsis (17%), diarrhoeal disease (11%), PCP (14%) and tuberculosis (7%). The differences noted between 2004 and 2005 were due largely to changes in ChIP’s classification of causes of death, as previously PCP did not have its own code but would have been included as an acute respiratory infection.
Data looking at cotrimoxazole prophylaxis in children dying with PCP showed that only 20% were receiving prophylaxis whereas an alarming 77% were either not
23
receiving prophylaxis or that information was unknown.
Modifiable Factors (MF's) Quality of Records
Of those deaths with information about the quality of records, 50% were satisfactory, 33% had incomplete records and in 8% the files were missing.
By placeThe highest rates of place-related MF's were recorded in hospitals, with 39 per 100 deaths in the Wards, 48 in the Emergency section, 26 in Clinics and 18 at Home.
By personIn terms of person responsible, 91 MF's per 100 deaths were attributable to Clinical Personnel, 39 to Administrators and 21 to Caregivers.
DiscussionThe ChIP data has shown the number of deaths, case fatality rates and occurrence of modifiable factors occurring in 12 of the 21 South African hospitals currently using ChIP.It has shown that eight per 100 children admitted to our hospitals are dying. the context remains one dominated by poverty, malnutrition and
HIV. the disease profile remains essentially unchanged apart from the
increasing incidence of tuberculosis. significant numbers of modifiable factors are occurring within the
health system at clinics and hospitals and need to be addressed by looking at basic care given to sick children (‘gold standards’), staffing and the implementation of good record keeping systems.
importantly, the new programme has enabled a more accurate description of the relationship between the HIV pandemic and childhood deaths than was previously possible.
24
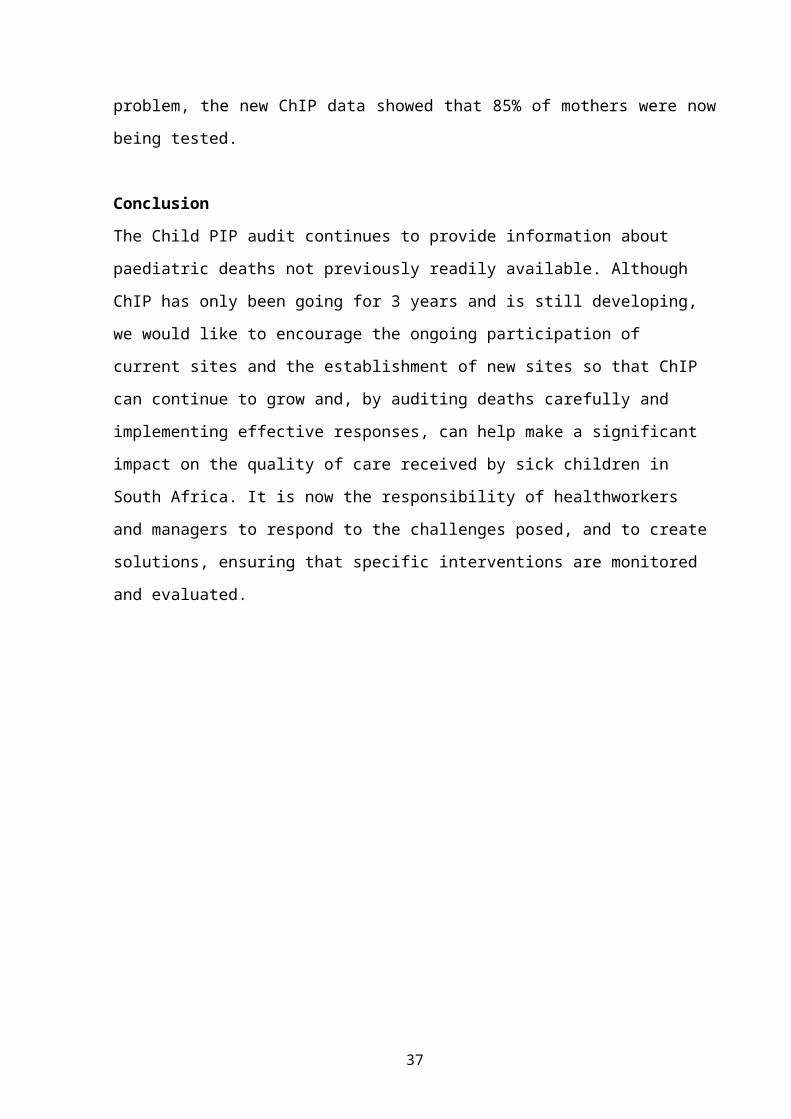
ChIP encourages healthworkers to further quantify and elucidate the problems associated with the process of caring for sick children and it provides an opportunity for prioritising and designing interventions, using the audit loop model as shown below:
ChIP Audit Cycle
An exciting example of this was described at Witbank Hospital where ChIP data showed that nearly 89% of the children dying in hospital were either HIV exposed or infected, 44% of the deaths were due to PCP and 71% of mothers were not receiving nevirapine. On further review of counselling practice, it was found that, due to poor understanding on the part of both counsellors and mothers (only opt-in, group counselling was offered), only 15% of mothers were agreeing to be tested. After some months of working hard at improving counselling (individual, opt-out testing being encouraged), having used the ChIP data to illustrate the nature and severity of the problem, the new ChIP data showed that 85% of mothers were now being tested.
ConclusionThe Child PIP audit continues to provide information about paediatric deaths not previously readily available. Although ChIP has only been going for 3 years and is still developing, we would like to encourage the ongoing
Identify andCharacterise the deaths
Attribute causes of death and
find modifiable factors
Analyse the size and nature of the
problem
Develop solutions
Implement plans
Evaluate implementatio
n
25
participation of current sites and the establishment of new sites so that ChIP can continue to grow and, by auditing deaths carefully and implementing effective responses, can help make a significant impact on the quality of care received by sick children in South Africa. It is now the responsibility of healthworkers and managers to respond to the challenges posed, and to create solutions, ensuring that specific interventions are monitored and evaluated.
26
TYING UP LOOSE ENDS: A RESPONSE TO THE CHALLENGES OF PPIP AND CHIP*§Mark Patrick, *§Cindy Stephen, *Neil McKerrow, *Graham Ducasse*Greys Hospital, Pietermaritzburg, and §Child PIP Exco
BackgroundIn South Africa three death audits concerning maternal and child health are in widespread practice:
The National Confidential Enquiry into Maternal Deaths (NCCEMD). The Perinatal Problem Identification Programme (PPIP). The Child Healthcare Problem Identification Programme (Child PIP).
Although called mortality audits, these are really quality of care audits using mortality as the entry point for looking closely at the processes of caring for people in the health system. The three audits have generated a large amount of information regarding the quality of care in the South African health system. Using this information to devise solutions to problems identified, and then implementing them, is a challenge.
This paper is the story about how the Department of Paediatrics in Pietermaritzburg has taken up this challenge.
The ProcessThe first part of the process was to revisit the recommendations arising out of early CEMD, PPIP and Child PIP reports. The recommendations from all three audit tools fall into four broad categories:1. Access, infrastructure and staffing needs for sick children2. The need for strong and capable maternal and child health teams3. Efficient and thorough record keeping systems.4. Basic gold standards of care.
Having recognised these, a theoretical response identifies the core areas for action as:1. Determining infrastructural norms and standards.
27
2. Defining norms for staffing, and supporting development.3. Devising a record keeping system.4. Developing clinical guidelines and asserting them as “gold
standards”.5. Encouraging the ongoing use of the established monitoring and
evaluation tools CEMD, PPIP and Child PIP, which become the key audit tools for quality improvement.
The district health system is the central transformative framework which delivers on the principle: “equal access for all people to all levels of care”. Within this framework, efficient movement of patients through the system must be complemented by the movement of knowledge, personnel and skills up and down the system to ensure that quality of care in the entire system is improved.
Therefore in Pietermaritzburg, the starting point of a response was to: clarify the Department of Paediatrics’ responsibilities as being to all
children in the entire catchment area, i.e. the “Area 2” health region of KwaZulu Natal, which contains 3.5 million people (1.3 million children), and 22 district hospitals and 130 clinics.
create tools that arise out of recognising and understanding the audit recommendations.
use the tools throughout “Area 2”.
InfrastructureNorms for neonatal and paediatric care for buildings, equipment and staffing have been generated. These norms become a tool for consultant paediatricians visiting district hospitals and for staff working in the hospitals themselves.
StaffingStaff development and support is a major emphasis in the outreach programme, but specific activities which are nearing implementation have
28
also been developed. For example, the Neonatal Experiential Learning Site project has a defined structure and materials, and a post has been approved for a full-time nurse to co-ordinate the site programme in Pietermaritzburg as well as to conduct follow-up visits to support the improvement of neonatal services in district hospitals. Also, for developing resuscitation capacity in Area 2, a “Red Box” (fully equipped resuscitation toolbox) has been put together and funding obtained for rolling out this programme into all hospitals as part of resuscitation training activities.
Record KeepingA comprehensive set of paediatric and neonatal forms has been assembled. Key aspects are standardisation and ease and appropriateness of use. The forms themselves are backed up by specific instructions for implementation within hospitals, and they are independently usable through simple copying and ordering systems.
GuidelinesA set of clinical guidelines has been developed, based on priorities identified by Child PIP and PPIP. Importantly, they are child-centred, guiding how children should be managed, no matter where or by whom, in the health system.
M&EOngoing monitoring and evaluation is through the ongoing use of Child PIP and PPIP.
Putting the Package TogetherThese tools have been compiled in a “Child Health Resource Package”, which is in electronic (compact disc) and hard copy format. The compact disc is web-based and easy to navigate.
The ‘hard copy’ is a box containing:
29
the CD and a file containing printed versions of all the guidelines and forms, and the IMCI Chart Booklet.
PPIP manual, data capture pads & laminated code sheets. Child PIP instructions, data capture pads and laminated code sheets. Saving Children 2004 publication. Neonatal Drug Doses booklet.
ImplementationImplementation involved two stages. The first was to deliver the package to all district hospitals by way of district office workshops (in Ladysmith, Dundee, Newcastle, Ixopo, and Montebello) with managers and clinical personnel from all hospitals in each district present. The workshops were both an opportunity to deliver the package, and to declare responsibility to the region. The second stage was the incorporation of the package into the Outreach Programme as the tool for quality improvement in the catchment area. Visits to district hospitals are structured around the five package components, remembering that quality of care and staff development and support are both part of all the outreach activities. It is not possible to implement everything at once, so incremental implementation will be encouraged over some years.
The package already contains document and quality improvement audit tools, but there is a need to develop additional tools for assessing infrastructure and staffing development. By reviewing the implementation of the package, we aim to critically examine whether or not we are contributing to improving the quality of care that children receive, and the experience of health workers looking after them.
ConclusionIt is too early to tell whether there has been any impact on the quality of care that children receive, or on the experience of health workers in Area 2 of KwaZulu Natal. But the Department of Paediatrics in Pietermaritzburg
30
now has an emerging model for integrating various quality improvement components and processes in perinatal and child health. It is hoped this process will enable the generation of cycles of active and ongoing problem identification and solving.
31
THE RELATIONSHIP BETWEEN STAFFING OF LABOUR WARDS AND DEATHS DUE TO INTRAPARTUM ASPHYXIA
RC Pattinson, R PrinslooMRC Maternal and Infant Health Care Strategies Research Unit and Obstetrics and Gynaecology Department, University of Pretoria
AimTo investigate the relationship between the number of staff per delivery per day and the deaths due to intrapartum asphyxia.
MethodA postal survey was conducted of the PPIP sites requesting details of the staffing of their labour wards. The deliveries per site and the intrapartum asphyxia deaths were taken from the hospitals’ PPIP data. The number of midwives per delivery per day and the rate of deaths due to intrapartum asphyxia were calculated per institution. A correlation was sought using Pearson’s Test.
ResultsThere were 49 sites which replied and where PPIP data was available.
32
Relationship between number of deliveries and deaths due to IPA
0.00
2.00
4.00
6.00
8.00
10.00
12.00
14.00
16.00
0 2000 4000 6000 8000 10000 12000
Number births per year
IPA
deat
hs/1
000
birt
hs
There was no significant correlation between staff and deaths due to intrapartum asphyxia.
Relationship between staff and IPA deaths
0.00
2.00
4.00
6.00
8.00
10.00
12.00
14.00
16.00
0.00 2.00 4.00 6.00 8.00 10.00 12.00
No. staff/del/day
IPA
dea
ths/
1000
del
.
Pearson’s Correlation r= –0.001, p=0.993
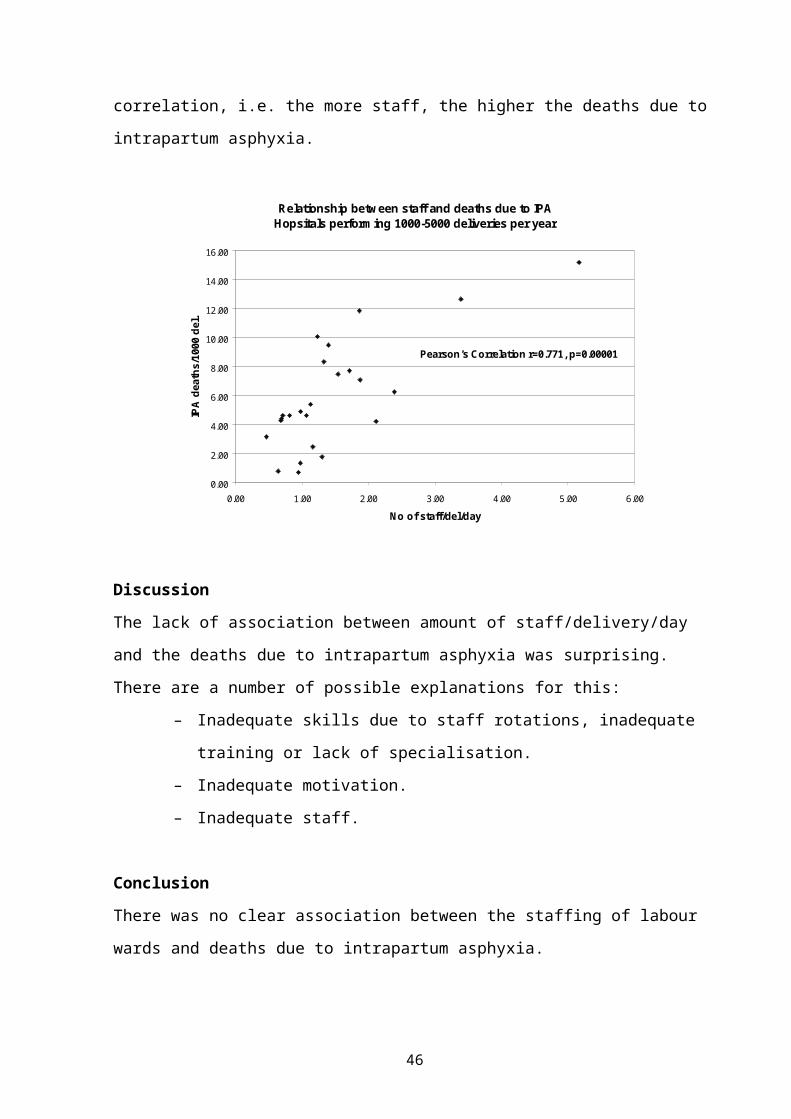
The only significant association was with hospitals between 1000-4999 deliveries. This surprisingly has a positive correlation, i.e. the more staff, the higher the deaths due to intrapartum asphyxia.
33
Relationship between staff and deaths due to IPA Hopsitals performing 1000-5000 deliveries per year
0.00
2.00
4.00
6.00
8.00
10.00
12.00
14.00
16.00
0.00 1.00 2.00 3.00 4.00 5.00 6.00
No of staff/del/day
IPA
dea
ths/
1000
del
.
Pearson’s Correlation r=0.771, p=0.00001
DiscussionThe lack of association between amount of staff/delivery/day and the deaths due to intrapartum asphyxia was surprising. There are a number of possible explanations for this:
– Inadequate skills due to staff rotations, inadequate training or lack of specialisation.
– Inadequate motivation.– Inadequate staff.
ConclusionThere was no clear association between the staffing of labour wards and deaths due to intrapartum asphyxia.
34
AN ANALYSIS OF THE IMPLEMENTATION OF THE 10 RECOMMENDATIONS OF THE SAVING MOTHERS 2 REPORT IN THE ETHEKWINI HEALTH DISTRICT OF KZN
G Bartlett
BackgroundA maternal death is a tragedy to the family and in the community, especially if it was preventable. The Saving Mothers 2 report (1999 – 2001) made 10 recommendations, which, if implemented in the short term, would result in a decrease in the number of maternal deaths. Indicators were identified and a target date of Dec 2004 was set.
MethodsA questionnaire was designed to assess the extent to which these recommendations had been implemented. The target area was the eThekwini Health District of KZN.
Results126 questionaires were distributed in the eThekwini Health District. 103 questionaires were returned and analysed. Results relating to each recommendation were set out as tables, with comments, which were applicable in each case.
ConclusionsBy the deadline, 9 of the recommendations had not been met completely, according to the indicator. The only recommendation to reach the target was #8 – the percentage of hospitals which do Caesarean Sections using regional anaesthesia.
35
A CRITICAL REVIEW OF MATERNAL MORTALITY IN SOUTH AFRICA COMPARED WITH THE FORCEFIELD OF NURSING OF THE WHO
JM DippenaarSenior Lecturer Nursing ScienceMedunsa. University of Limpopo
IntroductionHistorical perspectivesSweden was the first country to develop a national policy, which favored midwives deliveries coupled with quality and standards of care in the 19-century. At the beginning of the 20th century, Sweden had the lowest MMR in Europe. Presently Sweden is one of the countries with the lowest maternal mortality in the world (1: 6000) with most of the deliveries performed by midwives. Sweden is also the country with a 100% baby-friendly accreditation. It took the United Kingdom 30 years till 1930 to improve their MMR to be on par with Sweden during those days. In comparison, in the USA, the MMR in 1930 was 700 vrs the 480/100,000 for the UK.The United Kingdom instituted the Confidential Enquiry into maternal deaths to obtain information in order to improve the quality of maternity services and this approach assisted with scientific evidence develop effective strategies to reduce maternal mortality. Valuable information, for example, scientific evidence with regard to aspects like amniotic embolism was made available through the confidential enquiry that impacted policy and quality of care.In South Africa, prior to 1995 maternal deaths were estimated, lacking structured and formal systems for evaluation. Academic centers kept records and statistics with regard but no central database existed. The WHO estimated in 1995 that the maternal mortality for South Africa was 571/100,000 (1 in 70). After 1995 the NCCEMD (National Committee on the Confidential Enquiry into Maternal Deaths) into maternal deaths in South Africa was instituted by Health Department within the New South African Democratic Government. Two reports have been generated since then 1998 and 2001. The third report is awaited in 2006. It is accepted
36
that both reports are not a 100% true reflection of maternal deaths due to under-reporting from the private sector (representative of 18–30% of the births) and some provinces, yet information gathered proved invaluable for the planning of care and gave a much better picture than the estimated WHO report for South Africa. Against the WHO estimated the maternal deaths were 175/100,000. The only benchmark that South Africa has is with the United Kingdom that has a 50 year history of confidential enquiries and a maternal mortality ratio of 12,2/100,000 live births.
Maternal mortality
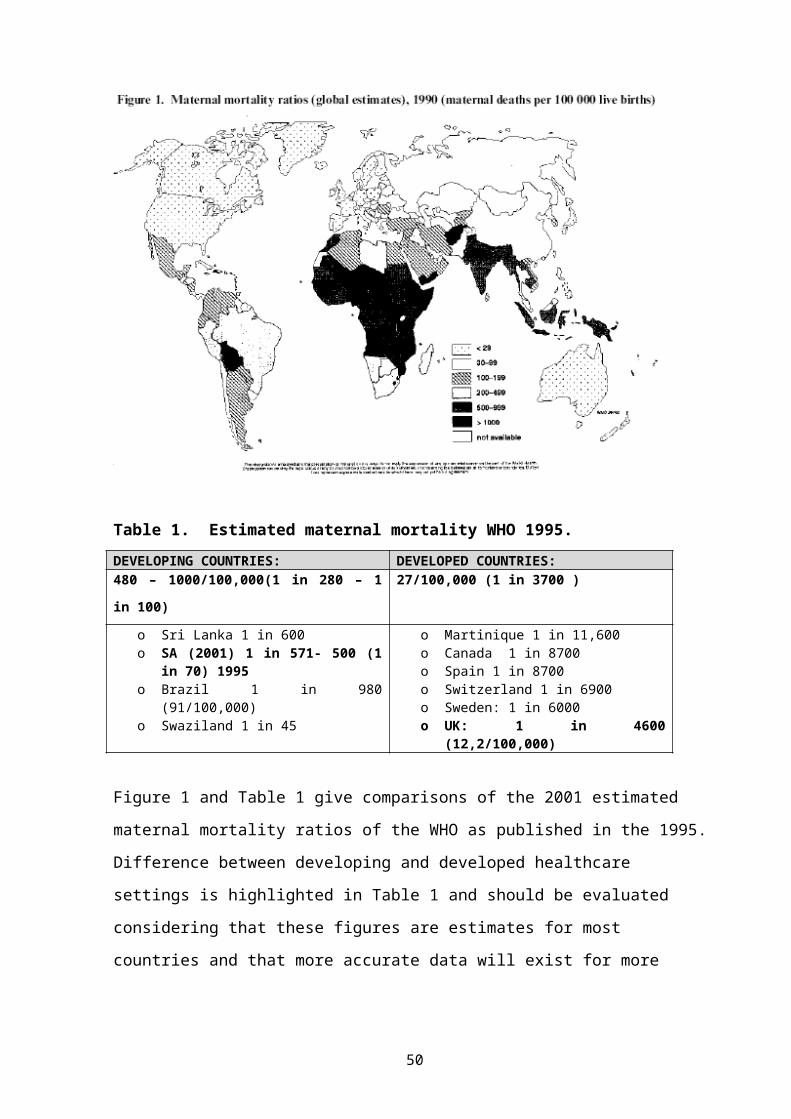
Table 1. Estimated maternal mortality WHO 1995.DEVELOPING COUNTRIES: DEVELOPED COUNTRIES:480 – 1000/100,000(1 in 280 – 1 in 100)
27/100,000 (1 in 3700 )
o Sri Lanka 1 in 600o SA (2001) 1 in 571- 500 (1 in
70) 1995o Brazil 1 in 980 (91/100,000)o Swaziland 1 in 45
o Martinique 1 in 11,600o Canada 1 in 8700o Spain 1 in 8700o Switzerland 1 in 6900o Sweden: 1 in 6000o UK: 1 in 4600 (12,2/100,000)
37
Figure 1 and Table 1 give comparisons of the 2001 estimated maternal mortality ratios of the WHO as published in the 1995. Difference between developing and developed healthcare settings is highlighted in Table 1 and should be evaluated considering that these figures are estimates for most countries and that more accurate data will exist for more sophisticated healthcare systems that use the confidential enquire into maternal deaths such as SA and the UK.
Reasons for maternal deathMedical reasons for maternal deaths are universally similar. Hemorrhage is still word-wide the number one reason for maternal deaths with the highest incidence during the puerperium.Analysis of the South African Confidential reports reveals AIDS/HIV to be responsible for 31,4% of the deaths followed by hypertension as the 2nd
most important cause 20,7%. In terms of global trends where hemorrhage is the most important cause of maternal deaths, the appearance of PIH in South Africa as the 2nd most important cause of maternal deaths after HIV/AIDS should receive attention.
Analysis of Factors of Importance in South AfricaThe force field of nursing of the WHO 1996 indicates all the factors that influence nursing/midwifery (Figure 2). Healthcare systems and human resources are amongst the factors. These are considered in the analysis of the maternal mortality reports for SA since norms and standard for staffing and equipment as factors were also identified as an important factor influencing maternal mortality and are still unresolved.
The South African Demographic Survey 1998 revealed that:o 84% women in SA receive medical assistance from either a doctor or
a midwife in SA during pregnancy and labor.o Only 30% of women receive assistance from a doctor.o 95% of women attend 5 antenatal visits in SA
38
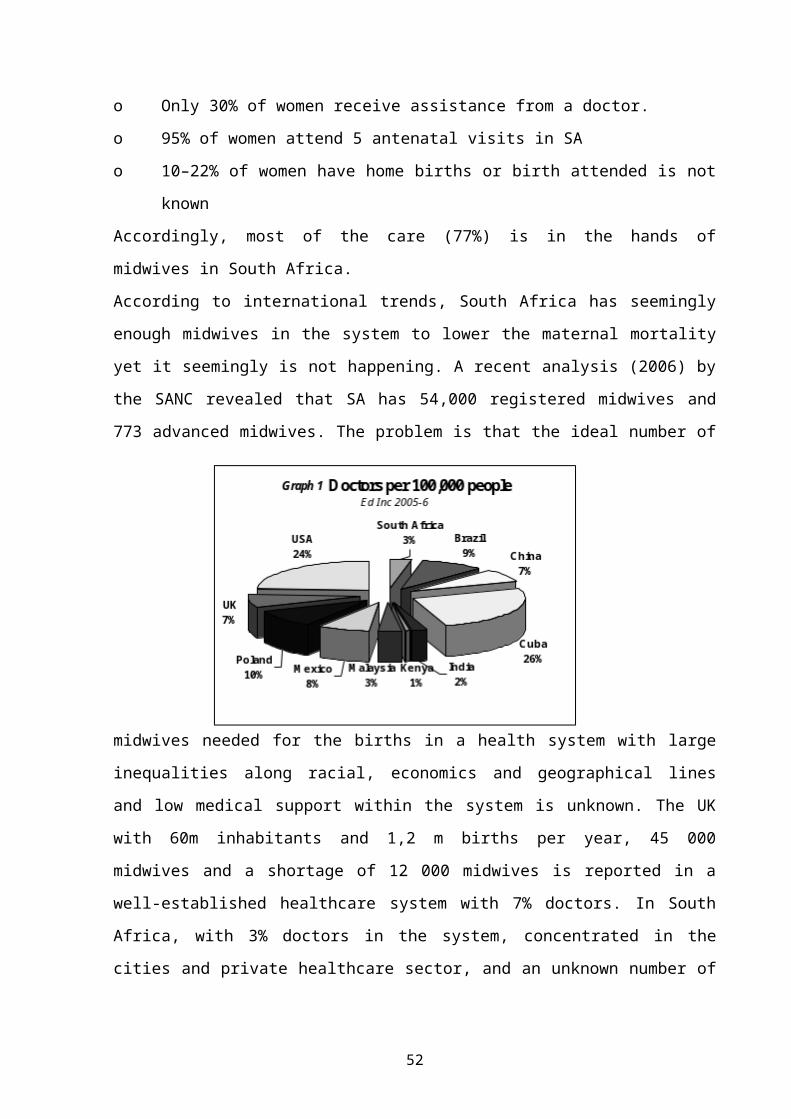
o 10–22% of women have home births or birth attended is not knownAccordingly, most of the care (77%) is in the hands of midwives in South Africa.According to international trends, South Africa has seemingly enough midwives in the system to lower the maternal mortality yet it seemingly is not happening. A recent analysis (2006) by the SANC revealed that SA has 54,000 registered midwives and 773 advanced midwives. The problem is that the ideal number of midwives needed for the births in a health system with large inequalities along racial, economics and geographical lines and
low medical support within the system is unknown. The UK with 60m inhabitants and 1,2 m births per year, 45 000 midwives and a shortage of 12 000 midwives is reported in a well-established healthcare system with 7% doctors. In South Africa, with 3% doctors in the system, concentrated in the cities and private healthcare sector, and an unknown number of midwives that are “hands on” the norms for safe staffing to reduce maternal mortality effectively may not be realized.Safe staffing is the theme for the International Council for Nurses for 2006. But staffing norms for general nurses cannot be compared with the norms for midwives. Skilled attendance has become the term that is associated with safe staffing in midwifery.ICOWHI (International confederation of women’s Health Issues, 2004) define “skilled attendance “as the presence of a professional with lifesaving skills, the well resources environment supported by political will
39
as the evidence based factor to reduce maternal mortality”. This has been clearly demonstrated in Sri Lanka where the maternal mortality was reduced from 1,500 in 1940 to 95/100,000 in 1980 (35 per year). The interventions included:The expansion of health facilities around the country accompanied by improved midwifery and family planning skills and the attendance of 85% of births by skilled midwives (1980).According to the MMR reports in South Africa (1998 & 2001), the one recommendation that lacks criteria for improvement is staffing and equipment norms. In spite of the fact that the “Human Resource Plan for SA” has been made public in 2006, the midwife as a unique caregiver is not identified in the plan. In the last 10 years the midwife was not identified as a caregiver in any of the research documents for healthcare workers in SA and reference is made to nurses only. This leaves the services with a dilemma that directly impacts on maternal mortality.Analysis and comparison between provinces further shows that provinces with better ratios of staff and more specialized maternity units (MOU’s) have better outcomes in maternal mortality. These ratios do not differentiate between nurses and midwives nor do they reflect the ideal skill mix that includes the doctor. (It also does not consider other factors like the poverty levels and other contributing factors (Graph 2).
Table 2 Ratio nurse per population (all categories in SA)
2004 POPULATION/ NURSE
(SANC)
2001 MMR 100,000(Saving mothers
report)
MOU,S(Hospital yearbook
2002)
WESTERN CAPE 190:1 63 9GAUTENG 195:1 148 7
FREE STATE 238:1 217 ?NORTHERN CAPE 246:1 168 ?
KWA ZULU 261:1 144 NOT publishedNORTH WEST 311:1 304 ?
EASTERN CAPE 323:1 NO FIGURES ?LIMPOPO 414:1 67(UNDER REPORT) ?
MPUMALANGA 417:1 292 ?
40
Graph 2 Editors Inc 2005 – 2006
SummaryThe WHO, ICOWHI and the maternal mortality reports 1998 & 2001, all identify staffing and equipment norms as important in the quality of care and reduction of maternal mortality. The Human Resource Plan (2006) acknowledges the need for a comprehensive database in order to plan effectively for the needs of the South African Healthcare system. Lessons can be learned from other healthcare systems in this regard, for example, Brazil with a maternal mortality of 1:980 (91/100,000).In 1998, the Brazilian Governmental made a decree 2181/98 as an ethical commitment to reduce maternal mortality with very clear targets. The Health Ministry funds this program. All stakeholders have to sign compliance to the decree. The Universities are involved through training programmes and midwives are represented at the highest levels of decision-making. The plan includes:
The establishments of midwifery units with “humanized” maternity care to deal with all low risk births.
The goal that 10% of all births will take place in these units.
41
Formation and qualification of 1600 obstetric nurses, 600 midwives and 100 daulas by 2006.
The minister demanded that qualified educators do the training. Training and formation is by internship. The centers establish and develop local realities and change the
realityBy 2004, the maternal mortality in these units were on par with Europe. South Africa is challenged by this example. There are an estimated 18 MOU’s in SA but this is not represented in all the provinces. Although the number of midwives on the SANC register seems sufficient, it is unclear if there are enough to make the difference and whether the present form of training is meeting the needs in a system with 3% of doctors, causing the midwives to take responsibilities of pathologies that should be managed by medical practitioners. In summary, the study concludes that South Africa does not meet the criteria for skilled attendance and that consequently the maternal mortality is impacted negatively in spite of the fact the norms of 85% antenatal attendance of the WHO is realized according to the SADHS 1998 report as well as the 84% attendance of birth by skilled midwives or doctors.
42
BIRTH ASPHYXIA – WRESTLING WITH WORDS
Dave WoodsNeonatal Medicine, University of Cape Town
The phrase “birth asphyxia” has been used for over 50 years and continues to cause confusion in the minds of both clinicians and researchers. The main problem is that the concept of asphyxia varies widely between the paediatric and obstetric literature. Unfortunately there is still no agreement between the professions regarding the definition of birth asphyxia.
Asphyxia of the newborn infant, or neonatal asphyxia as it is usually called, has long been defined as failure to establish adequate, sustained respiration after birth. These are newborn infants, who have a delay in breathing spontaneously and require active resuscitation after delivery. This is an important clinical problem that calls for immediate attention as these infants are at high risk of both morbidity and mortality unless adequately resuscitated.
Virginia Apgar was an American anaesthetist who, in 1953, published her famous article on a clinical assessment at 1 minute after delivery aimed at identifying infants that needed respiratory support. Based on her finding, she recommended that a score below 7 was abnormal and was an indication for active resuscitation. Despite criticism, the Apgar score is still a very useful method of assessing an infant’s clinical condition at delivery and identifying the need for active resuscitation. It is interesting to note that newborn infants rarely score 10 at 1 minute as most have peripheral cyanosis.
In 1956, she published a second article where she described the usefulness of repeating the score at 5 minutes in infants who required resuscitation. She never advocated scoring all infants at 5 minutes as is practiced throughout South Africa today. Infants who do not need
43
resuscitation should not be removed from their mothers at 5 minutes to perform a routine Apgar score.
There are many causes of a low 1 minute Apgar score, including fetal hypoxia, maternal sedation or general anaesthesia, immaturity alone, respiratory distress including infection or hyaline membrane disease, excessive pharyngeal suctioning at birth, and an airway obstructed with blood or meconium. Therefore, fetal hypoxia is only one of many causes of an infant failing to breathe well at birth.
In an attempt to get a more accurate measure of the fetal condition at birth, the presence or absence of a metabolic acidosis in the newborn infant was explored. One of the earliest studies of umbilical cord gasses was conducted at Groote Schuur Hospital in Cape Town and later in Oxford by Paul Johnson and colleagues in 1982. They documented the Apgar scores and umbilical artery base deficit in over 1000 consecutive deliveries. Based on the distribution of their results, they used a base deficit of greater than 12 as a measure of metabolic acidosis reflecting significant fetal hypoxia before delivery.
What they found was that only 21% of infants with a 1 minute Apgar score below 7 had a base deficit higher than 12. Therefore, most infants who required resuscitation had no biochemical evidence of fetal hypoxia at birth. These infants presumably had one of the other causes of respiratory depression such as maternal analgesia or general anaesthesia. Of even greater interest was that only 27% of infants with a umbilical artery base deficit above 12 had a 1 minute Apgar score below 7. Therefore many infants who have suffered significant intrapartum hypoxia are still able to initiate respiration spontaneously after delivery. Of interest, these infants can usually be identified at birth by the astute clinician as they are pale due to intense peripheral vasoconstriction.
44
From this and many later studies it can be concluded that the Apgar score is useful in identifying infants who require resuscitation but it is not an accurate predictor of infants who have suffered significant fetal hypoxia. The Apgar score, therefore, remains a valuable assessment tool if used for the purpose for which it was designed.
While the paediatricians were anxious about infants not breathing well at birth, their obstetric and midwifery colleagues were concerned about fetuses, who appeared to be tolerating labour poorly. For many years, it had been recognised that a fetus who passes meconium before delivery or has delayed heart rate decelerations is at increased risk of intrapartum stillbirth or early neonatal death. This syndrome of fetal distress was presumably caused by hypoxia.
Fetal heart rate monitoring and a better understanding of the cardiovascular responses of the fetus to the insult of hypoxia have resulted in a more aggressive approach to identifying and managing the fetus who is apparently in danger during labour.
The research techniques of pulse oximetry of the fetal scalp and intermittent umbilical vessel sampling have confirmed that the stimulus for the clinical signs of fetal distress is indeed hypoxia. This is usually secondary to decreased uteroplacental blood flow rather than primary placental pathology. Therefore, the term placental insufficiency is a misnomer as the problem usually lies further up the vascular supply line, causing placental underperfusion and infarcts. In many cases, reduced maternal blood flow in healthy placentas is related to inadequate relaxation between contractions in women with a prolonged first stage of labour.
The clinical problem for the obstetrician or midwife is that many infants showing features of fetal distress appear normal at birth and have no noticeable adverse sequelae. In other words, there is a disappointingly
45
high false positive rate. These fetuses are apparently being stressed and are making appropriate physiological adaptations, such as a bradycardia to protect the heart, and arterial shunting away from visceral organs to protect the brain. However, they are still compensating adequately, do not have a significant metabolic acidosis and are not distressed yet. A non-reassuring fetal heart rate tracing may, therefore, reflect fetal stress without necessarily implying fetal distress. However, many of these infants still need urgent delivery before they become distressed.
It appears that cerebral ischaemia, rather than hypoxia alone in the fetus, is damaging. It is also apparent that some fetuses are more easily damaged than others. This may relate to genetic factors or fetal conditions during pregnancy, such as fetal undernutrition, resulting in low energy stores needed for compensatory anaerobic metabolism.
Markers of fetal decompensation such as reduced beat-to-beat variability, a fixed bradycardia or low scalp pH are better signatures of significant myocardial hypoxia leading to cerebral underperfusion. Only in these circumstances would it be appropriate to speak of fetal distress. The limitation of measuring fetal scalp pH during labour due to the HIV epidemic has made the distinction between fetal stress and distress difficult at times.
Unfortunately the term fetal asphyxia or intrapartum asphyxia has long been used to describe both the stressed and distressed fetus. While this may appear to simply be a semantic problem, which helps to give medicolegal protection to obstetricians and paediatricians in the first world, it diverts attention away from the real problem, namely fetal hypoxia and acidosis.
To make matters even worse, the descriptions of birth asphyxia and peripartum asphyxia include fetuses showing signs of stress as well as newborn infants who fail to breathe spontaneously. The incorrect
46
implication is that all these individuals have suffered potentially dangerous hypoxia. Therefore it is not surprising that most infants labelled with birth asphyxia usually grow up normally. This confusion over terminology often makes the literature incomprehensible and research results undecipherable.
A number of professional bodies, such as the American College of Obstetrics and Gynecology, have argued that the term asphyxia should be dropped altogether and be replaced by a clear description of what is being observed. Unfortunately, labelling all late decelerations as signs of fetal asphyxia or recording all infants with respiratory depression at birth as neonatal asphyxia is still practiced today and is not clinically helpful.
The urgency of finding a solution to the identification of the fetus and newborn infant with significant hypoxia has been highlighted by recent research on infants who develop a transient encephalopathy during the first days of life. Initially called hypoxic-ischaemic encephalopathy, the clinical syndrome is now referred to as neonatal encephalopathy, once other obvious causes such as meningitis and congenital malformations have been excluded. These infants have abnormalities of tone, feeding, level of consciousness and reflexes while some also have convulsions.
Neither signs of fetal distress, nor an abnormal base deficit at birth, nor a low Apgar score reliably predict the occurrence of neonatal encephalopathy. This is not surprising as they should all be regarded as warning signs rather than proof of hypoxia severe enough to cause organ damage. These warning signs merely indicate the need for urgent management decisions such as fetal resuscitation, immediate delivery or active neonatal resuscitation. Therefore, all these high risk infants must be carefully observed for signs of encephalopathy during the first 6 hours of life.
47
A number of first world studies have suggested that this syndrome of neonatal encephalopathy (NE) is caused by undefined problems during pregnancy rather than hypoxia during labour. However the clinical, biochemical, cerebral ultrasound and augmented EEG (AEEG) findings have always strongly suggested that intrapartum hypoxia was the main cause of NE in both developed and poor countries.
Infants with NE in South Africa are typically well grown at birth without signs of intrauterine infection, undernutrition, congenital malformations or any other intrauterine insult other than hypoxia.
In a prospective study over 18 months in 1988, David Power showed that 2/3 of neonatal deaths at the Cecilia Makiwane hospital in the Eastern Cape were associated with intrapartum hypoxia. He defined hypoxia at birth as a base deficit greater than 11 plus either signs of fetal distress or a 5 minute Apgar score below 7.
The Perinatal Problem Identification Programme (PPIP) has also identified intrapartum hypoxia as the commonest cause of fresh stillbirth and early neonatal death in term infants in South Africa.
Power further showed in a review of 211 Ciskeian children with cerebral palsy that a clear history of intrapartum hypoxia was present in 2/3 of term infants who developed spastic quadriplegia. The cause of cerebral palsy in infants who do not have documented NE remains controversial. However, their clinical findings are the same as those in children with a clear history of fetal hypoxia, suggesting that an episode of severe hypoxia has occurred at some time.
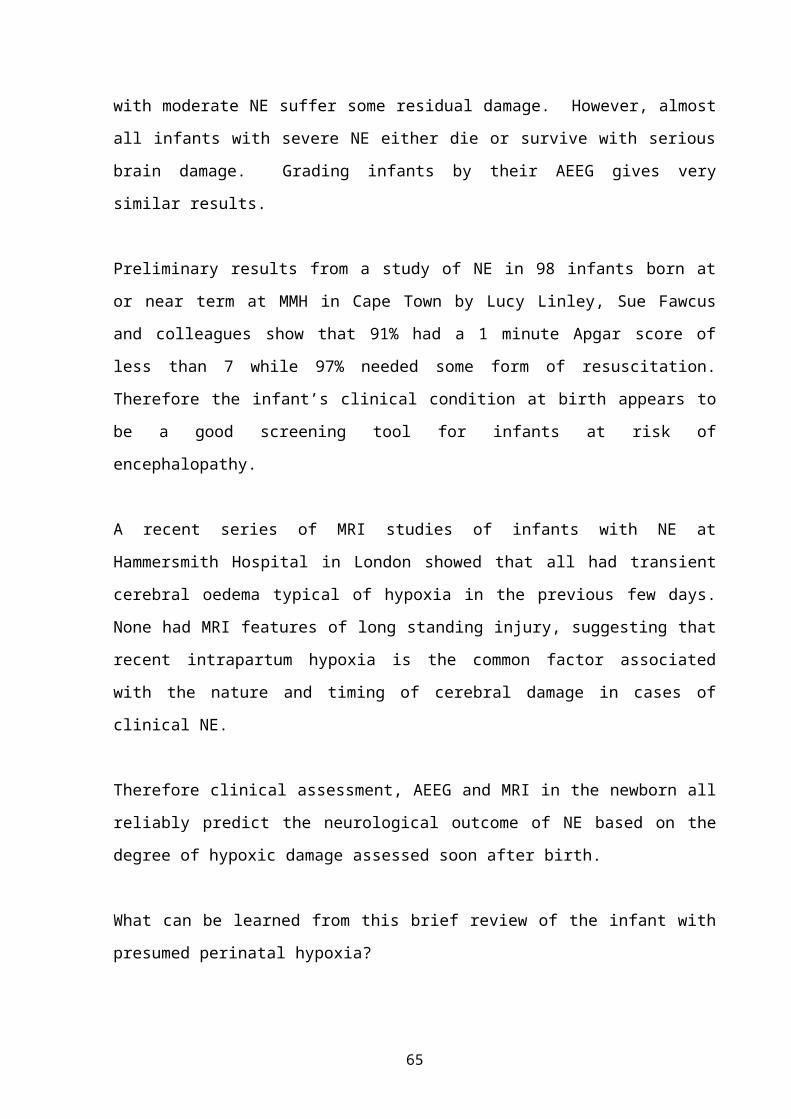
NE can be clinically divided into three grades. Almost all infants with mild NE recover completely while most infants with moderate NE suffer some residual damage. However, almost all infants with severe NE either die or
48
survive with serious brain damage. Grading infants by their AEEG gives very similar results.
Preliminary results from a study of NE in 98 infants born at or near term at MMH in Cape Town by Lucy Linley, Sue Fawcus and colleagues show that 91% had a 1 minute Apgar score of less than 7 while 97% needed some form of resuscitation. Therefore the infant’s clinical condition at birth appears to be a good screening tool for infants at risk of encephalopathy.
A recent series of MRI studies of infants with NE at Hammersmith Hospital in London showed that all had transient cerebral oedema typical of hypoxia in the previous few days. None had MRI features of long standing injury, suggesting that recent intrapartum hypoxia is the common factor associated with the nature and timing of cerebral damage in cases of clinical NE.
Therefore clinical assessment, AEEG and MRI in the newborn all reliably predict the neurological outcome of NE based on the degree of hypoxic damage assessed soon after birth.
What can be learned from this brief review of the infant with presumed perinatal hypoxia?
1. The important message is to that we need better descriptions rather than more definitions.
2. We should follow the call to stop using the word asphyxia in any context.
3. Infants with signs of fetal stress or distress, a low Apgar score or an increased base deficit at birth are at an increased risk of neonatal encephalopathy.
4. The severity of neonatal encephalopathy is a useful predictor of the neurological outcome.
49
Many questions remain unanswered and we in Southern Africa, are in an ideal position to conduct appropriate research to find the answers. For example, the challenge of finding appropriate methods of head cooling in infants at risk of encephalopathy in developing countries is begging to be investigated. Before we can do this however, we need to have a clear understanding of the terminology we use. Let us stop wrestling with words.
50
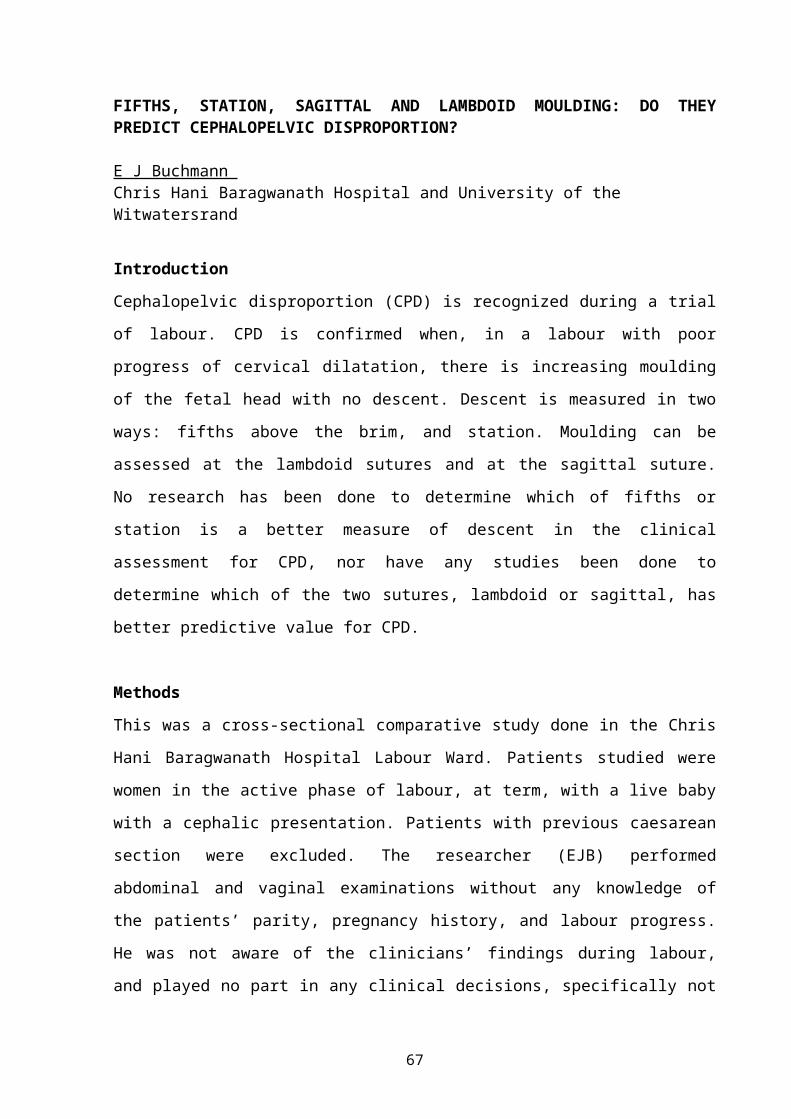
FIFTHS, STATION, SAGITTAL AND LAMBDOID MOULDING: DO THEY PREDICT CEPHALOPELVIC DISPROPORTION?
E J Buchmann Chris Hani Baragwanath Hospital and University of the Witwatersrand
IntroductionCephalopelvic disproportion (CPD) is recognized during a trial of labour. CPD is confirmed when, in a labour with poor progress of cervical dilatation, there is increasing moulding of the fetal head with no descent. Descent is measured in two ways: fifths above the brim, and station. Moulding can be assessed at the lambdoid sutures and at the sagittal suture. No research has been done to determine which of fifths or station is a better measure of descent in the clinical assessment for CPD, nor have any studies been done to determine which of the two sutures, lambdoid or sagittal, has better predictive value for CPD.
MethodsThis was a cross-sectional comparative study done in the Chris Hani Baragwanath Hospital Labour Ward. Patients studied were women in the active phase of labour, at term, with a live baby with a cephalic presentation. Patients with previous caesarean section were excluded. The researcher (EJB) performed abdominal and vaginal examinations without any knowledge of the patients’ parity, pregnancy history, and labour progress. He was not aware of the clinicians’ findings during labour, and played no part in any clinical decisions, specifically not in decisions on continuing with labour, augmenting labour, or ordering caesarean section for disproportion. The primary outcome measure was mode of delivery, with caesarean section for poor progress representative of CPD, and vaginal delivery confirming that there was no CPD. Patients who underwent caesarean sections for other causes (mainly fetal distress) had to be excluded from statistical analysis. Stepwise logistic regression was done to identify independent predictors for CPD, and likelihood ratios were calculated for the different measures of head descent and moulding.
51
Statistical analysis was done using Epi-Info 6 and SAS 9 statistical software.
ResultsFive hundred and eight patients were examined, of which 24 had to be excluded from analysis because they had caesarean sections for reasons other than poor progress in labour. Of the 484 patients included in analysis, there were 350 with normal and 21 with assisted vaginal deliveries, and 113 (23%) who had caesarean section for poor progress in labour (classified as CPD). Of these 113 women, 81% had labour that crossed the 4-hour partogram action line, and 66% required oxytocin augmentation. A stepwise logistic regression model, which also included parity, gestation, height, maternal weight, birth weight, and HIV serostatus, showed that descent (measured by fifths and by station), and sagittal moulding, were significant independent predictors for CPD. Table 1 shows the proportion of labours with an unengaged fetal head (Three-fifths or higher and station zero or higher) according to whether there was CPD or not. The likelihood ratios for CPD, with 95% confidence intervals, were 1.25 (1.13-1.38) for a head three-fifths or higher, and 1.25 (1.13-1.37) for a head at station zero or higher. Table 2 shows the proportion of labours with grade 2 or more moulding in the sagittal and lambdoid sutures at the time of vaginal examination, according to whether there was CPD or not. The likelihood ratios for CPD, with 95% confidence intervals, were 2.94 (2.04-4.23) for sagittal moulding grade 2 or more, and 1.25 (1.06-1.47) for lambdoid moulding grade 2 or more.
Table 1 Proportion of labours with an unengaged fetal head (Three-fifths or higher and station zero or higher) at the time of vaginal examination according to whether there was CPD or not, showing also the number of patients in whom the level of head in fifths or the station could not be measured.
Descent No CPD (N=371) CPD (N=113) P valueThree-fifths or higher
69.4% 86.7% 0.0004Impossible to measure: 0.4%
Station zero or 72.0% 89.8% 0.0005
52
higher Impossible to measure: 10.3%
53
Table 2 Proportion of labours with grade 2 or more moulding in the sagittal and lambdoid sutures at the time of vaginal examination, according to whether there was CPD or not, showing also the number of patients in whom the degree of moulding could not be measured.
No CPD (N=371) CPD (N=113) P valueSagittal grade 2 or more
12.5% 36.6% <0.0001Impossible to measure: 0.6%
Lambdoid grade 2 or more
60.2% 75.0% 0.03Impossible to measure: 30.2%
ConclusionAssessment of station on vaginal examination performed no better than that of fifths on abdominal palpation, and did not add to information gained by assessing fifths of head above brim. Station could not be assessed in 10% of patients. Sagittal moulding is superior to lambdoid moulding in the prediction of CPD, not only in its predictive value, but also in ease of assessment.
54
ROBSON’S CLASSIFICATION OF CESAREAN SECTIONS: DOES IT HELP?
Aziz Nuzhat, Fernandez Evita,Fernandez Hospital Pvt. Ltd., Hyderabad, Andhra Pradesh, India
IntroductionRising caesarean section rates world over, are a major concern to both doctors and patients. However, it is becoming increasingly evident that there cannot be a uniform recommendation of an appropriate Caesarean Section (CS) rate. An ongoing internal audit is an integral part of monitoring CS rates in a given institute. In November 2003, CS rate in our institute rose to worrying rates of 50%. The 2 important questions we asked ourselves were: how do we reduce it and what should be our appropriate CSR? We started by analyzing our caesarean deliveries using various methods to classify, risk based, indications based, etc. However, we found that these groups did not lend themselves to broad recommendations for reducing the CS rate. Robson’s classification provided a simple internal audit system for individual institutes to identify clear well–defined patient groups rather than indications. This then facilitates identifying groups of women in whom CS rates can be reduced.
Material and methods:This was a prospective audit of all deliveries from January to December 2005 at Fernandez Hospital, Hyderabad, Andhra Pradesh, India. Our institute is a private, non-funded, tertiary perinatal unit with about 3500 deliveries a year. We are a group of 20 obstetricians working together as a team. The results of the audit were displayed on the notice board every month.
Robson’s groupsThree parameters are then calculated after classifying all deliveries. CS rate in each group: No. of CS in a group/No of deliveries in that group. Relative size of each group: No. of deliveries in a group/Total deliveries in
55
that specific time period. Contribution to the CSR: CS in a group/Total deliveries in that specific time period.
56
ResultsThe total number of deliveries in the year 2005 was 3256, out of which 1316 had caesarean sections. Overall CS rate was 40.4 %. All deliveries were then divided into 10 groups. The relative size, caesarean section rate of each group and the contribution made by each group to the overall CS rate was then calculated (Table 2).
Table 1
Robson’s Group
No of CS / total No of women in each group
Relative Size of groups (%)
CS Rate in each group (%)
Contribution made by each group to overallCSR of 40%
Group 1 Nulliparous, single, cephalic, 37 weeks in spontaneous labour Group 2 Nulliparous, single, cephalic, 37 weeks, induced labour or CS before
labourGroup 3 Multiparous, single, cephalic, 37 weeks in spontaneous labour (excluding
Prev. CS)Group 4 Multiparous, single, cephalic, 37 weeks, IOL or CS before labour (excluding
Prev. CS)Group 5 Previous CS, single, cephalic, 37 weeksGroup 6 All nulliparous breechGroup 7 All multiparous breech (including Prev. CS)Group 8 All multiple pregnancies (including Prev. CS)Group 9 All abnormal lies Group 10 All single, cephalic, 36 weeks, (including Prev CS)
Relative size of each groupAmong singleton, term and cephalic pregnancies (groups 1, 2, 3 & 4), the nulliparous women (Group 1 & 2) were a higher proportion than multiparous, Group 3 & 4 (41.2% vs. 25.2 %). Group 2 and Group 4 together (singleton, term, cephalic, no uterine scar with induced labours or CS before labour) comprised 28.4 % of all the deliveries.
57
Indicating the need to audit these two groups, and aim to reduce the size of these groups.Table 2
Group 5 (singleton, term, cephalic with a caesarean section in past obstetric history) accounted for 19.7 % of all deliveries, giving an idea that the institute was dealing with a higher proportion of women with history of one or more caesarean sections in their past obstetric history. Group 10 (singleton, cephalic, ≤ 36 weeks including previous CS) accounted for 7.5 % of all deliveries. This was higher due to referrals and in utero-transfers for the neonatal care of preterm babies.
CS rate in each groupThe CS rate in group 1 was 19% which was higher and needs to be reduced for these women were all with singleton pregnancies, term, cephalic in spontaneous labour.
Contribution to the overall CS rateThe two groups contributing maximum to the overall CS rate were group 2 and group 5. We did an audit of these two groups, sub dividing them further.
Robson’s Group
No of CS / total No of women in each group
Relative Size of groups (%)
CS Rate in each group (%)
Contribution made by each group to overallCSR of 40%
Group 2 was compared with Group 1 (having a similar profile but in spontaneous labour). The CS rate in induced labors was more than twice that of group 1 (19%).
59
Total deliveries in Group 2 657Total vaginal deliveries in Group 2 330Total No of Cesarean sections in Group 2
327
Prelabour CS 100 Induced labour CS 227CS rate in induced labors 40.7 %
The audit was further carried on to determine the indications for caesarean sections in both the groups.
Presumed fetal compromise was higher in induced labours when compared to spontaneous labour. Was this due to hyperstimulation? We changed our induction regime. Decreasing the dose of misoprostol from 50 µg 6th hourly to 25 µg 4th hourly and had an audit in place.
The largest contributor to the overall CS rate was group 5 (singleton, term, cephalic with history of caesarean section in their obstetric history)
Audit of group VThe CS rate in this group was 72.8%, as it includes all those women who had 2 or more caesarean sections. We subdivided this group, suitable for VBAC (vaginal birth after caesarean section) and who were not suitable for VBAC.
Total deliveries in group 5 642Total vaginal deliveries in Group 5 174Total CS in group 5 468 2 or more CS in the past obstetric history 170 Not willing for trial of labour 83 Suitable for VBAC 215
The VBAC rate among women (215 + 174) who were suitable for Vaginal Birth After Caesarean section (VBAC) was 44.9 %. We proposed an audit of all elective CS done among this group for improving our VBAC rates.
Conclusion:CS rate cannot be uniform for all institutions around the world. It depends on the patient profile and the institution profile. Its essential to have awareness incorporated in every individual, providing obstetric care, that the CS rates are rising and that there is a definite need to reduce them. A constant introspection is needed by every individual institution/practitioners evaluating the appropriateness of caesarean section in their practice. Robson’s classification makes it possible to implement both the principles of awareness and audit in a user-friendly manner.And as Micheal Robson said, the aim should not be to worry about whether the CS rate is too high or too low, it is important to analyse whether appropriate women are having caesarean sections and are they being done for appropriate reasons.The greatest advantage of Robson’s is that it helps us treat women as a whole and not indications. Through its patient-based classification it provides groups of women who are found all over the world ensuring uniformity of classification and it highlights the fundamental ethos of medicine and especially obstetrics that view women or patients need to be managed holistically. Except for minor drawbacks, it provides the user with individual clearly defined groups relevant to their hospitals/institutes where recommendations can be made for reducing caesarean sections.As a future direction we propose that the subdivisions in each group be standardized so that the groups can be compared across institutes.
61
USING THE ROBSON CLASSIFICATION SYSTEM OF CAESAREAN SECTIONS TO AUDIT CAESAREAN SECTION RATES AND IMPROVE CARE
E FarrellMRC Unit for Maternal and Infant Health Care StrategiesDept of Obstetrics and Gynaecology, Kalafong Hospital and University of Pretoria
BackgroundThe ideal classification system, especially in medicine, should be designed to be useful in fulfilling a specific purpose (i.e. in improving care). Main groups should be robust enough to be unlikely to need changes, to facilitate comparison with previously acquired data. The information needs to be useful, accurately collected, timely and available and categories should be mutually exclusive (in other words every patient should fit into only one group) and totally inclusive (there should be a group for each and every patient) and accurately defined, so that all clinicians will categorise individual patients exactly the same. It should also be simple to understand and implement.
The classification systems currently in use for caesarean sections (C/S) are either based on indication for C/S or on overall C/S rates.Those based on indication for C/S, are problematic in various ways:
1. The indications are not always clearly defined and categories not alwaysmutually exclusive.
2. The classification system is made totally inclusive by adding an “others” category, which does not add any additional information on
patients included in this category.
3. The above-mentioned factors make it difficult to identify “at risk” groupsprospectively and facilitate management changes.
Classification systems based on overall C/S rates:
62
1. Does not identify “at risk” groups prospectively and therefore does not facilitate management changes.
2. Does not take into account differences in obstetric populations.
The Robson Classification of C/Sections aims to identify prospective, clinically relevant groups of women in which there were differences in their C/S rates.It makes possible comparisons over time within one unit or between units, allowing for changes in management that may improve perinatal care.It is important that results should not be interpreted in isolation from other parameters of perinatal care, such as perinatal and maternal morbidity and mortality or maternal satisfaction.The classification consists of 10 well-defined sub-groups of women: mutually exclusive but totally inclusive, prospective and clinically relevant, simple to understand and organise.There are enough groups to give sufficient detail, without losing the advantage of an overview of C/S rates.Groups can be subdivided into smaller subgroups when including a heterogeneous population of patients, to get more accurate data and plan management of smaller groups of patients prospectively.
The 10 Robson Groups:1. Nulliparous women with a single cephalic pregnancy, at greater
than or equal to 37 weeks gestation in spontaneous labour.2. Nulliparous women with a single cephalic pregnancy, at greater than
or equal to 37 weeks gestation who either had labour induced or were delivered by Caesarean Section before labour.
3. Multiparous women, without a previous uterine scar, with a single cephalic pregnancy at greater than or equal to 37 weeks in spontaneous labour.
4. Multiparous women, without a previous uterine scar, with a single cephalic pregnancy at greater than or equal to 37 weeks who either
63
had labour induced or were delivered by Caesarean Section before labour.
5. All multiparous women, with at least one previous uterine scar and a single cephalic pregnancy at greater than or equal to 37 weeks gestation.
6. All nulliparous women with a single breech pregnancy.7. All multiparous women with a single breech pregnancy, including
women with previous uterine scars.8. All women with multiple pregnancies, including women with
previous uterine scars.9. All women with a single pregnancy with a transverse or oblique
lie, including women with previous uterine scars.10. All women with a single cephalic pregnancy at less than or equal
to 36 weeks gestation, including women with previous uterine scars.
MethodsWe have done an audit of the C/Sections done at Kalafong Hospital from March 2005 on the Atteridgeville population, which are non-referred patients delivering at Kalafong, and the patients delivering at the MOU of Pretoria West Hospital, which serves the same patient population, namely the South West Tshwane district, using the Robson classification system, and report on the rates of C/Sections in the 10 different groups. These results are compared to those of the National Maternity Hospital Dublin, as published in their clinical report for the year 2003.
ResultsThe results for March to December 2005 have shown proportional rates of C/Sections in the 10 Robson groups dramatically different from those reported by the National Maternity Hospital Dublin (see Table 1). In our unit, C/S rates are higher in almost every group of the classification system.
64
The major differences in C/Section rates occur in the groups where one would expect it the least i.e. in groups 1 and 3, the low-risk patients that present in spontaneous labour, with single cephalic presentations at term. Because these groups are also the largest, this has a major impact on the overall C/S rate and also impacts on the future size of group 5, the patients with previous C/S’s, where the rate of C/S’s is high, probably due to our inability to monitor these patients properly in labour and offer adequate pain relief for attempted VBAC.
ConclusionThe Robson Classification System has helped us to identify those groups of patients where C/S rates are unacceptably high.A sub-analysis of indications for C/S within the groups of patients presenting in spontaneous labour, with apparently low risk pregnancies, will identify where the specific problems lie. Daily review of partograms and cardiotocographs of patients that had C/S for poor progress of labour/CPD or fetal distress are currently being done and feedback given to clinicians managing the patients, in order to improve interpretation of both clinical findings and cardiotocograph traces.We believe that a close audit of how we monitor and manage labour may impact dramatically on the C/Section rates in these groups of patients.Specific attention needs to be given to the patients with 1 previous C/Section presenting in labour, because this group is forever increasing in numbers.
65
66
COMPLICATIONS ASSOCIATED WITH CAESAREAN SECTION DONE IN THE SECOND STAGE OF LABOUR
Cebekulu L, Buchman E J
ObjectivesTo determine maternal and neonatal complications associated with caesarean section done in the second stage of labor.
Introduction Caesarean section in the second stage of labour is associated with an increased risk of maternal morbidity, including major haemorrhage, uterine incision extension into the broad ligament and prolonged operating time. Difficult delivery of the fetus is often encountered due to a deeply impacted head in the pelvis. Accidental delivery through a vaginal incision during caesarean section in the second stage of labour has also been reported. This subject has not been extensively reviewed in the literature. Several studies have compared second stage caesarean section with instrumental vaginal delivery, but only one has compared maternal and perinatal morbidity associated with caesarean section in the second stage of labour to that of caesarean section in the first stage of labour. This study was done to evaluate maternal and neonatal morbidity associated with caesarean section in the second stage of labour.
MethodsThis was a cohort study comparing caesarean section in the second stage of labour with caesarean section performed for poor progress in the first stage of labour. The study population was women undergoing caesarean section in Chris Hani Baragwanath Maternity Hospital, a large referral centre performing over 20 000 deliveries, including about 5 400 caesarean sections and 200 instrumental vaginal deliveries each year. Inclusion criteria were singleton live pregnancies at 36 or more weeks of gestation with cephalic presentations. Women with previous caesarean sections were excluded.
67
The study was done from November 2004 to April 2005. Each day, the caesarean section register was examined for second stage caesarean sections done in the preceding 24 hours. The sample was not consecutive as data collection could only be done on days when the author (L.C.) was in the hospital. For each subject (case) identified, a suitable control was found by identifying the caesarean section for poor progress in the first stage of labour that occurred most previously to the second stage case. Both cases and controls had to comply with the stated inclusion and exclusion criteria. Data on the pregnancy, labour and intraoperative course were entered onto a data sheet, and all mothers and babies were followed up in the postnatal wards up to discharge from hospital. An attempt was made to contact all subjects by telephone two weeks after delivery, to identify any clinical problems that may have arisen after discharge. Informed consent for participation was obtained from all subjects, and conduct of the study was approved by the University of the Witwatersrand’s Human Research Ethics Committee.
The primary outcome measures were intraoperative difficulties, blood loss, operating time, postoperative sepsis, and major neonatal morbidity. Other outcome measures included duration of hospital stay for mother and baby, relaparotomy, readmission, maternal death and neonatal death. Statistical analysis was performed on Epi-Info 6 statistical software. Differences in outcome frequencies between the case and control patients were analysed using the Chi-squared test or, where appropriate, Fisher’s exact test. Comparisons of continuous and ordinal outcome data were performed using Student’s t-test or the Mann-Whitney test, whichever was appropriate. P values of less than 0.05 were accepted as indicating statistical significance
Results Thirty-nine women had caesarean sections in the second stage of labour, matched with an equal number of controls. The case and control groups
68
were similar in terms of age, parity, gestational age and HIV serostatus. The duration of the first stage of labour was similar in case and control groups, with a median of 10 hours (P=0.31), as was the duration of rupture of membranes, with a median of 8.5 hours for the cases and 12 hours for the controls (P=0.08). The median duration of the second stage in the case group was 135 minutes, with a range of 45 to 355 minutes. For this group, the median time interval from decision to do caesarean section to delivery of the baby was 70 minutes, with a range 10 to 245 minutes. Descent of the fetal head at the time the caesarean section was ordered was deeper in the case group (median station zero) than in the control group (median station minus one, P<0.001). Seven second-stage caesarean sections were done following unsuccessful attempts at instrumental vaginal delivery, six by ventouse and one by forceps.
At caesarean section, 38 women in the case group (97%) and all 39 women in the control group had transverse lower uterine segment incisions. An inverted T incision was required for delivery of one baby in the case group. In 12 of the cases (31%) and none of the controls, delivery of the fetal head was described as difficult by the surgeons (P<0.001). In 10 of the cases described as difficult, the surgeons needed a second assistant to push the head up from the vagina, and in two a reverse breech delivery was done to pull the impacted head out of the pelvis. Lower segment tears were noted in 12 of the cases (31%) and 5 (13%) of the controls (P=0.055). The median duration of caesarean section was 45 minutes (range 25-240) for second stage caesarean sections and 30 minutes (range 20-55) for the controls (P<0.001).
Ten women who had second stage caesarean sections (26%) had postoperative pyrexia of 38 degree Celsius or more, compared with 2 (5%) in the first stage controls (P=0.012). There were three patients with wound sepsis (infected disrupted wounds) in each group. The median hospital stay was 2 days in both the case and control groups. One patient in the case group had a hysterectomy for uncontrollable haemorrhage and two
69
required intensive care unit admission. One patient died after caesarean section due to intraoperative haemorrhage requiring massive blood transfusion, and developed fatal pulmonary oedema.
Neonatal morbidity was greater following second-stage caesarean section. Five-minute Apgar scores below 7 were found in 7 infants after second-stage caesarean section, and in none of the controls (P<0.001). Seventeen babies (44%) required admission to the neonatal unit, compared to 3 (8%) of the controls (P<0.001). There were 8 babies with hypoxic ischaemic encephalopathy from the case group and one from the controls (P=0.03). Four of these infants had grade 3 encephalopathy, all following second-stage caesarean section. Subaponeurotic haemorrhage was found in 6 of the infants from the case group, none of whom had failed instrumental deliveries. One infant sustained a dislocated elbow during extraction of an impacted head at second-stage caesarean section. There were two neonatal deaths, both related to severe encephalopathy following second-stage caesarean sections. These findings are shown in table 1. Table 1 Comparison of neonatal outcomes following caesarean
section in the second stage of labour (cases) with those following caesarean section for poor progress in the first stage of labour (controls)
Cases (n=39)
Controls (n=39)
P value
Mean birth weight in g (±SD)Apgar score <7 at 1 minuteApgar score <7 at 5 minutesAdmission to neonatal unitHypoxic ischaemic encephalopathy Grade 1 Grade 2 Grade 3Subaponeurotic haemorrhageTraumaSepsisMeconium aspirationTransient tachypnoeaDeath
ConclusionThis study has shown high rates of maternal and neonatal morbidity associated with caesarean section in the second stage of labour. Intra-operative difficulties were frequent, with almost one-third of deliveries complicated by an impacted fetal head. Blood loss was greater than in the first stage controls, with a trend to more blood transfusions, and one associated maternal death. Neonatal morbidity was significant with second stage caesarean section, with almost half of the infants requiring neonatal unit admission and over one fifth developing hypoxic ischaemic encephalopathy. Subaponeurotic haemorrhage was frequent and, surprisingly, not associated with failed instrumental delivery. Intrapartum fetal hypoxia was therefore the most common and serious complication associated with second stage caesarean section. The strong uterine contractions in the second stage of labour are known to reduce fetal blood oxygen saturation, and this would have been aggravated by the long intervals from onset of the second stage to delivery
When caesarean section is to be done for prolonged second stage of labour, this must be considered as extremely urgent. Once the infant has been delivered, intensive neonatal resuscitation may be needed, as suggested by the high number of babies with low Apgar scores in this study. A doctor or nurse fully proficient in neonatal resuscitation, with all necessary equipment, must be in attendance at a second stage caesarean section.
This study has limitations related to sample size and the ability to generalize from these findings. It was not sufficiently powered to assess the effect of second stage caesarean section on serious adverse outcomes, such as emergency hysterectomy, maternal intensive care unit admission, or perinatal death. The findings of poor neonatal outcome may well be related to the time interval between onset of second stage and
71
delivery at caesarean section, rather than the operation itself. Such long time intervals may be frequent in poorly resourced or overcrowded settings, and these results can probably be generalized to similar environments. Doctors and midwives working in such settings need to be aware of the maternal and neonatal hazards associated with caesarean section in the second stage of labour
72
MISOPROSTOL IN THE THIRD STAGE OF LABOUR AND MATERNAL MORTALITY: A SYSTEMATIC REVIEW
G Justus Hofmeyr, *A Metin GülmezogluEffective Care Research Unit, University of the Witwatersrand/University of Fort Hare/East London Hospital Complex, South Africa* UNDP/UNFPA/WHO/World Bank Special Programme of Research, Development and Research Training in Human Reproduction (HRP), World Health Organization, Geneva, Switzerland
Introduction
The use of misoprostol for the prevention and treatment of postpartum haemorrhage has received considerable attention. A recent trial reported in the BMJ evoked several reponses, including the suggestion that the single maternal death in the misoprostol group be regarded as an adverse event potentially related to misoprostol use, and a call for a trial of misoprostol for treatment of postpartum haemorrhage with maternal death as the primary endpoint.
Trials of misoprostol in various doses and via various routes for the prevention of postpartum haemorrhage have shown misoprostol to be less effective than conventional injectable uterotonics, and the results of placebo comparisons have been inconclusive. The main side-effects reported have been shivering and pyrexia, which have been dose-dependent. Misoprostol has been widely recommended for the prevention of postpartum haemorrhage when other methods are not available, and large-scale implementation is currently in progress.
Apart from its uterotonic effects, misoprostol has known pharmacologic effects on several organ systems. It is plausible that a drug with ubiquitous pharmacologic effects might have unexpected adverse effects when used in the third stage of labour.
For the above reasons, we have reviewed maternal mortality in randomised trials of misoprostol used in the third stage of labour.
73
Objectives
To compare the rates of maternal mortality reported in randomized trials of misoprostol use in the third stage of labour
Methods
Literature search
The Cochrane Controlled Trials Register and the electronic data-base Pubmed/ Medline were searched on the word ‘misoprostol’.
All randomised comparisons of misoprostol used for the prevention or treatment of postpartum haemorrhage, with placebo or alternative methods (usually injectable uterotonics) were included in the review.
Data on maternal deaths were extracted and entered onto the Revman software package (Update Software, Oxford, UK). We have included only those trials in which the presence or absence of maternal deaths was explicit, or has been confirmed by communication with trial authors.
Sub-group analysis was performed according to whether misoprostol was used prophylactically or to treat postpartum haemorrhage. Whether it was compared with placebo (P) or other uterotonics (U) is indicated in the table.
Differences were expressed as relative risks, with 95% confidence intervals.
Results:
Of 10 deaths reported in 9 trials (23 181 women), 8 occurred in women receiving misoprostol (relative risk 2.7, 95% confidence interval 0.8 to 9). In 28 trials, no mention of maternal deaths was made.
Discussion
74
The primary motivation for the use of misoprostol in the third stage of labour is to reduce maternal mortality. Because mortality is such a rare outcome, no trials to date have been designed to assess the effect on mortality. However, the occurrence of several deaths in trials in women receiving misoprostol has raised concern.
The limitations of this review must be emphasised. Firstly, the numbers are small with wide confidence limits, and are consistent, at the 95% confidence level, with anything between a modest reduction and a large increase in maternal mortality with misoprostol. Secondly, this was a post-hoc analysis in response to an observed clustering of maternal deaths, and the statistical calculations need to be interpreted with circumspection.
These results should not be construed as evidence of an adverse effect of misoprostol on maternal mortality. On the basis of the results we propose, for further investigation, the hypothesis that misoprostol may have an, as yet, unexplained adverse effect on maternal homoeostatic functions in the third stage of labour.
In view of the fact that side-effects of misoprostol such as pyrexia and shivering are dose-related, we suggest that research be undertaken to establish the smallest effective dosage of misoprostol.
Conclusions
Because of the enormous potential benefits of an effective, orally active third stage uterotonic, and the likelihood that misoprostol will be used on a large scale worldwide, further research is essential to measure the possible beneficial and harmful effects of misoprostol more accurately.
75
Table 1. Maternal deaths reported in randomized trials of misoprostol compared with placebo (P) or other uterotonics (U) for the prevention or treatment of postpartum haemorrhage.
76
EXPLORING MIDWIFE AND CONSUMER VIEWS ON SOCIAL SUPPORT DURING CHILDBIRTH IN THE PENINSULA MATERNAL AND NEONATAL SERVICE
C Lisske, P Garner. Liverpool School of Tropical medicine, UKS Fawcus. Mowbray Maternity Hospital, University of Cape Town.
IntroductionSocial support in labour is a key component of the Better Births initiative introduced into the Peninsula Maternal and Neonatal service (PMNS) in 2002. Despite clear evidence of benefit, there has been varied implementation of childbirth companions at Mowbray Maternity Hospital (MMH) and the satellite midwife obstetric units (MOUs). Childbirth companions include personal companions (partners, relatives, friends) and Doulas (lay support personnel provided by the service).
Aims and Objectives1. To assess the utilization of companionship during childbirth in 3
Obstetric units.2. To explore the midwife’s perception and experiences regarding birth
companions; To identify constraints & barriers.3. To explore women’s perceptions and experiences regarding a
support person during childbirth; To identify women’s preferences.
Subjects & MethodsThree obstetric units were chosen for investigation:Mowbray Maternity Hospital is a secondary referral hospital which employs doulas.Guguletu MOU and Hanover Park are both primary level Midwife Obstetric Units, the former composed of mainly Xhosa women and the latter including many muslim and coloured women
Study DesignA quantitative and qualitative research methodology was used:
77
Summary Of MethodsOBJECTIVES PARTICIPANTS METHODSAssess utilisation of birth Companions in 3 Units
4 Key informant interviews1 Focus group discussion7 x In-depth Interviews
Explore Women Perceptions & Experiences of Birth Companions
Postnatal Women 22 Semi–structured interviews
ResultsAt Hanover Park MOU, 55.6% of women had a birth companion, compared to 22.4% at Mowbray Maternity Hospital and only 1.4% at Guguletu MOU.
Attendance of Birth Companions during a 4 week periodOBSTETRIC UNIT NUMBER OF
DELIVERIESATTENDANCE OF BIRTH COMPANIONS
PERCENTAGES
MMH 294 66 22.4%Hanover Park MOU
205 114 55.6%
Guguletu MOU 213 3 1.4%
Husbands were the most frequent companions at Hanover Park MOUs, followed by female relatives. At MMH, doulas and husbands were the most frequent companions.
Type Of Birth CompanionBIRTH COMPANION MMH HANOVER PARK
MOUGUGULETHUMOU
Husband or Male Partner
26 48
Mother 5 25 3Other Relative 1 27Friend / Other 3 14Doula 31 Not Available Not AvailableTOTAL 66 114 3
78
Dominant Themes arising from interviews and focus group discussion
The Majority Of Midwives were in Favour Of Birth Companions.“I think people become tense and are frightened because they are in a different environment and see different faces and they are not used to that, so they don’t relax. But if there is somebody they know that they can relate to, it’s much better”“I also experience that a patient with a companion will not make such a noise as the patient without”
Companions Can Be Helpful For Midwives.“More and more we are lacking nurses. There is not enough time to spend with patients. You are torn between patient & record keeping. When we are very busy and there is a birth companion, I feel reassured that the patient got somebody with her.”
The Majority of Patients were Positive about Birth Companions.“You need somebody who supports you, encourages you, be kind and not shouting and who understands you…. Sometimes you can’t understand well when you are in pain. Some nurses speak very quick, and they are impatient and you can’t understand.”
There were differing views on preference for type of companion.Cultural factors were influential.“My husband has to pray when the child was born. Before the child drink my breast, the father must pray, then he can drink” (muslim patient)“Our men don’t like to be with their wives, cultural, because with Xhosa people the men are not supposed to be there. They don’t like to bring their husbands. I think males will not be comfortable with the screaming in labour ward.”
79
“I would prefer if the patient could bring an aunt or a mum or a big sister, somebody that she knows.”
“I prefer the baby’s father to be there. It would be a lovely feeling to have him rubbing my back & stomach during labour.”
Husbands Have to Experience Suffering of Childbirth.“Mostly the young women they prefer the men to get in because they feel men would appreciate them more…. Men insist to get a lot of children therefore the women sometimes want them in labour that they see how much pain they are going through. After he experience that, he will say, no that’s enough now.”
A very small number of women had Negative Views on Birth Companions.“My mother didn’t actually help me. She was shouting at me “you are stupid”“No, I would not bring anybody. I would not like to have anyone staring at me whilst I am going through my labour pains. I don’t want anyone around me”.
There were several constraints in implementing companionship in labour that were mentioned by midwives.
Birth companion being “observers” not “supporters”“Some relatives don’t support the mother. They just like to see how baby comes out.”
“They (BC) could like to know how far she is dilated, when she will give birth and I must run around to attend to them during the birth process. If they were told before and knew exactly what to do, it would be easier for me”
80
Midwives encounter additional stress and fear violent conflict.“They watch us all the time all tell us what to do”
“I think it has something to do with the attitudes before. In our health service you know, we are getting so scared if somebody is watching what we are doing. I don’t know what it is. There was an attitude against birth companions previously.”
“We are alone at night. Some of the men are getting angry. We have been threatened in the past. It is also a safety issue and a lot of nurses are getting scared if men shouting at them”
Midwives mention Lack of Privacy and Lack of Space as being constraints“We have to consider other patient’s privacy and the patients are not happy if somebody pop around who is not a nurse.”
Midwives mention lack of consistent policies“I think we all have to agree as nurses, because BC help us a lot, when & how to accommodate a BC.There should be some protocol or rules. Everybody must sing the same story.”
Comments on Doulas“Doulas should get paid.”“Yes I would love that doula, because sometimes family members are not allowed”“I can welcome it, if the nurses are very busy she can take care of me.”
Problems expressed by women concerning labour companions.“I do not have relatives here in the township. My mother is at the rural village.”
81
“Even when I went into labour, he accompanied me, then he had to go to work and could not stay.”“It is worse with males, they are required to remain outside behind the gates. Female companions are only allowed as far as the reception.”
ConclusionsConsumers and the majority of midwives were in favor of the idea of having companionship during labour. There were differences in whom the preferred companion would be. Many logistical issues were raised by midwives that prevented implementation.
RecommendationsBetter preparation of women and their planned companion antenatally so they know what is expected of them.Attention to privacy & space.Updates/role play to assist staff in dealing with potential conflict with birth companions.Agreed upon policies in all units.
82
FUNDAL PRESSURE DURING THE SECOND STAGE OF LABOUR: PROTOCOL FOR A RANDOMISED CLINICAL TRIAL. M Singata, GJ Hofmeyr, S Ferreira, NS Kwadjo*, L MangesiEffective Care Research Unit, East London Hospital Complex, Department of Health Eastern Cape, University of Fort Hare, University of Witwatersrand *Saving mothers saving babies, Department of Health Eastern Cape.
BackgroundThe application of pressure to the uterine fundus to assist delivery is an intuitive action which is widespread in formal and informal childbirth practice. In a 1990 North American study, 84% of respondents used fundal pressure during the second stage of labor in their institutions. Use of fundal pressure is also prevalent in poor countries. Fundal pressure is controversial and a source of clinical disagreements between nurses and physicians. An association has been found between fundal pressure and uterine rupture. Fundal pressure has also been implicated as a possible cause of neurological damage to the fetus. Concerns that fundal pressure may cause maternal-fetal microtransfusion, with the risk of viral transmission, have not been confirmed in a randomized trial of fundal pressure versus no fundal pressure at caesarean section.It is not clear whether complications attributed to fundal pressure are the result of the procedure or the underlying problems, which made the procedure necessary.It is remarkable how little systematic research has been carried out to determine the effects of a practice as ubiquitous as fundal pressure. A randomized trial of ‘fundal pressure’ applied by an inflatable obstetric belt in 500 nulliparous women with epidural analgesia found no statistically significant effects on operative delivery rates. No randomized trials of manual fundal pressure have been identified.The possibility that fundal pressure may be an effective way of expediting delivery has profound implications for obstetric care in countries such as South Africa, where midwives attend the majority of births.
83
On the other hand, the possibility that fundal pressure may be harmful is equally important, given its wide use currently. Systematic research is therefore needed to answer these questions.One reason for conflicting opinions regarding fundal pressure may be the lack of a standardised method of applying fundal pressure. We have developed a standardised technique for controlled fundal pressure, and are conducting a randomized clinical trial in several Eastern Cape hospitals to assess the benefits and risks.
HypothesisCompared with current routine practice, use of fundal pressure during the second stage of labour will result in:
1. Shorter active (pushing) second stage of labour. 2. Fewer episiotomies and less perineal trauma. 3. Fewer neonates with 5 minute Apgar score <7. 4. Fewer neonates with umbilical artery pH <7.2 and base deficit >15.
Objective To determine the risks and benefits of fundal pressure during the second stage of labour. Study designRandomised control trial MethodsNulliparous women with no major pregnancy complications will be informed about the details of the study and asked to participate as they more commonly have delayed second stage of labour. Consent will be requested at the antenatal clinic, or in early labour when the woman is sufficiently comfortable to make an informed choice. An information and consent form will be signed. Baseline demographic and clinical data will be collected.
84
Consented women who reach second stage of labour without major complications and for whom a normal vaginal delivery is anticipated, will be enrolled in the trial when they have been pushing for 30 minutes without success; by opening the next in a consecutively numbered, sealed opaque envelope. Allocation will be randomly ordered in variable balanced blocks to two groups: 1. Study group: Fundal pressure during the second stage for second
stage. The woman will be encouraged to assume a semi sitting position. During contractions, the investigator will kneel on top of the bed and let the back of the patient rest on her/his thighs. Fundal pressure will be applied during contractions using the palms of both hands. The woman will be encouraged to pull her knees towards her chest while bearing down. If she is not able to maintain an upright posture, she will be encouraged to use the knee-chest maneuver in the sitting or lateral position.
2. Control group: The same posture as above will be assumed, but no
fundal pressure will be applied.Delivery data will be collected, including:
1. Time of randomisation 2. Time of starting bearing down 3. Time of delivery 4. Fundal pressure done or control 5. Delivery method (spontaneous, vacuum, forceps, caesarean section) 6. Episiotomy 7. Perineal trauma 8. Apgar score at 5 minutes 9. Arterial cord blood pH and base deficit 10. Maternal satisfaction (brief questionnaire)
Data will be collected onto data forms and entered onto Epi Info 2002. The data will compare between groups using relative risks or mean
85
differences, with 95% confidence intervals. Analysis will be by intention to treat.
86
Sample sizeThe sample size for the primary maternal outcome is calculated to have 80% power to detect an increase in spontaneous delivery within 30 minutes from 35% to 50%, with 95% certainty. This requires 182 women in each group.The sample size for the primary neonatal outcome is calculated to have 80% power to detect a decrease in low cord arterial pH from 10% to 5%, with 95% certainty. This requires 484 women in each group. To allow for some non-compliance with the allocated method, a sample size of 500 per group will be used. Ethical aspectsThe study intervention (fundal pressure during second stage of labour) has potential advantages for the mother and baby, and the potential risks as well. There is no current evidence as to whether benefits outweigh risks. The control group will receive current standard care. Mothers will be fully informed about the study. ConfidentialityThe names of the participants will not be used on the data sheets or in any publication of the trial. DisseminationThe results will be presented at local conferences and submitted to a peer-reviewed journal, and also incorporated into the Cochrane Systematic review of the topic, and the WHO Reproductive Health Library, which is distributed widely to health workers in low-income countries.
Acknowledgement: Eastern Cape Department of Health for support.
87
UTERINE MASSAGE TO REDUCE POSTPARTUM HAEMORRHAGE, A RANDOMISED TRIAL
Hofmeyr GJ, Ferreira SE, Singata M, Mangesi L.
BackgroundPostpartum haemorrhage is a major cause of maternal mortality and disability particularly in under-resourced areas.The South African National Committee for Confidential Enquiries into Maternal Deaths reported 2445 national deaths for the years 1999 to 2001. Overall 10% were due to postpartum haemorrhage. In the Eastern Cape, the proportion was 16%. In the least developed countries, postpartum haemorrhage is the leading cause of maternal death. (about 25% of deaths).In well-resourced health services, deaths from postpartum haemorrhage are extremely rare as effective methods are available to prevent postpartum haemorrhage.Deaths from postpartum haemorrhage remain most common in areas where access to health services is poorest. There is therefore a need to investigate simple measures, which can be applied universally at community level to reduce the burden of postpartum haemorrhage.Recommendations for the prevention of postpartum haemorrhage such as the joint statement of the International Confederation of midwives and the International Federation of Gynaecologists and Obstetricians (2003) recommended routine massage of the uterus after delivery of the placenta. Massage is thought to stimulate uterine contraction, possibly through stimulation of local prostaglandin release and thus to reduce haemorrhage. However, there is very little empirical research to evaluate the effectiveness of this method.
ObjectiveThe objective of this research is to determine the effectiveness of sustained uterine massage to reduce postpartum haemorrhage
88
Public health implicationsThe major constraint in reducing postpartum haemorrhage in under-resourced areas is the lack of access to uterotonic agents particularly in non health care facility births.If sustainable routine massage is shown to be effective, promotion of this sample method through educational campaigns would have the potential to reduce maternal mortality from postpartum haemorrhage on a very wide scale. If not effective, attention can be directed towards other methods of reducing postpartum haemorrhage.
RationalePhysical stimulation of the uterus is known to stimulate prostaglandin from the lysosomes causing uterine contraction. When used, uterine massage is usually intermittent.Early and sustained uterine massage may be sufficient to attain uterine contractibility than that achieved with oxytocin injection.
DisadvantagesUterine massage is uncomfortable for the mother.
AdvantagesIf effective, uterine massage will offer a method of reducing postpartum haemorrhage, which will be very widely implementable, particularly when uterotonics are not available.
ProtocolMultiparous women expected to deliver normally will be given information about the study and be invited to participate. Those who agree will be asked to sign informed consent.
Exclusion criteria: medical complications such as hypertension and diabetes; previous caesarean section; abdominal wall not thin enough, to allow easy palpation of the uterus after delivery. If the labour progresses
89
to spontaneous vaginal delivery without obvious genital tract trauma, women will be enrolled by drawing the next in a randomly allocated numbered series of opaque sealed envelopes, to one of three groups.
1. Routine management : Syntocinon 10u will be given IMI and active management of 3rd stage of labour carried out according to routine hospital policy.
2. Sustained uterine massage: Uterine massage will be commenced shortly after delivery by the research midwife and sustained for 30 minutes. Massage will take the form of manual stimulation of the whole surface of the uterus using steady repetitive movements, as firmly as can be achieved without causing distress to the mother. Injections of syntocinon will be delayed until after the 30-minute period of massage, unless blood loss of 500ml is measured before that time.
3. Combined routine management plus sustained uterine massage: In all 3 groups, a low profile plastic “fracture” bedpan will be placed under the woman’s buttocks to collect all blood loss after delivery of the baby for 30 minutes. The midwife, who conducts the delivery, using controlled cord traction, will deliver the placenta in all groups. There will be no other interference in the routine care of the woman. Suturing will be conducted as required.
The times of delivery, randomization and placental delivery will be noted.30 minutes after delivery the fracture bedpan will be removed and the volume of blood measured in a graduated jug.
The following data will be collected. - Age- Parity- Gestational age- Duration of active labour- Use of utrotonics for induction of labour
90
- Use of uterotonics for labor induction- Mothers weight and height after birth- Baby’s weight- Time of delivery- Time of opening of envelope- Time of commencing massage- Time of discontinuing massage- Time of oxytocin administration- Time of placental delivery- Volume of blood in bedpan after 30 minuets- Use of additional uterotonics- Other interventions for hemorrhage such as manual removal of
placenta. bimanual uterine compression
The primary outcomes will be:1. Blood loss >300ml within 30 minutes.2. Placenta delivered > within 30 minutes after birth.
Secondary outcomes1. Blood loss. 500 ml in 30 minutes.2. Median time to placental delivery.3. Use of additional uterotonics or other procedures for management of
postpartum hemorrhage.4. Haemoglobin level after 12 – 24 hours <8mmol.
AnalysisData will be entered into an Excel data spreadsheet and analysed using Epi Info 2002Baseline data will be compared to ensure comparability of groups.Outcome data will be compared using relative risks with 95% confidence intervals and for comparisons of medians.
91
Ethical considerationsAll women will receive interventions to promote uterine contraction, either oxytocin, sustained uterine massage, or both.Blood loss will be closely monitored in all women and any interventions needed for postpartum hemorrhage instituted without delay. (This would probably be earlier than would occur with routine surveillance).Confidentiality of participants will be maintained.Participants will be free to decline or withdraw at any time without giving reasons with the assurance that the care they receive will not be compromised in any way.The study will be conducted according to good clinical practice guidelines.Adverse events will be reported to the Data Monitoring and Safety Committee and the trial discontinued if there is clear evidence of benefit of one group over the other
Sample size calculationIn our previous studies blood loss> 500 ml within 60 minutes occurred in a percentage of women receiving syntocinon. To show a reduction to the percentage with syntocinon plus sustained uterine massage.
92
WOMEN’S ATTITUDE TOWARDS MODE OF DELIVERY IN THE WESTERN CAPE
A Manthata, D Hall, P Steyn, D Grove
IntroductionThe rise of caesarean section rates have led to considerable debate about the relative benefits and risks regarding different routes of delivery. Women have differing expectations regarding the route of delivery. Hildingsons et al conducted a national survey of 3 061 Swedish-speaking women. He found that only 8.2% of women would prefer to have a caesarean section. The wish for caesarean section was associated with parity, age, civil status, residential area and obstetric history.These women were more depressed and worried not only about giving birth but also about other things in life. Multivarate logistic regression model showed 3 factors being statistically associated with the wish for caesarean section: a previous caesarean section, fear of giving birth and previous negative birth experience.Very little information or any is available about African women’s preferences and whether their preference would be influenced by culture.
The aim of the study is to ascertain the attitudes, the experiences and the knowledge of African women regarding the different routes of delivery and how they are affected by traditions.
MethodThe study was based at Tygerberg Hospital (a tertiary referral centre), Paarl Hospital (a secondary referral centre) and the Michael Mapongwane Day Hospital. Two hundred and forty women were approached at the first antenatal visit.After obtaining informed verbal consent, the principal author interviewed 221 women. The group was made up as follows: 54 Coloured primigravidas, 46 Black primigravidas, 62 Coloured multigravidas and 59 Black multigravidas. Of the 19 women who were not interviewed, 8
93
declined from the outset and a further 11 upon hearing the nature of the questions during face-to-face interviews.The interviews were conducted face-to-face with the interviewees; questions were asked in the patients’ own language and they were captured by the principal author.
ResultsThe characteristics of the study population at the time of the interviews are shown in Table 1.
The results are shown as median (rnge) or n%. *=Yes to any number of cigarettes smoked or any amount or type of alcohol consumed, ^ = Achievement of secondary or tertiary education.
94
Forty-four (82%) coloured and 45 (92%) of black primigravidae respectively were aware of the normal vaginal delivery route. Sixty-two (100%) and 59 (100%) of coloured and black multigravidae respectively were aware of the normal vaginal route. Fifty (92%) coloured and 45 (98%) black primigravidae respectively were aware of the caesarean section whereas 58 (94%) and 59 (100%) of coloured and black multigravidae respectively were aware of caesarean section.Amongst the multigravidae women, 46 (74%) of the coloured group and 45 (76.3%) of the black group had previously experienced vaginal delivery. In the coloured group, 29 (63%) experienced the vaginal delivery positively, 13 (28.3%) negatively and 4 (8.6%) were uncertain. In the black group, 31 (68.9%) experienced vaginal delivery positively, 11 (24.4%) negatively and 3 (6.7%) were uncertain.The women were then asked to indicate their delivery route of choice. Their responses are shown in Table 2.
Table 2 Delivery route of choice for themselvesColoured primigravidae (a) n=54
DiscussionObstetric practice is changing worldwide and in developing countries, the doctor’s autonomy is becoming a crucial issue. Patients want to be sure that their doctors respect their views and wishes when treating them. This has led to considerable debate about the risks and benefits about different routes of delivery and what women want.From the above data, the percentages in favour of caesarean section as birth route are quite low. What makes it even more interesting is the fact that there is no real difference in the choice of coloured or black primigravidae. Furthemore, a sizeable percentage of coloured
95
multigravidae preferred a caesarean section for themselves as compared to the black multigravidae. Overall, the average of 14% compares with the low percentages reflected in the finding of Hildingsson et al who conducted a survey of 3061 Swedish women and found that only 8% preferred caesarean section. Chong et al’s survey in Singapore also found a low rate as 3.7% indicated that they preferred caesarean section.Several studies have been done on doctor’s perceptions to wards routes of delivery. Lawrie et al studied high caesarean section rates among pregnant medical practitioners in South Africa and found that 20% of the primigravidae preferred delivery by elective timed delivery, fear of perineal trauma and a perception that caesarean sections is associated with fewer complications.Most of the women in this study were from low socio-economic backgrounds, and the majority of the primigravidas were unmarried. In a study done in Switzerland Hildingsson et al, the women who desired caesarean section were of lower socio-economic status, more depressed and worried not only about giving birth but also about other things as well. These findings seem to be in contrast with those in the index study.In conclusion, coloured and black South African women prefer vaginal birth. Though their knowledge is limited, they prefer the traditional mode of delivery. The challenge to doctors and nursing personnel is to educate patients about basic procedures with regard to birth. Their views and wishes should be respected.
96
PRETERM DELIVERIES ARE A SERIOUS PROBLEM
Mashamba TJ; Mawela D* & Madumo N.Department of Paediatrics*, Department of Obstetrics/Gynaecology Dr George Mukhari Hospital, Ga-Rankuwa, Pretoria
IntroductionApproximately 95% of patients in South Africa are reported to attend antenatal clinic during pregnancy, yet pre-term delivery rate is still significantly high. This is a result of either spontaneous or induced deliveries, which pose a serious challenge to the paediatricians. A significant number of mothers are delivered of extremely low weight babies. This review looks at the demographic characteristics of mothers who delivered these babies, the outcome for these babies in the neonatal unit as well as determine the commonest cause of death.
MethodsThis review is a retrospective audit of files of patients who delivered their babies at Dr George Mukhari hospital, covering a period from 1st January until 31st
December 2005. All files of patients, who had delivered extremely low weight babies, were reviewed and analysed. The demographic characteristics of the mothers as well as the outcome for each of the babies were assessed.
ResultsEight thousand four hundred and fifty-nine (8,459) patients delivered at Dr George Mukhari hospital during the review period. Out of this number, 206 mothers had extremely low birth weight babies (500 – 999 gm). One hundred and twenty-six (126) babies were born alive and 80 were stillbirths. Out of the 126 live newborns, 84 (66.7%) reached the neonatal unit. Among the 80 stillborns, only 8 patients had positive syphilis serology test. Of the 84 babies admitted to the neonatal unit, majority of them (59.5%) were delivered from hypertensive mothers, while 4 were from twin pregnancies.
ConclusionA significant number of extremely low birth weight babies are delivered due to maternal complications. This poses a serious challenge to paediatricians. A consensus needs to be reached, which will prevent looking after late abortions or extremely low birth weight babies. This will safeguard the expenses incurred in looking after the mother and baby. The outcome of these babies will be presented.
97
DEVELOPING A COMPREHENSIVE LABOUR MANAGEMENT GUIDELINE FOR SAFE INTRAPARTUM CARE IN SOUTH AFRICA
E FarrellMRC Unit for Maternal and Infant Health Care StrategiesDept of Obstetrics and Gynaecology, Kalafong Hospital and University of Pretoria
IntroductionIt is tragic that the most common primary cause of death of fetuses and neonates over 1000g in South Africa is intrapartum hypoxia. Managing labour is part of our core business as midwives and obstetricians and we, as a country, are not doing it well. For this reason, the MRC Maternal and Infant Health Care Strategies Research Unit hosted a meeting of health workers involved in research into intrapartum care together with administrators from the Maternal Health Directorate of National Department of Health and the Maternal, Child and Women’s Health Units in the provincial Departments of Health.
AimsThe aim of the meeting was to review the current relevant research on intrapartum care and define: what is known, where is the knowledge lacking, how labour should be managed in maternity units in South Africa.The MRC Unit reviewed all the articles related to intrapartum care in the Priorities in Perinatal Care Conference Proceedings and extracted information from those studies to try and answer the above questions. Since 1981, there have been over 120 studies performed and presented at the conferences. We believe we have captured most of the intrapartum care research that has been performed in South Africa in the last 25 years. Furthermore, the seminal studies performed by Hugh Philpott and others in the 1960s and 1970s were also reviewed and scientific basis for the partogram reviewed. The Effective Care Research Unit of Justus Hofmeyr detailed what interventions in labour are effective or otherwise. By combining the two bits of information and with the input of the members
98
of the workgroup, a clear set of guidelines on how to manage labour in South Africa has been developed and presented here. Information related to health systems, training and methods of implementation of perinatal care strategies (like the Perinatal Education Programme and the Better Births Initiative) were reviewed to determine what was effective in improving practice. The aim was to identify effective strategies that improve intrapartum care and promote their use by the health administrators in South Africa.
ResultsA review of the South African literature on the problems of intrapartum care revealed the following: 1. Poor overall clinical skills. 2. Poor recording of clinical findings, which leads to substandard (or no)
management decisions.3. Inadequate transport for women requiring referral in labour. 4. Inferior quality of care experienced by women in labour. To improve this, the following guideline for managing labour in a pregnant woman is presented.When a pregnant woman presents to labour ward she must be assessed to confirm labour and risk classified. Women with high risk factors must be referred to the appropriate level of care.
Diagnosis of labourCriteria: Regular, painful contractions and one of the following:
cervical changes; or ruptured membranes; or show.
Latent phaseLabour confirmed with the patient’s cervix less than 4cm dilated. This will usually be a retrospective diagnosis.
99
Active phase The diagnosis of the active phase of labour is made when the
woman’scervix is 4cm dilated and less than 1cm long and regular uterine contractions are present.
Management of Labour:Where diagnosis of labour is uncertain, patient must be observed for 4 hours.Observations: (same as those in the latent phase).
Any change in maternal condition would indicate more frequent observations.After 4 hours, a diagnosis of false labour or latent labour should be made. If she is in latent labour, she should be observed for 8 hours.
Vaginal examination – 4 hourlyBP, pulse, temperature – 4 hourly Fetal heart rate – 2 hourly (doptone) – after a contraction
Patients need not be observed in a labour ward but should be in an area managed by a registered midwife.After 8 hours in the latent phase a patient still at a level 1 institution should be referred for further assessment by an advanced midwife or experienced doctor at an institution that can perform caesarean sections. If the reason for poor progress is inadequate contractions and the maternal and fetal conditions are satisfactory, the patient may be managed expectantly at the higher level institution.
100
ACTIVE PHASE Maternal monitoringEssential observations:
Blood pressurePulse rateTemperature Urine output Urine dipstix Respiratory rate – high risk onlyUrine volume – high risk only
Frequency of observationsLow-risk patient
Blood pressure – hourlyPulse rate – hourlyTemperature – 4 hourlyUrine output – when urine is passed Urine dipstix – on admission and when urine is passed
High-risk patientBlood pressure – hourly (more often if abnormal)Pulse rate – hourly (more often if abnormal)Respiratory rate – hourlyTemperature – 4 hourlyUrine output – hourly if catheterised, otherwise when urine passed Urine dipstix – 4 hourly if catheterised, otherwise when urine
passedChart fluid intake/output
Fetal monitoring Low-risk patientAll monitoring should be performed immediately after a contraction.Method used for fetal monitoring:
Doptone (preferred)
101
Auscultation should still be actively taughtPinard/clinical stethoscopes must be available in labour wards.
Frequency of fetal monitoring which is considered safe:Fetal heart rate monitoring every 30 min (doptone) – after a contraction.If individual observations are missed, then the reason should be noted on the partogram.
102
High-risk patientFrequency of fetal monitoring which is considered safe
Latent phase – Two hourlyActive phase
A cardiotocograph (CTG) should be used to monitor the fetal heart rate pattern. If not available, fetal heart rate should be monitored every 30 min
Monitoring of progress of labourLatent PhaseThe partogram should only be started on diagnosing latent phase and not if the diagnosis of labour is uncertain. Recording of the uncertain latent phase can be entered on the table provided for the latent phase in the labour record booklet but not on the partogram.Active PhaseDocumentation of the progress of labour is by use of the partogram. It should be filled in when each observation performed and problems identified should be noted and a management plan stated. The following observations plus those of the mother and fetus are required:
Abdominal palpationLength and frequency of contractions Head above brimVaginal examinationState of the membranes (intact/clear liquor/meconium stained)Cervical position and lengthCervical dilationIdentification of the presentationApplication of the presenting partPosition and attitude of the presenting partCaputMouldingStation of presenting part
103
Bimanual assessment of head above brimFrequency of the actions: (Low risk and high risk patient)
Abdominal palpationLength and frequency of contractions – hourlyHead above brim with vaginal examination Vaginal examination2 hourly in active phase
Managing the active phase of labour - Low Risk patient1. Progress to the left of the alert line: Continue
routine monitoring of mother and fetus2. Progress crosses the alert line: Make a diagnosis of
why progress is poor using the 4Ps; patient, powers, passenger and passage to exclude fetal distress and disproportion. If poor progress is due to:
a. Malposition (e.g. occipito-posterior), maternal distress, pain or dehydration: improve maternal status and reassess in two hours.
i. If remains to the left of the transfer line; reassess 2 hourly until delivery.
ii. If crosses the transfer line transfer to a hospital that can perform caesarean sections
b. Poor contractions and the institution has the facilities to give oxytocin safely: start oxytocin to augment contractions.
c. Disproportion: refer to a hospital that can perform caesarean sections for review and further management
Other Aspects of managing the active phase of labourDoula/Support person in labourAll patients should be encouraged to have a support person of their choice in labour.Use of analgesiaAll women in labour should be routinely offered analgesia during labour.
104
What to use: Pethidine, morphine, nitrous oxide, epidural service.Nutrition in labourAll patients should be allowed to take food when in labour.Ensure adequate oral fluids are taken to prevent dehydration. Mobilisation in labourWomen in labour should be encouraged to mobilise during labour, or at least assume an upright position.Rupturing the membranesIndications: poor progress in labour where it is documented that patient is HIV negative, otherwise use oxytocin (with intact membranes).If patient is on antiretroviral therapy, treat as HIV negative.Contra-indications: HIV positive or unknown status, then membranes should be ruptured as late as possible.
Management of the Second stageTwo phases are recognized:Full dilation until the head is on the perineumHead-on- perineum until delivery of the babyDiagnosis of the true second stage: should be made at the time the patient has the urge to bear down.Duration of the second stage:
Primigravida: 45 minMultigravida: 30 minObtain help or refer the patient if these time limits are exceeded.
Monitoring of the fetus in the second stageMidwife constantly with patient in second stage.Fetal heart rate after every second contraction (doptone)Every 15 min check descent and progress. Document fetal heart rate and descent in delivery notes.Action must be taken immediately if fetal distress is diagnosed. Give hexoprenaline and turn on side for referral.
105
When to pushIf no desire to push after being diagnosed fully dilated, re-assess after 1 hour.If no progress/desire to push after one hour, call for help or refer.If head is on pelvic floor, the patient should be encouraged to push. If the head is higher, the process for referral should be set in motion. The patients needs to be accompanied by a person who can assist with a vaginal delivery.Use of EpisiotomyThe use of episiotomy should be restricted to selected cases.
Management of the Third stageActive management using oxytocin (10U) IMI as first choice.
Implementation of these guidelines can be achieved by:1. Training of midwives and doctors using one or more of the following
methods a. Perinatal Education Programme.b. Better Births Initiative.c. On-site face to face training.d. The Decentralised Education Programme for Advance Midwives
(DEPAM).e. The Peninsula Maternity and Neonatal Services model.
Training includes:1.1 Basic skills training which includes abdominal palpation,
pelvimetry, vaginal examination of the birth canal and presenting part of the fetus, fetal wellbeing.
1.2 The use and interpretation of the partogram.1.3 The interpretation of the cardiotocograph.
2. Audit of Management of Labour2.1 The 25-point score of the partogram.2.2 The Robson Classification of caesarean sections.2.3 The Perinatal Problem Identification Programme (PPIP).
106
2.4 A 20-point exit questionnaire completed by the patients on quality of care during labour.
3. Implementation3.1 An on-site Champion3.2. The Community Midwife practitioner/Obstetrician/
Paediatrician.
107
IUGR – A DIAGNOSTIC DILEMMA
Dave WoodsNeonatal Medicine, University of Cape Town
I would like to review the diagnostic dilemma of intrauterine growth restriction (IUGR), first by exploring the paediatrician’s approach to the small infant and then by looking at the obstetric concept of the fetus who appears to be growing too slowly. Finally, I will attempt to resolve the differences between the paediatric and obstetric views by presenting a unified vision which helps in understanding the diagnosis and management of these at risk infants.
Not all infants are the same size at birth as demonstrated by this set of twins. Some newborn infants are smaller than others. Therefore all infants are not born equal. It has probably been known for many thousands of years that the smallest infants have the highest risk of morbidity and mortality.
In 1948, the WHO formally proposed using the word “premature” for infants weighing less than 5lbs and 8oz at birth although this definition had been used in the literature since the 1920s. It was further advocated that these infants should be identified for special care.
The concept of the undernourished infant with soft tissue wasting was not new and had been well described by McBurney in 1947. The words “dysmature” and “post mature” were often used to describe these wasted infants who appeared to have suffered recent starvation. The cause was usually blamed on the nebulous concept of the insufficient placenta.
Therefore, a practical cut off of five and a half pounds was used to define the small infant who had an increased risk of neonatal problems and needed special care. Unfortunately the use of the phrase “premature infant” for all infants under five and a half pounds ignored the
108
undernourished or slow growing fetus and implied that these small infants were all born too soon, before reaching full gestation.
A special expert committee of the WHO in 1961, recognised that all infants weighing less than 5½ lbs were not born prematurely and introduced the concept of the low birth weight (LBW) infant to better define these at risk infants. The description of LBW placed no presumption on the gestational age of these infants. At the same time they metricated the definition of the LBW infant from less than 5½ lbs to less than 2500g.
Weight was used as the measurement of choice as it was easy and accurate to record. Unfortunately, weight is not necessarily the best measurement of size nor the best reflection of growth.
At the same time, the committee strongly advised that the words premature, dysmature and post mature be no longer used. Forty years later this advise has still not been taken.
In 1970, a working group of the 2nd European Congress of Perinatal Medicine recommended the use of the words “preterm, term and post term” to categorise newborn infants by their gestational age with 37 and 42 weeks after the first day of the mother’s last normal menstrual period being used as the cut off points. The definition is also given in days (259 and 294) to avoid the argument about completed or incompleted weeks.
By now, it was clear that not all LBW infants were born too soon and that many were born at term and therefore weighed less than expected for the duration of pregnancy.
In 1963 Lula Lubchenco, the godmother of neonatology in the USA, published her cross sectional birth weight for gestational age chart and suggested that the 10th and 90th centiles be used to define the average weight range. These are not growth charts based on longitudinal data but
109
simply standards of birth weight at different gestational age. Of interest, is that she used 38 not 37 weeks as the cut off for prematurity in 1963, as this chart was published before the WHO decision to use 37 weeks to define term. Her survival data showed that term, appropriate for gestational age (AGA) infants have the lowest mortality risk. Unfortunately she used the descriptions small for gestational age (SGA) and large for gestational age (LGA) which caused many years of further confusion. The problem being that weight for age is not a very good measure of the size of these infants. Length or head circumference would have been better but are more difficult to measure accurately. These labels were only later replaced with underweight for gestational age (UGA) or light for dates (LFD) for infants with a birth weight below the 10th centile and overweight for gestational age or heavy for dates for infants above the 90th centile.
Lubchenco used these weight for age criteria as an index of risk rather than an attempt to define normality. Therefore she used the 10 th and 90th
centiles rather than the mean plus or minus two standard deviations. Three years later, she published length and head circumference centiles. Infants with a length and head circumference below the 10th centile were truly small for their gestational age and therefore must have been growing slowly in utero.
It is now accepted that most UGA infants have either grown slowly for a long time, and therefore have true fetal growth restriction, or have recently lost weight and become wasted with a decrease in weight but not length and head circumference. Some infants are both small and wasted.
A newborn infant’s length and head circumference are the best indicators of the rate of intrauterine growth. As with older children, tall infants must have grown faster than short infants of the same age.
110
In a study of almost 2000 infants born at term to primiparous mothers from poor communities in Cape Town in 1975/6, I showed that approximately half of the 210 infants who were born underweight for gestational age were not short for their gestational age. Ninety two of these infants had a normal length for their gestational age. Therefore almost 50% of these UGA infants were not small even though they weighed less than expected for their duration of pregnancy. The 92 UGA infants with a normal length must have been thin or wasted while most of the remaining 118 UGA infants who were also short would have had symmetrical growth restriction.
Similarly, almost half of the 207 infants that were short for their gestational age at term were not UGA. Although having grown slowly, these 89 infants were relatively fat. This suggests that their slow growth was not due to fetal undernutrition. Comparing weight and head circumference for gestational age gives very similar results.
It must be concluded that fetal growth and fetal weight gain are not necessarily the same thing. Hence the importance of using the accurate description of UGA rather than the often inaccurate label of SGA when an infant’s weight for age is plotted below the 10th centile.
In a 20 year follow up of our symmetrically growth restricted infants, most remained short through childhood and into adulthood, following the pattern developed in utero. Those adults who had an appropriate weight for their height were healthy but those who became overweight had a greater risk of hypertension, insulin resistance and hyperlipidaemia. This is a common problem in emerging economies and suggests that obesity in individuals who are preadapted to resource-poor conditions in utero is a major cause of many chronic illness of adulthood.
The widely accepted concept of so-called asymmetric growth restriction with poor weight gain associated with head sparing and normal linear
111
growth is not supported by these findings. Most of these asymmetrical infants are not growth restricted at all but simply wasted, having lost weight in the last few weeks of pregnancy.
Most UGA infants in our Cape Town study were symmetrically small at term with proportionate reduction in weight, length and head circumference suggesting prolonged slow fetal growth without features of fetal undernutrition. They were born to mothers with a low weight and had few problems in the neonatal period. We have previously argued that this pattern of slow fetal growth from early pregnancy is an appropriate response in a poor community to reduce fetal nutritional needs. Their slow growth, which limits nutritional demands, prevents acute starvation towards term.
In summary, all infants must be weighed at birth, and the following should be assessed in all LBW infants:1. Gestational age (born too soon?)2. Weight for gestational age (at increased risk?)3. Head circumference (or length) for gestational age (slow fetal
growth?)4. Clinical wasting (recent starvation?).
Only then can a reliable assessment be made of the infant’s in utero growth and nutritional experience. This knowledge is essential in understanding the infant’s problems and planning rational management.
Meanwhile, obstetricians and midwives had for years palpated the abdomens of pregnant women in an attempt to assess uterine size as a reflection of fetal growth and wellbeing. This introduced the concept of intrauterine or fetal growth restriction which was widely accepted as a risk factor for stillbirth or neonatal death. Obstetricians became concerned when the size of the uterus was smaller than expected for the duration of pregnancy.
112
The introduction of symphysis-fundal height measurement greatly increased the objectivity of clinically assessing the size of the uterus. It also meant that uterine size could be plotted on a chart and failure of adequate increase in uterine size identified earlier and more accurately.
In the 1960s, Ian Donald and Stewert Cambell in Glasgow started measuring the size of fetuses with ultrasound. This introduced a new method of very accurately measuring the size (femur length, biparietal diameter and head circumference) and hence the growth of the fetus over a period of time.
Unfortunately, the paediatric literature continued to speak of weight for gestational age while the obstetric literature spoke of length, diameter and circumference. This led to the erroneous assumption that UGA was the same as IUGR. Hence the diagnostic dilemma.
More recently it has been possible to get accurate information on the nutritional state of the fetus, with wasting due to starvation being identified by reduced amniotic fluid volume, reduction in abdominal circumference, a fall in the estimated fetal weight, and abnormal resistance in the umbilical arteries.
Unfortunately, the concept of asymmetrical growth restriction persists. Most of these starving fetuses have a normal length and head size and, therefore are not growth restricted. However, they have soft tissue wasting and chronic hypoxia due to recent uterovascular inadequacy and are at high risk of acute hypoxia during labour and hypoglycaemia after delivery. Recently it has become clear that the quality rather than the quantity of the fetus is what is important.
113
Two important questions, which need to be asked when the increase in uterine size is slower than expected, are: is fetal growth slower than normal and is there evidence of wasting?
The concepts of fetal growth and nutritional status, as assessed by the paediatrician at delivery, can at last be married to the observations made by the obstetrician during pregnancy. This improves both diagnosis and management.
How does this help in the management of the fetus and newborn infant? In poor communities, symmetrical fetal growth restriction is common with normal umbilical artery resistance and normal fetal movements. These LBW infants are usually born at term and have few problems in the neonatal period. However, they continue to grow slowly during childhood and end up as short adults. Only if they become relatively fat in adulthood are they at high risk of diabetes, hypertension and hyperlipidaemia with resultant vascular disease as described by Barker in his thrifty phenotype hypothesis. We proposed that this pattern of restrained growth, so commonly seen in developing countries, is an appropriate adaptation to a resource-poor environment.
In contrast, the fetus with wasting is at high risk of hypoxia during labour while the newborn infants commonly presents with hypoglycaemia, polycythaemia and hypoxic organ damage. These infants often require early delivery with intensive monitoring during labour and the first days of life. If they have a normal length and head circumference at birth, their postnatal growth to adulthood is usually normal. However, they are at increased risk of neurodevelopmental delay.
It is important that both the obstetrician and paediatrician recognise these two different patterns as the prognosis and management differs.
114
The take away message is that, while slow fetal growth is always of concern, the wasted fetus who is receiving inadequate amounts of oxygen and energy due to poor uteroplacental blood flow is at the greatest risk.
A clear understanding of the terminology and concepts of fetal growth and infants size at birth go a long way to solve the diagnostic dilemma of IUGR.
115
AUDIT OF NEONATAL TRANSFERS TO A TERTIARY CENTRE IN THE TSHWANE METROPOLITAN AREA
Masekela R, Kruger M.University of Pretoria, Department of Paediatrics and Child Health.
IntroductionThis was an audit to determine the referral diagnosis, any resuscitation or interventional measures taken, the condition on arrival and the outcome of neonates transferred from Mamelodi Hospital to Pretoria Academic and Kalafong Hospitals.
MethodsData was collected of all neonates transferred form Mamelodi to the neonatal intensive care units (NICU) at Pretoria Academic and Kalafong Hospitals between September 2003 and October 2004. The data was analysed for the referral criteria, pre-transport resuscitation, condition on arrival and outcomes.
ResultsThere were 42 neonates enrolled in the study, The most common reason for referral was prematurity (71.4%). Forty six percent of the full term baby referrals were for birth asphyxia. Hypothermia was found in 79% of all patients on arrival at the tertiary care NICU. There were no intravenous lines in 52% of patients, while 23% had hypoglycaemia on arrival at the receiving hospital. The mortality rate was 26.1% with five of 12 full term neonates and six of 30 preterm neonates dying.
ConclusionThe study highlights the need for adequate pre-transport stabilization of neonates, which include interventions to avoid hypothermia and insertion of intravenous lines with 10% dextrose solution to prevent hypoglycaemia. There is a need to train health care staff to effectively resuscitate neonates to prevent or minimise birth asphyxia. Mothers in pre-term labour should be referred early to centres that can manage premature babies. This data has been used to develop transport protocols for transfer of high-risk neonates.
116
DURATION OF STAY, TIME OF DEATHS AND DISCHARGES IN A NEONATAL INTENSIVE CARE UNIT.
S. Velaphi, F. Nakwa, P. Mphakoba, N. Mzangwe, S. Mavu, H. Diar, A. van Kwawegen, I. Mohlabi, M. Mokhachane.Department of Paediatrics, Chris Hani Baragwanath Hospital and the University of the Witwatersrand
IntroductionA survey by the South African Critical Care Society (SACCS) reported that only 1% of the total hospital beds in the Gauteng province are critical care beds. The World Health Organization recommends that in developing countries, 6-10% of hospital beds should be allocated as critical care beds. Therefore, there is a major shortage of critical care beds in Gauteng. Chris Hani Baragwanath Hospital (CHBH), one of the government hospitals in Gauteng has 12 neonatal intensive care beds. These beds cater for the in-hospital deliveries (±20 000 deliveries per year), maternity obstetric units (MOUs) in the Soweto area (± 9000 deliveries per year), secondary level hospitals (Sebokeng and Natalspruit) (±18 000 deliveries per year combined, the neonatal surgical unit and some patients from general paediatric wards). The patients admitted to the neonatal intensive care unit (NICU) are mainly those who require mechanical ventilation. The bed need analysis should include: 1) the number of patients requiring critical care beds; 2) the bed occupancy levels; and 3) the duration of stay. There is a great demand for these ICU beds. Patients may be discharged prematurely because of demands on ICU beds. There is a number of limitations on the availability of ICU beds e.g. staff shortage. The staff shortage limits the number of patients that can be admitted to an ICU, even if beds are available. Our impression is that when there is a shortage of nurses, the night shift seems to be affected the most. The objectives of the study were to determine the duration of stay of patients in NICU, and on whether deaths and/or discharges occurred more at night than the day.
117
MethodsThis was a retrospective record review of the NICU charts of patients admitted to the unit during the period from September to December 2005. Demographics, the date and time of admission and discharges from NICU were recorded. The time of discharges or deaths were divided into four periods: period 1- from 12 midnight to 06:00am; period 2- from 06:00am to 12:00 noon; period 3- from 12:00 noon to 06:00pm; period 4- from 06:01pm to 12:00 midnight.
ResultsA total of 226 admissions were reviewed over the four month period. Patients were admitted from the following wards; labour ward (106; 47%); high care unit (81; 36%); surgical unit (11; 5%); general wards (9; 4%); and other hospitals (19; 8%). Thirty five percent of infants from the high care unit were only a day old when they were admitted to NICU. The admission body weight ranged from 850g to 4000g with a median weight of 1680g. There were 51 deaths (23%) during this four month period. The indications for admissions to NICU were surgical (excluding necrotizing enterocolitis) in 11% of cases. Most patients were extubated to nasal cannulae (69%), and others were extubated into nasal continuous positive airway pressure (nCPAP) machine (23%) and into head box oxygen (8%). The median duration of stay in NICU was 4 days with a range of 1–33 days, with the 25th and 75th centile being 2 and 6 days respectively. The median duration of stay in NICU did not significantly vary according to admission weight (Figure 1). In comparing the survivors and those who died, the patients who died had a smaller birth weight on admissions (p<0.001) and died earlier during their stay in NICU (Table 1). Most discharges (73%) and admissions (56%) occurred during the day (period 2 and 3). There was a fairly equal distribution of deaths between night and day, with 49% and 51% occurring during the night and day respectively.
118
Figure 1 Median duration of stay according to weight on admission
Table 1 Comparing the duration of stay between survivors and non-survivors
Survived Died p-value Median Admission Weight (kg) 1695
(900-3610) 1260 (850-4000)
<0.001
Median Duration of Stay (days) 4 (1-33)
2 (1-21)
0.006
Table 2 Time of deaths and discharges from neonatal intensive
care unit
Admissions Discharges DeathsPeriod 1(12am-6am)
15% 7% 14%
Period 2(6am-12noon)
23% 29% 26%
Period 3(12noon-6pm)
33% 44% 25%
Period 4(6pm-12midnight)
29% 20% 35%
Discussion Thirty five percent of patients that were admitted from high care were only one day old. This could possibly be explained by the unavailability of NICU beds, therefore these patients had to wait for an NICU bed in high care unit or that patients were very ill from birth but were not admitted to NICU because they were not requiring mechanical ventilation and continued to deteriorate in high care. The patients admitted to the NICU requiring
119
mechanical ventilation had a median duration of stay of 4 days and the median duration of stay of non-survivors was 2 days. Therefore those who did not survive died early and this means resources were not used more on the non-survivors than the survivors. There was no significant difference in time at which the deaths occurred in the NICU. This could be due to the nurses working harder at night therefore covering for the shortage of nurses at night or the impression that a patient to nurse ratio at night is compromised is not true. Twenty seven percent of discharges occurred at night. This suggests poor planning in preparation for admissions or reflects demand for NICU beds therefore discharging patients early. We plan to continue reviewing the records of admissions to NICU and to determine if time of admission and patient to nurse ratio determines the outcome by reconciling the number of nurses working at night and bed occupancy.
120
AN EVALUATION OF NEONATAL NURSING CARE IN SELECTED HOSPITALS IN THE WESTERN CAPE
H Barlow
IntroductionThe birth of an infant is usually an event that is surrounded with excitement and happiness. However, when things don’t happen according to plan, preterm infants and term newborns who require specialised care are removed from their mothers and transferred to the nearest Neonatal Unit for this care. In the Neonatal Intensive Care Unit (NICU), the infant will receive care from highly skilled medical and nursing staff using advanced technology and skills that have developed over the past forty years. It is widely recognised that the nursing care received by these patients has a significant influence on the prognosis and eventual outcomes of these patients. The nurses’ interactions with neonates, and stimuli including light, sound and touch, can cause changes in intravascular pressure, intrapulmonary pressure and variations in the PaO2, which can have consequences resulting in an array of long-term physical and mental problems that are costly to treat and monitor. Therefore the question asked is, are we achieving adequate standards of care when nursing sick neonates?
MethodologyIt is necessary to have standards available if one is to evaluate care and neither of the two NICUs where evaluation took place had any standards available at the time. Using Donabedian’s model of Structure, Process and Outcome, the researcher set about designing standards in these three areas. Structure standards of the British Association of Perinatal Medicine, the Committee to establish standards for Newborn ICU design from Memorial Hospital, Indiana, USA and the minimum physical building service requirements as published in the Provincial Gazette no. 5728 of the Province of the Western Cape were used to establish the physical structure standards. Structure standards also include equipment available and staffing ratios.
121
For the process standards, event sampling was used to identify twelve specific interactions undertaken by NICU nurses. Conceptual process standards were then developed after an extensive literature search confined to articles relating to practice that were published after 1990. Further information relating to practice issues was obtained from an interactive forum, the Neonatal-talk list and from text and reference books. These standards were validated by a Neonatal Nurse Expert and altered when deemed necessary. The resulting consensus standards were used to evaluate care in the twelve interventions. Data collection continued until saturation occurred.
Outcome standards reflect whether the objectives of the process of care have been achieved. They also give an indication of what has been done with the available resources.
ResultsStructure standards were met in some areas, but fell short in many areas. A contributing factor is that the hospitals were constructed many years ago and Neonatal Care was not well established at that time. One of the NICUs has been redeveloped since the study, utilising the same sources used to create the structure standards. Available equipment was adequate based on totals of patients, but the reality is that the total of patients in the NICUs is usually more than the capacity as illustrated.
Patient Totals
122
0.0
20.0
40.0
60.0
80.0
100.0
120.0
140.0
160.0
180.0
JAN FEB MAR APR MAY JUN JUL AUG SEP OCT NOV DEC
TOTA
L PA
TIEN
TS
NO. PATIENTS
% OCCUPANCY
Staffing is also problematic given the current shortage of nurses and the NICUs usually utilise agency staff to improve the nurse: patient ratios. Despite this, the required ratios are not met. There are even fewer nursing staff allocated on night duty.
Staff Allocations, Day duty:
The minimum acceptable outcome score for process standards was set at 80%. Results of each individual assessment were calculated into percentages and tables were created to reflect the data for analysis. Three of the twelve procedures achieved the minimum score of 80% and the average of the evaluation of the process standards was 75.7%.
Outcome standards are reflected in the statistics of each NICU. Both NICUs had an occupancy rate of more than 100% in most months as shown
Available Staff vs. Recommended Staff.
05
101520253035
JAN FEB MAR APR MAY JUN JUL AUG SEP OCT NOV DEC
Available Staff Recommended Staff
123
above. Patient acuity places demands on nursing staff and equipment as shown below where two NICU sisters care for six infants, all of which may be ventilated at one time.
124
Total ventilator days
0
10
20
30
40
50
60
70
80
90
JAN FEB MAR APR MAY JUN JUL AUG SEP OCT NOV DEC
TOTA
L PA
TIEN
T DA
YS
IPPV
Recommendations The institution of a Quality Assurance program to raise consciousness
of the work being done. In order to do this, we need to implement standards of care in the NICUs. These standards must be developed using recent literature and discussion to ensure that they are evidence-based. The standards should be revised every two years or more frequently if necessary. The staff who will be using the standards should be instrumental in developing them, as this will help to ensure compliance with the standards and a sense of ‘ownership’ of the standards exists.
Education of staff working in the NICU will create a culture of learning, which will improve confidence and encourage further study.
Staff should be encouraged to undertake further training in the form of in-service education and distance learning to enhance their knowledge and for personal development.
There are many areas where further research can be undertaken in the NICU. Nursing staff should be encouraged to undertake research to increase knowledge in this speciality.
125
TOXIC PAEDIATRIC HOME REMEDIES IN BOTSWANA: POISIONING THE FUTURE?
The use of paediatric home remedies is common in Central and Southern Africa. The products range from traditional herbal portions, “holy” waters and oils, and a variety of pharmaceutical over–the–counter drugs. Although these drugs are given in good faith, the majority of them are poisonous to the growing child. Their effects should not be underestimated in the young infant whose renal and hepatic function is still suboptimal. Worse still, in an environment where HIV/AIDS prevalence is high and polypharmacy is the norm as PMTCT and ART programs expand nationwide, drug-drug interactions are on the rise.We present case reports of two young infants who presented with neurologic and respiratory problems following repeated doses of turpentine – containing over-the –counter drugs widely used in Botswana. The discussion focuses on turpentine, but these home remedies contain a variety of other poisonous chemicals such as tar, arachis oil, ether and ethanol. Interestingly, some of these products are clearly labelled “not for use in children”. The popular products in the community include haarlemensis, jamaika ginger, groen amara, stuipdruppels and gripe water. Manufactured in the Republic of South Africa, these drugs are easily available from supermarket chains in towns and villages across the country.The diagnosis was made on history of ingestion of one or more of these substances and exclusion of central nervous system and respiration infections. Laboratory facilities to establish serum levels of turpentine were not available.The patients responded well to general supportive measures that included oxygen intravenous fluids, bronchodilators, steroids and anticonvulsants. On follow up, no obvious long term problems could be picked up.The two patients are just the tip of an iceberg. They were fortunate to survive with minimum sequelae. A few babies have died as a result of
126
these toxins and several have quietly suffered deleterious effects over the years. Many who would have been nuclear physicists and astronauts would end up as health workers or carpenters.Let’s come together and advocate for a ban on the use of these and many other similar products. Let’s protect our most treasured asset in life, our very future – innocent children.
Case HistoriesCase 1: A 22 months old infant was brought into casualty with sudden onset of difficulty in breathing and frothing from the mouth. There was no history of foreign body ingestion or choking on food or drink. No convulsions. The mother attributed it to polio vaccination which the child had received a few hours earlier during the National Immunization Day. On further questioning, the mother said she had been giving the child haarlemensis for three days for flu. They kept no insecticides/ pesticides at home.On examination, the baby was well nourished, drowsy, with constricted pupils which were reactive to light. The child was frothing from the mouth, tachypnoec and had bilateral crepitations and wheezes. Saturation in oxygen per face mask was maintained above 90%. The chest x-ray showed bilateral basal infiltrates. Throughout the admission, she was apyrexial.The baby improved on oxygen supplementation, intravenous fluids, bronchodilators, steroids and cotrimoxazole. She was discharged two days after admission.
Case 2: A seven week old child was brought into the hospital around 01h00 with generalized convulsions that had started the previous day around 23h00. The baby was not sucking well and was crying continuously.There was no history of birth trauma or any other injury preceding the convulsions. The baby had been delivered normally in the same hospital with a birth weight of 3150g and an apgar score of 8, 9, 10. There was no
127
history of neonatal convulsions, neonatal jaundice or feeding problems since discharge from hospital.For more than 2 weeks, every day prior to presentation, the mother was giving the baby gripe water for colicky and haarlemensis for blocked nose, chest congestion and to protect the baby from bad spirits as is the norm in her culture.On examination, the child was fitting continuously, was very irritable and had a high pitched cry. She had a fluctuating level of consciousness. The fontanel was soft and not bulging, and the muscle tone was normal. There was no neck stiffness. The baby was afebrile, well nourished and well hydrated. The destrostix was normal (8mmol/L). The C.S.F. was normal. The fits were controlled with diazepam and phenobarbitone, and by day 2 they had stopped. On day 4 she was discharged.
Haarlemenesis (Haarlemensis Olie)1. What is it?
Manufactured by: Pharma care Limited7 Fairclough Road/-weg 7Port Elizabeth, 6001
For the treatment of kidney and bladder complains. An over-the–counter (OTC) drug dispensed in 20ml bottles. 5mls of haarlemensis contain the following: Balsam sulphuris base 1, 730ml Arachis oil 2,015mlTar 0.163gTurpentine oil 1,250ml
The recommended dose is 15 drops (1ml) in milk or wine at bedtime.Store below 25 C. Keep out of reach of children.
Home use of haarlemensis in BotswanaHaarlemensis is widely used in the community. Among the people who testified to its use included a pharmacist, Senior Nurses and Laboratory Scientists in Bamalete Lutheran Hospital. Also admitting to have used
128
haarlemensis were mothers of children who were admitted to the Paediatric Ward and mothers who brought their children to the hospital out-patient department. They said the medicine is given to all newborn babies along with gripe water, Jamaica, groen amara, drop etc in the first month of life and beyond. These remedies have been used by the community for generations. The doses vary from a drop in milk to a teaspoon (5ml) orally three times a day. Sometimes drops of haarlemensis are added to the babies’ bath water.
Among the reasons for the use of haarlemensis were the following:(i) Treatment of cough, flu and chest congestion.(ii) Colicky and cleansing of baby’s digestive system(iii) Treatment of urinary tract infections, especially bloody urine.(iv) Treatment of and prophylaxis against fontanel related
problems.(v) To protect baby against evil spirits, evil women who carry out
abortion, spirits of all aborted babies, “baloyi“ etc especially when the new born baby is taken to public places like clinics and hospitals.
Some of the people interviewed said they still used haarlemensis despite knowledge of the fact that at least 2 infant deaths occurred in the past on the paediatric ward, allegedly due to haarlemensis overdose/toxicity. They always use it carefully. Even after being made aware of the two children presented above they still said they would continue using it because this remedy has been handed down several generations before them. The medicine is usually prescribed by grandmothers.
Discussion:Turpentine Toxicity:One of the major toxic ingredients in haarlemensis is turpentine. A distillate of pine wood, turpentine is a volatile hydrocarbon containing different terpeners, and is used as a paint thinner and household solvent. It is also used as skin irritant for granulomatous skin lesions like warts and has an undeserved reputation as an abortifacient. Ingestion of 15g of a
129
volatile oil such as turpentine has caused fatal poisoning. The threshold limit value (T.L.V.) for turpentine is 100ppm. Pathophysiology: - Volatile hydrocarbons solubilize the lipid surfactant layer leading to alveolar instability, distal airway closure, ventilation/perfusion (V/Q) mismatches and subsequent hypoxaemia, histopathologically there is interstitial inflammation, artelectasis, hyperemia, vascular thrombosis, bronchial and bronchiolar necrosis, intra alveolar hemorrhage, edema, polymorphonuclear exudates and formation of hyaline membranes thought to occur secondary to direct alveolar and capillary damage by the hydrocarbon. This may lead to haemorrhagic-bronchopneumonia, pulmonary edema and adult respiratory distress syndrome (ARDS) rapidly within 24 hours. Pleural effusions, pneumothorax, pneumomediastinum and pneumatoceles may later develop.Clinical presentation: Turpentine primarily affects the pulmonary, central nervous system (CNS) and gastrointestinal (G1) system. Symptoms and signs of aspiration include gasping, coughing, gagging and choking. Respiratory signs include tachypnoea, persistent cough, rales, rhonchi, wheezing and usually resolve by the second or third day.CNS presentations are mainly due to aspiration-induced hypoxia, These may include lethargy, irritability, dizziness, confusion, excitement, seizures, stupor and coma.GI symptoms are common but are usually minor. They include burning in the mouth and oropharynx, nausea, vomiting and abdominal pain. Haematemesis may occur. Myocardial injury is rare. Turpentine ingestion can also cause hemorrhagic cystitis, glomerulonephritis, hematuria and albuminuria and imparts an odour of violets to the urine. Fever is present in approximately 30% of patients with aspiration pneumonitis, probably secondary to direct pulmonary tissue damage. The fever occurs within the first 24 hours and subsequently resolves.
130
Laboratory findings:
1. Arterial blood gas shows hypoxemia secondary to V/Q mismatch and/or hypercabia secondary to progressive respiratory failure.
2. Leukocytosis present within the first 48 hours not related to bacterial infection.
3. Chest X-ray changes may appear as early as 20 to 30 minutes, or as late as 24 hours after aspiration. Bilateral basilar infiltrates, right basilar infiltrates and fine perihilar densities are the most commonly reported patterns of hydrocarbon aspiration. Segmental atelectasis and localized air trapping are commonly seen, while pleural effusion, areas of consolidation, pneumo-medicistinum and pneumothorax are much less common. Asymptomatic pneumatoceles may appear in a small number of children 3 to 15 days post-ingestion, resolving in several weeks to months without any complications.
Management: Mainly conservative and supportive with oxygen and bronchodilators, while patient is on an ECG monitor and pulse oximeter. Chest X-ray is done for respiratory symptoms.
Ipecac - induced emesis and activated charcoal are not indicated. Steroids and prophylactic antibiotics have not been found to improve outcome. Surfactant may be helpful because of hydrocarbon’s ability to destroy surfactant. Epinephrine and isoproterenol theoretically may induce ventricular dysrrhythmia because of halogenated hydrocarbon’s sensitization of myocardium and should probably be avoided unless required for basic resuscitation.
Global use of Traditional or complementary/Alternative MedicineBotswana is not alone in the use of complementary/alternative medicine (CAM), the use of which dates back more than 2000 years ago the world over. Jesus used figs to cure Ezekiel of chronic boils (Isaiah 38:21) and he restored a blind man’s sight by the use of mud (John 9:7). Extensive research in Britain and Egypt is rejuvenating the use of honey and
131
maggots in the management of necrotic ulcers and multidrug-resistant staphylococcus aureus infections. Over 50% of people in Europe, North America and other industrialized regions admitted to have used CAM at least once. In San Francisco, London and South Africa, 75% of people living with HIV-AIDS use CAM. In Africa, up to 80% of the population uses traditional medicine for health care. In Ghana, Mali, Nigeria and Zambia, the first line treatment for 60% of febrile children with malaria is herbal medicine at home. Acupuncture and Artemisia have taken the world by storm.However unregulated or inappropriate use of traditional medicines and practices can have negative or disastrous effects. A Chinese slimming herb “Ma Huang” caused at least a dozen deaths, heart attacks and strokes in the U.S.A. A similar slimming portion used in Belgium resulted in at least 70 people requiring renal transplants or dialysis. Counterfeiting of drugs or inadequate quality control have caused problems in Nigeria, South East Asia and the Americas. In 2002, Zimbabwe recorded 27 episodes of “muti” poisoning leading to renal failure in some of them. In the early 1980’s, again in Zimbabwe, high salicylate levels in “nhova muti” caused severe metabolic acidosis, dehydration, electrolyte imbalances and even death in children. Fatal carbon monoxide poisoning have occurred across Southern Africa from “smoking-out” evil spirits and ill health in both children and adults.Drug-drug or drug-herb (or CAM) interactions are an important cause of toxicity or failure of HAART. St John’s wort, a herb used for the management of psychosomatic disorders affects pharmacokinetics of certain anti-retro virals. Concurrent use with protease inhibitors (P1s) or NNRT’s may result in sub-optimal antiretroviral drug concentrations, leading to inadequate virological response, and consequently the potential for resistance or class cross–resistance. Garlic interacts with P.1s. Hypoxis (African Potato) has negative effects on HIV disease progression. Contamination with toxic metals or pathogenic microbes, poor quality, inappropriate use or incorrect dose lead to various side effects from CAM.
132
The way forwardThe least we can do to secure good health for future generations is to weed out the toxic portions and monitor the rational use of the beneficial medicines, or at least the placebos, that are in circulation today. Effective pharmacovigilance of CAM presents a difficult challenge to all stake holders in their development, manufacture, prescription and utilization. Legislators, politicians, health workers, business and community leaders should all work together to protect the end-users, especially innocent children. Turning a blind eye to the ill-effects of haarlemensis and some similar toxins is conspiracy to murder. Conceited efforts by all of us will help us attain health’s Millennium Development Goals which include:
(i) Fewer women dying in child birth.(ii) More children surviving the early years of life.(iii) Dealing with catastrophe of HIV/AIDS.(iv) Making sure people have access to life-saving drugs.(v) Better health to ensure poverty reduction.
Economists will tell us that there is no better return on investiment than giving our children a decent future.FUNGAL SEPSIS IN A NEONATAL UNIT: RISK FACTORS, LABORATORY FINDINGS, FUNGAL SPECIES AND CASE FATALITY RATES.
F. Nakwa1, S. Velaphi1, J. Wadula2, M. Khoosal21Department of Paediatrics, 2Department of Microbiology-National Health Laboratory Services; Chris Hani Baragwanath Hospital and the University of the Witwatersrand
IntroductionCandida species are increasingly important pathogens in the neonatal unit especially with the advent of advanced care of the neonate. Premature infants are highly susceptible to developing invasive Candida infections; firstly due to their immature immune system; secondly due to prolonged stay in the neonatal intensive care unit (NICU). Candida species causing septicaemia vary from unit to unit. Some units have reported Candida albicans as a common pathogen, whilst others have reported that the pendulum has swung with Candida parapsilosis becoming more common.
133
Fungal sepsis is associated with a substantial morbidity and mortality. The mortality seems to vary with different species. In our unit, it has been our impression that the number of cases with Candida sepsis have increased over the last few years. The aim of the study was to determine the incidence, risk factors and laboratory findings in cases with positive Candida blood cultures and to determine case fatality rates of different Candida species causing neonatal sepsis.
MethodsThis was a retrospective descriptive study. The patients were identified by a computerized microbiological database. The records of infants with positive blood or cerebrospinal fluid (CSF) fungal culture whilst admitted to the neonatal unit from January 2002 to December 2004 were reviewed. In order to determine risk factors, the characteristics i.e. the birth weight, gender, gestational age, human immunodeficiency virus (HIV) status, age of onset, diagnosis and medical interventions were compared to a 114 infants who had a positive bacterial culture due to gram negative organisms. These were selected as a convenient sample as data was previously collected as part of another study. The infants who had gram- negative sepsis were captured between January 2003 and December 2003.Results A total of 151 patients had positive fungal cultures over the three-year period (January 2002 – December 2004) as identified by the database. One hundred (66%) patient records were retrieved and reviewed. The incidence over the three-year period increased with an overall incidence of 8.6 per 1000 admissions (Table 1). There was an increase of 33% in the incidence rate from 2003 to 2004.
Table 1 Distribution of positive blood and CSF cultures due to fungi over a three year period.
Number Admissions Incidence* 2002 30 3818 7.90
134
2003 30 3879 7.732004 40 3892 10.33 year period 100 11589 8.6
* - Number/ 1000 admissions
On comparing the group that had fungal sepsis to those who had gram-negative sepsis, the group that had fungal sepsis was significantly smaller, (p = 0.002) and had a lower gestational age (p = 0.003), and were significantly older/age at onset (p-value < 0.001) than the gram negative group. However, there was no difference in gender and maternal HIV status between the two groups (Table 2).
Table 2 Demographics of infants with fungal sepsis compared to those with gram negative sepsis.
Fungi Gram Negatives
P-value
Birth weight 1265(660-3300)
1490(780-3980)
0.002
Gestational age 30(23-40)
32(25-42)
0.003
Gender- Male- Female
57%42%
61%37%
0.592
Maternal HIV- Positive- Negative- Unknown
28%56%16%
39%46%15%
0.251
Age at onset 16 (1-86) 7 (1-83) <0.001
In identifying risk factors, the use of central lines (p-value <0.001), second line antibiotics (p-value 0.026) and the use of parenteral nutrition (p-value <0.001) was significantly greater in the fungal sepsis group than the gram negative sepsis group (Table 3).
Table 3 Use of central lines, second line antibiotics and parenteral nutrition between the two groups.
Fungi Gram Negatives
p-value
Central lines 56% 32% <0.001Second line antibiotics- Tazocin + Amikacin- Meropenem
38%34%
16%3%
0.026
135
- Other antibiotics 24% 9%Parenteral nutrition 76% 17% <0.001
The first full blood count (FBC) and c-reactive protein (CRP) taken at the time of the septic work-up i.e. when the blood that yielded positive blood culture was taken showed significant difference in white cell count (p<0.001) between the two groups (Table 4). On repeat FBC, both white cell count and platelets were lower in the gram negative sepsis group, and CRP was higher among the gram negative sepsis group (Table 5). But not all patients with positive blood cultures had a repeat FBC and CRP.
Table 4 Laboratory findings among patients with fungal and gram-negative sepsis.
* - % of patients who had repeat bloods- 1st number for FBC and 2nd number for CRP
The common cause of fungal sepsis was found to be Candida parapsilosis (58%), followed by Candida albicans with 39% of cases (Table 6). The overall case fatality rate (CFR) in the neonatal unit due to fungal sepsis was 20%. The CFR was higher in the Candida albicans group (26%) followed by Candida parapsilosis with a rate of 16%.
Table 6 Different fungal species and their case fatality rates (CFR)
DiscussionThe incidence during the three-year period increased by 33%. This increase could be due to an improvement in survival of smaller and sicker preterm infants exposed to invasive therapies for longer periods. This study also confirms the known risk factors for Candida sepsis which are: low gestational age, low birth weight, the use of parenteral nutrition, central vascular access and the use of second line antibiotics. The low platelet count in the gram-negative sepsis group as compared to the fungal group is a surprise finding and differs from previous studies, which reported thrombocytopaenia as a sign of Candida infection. This needs to be treated with caution as fewer patients in the gram-negative sepsis
137
group had a repeat full blood count compared to the group with fungal sepsis (59% vs 89%). The common Candida species isolated in our unit was Candida parapsilosis. This is different from other studies where neonatal units have reported Candida albicans as being the common species. Candida albicans was found to have a higher fatality rate than the other Candida species. It is a virulent organism that adheres and penetrates the endothelium much better than Candida parapsilosis. This could be a reason for the higher case fatality rate.
138
BACTERIAL PATHOGENS ISOLATED FROM INFANTS ADMITTED TO A NEONATAL UNIT: EMERGENCE OF RESISTANT BACTERIA.
S Velaphi1, F Nakwa1, J Wadula2, M Khoosal21Department of Paediatrics, 2Department of Microbiology-National Health Laboratory Services; Chris Hani Baragwanath Hospital and the University of the Witwatersrand
IntroductionNeonates acquire bacterial infection either from exposure to bacteria that colonize maternal genital tract or from exposure to hospital environment or community. Based on the above modes of acquisition, neonatal infections are often divided into early-onset (72 hours of life) and late-onset (>72 hours of life) sepsis. Bacterial infections are a major cause of neonatal mortality. Factors that contribute to high mortality related to infections include delays in starting antibiotics and using inappropriate antibiotics. To avoid deaths related to delays in starting treatment, antibiotics are often started empirically. The choice of antibiotics that are used empirically should be based on the common bacteria isolated in cultures from sterile sites obtained from sick neonates. The bacteria causing sepsis in neonates vary from unit to unit, therefore choice of empiric treatment will also vary. In our unit we currently use Penicillin G combined with Gentamicin for empirical treatment of early-onset sepsis (EOS) and Piperacillin/ Tazobactam (Tazocin) combined with Amikacin or Meropenem with or without Vancomycin to empirical treat late-onset sepsis (LOS). It is important to keep surveillance on bacteria isolated from neonates admitted to the neonatal unit so that empirical treatment can be adjusted appropriately. The objective of this study was to determine bacterial organisms causing EOS and LOS in infants admitted to Chris Hani Baragwanath (CHBH) neonatal unit.
MethodsRecords of positive blood and/or cerebrospinal fluid (CSF) cultures of patients who were admitted at CHBH from January 2002 to December 2004 were reviewed. These records were obtained from a computerized
139
blood culture database. Bacteria that were contaminants (Corynebacteria and Bacillus) or were considered to be most likely contaminants (Coagulase-negative Staphylococcus) were excluded. The cultures were divided into EOS and LOS groups.
ResultsThere were 1404 positive blood and/or CSF cultures (excluding Corynebacteria and Bacillus) over this three-year period. Five hundred and eighty nine (42%) of these 1404 positive blood cultures were due to Coagulase-negative Staphylococcus (CONS) and were therefore excluded and the remaining 815 positive blood cultures were considered as pathogens. Among the organisms that caused EOS, 67% were gram positive organisms compared to 71% being gram negatives among the organisms that caused LOS (Table 1).
Table 1 Organisms causing early- and late-onset sepsis in neonates (n=815)
Organisms causing Late-Onset Sepsis 502 - Gram Positive Organisms 148 (29%) - Gram Negative Organisms 354 (71%)Date of birth no recorded 44
The specific bacteria causing EOS are listed in Table 2, and the common ones were Group B Streptococcus (GBS) (35%), Streptococcus viridans (14%), Escherichia coli (E. coli) (10%) and Pseudomonas species (sp.) (9%) and these were spread out through the 3 year period except for Pseudomonas which were clustered in 2002 (Table 3). All GBS were fully sensitive to Penicillin or Ampicillin, 91% of Streptococcus viridans were sensitive to Penicillin (Table 4). All E. coli causing EOS were sensitive to Gentamicin but 72% were resistant to Ampicillin. Thirty five percent of Staphylococcus aureus isolated in patients with EOS were methicillin resistant Staphylococcus aureus (MRSA) and 64% of Klebsiella sp. were producing extended spectrum beta lactamases (ESBL).
140
141
Table 2 Bacteria causing early onset sepsis (n= 269)Organisms n (%)Group B Streptococcus 94 (35)Streptococcus viridans 38 (14)E. coli 28 (10)Pseudomonas species 23 ( 9)Staphylococcus aureus 22 ( 8)Enterococcus species 18 ( 7)Klebsiella species 11 ( 4)Acinetobacter species 10 ( 4)Enterobacter species 8 ( 3)Other Streptococci 9 ( 3)Other Gram-negatives 8 ( 3)
Table 3 Distribution of organism causing early-onset sepsis over the three year period.
The common organisms causing LOS were Klebsiella sp. (30%), E. coli (13%), Staphylococcus aureus (9%) and 8% of each of Streptococcus viridans, Enterococcus sp., and Acinetobacter sp. (Table 5). Seventy four percent of Klebsiella sp. and 14% of E. coli were producing ESBL (Table 6), 84% Staphylococcus aureus causing LOS were MRSA and 54% of Streptococcus viridans were resistant to Penicillins therefore needed to be treated with Vancomycin.
Discussion Common bacteria causing EOS were found to be GBS, Streptococcus Viridans and E. coli. All GBS and most Streptococcus viridans were sensitive to Penicillins. Seventy two percent of E. coli were resistant to Ampicillin therefore it should not be used for empiric treatment of E. coli. All E. coli were sensitive to Gentamicin. Therefore it is still appropriate to use a combination of Penicillin and Gentamicin for empirical treatment of EOS and these could be adjusted once the organism has been identified. One of the reasons for using Ampicillin is to cover for Listeria Monocytogenes, but this organism was isolated only once over the three year period in our unit. Klebsiella- ESBL and MRSA were isolated in infants with EOS. This emergence of resistant organisms as a cause of EOS is of major concern as these are often not covered by the currently used empiric antibiotics as they are expected to be rare in the community
143
outside the hospital environment. Among the neonates that develop LOS, one needs to consider resistant organisms. Hence, the use of Meropenem and Vancomycin would be appropriate. Klebsiella ESBLs are the common bacteria in infants with LOS therefore one must have low threshold to start Meropenem as most of them are resistant to Amikacin and Tazocin. The major concern about using Meropenem empirically is the cost and the possible emergence of resistance as it is currently the last line of antibiotics against bacteria producing ESBL. Therefore its use must be restricted to reduce chances of the organisms developing resistance against it. In our unit, we currently use Meropenem for patients who have positive blood or CSF culture due to an ESBL-producing organisms or for patient who have cardio-respiratory decompensation or have been on Tazocin and Amikacin within the last 72 hours. It is imperative to have ongoing laboratory surveillance for positive cultures as this will enable one to identify a change in the organisms causing sepsis in the unit or the emergence of resistant bacteria. This will aid in choosing the appropriate empiric antibiotics.
144
MAGNESIUM SUPPLEMENTATION IN PREGNANCY: DOES IT REDUCE THE INCIDENCE OF HYPOXIC ISCHAEMIC ENCEPHALOPATHY?
V. Harrison, S. Fawcus, P. Strydom, D. Harrison, K. Stone, G. Peat. Mowbray Maternity Hospital, Guguletu Midwife Obstetric Unit, and University of Cape Town
Introduction Hypoxic Ischaemic Encephalopathy (HIE) resulting from perinatal hypoxia is a major public health problem in developing countries; thus its prevention constitutes a major challenge. HIE may be caused by a major intrapartum insult, but in addition ‘antenatal vulnerability’ in some fetuses predisposes them to the development of HIE. This ‘antenatal vulnerability’ is poorly understood and needs to be further explored.
The observation of an increased incidence of HIE in poor newly arrived urban dwellers in informal settlements around Cape Town, suggests a possible nutritional cause. The hypothesis is that dietary deficiency of magnesium in pregnant women predisposes to HIE of the newborn. This is supported by previous research conducted at Mowbray Maternity Hospital (MMH) which demonstrated an association between magnesium deficiency in pregnant women and subsequent HIE of the newborn. In Guguletu township, for women utilizing the services of Guguletu Midwife Obstetric Unit (MOU) and its referral hospital, Mowbray Maternity Hospital (MMH), the incidence of HIE was estimated to be 2% of all deliveries in 2000.
Aim of StudyTo investigate whether magnesium supplementation in pregnancy would reduce the incidence of Hypoxic Ischaemic Encephalopathy (HIE) and influence other markers of perinatal hypoxia.
Study Population & MethodsThis was a double-blind placebo-controlled randomised trial. Pregnant women, booking at Guguletu Midwife obstetric unit, were randomised into a magnesium supplemented group, or a placebo group for the duration of
145
the pregnancy. Magnesium levels were monitored in a subgroup to monitor compliance. The study was conducted during 2001 to 2003. The magnesium supplement was 128mgms of slow release magnesium stearate daily.
Data CollectionBasic demographic data and details of antenatal care, labour and delivery were collected. The primary outcome to be measured was the incidence of HIE of the new born in each group. Secondary outcomes measured were: (1) Full-term stillbirths; (2) Low Apgar (1 min <4 and 5 mins <6); (3) Fetal distress (late decelerations); (4) Meconium Aspiration Pneumonia.
Sample SizeBased on 2000 Estimate of HIE in GMOU of 2%.Number required to obtain 80% power for 50% reduction = 4372.Allowance for drop out rate 2%.Total sample required = 4459 women.
ResultsThe magnesium supplemented group consisted of 2016 pregnant women, and the placebo group 2066. The supplemented group showed a significant rise in red cell magnesium levels during pregnancy compared to controls (see Table 1).
Comparison of Groups: CompliancePLACn = 1238
MAGn = 1159
Chi-square P
Magnesium pre-levelmmol/l
171.68 171.73 0.0 0.949
n = 739 n = 751Magnesium post-levelmmol/l
168.96 175.42 72.91 0.0001
Number of tablets takenMean 50.7 49.9 0.47 0.493SD 35.5 35.5Median 52.0 51.5Range 0 - 320 0 – 260
146
Demographic CharacteristicsThere was no significant difference between the two groups with respect to:Age (mean age =25yrs);Parity (mean parity 0.8);Marital status (75% single);Employment (68% unemployed);Residence in childhood (60% rural);Housing (51% shack dwellers).
Antenatal/Labour CharacteristicsThere were no significant differences between the two groups with respect to:Use of traditional medicines/herbs;Smoking/alcohol use;Antenatal complication;HIV/VDRL status;Referral in labour;Length of labour;Caesarean section rate.
The incidence of major obstetric complications known to be associated with perinatal hypoxia was similar in both groups (see Table 2). Table 3 shows the overall pregnancy outcomes for each group. Of interest, is that the frequency of preterm birth was similar in both groups. The increase in neonatal deaths in the supplemented group was accounted for by an increased frequency of rare congenital anomalies eg. thanatophoric dwarfism, anencephaly. No woman had supplementation during the first trimester and therefore this would not have affected organogenesis.
** This is mostly due to fetal distress / abnormal CTG
The overall incidence of HIE was 1-2% and it occurred in 22 in the placebo group compared to 16 in the supplemented group (non significant difference). Compared to placebo, the supplemented group had fewer full
148
term stillbirths, fewer infants with meconium aspiration syndrome, fewer infants with low Apgar scores and had less abnormal CTG recordings in labour.194 mother/baby dyads of the placebo group had at least one of the above markers of perinatal hypoxia, compared to 127 of the supplemented group (p value 0.0002, highly significant).
Discussion and ConclusionsThe overall incidence of HIE was less than predicted, so the sample size lacked sufficient power to demonstrate an association between magnesium supplementation and HIE.However, magnesium supplementation was associated with a significant reduction in term stillbirths and also negatively influenced other markers of perinatal hypoxia.This study suggests there could be an association between magnesium supplementation and reduced markers of perinatal hypoxia. The effect could be mediated via uterine activity or by influencing neural stability in the fetus/neonate. However, it would need to be repeated with larger numbers before any definite recommendation can be made about routine supplementation in pregnancy.
149
IMPLEMENTING ON-SITE TESTING FOR SYPHILIS IN BOLAND/OVERBERG REGION: CONSTRAINTS ENCOUNTERED AND LESSONS LEARNT
Introduction Feedback was given to the regional office on findings of PPIP and a recent study of obstetric services in the Boland/Overberg Region (BOR). We realized that something had to be done to improve our obstetric services. BOR was ready to take action and identified some focus areas. One of the focus areas in antenatal care was syphilis rapid tests.
Report findings specific to syphilis:1. Syphilis rate for BOR is 6-8%.2. Syphilis testing was not done on many patients.3. In some cases blood was taken, but the results were not
recorded.If you take a blood sample in the BOR, the samples go to Worcester or to the NHLS in Cape Town.
4. Of those patients with positive results, some were not treated.Some institutions receive the results, but antenatal patients do not follow up, due to traveling problems, especially in the rural areas. In some rural areas, the mobiles do their visits every 4-6 weeks. This means that patients have to wait for their results or visit the clinic in town for treatment.
ResultYou waste a lot of time before you treat for positive syphilis and at the end it results in a high rate of untreated syphilis with all its implications on the pregnancy.
150
The pros and cons of the laboratory and on-site testTest Benefits DisadvantagesLaboratory test No procurement of tests
No responsibility for doing the test itself
Results not immediateTime consuming to seek for results, fill in forms and blood tubesTime lost before treatmentHigh costs if one does RPR screening, titre and TPHA(RPR screening R13,60 RPRtitre R21,70 TPHA R59,50)
On-site test Cost effective R14,81Results immediateTreat immediatelyTime sparingTest specific for Treponema PallidumNurses familiar with Rapid HIV test, which is very similar to this test
Short expiry date Not on tender at CMDA buy-out item (procurement effort) Making a mind set, not receiving a titreMuch training to do
The decision in the BOR was then to proceed with the on-site test, based on the costs and the quick results.
Investigation of different on-site tests was done1. The test that suited us best, was the Syphilis Rapid test.2. The other option was to institute on-site RPR testing; this is
cheaper per test (R1,00), but is much more involved, and needs a centrifuge and agitator at each centre.
Implementation of the on-site syphilis testing1. To do the procurement of the tests, we had to involve the
regional finance officer, the pharmacists and persons responsible in the hospitals in drawing up the procedure for ordering the tests.
2. Sessions with staff were arranged in the five sub districts: to introduce the on-site test to them; to give training on how to use the test (organized the
ABBOT rep to assist with the training sessions).3. Training was also given at different clinics on how to use the
test.
151
4. Out of the 55 clinics where antenatal services is rendered, the rapid test was initially implemented at 26 clinics.
5. The estimated number of tests was determined by the number of deliveries per facility.
Constraints encountered1. Shortcuts reduced the accuracy of the tests:
i. by dropping the blood directly onto the strip versus drawing it up into a capillary tube and then dropping it onto the strip, can produce different results;
ii. trying to shorten the time before reading the results can make a difference.
2. Ensuring supply to all centres. 3. Procurement problems – because of the fact that syphilis rapid
test is not on code at CMD (Cape Medical Depot), every hospital, had to open an account at Abbott.
4. Refrigeration – tests should be kept between 2-30oC. The mobiles have to take cooler boxes with them.
5. Some sisters/clinics did not use the capillary tubes. Whole blood or plasma specimens that do not containing anticoagulants, or containing anticoagulants other than the EDTA capillary tube, may give incorrect results.
6. Buffer – to get the correct amount in every drop, keep the bottle perpendicular. If the drop is too big, then the bottle will not last for the 100 tests and if the drop is too small, the flow through the conjugate pad would be a problem.
7. It required a mindset change to do the test and act immediately on it. Some staff experienced difficulty in understanding the difference between the laboratory test and the syphilis rapid test. Some were inclined to want a titre before they can act on the results/the positive syphilis.
8. Reading the results – the test results is positive even if the patient bar appears lighter or darker than the control bar.
152
9. Expiry date – Abbott gave a very short expiry date.Lessons learnt1. On-going support of staff is necessary.2. Keep an open line to everyone that works with antenatal patients,
including private doctors, clinic sisters, health workers, etc.3. It is possible to know the syphilis status of all patients. There is no
excuse for an unbooked patient to be discharged without a syphilis test being done and acted on.
4. One cannot assume that things run smoothly. One has to do follow ups regularly.
Sensitivities and Specificities of the test (Japan)Whole blood plasma
Conclusion1. Reduction of the unknown syphilis results will be tracked by PPIP
2.2. Having the test on code at the Cape Medical Depot, will reduce
many of the current procurement obstacles.3. Understanding and interpreting the difference between the
laboratory and syphilis rapid test will make acting on it much easier. The syphilis rapid test, tests specifically for Treponema pallidum and the RPR/VDRL laboratory tests are nontreponemal tests.
4. The syphilis rapid test reduces workload and is not an added burden on the stretched nursing staff. One can combine the rapid syphilis and HIV test, get the results and act on it. To screen and treat if needed, can contribute to work satisfaction as well.
153
INTERVENTIONS FOR LEG OEDEMA AND VARICOSITIES IN PREGNANCY. WHAT EVIDENCE?
Bamigboye, Anthony Akinloye Mediclinic Private Hospital
BackgroundLeg oedema, not associated with preeclampsia, is found in about 80% of all pregnancies. Varicosity may affect about 40% of pregnant women which may involve the saphenous system and small superficial vessels in the legs. It may also involve the haemorrhoidal and vulvar network. This may be due to several factors: an increase in fluid volume, an alteration in venous smooth muscle tone, and increased pressure within the veins caused by the gravid uterus reducing venous return from the lower body, decreased colloid osmotic pressure of plasma and a hereditary predisposition. Though leg oedema arising solely from venous insufficiency is not in itself dangerous, it can cause women symptoms such as pain, feelings of heaviness, night cramps and paraesthesiae leading to anxiety and to seeking treatment. Leg oedema is one of the common features of pre-eclampsia, with raised blood pressure and proteinuria. Pre-eclampsia being one of the most dangerous obstetrics conditions, physicians cannot ignore pregnant women who complain of leg swelling.Treatments used for leg oedema and varicosity include leg elevation, bed rest, whole body water immersion and elastic compression stockings. Medical preparations used in periphereral vascular disease such as oxerutines (Rutoside) have been tried. Injection treatment of varicose veins during pregnancy is futile and harzardous. Vascular surgery can be performed during the first and second trimester but vein stripping is often delayed until after the pueperium.
ObjectivesTo assess, using the best available evidence, any form of intervention used to relieve the symptoms associated with varicosity in pregnancy and to reduce leg oedema in pregnancy.
154
Criteria for considering studies for this reviewTypes of studiesAll randomised trials examining the effects of treatments for varicosity and treatments for leg oedema.
Types of participantsPregnant women suffering from symptoms of varicosity (venous insufficiency) or pregnant women with leg oedema.
Types of interventionsLeg elevation at night.Restriction in daily domestic chores.Use of vascular medications eg oxerutines.External pneumatic compression stockings.Immersion in water.Swimming.Reflexology/physiotherapy.Injection of sclerosant.Stripping of varicose veins.
Types of outcome measuresReduction in leg symptoms.Reduction in leg volume.Reduction in leg varicosity.
Search strategy for identification of studiesThis review drew on the search strategy developed for the Cochrane Pregnancy and Childbirth Group as a whole. The Group's trials register is maintained by the Trials Search Co-ordinator and contains trials identified from:1. quarterly searches of the Cochrane Central Register of Controlled
Trials (CENTRAL);2. monthly searches of MEDLINE;
155
3. handsearches of 30 journals and the proceedings of major conferences;4. weekly current awareness search of a further 37 journals.Trials identified through the searching activities described above were given a code (or codes) depending on the topic. The codes were linked to review topics. The Trials Search Co-ordinator searched the register for each review using these codes rather than keywords. Date of last search: October 2004.Methods of the reviewTrials under consideration were evaluated for methodological quality and appropriateness for inclusion according to the pre-stated selection criteria. Individual outcome data were included in the analysis if they meet the pre-stated criteria in 'Types of outcome measures'. Included trial data were processed as described in the Cochrane Reviewers' Handbook 4.Trials that meet the eligibility criteria were assessed for quality using the following criteria:1. Generation of random allocation sequence: adequate, inadequate, unclear.2. Allocation concealment: A = adequate; B = unclear; C = no information.3. Blinding of participants: yes, no, inadequate, no information.4. Blinding of caregivers: yes, no, inadequate, no information.5. Blinding of outcome assessment: yes, no, inadequate or no information.6. Completeness of follow-up data (including any differential loss of
participants for each group): A = less than 3% of participants excluded; B = 3 to 9.9% of participants excluded; C = 10 to 19.9% excluded; D = 20% or more excluded; E = Unclear.
7. Analysis of participants in randomised groups.Data were extracted from the sources onto data extraction forms. Data were entered onto Review Manager (RevMan 2000), checked for accuracy, and analyzed as above using the RevMan software. Meta-analyses was performed using relative risks as the measure of effect size for binary
156
outcomes and weighted mean differences for continuous outcome measures.
Fixed effects meta-analysis was used for combining study data if the trials were judged to be sufficiently similar. Heterogeneity was investigated by calculating the I2 statistic.
Description of studiesNine studies were identified and only four met the inclusion criteria; allocation concealment in all four studies were judged to be adequate. The rutoside study (6) was the only study which was primarily concerned with improving symptoms. Active drug (rutoside) and placebo capsules were identical in appearance. Bottles were labelled with randomly selected numbers not revealed to the investigator until the end of the trial. Participants were 69 women in the Netherlands at 28 weeks gestation. 300mg rutoside three times daily for 8 weeks were randomnly given versus placebo. The outcome was subjective, response to treatment judged by reduction in pains and paraesthesiae and reduction in ankle circumference.In the compression study, participants were 35 healthy women with normal pregnancies in Utah, USA with ankle oedema. The intervention was external pneumatic intermittent compression (EPIC) for 30 minutes resting in the left lateral position versus 30 minutes resting in the left lateral position. Leg volume was calculated from a formula using four circumference measurements taken immediately after the 30 minutes treatment and again 10 minutes later after a walk. Only the last set of figures, i.e. after the walk, is included in this review.Reflexology study, a single-blind study compared two different reflexolgy techniques with a period of rest on symptons of oedema. Pregnant women from 30 weeks of gestation with visible edema of ankles and feet were randomised. The statistical tests reported mainly compared findings after versus before the procedure, rather than comparisons between the groups. The outcome measures were objective ankle and foot
157
circumference measurements, mean scores on stress, tension, anxiety, discomfort, irritability, pain and tiredness levels. Mean wellbeing scores among the three groups were also assessed. Questionnaire responses to 'not feeling relaxed' and 'feet not improved' between lymphatic and relaxing reflexologies were analysed.Thaler studied prophylaxis with compression stockings and enrolled women with with uncomplicated pregnancies at less than 12 weeks gestation. A non-stocking group was compared with two groups of different classes of stocking pressures on either legs. The stockings were later reversed between the two legs. Stockings were worn to term. The outcomes were emergence of varicose veins and leg symptoms during the course of the pregnancy.
Methodological quality of included studiesThe Rutoside study was a placebo-controlled trial. Randomisation was adequate and the assessors were blinded at completion of the trial. The compression study used a random number table but further details are lacking. We cannot tell whether the measurers were blinded.The reflexology study, was single-blinded but with very small patient numbers which made it difficult to draw convincing conclusionsThe prophylactic compression study, was a prospective partially blinded randomised controlled study. Randomisation was adequate.
Results1. Rutosides significantly reduced symptom scores for pain, feelings of
heaviness and/or tiredness, nocturnal cramps and paraesthesiae compared with placebo in women with visible varices and such symptoms after 28 weeks gestation (Relative Risk 0.54 CI 0.32, 0.89). Rutosides also led to a reduction in ankle size of a mean of 0.55cm at a time when ankle size increased slightly in the placebo group (Incomplete data - the mean was not given hence outcome was not included in the final analysis). However, given that only 37
158
women received active treatment, the power of the study could not assess the safety in pregnancy.
2. Compression (EPIC) led to a non significant reduction in leg volume immediately after 30 minutes treatment in women after 34 weeks who had ankle oedema (Weighted Mean Difference -258.80 (-566.91, 49.31) (Fig 2).
3. In the study that compared the effect of lymphatic and relaxing (placebo) reflexologies (Fig 3), there was no significant difference in terms of feeling of relaxation. One out of 18 women felt no improvement in feet symptoms in the lymphatic group versus 2 out of 15 women in the relaxing group (6% versus 14%).
4. Compression stockings do not prevent the emergence of varicose veins, (Fig 5) but do improve leg symptoms (Fig 4) (Relative Risk 0.74 95% Confidence Interval 0.59,0.93)
DiscussionThis review unfortunately can provide very little guidance to pregnant women or their caregivers. The commonest treatments for venous insufficiency in pregnancy are compression hosiery and elevation of the feet. Neither of these methods has been adequately assessed.Though rutosides appear to help women suffering from venous insufficiency both with symptoms and with ankle swelling, it is not yet clear whether the drug is safe enough to use in pregnancy. O-Beta-hydroxyethyl rutoside is a semi synthetic compound which relieves leg symptons of varicose veins. The mode of action is probably based on a direct effect on the capillary wall as well as capillary functions.External pneumatic stockings led to a reduction in lower leg volume immediately after 30 minutes treatment. The effect of compression had already lessened in 10 minutes and it is not possible to know how big, if any, the effect would have been after a greater interval. The study does not report what women felt about the treatment nor whether they felt any benefit from the reduction in leg volume.
159
In the study of reflexology, the sample size was too small to be able to draw conclusions. Prophylactic compression stockings are useful in preventing/improving leg symptoms but do not prevent gestational varicosity.
Reviewers' conclusionsImplications for practiceRutosides helped relieve the symptoms of venous insufficiency in late pregnancy. However, there was not enough data to assess its safety in pregnancy and it can therefore not be routinely recommended.Compression stockings and reflexology showed a trend in improving leg symptoms and could be recommended in women with troublesome leg symptoms.
Implications for researchSimple mechanical interventions such as leg elevation should be studied. Further data on the effectiveness and safety of rutosides would be useful as the drug does appear to be useful in pregnancy.The role of water immersion and compression stockings need be evaluated in larger studies with adequate study power. As we do not know that oedema without pre-eclampsia is harmful, it seems more important to focus on symptom relief as an outcome. Women's views of their treatment could be considered the most relevant outcome measure. Neonatal outcomes should also be studied.Future studies should ensure adequate sample size and follow-up to provide reliable information to guide practice.
Figure 1 Rutoside versus placebo: no improvement in leg symptons
160
161
Figure 2 External pneumatic intermittent compression versus rest- change in lower leg volume
Figure 3 Lymphatic versus relaxing reflexology- not feeling relaxed.
Figure 4 Lymphatic versus relaxing reflexology: feet not improved
162
Figure 5 Prophylaxis of varicose veins using compression stockings: Emergent varicose veins
FIGURE 6 Prophylasix of compression stockings vs placebo- improved leg symptons
163
THE VALUE OF MID-TRIMESTER ULTRASOUND AT PRIMARY HEALTH CARE LEVEL.
Barbara van Dyk(University of Johannesburg)
IntroductionThe research project was designed to test the hypothesis that routine mid-trimester ultrasound screening could improve obstetric management and have a positive effect on perinatal outcomes in a third world population. Interest in the topic originated due to the discrepancy that currently exists between the private and public health care systems in the use of obstetric ultrasound. The National Maternity Care Policy underwrites the selective use of ultrasound for specific clinical indicators, thereby denying most pregnant women in South Africa access to routine ultrasound. Conversely, women in the private sector expect to be scanned at every antenatal visit, which is unnecessary and borders on abuse. The study aimed to compare the effect of routine ultrasound versus the selective use of ultrasound on a low-risk population in order to assess the potential benefits of a single routine scan. Taking into account that it is difficult to manage a pregnancy when the fetal age and pregnancy risk is not known, the emphasis of the study was on the following three objectives:
1. The availability of reliable menstrual histories in the study population.
2. The influence of ultrasound dating on antenatal management.3. The influence of ultrasound on early the detection and
management of high risk obstetric problems.
MethodologyA quantitative experimental research approach was followed in this randomised controlled trial. The study population consisted of 962 low-risk pregnant women, between 18–23 weeks gestation, who attended a primary health care clinic. Participation was voluntary and informed consent was obtained. Cluster randomisation was performed daily to avoid a feeling of discrimination amongst participants. Subjects were
164
randomised into an ultrasound (U/S) screening group and a control group with the aid of a small box containing six identical cards. Three cards were marked with an A and three with a B. If an A was picked the cluster was assigned to the ultrasound screening group and if a B was picked to the control group. The ultrasound screening group received a systematic scan followed by standard antenatal care. Ultrasound dating replaced dating by other methods. Participants in the control group were managed according to National guidelines and were eligible for a scan if clinical indications were identified. Clinical histories were obtained from the antenatal card and gestational age calculated by last menstrual period (LMP) or symphysis-to-fundal height measurement if the LMP was not known.
ResultsAn 84% successful follow-up was achieved and results from 804 participants were included in the analysis of which 416 were in the ultrasound screening group and 388 in the control group. Obstetric and demographic data were broadly similar, rendering the two groups suitable for comparison.
Assessment of the availability of reliable menstrual histories revealed that 33% of the study population were unsure of their last menstrual date. A further 33% in the ultrasound screening group, who claimed to be sure of LMP, provided an unreliable menstrual history when LMP and U/S dating were compared.
Table 1 Comparison of GA at delivery between LMP and U/S dating.
Gestational Age
LMP DatingU/SS Group(N = 416)
U/S Dating
U/SS Group(N = 416) P < 0.001Preterm 32 % 15 %
Term37 – 41wks
55 % 81 %
Post-term 6.5 % 2.6 %
165
Table 1 demonstrates that when GA was compared at the time of delivery, 55% of subjects delivered at term according to LMP dating compared to 81% who delivered at term according to ultrasound dating. This statistically significant difference proves ultrasound to be the more accurate predictor of the expected date of delivery. An analysis of the influence of ultrasound dating on antenatal management confirmed that there was a 50% post-term reduction in induction of labour (IOL) in the ultrasound screening group (p = 0.0497). In the control group, 56% of scans were requested for dating purposes at a mean gestational age of 30 weeks when ultrasound dating is no longer reliable.
The incidence of high risk obstetrical problems in the study population included the following: Two patients with placenta praevia in the ultrasound screening group
were referred to a Level 1 hospital for caesarean section. A patient with a uterus didelphus in the ultrasound screening group was
referred to a fetal medicine unit for risk assessment. A patient with a hydrosalpinx in the ultrasound screening group was
referred for treatment. In the control group, a large undiagnosed cervical fibroid led to a
C/section after 17 hours of labour due to obstruction of the birth canal. In the ultrasound screening group six pairs of twins were diagnosed in
the mid-trimester. In the control group one pair of twins was diagnosed at 27 weeks and a second pair at term.
A total of thirteen (1.14%) fetuses suffered from a congenital abnormality of which the most severe abnormalities detected in the ultrasound screening group consisted of four neural tube defects (spina bifida) and two chromosomal defects, all detected during the mid-trimester scan. In the control group, five unsuspected abnormal babies were born with the most severe abnormalities being amniotic band syndrome with meninges stuck to an amputated head, Tetralogy of
166
Fallot and a baby with a cleft palate. All these conditions are detectable on ultrasound.
167
Table 2 Comparison of perinatal outcomes.
Data U/SS Group(N = 416)
Control Group(N = 388)
p = Value
1. Live births 389 3692. Abortions (<22wks/<500g)
5 3
3. Stillbirths (>22wks/>500g)
14 10 p = 0.4
4. Neonatal deaths (1st 28 days)
4 6 p = 0.43
5. Perinatal mortality (3 + 4)
18(4.3%)
16(4.1%)
p = 0.89
6. Mean birth weight (± SD)
2944g(± 617.71)
2962g(± 630.87)
p = 0.70
Table 2 demonstrates that there was no significant difference in perinatal outcomes in the compared groups. There was also no significant difference in fetal health status at birth or length of neonatal hospitalisation.
Discussion and RecommendationsSeen in the study context it was observed that the selective use of ultrasound may in some instances, have an adverse influence on the management of patients who attend primary health care clinics. The following limitations were identified:1. Currently an unreliable menstrual history is not recognised as a valid
indication for routine ultrasound, which could lead to unnecessary intervention in suspected post-term pregnancies.
2. The initial diagnosis of multiple gestations is based on a clinical suspicion by a midwife. According to National guidelines patients should subsequently be referred to a hospital for confirmation and risk assessment. Serial scans should be performed from 28 weeks to monitor fetal growth. If the midwife fails to make an early diagnosis this ideal is often not realized.
3. Complications that arise due to the birth of an unsuspected abnormal baby affect both parents and caregivers. Parents are denied the option to terminate the pregnancy or the opportunity to be emotionally prepared to deal with a child with special needs. Caregivers may also
168
not be able to give the baby the best chance of survival due to a lack of resources.
From the analysed data, it is evident that routine mid-trimester ultrasound does not guarantee improved perinatal outcomes in a low risk population. There is, therefore, no need to offer all pregnant women a routine scan.
It is, however, apparent that the majority of patients could not provide a reliable menstrual history. In view of the fact that most scans in the control group were done for dating at an inappropriate gestational age, it is recommended that unsure dates and a discrepancy between LMP and the palpated size of the uterus be considered as a valid indication for the selective use of ultrasound.
As previously observed in similar studies, ultrasound dating significantly reduced the number of patients on whom a post-term induction of labour was performed.
This study lacked statistical power to demonstrate improved perinatal outcomes for twin pregnancies in the ultrasound screening group. The feasibility of training primary health care midwives to do basic obstetric scans for dating and the early detection of high risk problems to accommodate timeous referral to a higher level of care could be assessed in a future study.
169
CENTILE CHARTS FOR CERVICAL LENGTH AT A GESTATIONAL AGE OF 16 TO 32 WEEKS
GB Theron, IC Schabort , L Geerts, K. Norman, M-L Thompson*Department of Obstetrics and Gynaecology, Stellenbosch University and Tygerberg Hospital. * Department of Biostatistics, Medical Research Council, Durban.
ObjectiveTo establish a centile chart for cervical length between 16 and 32 weeks gestation in a low-risk population.
MethodsA prospective longitudinal cohort study was performed. Women with low risk singleton pregnancies utilising public health care facilities were recruited. Transvaginal measurement of cervical length was done every second week between 16 and 32 weeks. The distribution of cervical lengths and centile curves were constructed using a common transformation to normality, with common variance across gestational ages. The overall accuracy of cervical length measurement to predict preterm labour was assessed by calculating the sensitivity, specificity and predictive values for any measurement below the 30th and 20th centiles.
ResultsA cohort 360 women were recruited. The mean age was 22.9 (SD 5) years, the mean parity 1 (range 0-5) and the mean gravidity 2 (range 1-7). The mean gestation at delivery was 38.9 weeks (SD 2.7) and mean birth weight was 2979 (SD 590) grams. 4.7% of the patients delivered before 34 weeks and 10% of the patients before 37 weeks completed gestation. The number of observations per week ranged from 35 in week 16 to 319 in week 23 (Table I). The distribution of cervical length at 16, 18, 20, 23, 26, 28, 30 and 32 weeks was established. Multiparous women had significantly (p=0.003) longer cervices compared to their nulliparous counterparts. On average, this difference was 1.6 mm, but the difference increased with a more advanced gestational age (26 - 32 weeks; 2.4 - 4.7
170
mm). Table II provide information on the overall accuracy of the curve to predict preterm labour.
Figure 1 Graph with multi- and primiparas on one graph
Table II Overall accuracy of screening 16 – 23 wks (> 1 value below 30 or 20th centile)
Preterm Preterm<30th Yes No <20th Yes NoYes 16 133 Yes 12 85No 12 183 No 16 231% % % %Sens 57 + pred v 11 Sens 43 + pred v 12Spec 58 - pred v 94 Spec 73 - pred v 93
ConclusionsAll women showed progressive cervical shortening as gestation advanced. Nulliparous women had mean cervical lengths 1.6 mm shorter than multiparous women. Centile charts were produced for both nulliparous and multiparous women. Routine cervical measurements in women at low risk for preterm labour are of little value. The value of plotting serial
18 19 20 21 22 23 24 25 26 27 28 29 30 31 32
weeks
25
30
35
40
45
50
55
mm
C10
C50
C90
Percentiles for cervical length (no funneling)
171
measurements of cervical length on the centile graph in women at risk for preterm labour need to be studied.
172
A CENTILE CHART FOR BIRTH WEIGHT FOR A GESTATIONAL AGE FROM 24 TO 28 WEEKS
GB Theron, L Geerts, M-L Thompson*, AM TheronDepartment of Obstetrics and Gynaecology, Faculty of Health Sciences, Stellenbosch University and Tygerberg Hospital. *Department of Biostatistics, MRC, DurbanIntroductionThe birthweight for gestational age centile chart currently in use provides for the gestational age range from 28 to 42 weeks. Advances in maternal, fetal and neonatal medicine allow interventions prior to 28 weeks, therefore there is an increasing need to extend the chart down to 24 weeks.
AimTo construct a centile reference range for fetal weight for gestational age from 24 to 28 weeks.
Study Design: A descriptive study.
Study populationA cohort of 244 women with singleton uncomplicated pregnancies and early ultrasound confirmed gestational age was recruited from the community antenatal clinics in the Tygerberg area (Elsies River, Bishop Lavis, Bellville South, Delft and Belhar).
Methodology:Sequential patients complying with the inclusion criteria were included in the study. The patients were referred to Tygerberg Hospital for ultrasound fetal weight estimates using the Hadlock formula with the ANTARES (Siemens) ultrasound equipment by a limited number of skilled ultrasonologists. Accurate sequential fetal weight estimates provided the database for calculating the centiles in this gestational age range. Each patient had 2 additional ultrasound weight estimates, either at 24 and 26 weeks (50% of the cohort) or at 25 and 27 weeks (50% of the cohort).
173
Summary data for each patient were collected taking care to record information that may influence fetal weight. The patients were followed up and the outcome of the pregnancies determined.
Data analysisThe 3-parameter LMS method was used to model the distribution of birth weight by gestational age. The 3rd, 10th, 50th, 90th and 97th percentiles for each gestational age (24 to 27 weeks) were estimated.
ResultsA total of 244 patients were included in the study contributing a total of 455 fetal weight estimates. Table I provides the summary data of the study population, Table II inductions and the method of delivery, Table III the neonatal outcome and Table IV the male female ratio and perinatal deaths. The primary causes of the intra-uterine deaths (IUD) were: a cord complication; acute pyelonephritis, vomiting and dehydration in a patient admitted with an IUD and one patient delivered a stillborn baby elsewhere, no information could be obtained. The early neonatal death (day 1) was caused by a congenital abnormality. The infant had displastic kidneys that resulted in severe oligohydramnios and hypoplastic lungs.
Table II Inductions and method of deliveryInduction Yes = 26 (10.6%) No = 220
Method of deliveryNVD 210 85.4
C/S 29 11.8V/E + Forceps 5 2.0Breech 2 0.8
174
24 25 26 27400
500
600
700
800
900
1000
1100
1200
1300
1400
3rd centile
10th centi le
50th centile
90th centile
97th centile
Centile bounds: weight for gestational age
Table III The neonatal outcomeGestational age (wks) Birth weight (g) 5 min Apgar
Mean 38.6 3028 9.6Std Dev 2.3 625 0.8Median 39 3070 10Min 29 980 5Max 43 5120 10
Table IV The male female ratio and perinatal deathsMale 120 49%Female 125 51%
IUD 3 PNM rate16/1000ENND 1
Parity (p=0.006) and smoking (p=0.023) significantly affected fetal mean weight. On average, the fetal weight for nulliparous women was 39.2g higher than that of multiparous women (with the same smoking status) and smokers had a fetal weight of 32.4g lower than non-smokers (with the same parity status). No association of fetal weight with body mass index was found.
Figure 1
ConclusionsKnowledge of centiles for fetal weight will contribute towards more accurate decisions late in the second trimester. With unknown gestational age, the ultrasound estimated weight could be plotted on the centile chart
175
to estimate gestational age. Smoking effects fetal weight at an early gestational age.
176
BANC: BASIC ANTENATAL CARE PROGRAMME
E Etsane, V Sutton, RC PattinsonMRC Maternal & Infant Health Care Strategies research unit.
BANC is a programme designed to improve the quality of antenatal care provided at all the Primary Health Care facilities of South Africa
The programme comprises of a specially designed multimedia package and a specific implementation process.
The package consists of: Basic Antenatal Care Handbook The Integrated Management of Pregnancy and Childbirth
programme of the WHO (adapted for the Tshwane Metropole) A training CD on basic skills needed for antenatal care BANC Facilitators Guideline to Training of Trainers BANC Training of Trainers file BANC Task Book Health Facility Protocol and Audit Book Primary Health Care Facility’s Manager’s and Referral Hospital
Information leaflets
The implementation process includes the training of trainers’ methodology
The programme is being tested in the Tshwane and Nelson Mandela metropoles
The package will be demonstrated at the poster site.
177
AUDITING ANTENATAL CARE IN SOUTH-WEST TSHWANE
Verity Sutton, Bob Pattinson, Elsie EtsaneMRC Maternal and Infant Health Care Strategies Research Unit, University of Pretoria
IntroductionThe most common cause of infant death in South Africa is unexplained intrauterine death, and the most likely causes behind these deaths include intrauterine growth restriction (IUGR), post-maturity, congenital abnormalities and amniotic fluid infections. The persistently high stillbirth rates suggest that antenatal clinics in South Africa are not providing adequate care to pregnant women and their babies. This study was a descriptive study conducted as part of a larger trial to assess the implementation of the BANC (Basic Antenatal Care) program. The aim was to obtain a baseline measure of the current effectiveness of antenatal care in primary health clinics in south-west Tshwane.
MethodsAll 14 primary health clinics in the south-west Tshwane region were included in the study. The quality of antenatal care provided by the clinics was measured by examining the patient-held antenatal cards, and by determining the patient’s gestational age at the booking visit. The antenatal cards were collected from the post-natal wards of Kalafong and Pretoria West hospitals after the patients’ delivery. A total of 485 cards were collected and then scored according to a set checklist of 25 criteria. The scoring system encompassed both the history-taking and examination processes, and the interpretation of the findings and consequent decisions made.
ResultsEach antenatal criterion from the checklist was examined, and key deficiencies were found in certain aspects of the antenatal care: calculation of the expected date of delivery by the correct method, accurate plotting (and consequently interpretation) of symphysis-fundus
178
measurements at each visit, identification and recording of pregnancy risk factors, discussion of patient transport arrangements, and counter-signing of the cards for a quality check (see Graph 1).
An average total score for each of the clinics was also obtained, with a range of 59.0% to 77.7% (see Graph 2).
Gestational age at the booking antenatal visit was mostly found to be greater than the recommended 20 weeks gestation (see Graph 3).
Graph 1 Mean criteria scores for antenatal cards in south-west Tshwane
180
Graph 2 Average total scores for clinics in south-west TshwaneMean clinic scores
61.9
74.2
63.767.3
61.765.9
66.8 69.3
61.6
70.2 70.8
59.0
77.772.7
50.055.060.065.070.075.080.085.090.095.0
100.0
1 2 3 4 5 6 7 8 9 10 11 12 13 14
Clinics
Mea
n sc
ore
Graph 3 Gestational age of patients at the booking antenatal visit in south-west Tshwane
ConclusionsThe completion of antenatal cards by primary health care workers was found to be deficient in certain key areas, namely assessing fetal growth and identifying and acting on pregnancy risk factors. These deficiencies could partly explain the persistently high stillbirth rate in the region. It was found that only 34.0% of the patients received their booking antenatal visit before 20 weeks gestation, as is recommended, demonstrating the importance of initiating antenatal care at pregnancy confirmation.
181
THE MICROLIFE 3AC1: AN ACCURATE BLOOD PRESSURE MEASUREMENT DEVICE IN PREGNANCY & PRE-ECLAMPSIA
De Greeff A1, Reggiori F1, Anthony J1, Shennan AH2
1. Department of Obs & Gynae, Groote Schuur Hospital, Cape Town, South Africa
2. Maternal & Fetal Research Unit, Kings College London School of Medicine, UK.
IntroductionAs one of the most commonly performed screening tests in pregnancy, accurate blood pressure measurement is vitally important to the diagnosis and management of hypertensive disorders in pregnancy. Accurate measurement, using mercury sphygmomanometry, is confounded by sampling errors which could be reduced by using automated devices. Few automated devices have been assessed for their accuracy in a pregnant population according to a recognised protocol.
The British Hypertension Society protocol was published with the view to standardise the acceptable level of accuracy for devices recommended for clinical use. This protocol makes provision for the assessment of automated devices in an adult population as well as in special groups such as pregnancy and the elderly.
None of the devices that achieved sufficient accuracy in pregnancy, were accurate in pre-eclampsia, except for one: The Microlife 3BTO-A. The Microlife 3AC1 uses the same algorithm as the 3BTO-A, but has added features such as an increased memory capacity and MaM (an averaging mode). It is recommended that all automated devices are validated according to a recognised protocol and that algorithm accuracy should not be assumed in different devices.
We assessed the accuracy of the Microlife 3AC1 in a pregnant population, including pre-eclampsia, according to the protocol of the British Hypertension Society.
182
MethodsLocal ethics committee approval was obtained and all subjects were required to give written informed consent. Forty five pregnant women were recruited from the antenatal wards and clinics at a large teaching hospital. Sixteen of these women were pre-eclamptic according to the definition of the International Society for the Study of Hypertension in Pregnancy. Demographic information is displayed in Table 1. All subjects were seated with the relevant arm supported at heart level. Nine sequential same arm blood pressure measurements were taken by two trained observers, alternating between a mercury sphygmomanometer and the device.
Data was analysed according to the guidelines of the British Hypertension Society protocol. The percentage of readings where the difference between the device and observer was 5, 10 and 15mmHg was calculated and a grading given according to the protocol criteria. An A or B grade is required for both systolic and diastolic pressures to pass the protocol. This requires a minimum of 50% of readings to be within 5mmHg, 75% within 10mmHg and 90% within 15mmHg.
Table 1 Demographic information Pregnancy Pre-eclampsia
Number of subjects 29 16Age (yrs) 28 (6) 29 (5)Height (cm) 158 (8) 158 (9)Weight (kg) 79 (16) 82 (16)Arm circumference (cm) 28 (4) 30 (4)Gestation (weeks) 32 (5) 29 (5)* Values displayed as Mean (Standard Deviation)
ResultsThe Microlife 3AC1 achieved the highest possible grade for accuracy in pregnancy (A/A) and also passed in pre-eclampsia by achieving a B/A grade for systolic and diastolic pressure respectively (Table 2). It also met the standard required by the Association for the Advancement of Medical Instrumentation (AAMI) by achieving a mean difference <5mmHg (SD<8mmHg) for both pregnancy and pre-eclampsia for systolic &
183
diastolic pressures respectively [pregnancy –0.4(5.2) & -1.1(5.9); pre-eclampsia –1.1(7.1) & -3.7(4.1)]. A graphical representation is shown in Figures 1 & 2 using mean-against-difference plots.
Table 2 Grading results according to BHS criteria
Figure 1 Plot of the pressure difference between the device and the better observer and the mean pressure for that observer and the device for systolic pressure.
184
Figure 2 Plot of the pressure difference between the device and the better observer and the mean pressure for that observer and the device for diastolic pressure.
ConclusionThe Microlife 3AC1 can be recommended for use in a pregnant population according to the BHS protocol. It is one of only two devices shown to be accurate in pregnancy, including women with pre-eclampsia. There is currently no robust device (suitable for use on e.g. labour ward) that has achieved clinical recommendation for both pregnancy and pre-eclampsia.
185
TETANUS IMMUNISATION IN PREGNANCY: IS OUR PROTOCOL OUT OF DATE?
WJ SteinbergFamily Medicine, University of the Free State
There is little doubt that the policy to immunise all pregnant women against tetanus in sub-Saharan Africa has lead to a major reduction in the incidence of neonatal tetanus.
The WHO suggests immunisation of pregnant women against tetanus in districts where neonatal tetanus has been diagnosed in the last 5 years.The national guidelines in South Africa have been published in the “pink book”, Guidelines for MATERNITY CARE in South Africa: A manual for clinics, community health centers and district hospitals, Department of Health June 2000 and revised March 2002. The original guidelines printed in June 2000 suggested that primigravidae be immunised three times and that multigravidae be immunised once i.e. given a booster dose. This was based on the assumption that the primigravida was not yet immunised against tetanus, whereas the multigravida was immunised with her previous pregnancies. However, the guideline as printed in the March 2002 version has created a major practical dilemma in its implementation. The regime mentioned there assumes that every pregnant female needs to be fully immunised against tetanus in South Africa with every pregnancy.
Is this assumption correct?Many of those that come to the maternity units to deliver were already immunised as children themselves. Vaccination coverage studies 15-20 years ago showed a reasonably good coverage, also for rural areas in South Africa. It is these females that were immunised 20 years ago that are currently delivering in our maternity units. This means women attending our antenatal clinics at this stage are very likely to have been immunised previously and would not need full immunisation. A booster dose every five years should be sufficient in these cases.
186
187
The research question askedAre the women attending antenatal clinic in Bloemfontein in 2005 already immune to tetanus at their first visit?
MethodOne hundred and fifty-nine (159) patients from antenatal clinics in Bloemfontein were included in the study. The patients were sampled from the Gateway clinic at National District Hospital and from the antenatal clinic at MUCCP. These two clinics were chosen as they are attached to the Family Medicine Department at University of the Free State and cover about 50% of the new antenatal visits in Bloemfontein. Medical students would go to the clinics on random days (between August 2005 and November 2005) and recruit women for the study.After consent was obtained from the patients, they were asked to complete a questionnaire on their previous tetanus vaccination history as well as answer some knowledge questions on tetanus. Blood samples were taken at their first visit and tested for immunity, i.e. before receiving tetanus immunisation during this pregnancy. A 5ml sample of blood was tested serologically for antibodies at the serology laboratory of Universitas Hospital (NHLS). The RIDASCREEN® Tetanus IgG (K3721) test kit was used. (This test is an enzyme immunoassay for the quantitative determination of IgG antibodies against tetanus toxoid in human serum.)The recommendations of the supplier were used in the interpretation of the results obtained.
Table 1 Recommendations for interpreting the determined IU/ml
< 0.1 IU/ml Require basic immunisation or booster inoculation0.1 – 0.5 IU/ml Require booster inoculation0.6 – 1.0 IU/ml Check up after 2 yrs1.1 – 5.0 IU/ml Check up after 5-10 yrs
> 5.0 IU/ml Check up after 10 yrs
188
ResultsLevel of immunityFifty five percent of the sample would not require a booster at the time of their first visit in the current pregnancy. Thirty six percent would benefit from a booster dose, while only eight percent would require a booster dose or basic immunisation for tetanus in the current pregnancy. In other words, half the women in this sample would not need any immunisation and a further 40% would be fully immunised by receiving a single booster dose. (Refer to Table 2)
Table 2 Percentage of women falling into the immunity categories as specified Number Percentage of
sampleRequire basic immunization 13 8.2%Require booster 58 36.5%Check up after 2 yrs 20 12.6%Check up after 5-10 yrs 39 24.5%Check up after 10 yrs 29 18.2%
Immunity by age and parityImmunity was more complete with increasing parity (Table 3) as well as with increasing age. This is to be expected, as there is some correlation between parity and age. Eighty one percent of those that received antenatal care during a previous pregnancy stated that they were vaccinated against tetanus. Only 12% of our sample stated that they were also vaccinated against tetanus at other occasions.
Table 3 Immunity by gravidityImmunity/ Gravidity
Primips(n=77)
Multips(n=80)
Require basic immunization 10% 6%Require booster 52% 22%Check up after 2 yrs 9% 14%Check up after 5-10 yrs 17% 32%Check up after 10 yrs 12% 25%
189
KnowledgeAsked whether they knew what tetanus was: 86% of our sample answered ‘no’, 10% were unsure and only 4% claimed they knew what tetanus was. Of the latter group who claimed they knew what tetanus was, all knew how tetanus is transmitted, but only half were able to describe the signs and symptoms of tetanus. Of those that had children in our sample, only 68% were sure that their baby was immunised against tetanus, while 25% were uncertain.
DiscussionThe majority of women in our sample in Bloemfontein have adequate cover against tetanus at the time they present to the clinics for their first antenatal visit.The knowledge of tetanus and its transmission is very poor amongst the antenatal population tested in the sample.
RecommendationsAs the majority of pregnant patients are fully immunised when presenting for the first time in pregnancy, we therefore suggest a simplified regimen of tetanus innoculation during pregnancy at our public health antenatal care clinics:
One booster dose of tetanus inoculation at the first antenatal visit for all women.
In areas where tetanus is a concern, one could add a second dose after 6 weeks for the primigravida.
A pregnant woman only needs to be immunised fully if there is sufficient reason to believe that she has never been immunised before.
These recommendations should be incorporated in the revision of the guidelines.
190
CTG DURING MATERNAL ANAEMIC SITUATION IN THE UNIVERSITY CLINICS, KINSHASA, DRC
Tandu-Umba NFB, Mbungu Mwimba RDept of Ob. – Gyn.
IntroductionAnaemia, the most frequent medical pathology during pregnancy, is more widely spread in countries (like ours) with low nutritional standards along with intestinal and blood parasitoses.
AimAssessment of CTG abnormalities owed to maternal anaemic situation in order to prevent unnecessary aggressive attitude on the pregnancy.
Study designSetting: University Hospital of Kinshasa among urban indigenous attending non emergency prenatal care between 28 and 40 weeks of gestation from April 1st 1995 to January 31st 2002. Method: The study group was made of 60 consecutive anaemic women (Hb <10 mg/dl). Women with Hb ≥10mg/dl immediately following each of the study group were enrolled to make a control group of 60 non-anaemic women. Using Partocorder® and HP® monitors CTG was performed. In anaemics, after a treatment of 2 weeks consisting of counselling + iron given orally 3 times 200 mg iron sulphate/day (tablets or syrup) + 5 mg folic acid 3 times a day, a CTG control was done. In 3 patients near term with Hb < 7 g/dl with initial symptoms of cardiac failure, a transfusion of packed cells or fresh blood, tested for HIV, was used. Two cases of IUGR were registered among these later. Specific therapy was also initiated in 13 cases of malaria or intestinal worms. No significant maternal pathology likely to influence the fetal heart rate was found.
Results
191
Both groups were homogeneous and comparable according to age (30,6 ± 11,3 in study group and 29,0 ± 17,0 in control respectively, p = 0,447) and parity (3,56 ± 2,20 SD vs 3,70 ± 2,01, p = 0,44). Both groups were different (p significant) only in haematological values found in accordance with the diagnosis of iron-deficiency anaemia in the study group (Table I).
Table I Haematological parameters in both groups
STUDY GROUP n = 60
CONTROL GROUP n = 60
P <
Hgb (g/dl) 7..98 ± 0..9
11.4 ± 1..3
0.0001
Hct (%) 24.7 ± 3.4
32.27 ± 5.6
0.0001
Serum Fe (µg/l)
58.68 ± 18.9
78.9 ± 4..9
0.0126
Coefficient of saturation(%)
17.4 30.3 0.0001
Table II Fetal heart rate (FHR) according to Hb values
Both basal fetal rate (142.03 vs 144.1) and reactivity (normal) did not significantly modify themselves. The variability was the sole parameter of CTG to be disturbed in pregnancy with anemia, becoming low by Hb <8g/dl, hematocrit <28%, serum iron <66mg% (p < 0.4). The anomaly was offset by therapy by the time Hb values rose up to 9g%.
192
DiscussionCTG disturbances due to fetal cerebral injury by hypoxy must be interpreted relative to several factors, one of them being the maternal general situation, and it has gained acceptance to supplement its information with umbilical Doppler assessment. In case of maternal anaemia, our study states the level of blood parameters from which reduced CTG’s variability in isolation occurs when Hb concentration is lower than 10g%. The correction of the deficit in Hb ends the anomaly, a finding leading to more caution when reduced variability is encountered in maternal anaemic situation.
193
PREVENTION OF MOTHER-TO-CHILD TRANSMISSION OF HIV: CHALLENGES
Mashamba TJ, Dlamini EN, Lehlabaphiri MSDepartment of Obstetrics and Gynaecology, Dr George Mukhari Hospital, Ga-Rankuwa, Pretoria
IntroductionThe Prevention of Mother-to-Child Transmission (PMTCT) of HIV programme has become one of the essential antenatal services for HIV positive women at Dr George Mukhari Hospital. The programme has been on-going at this referral centre for several years and reviews of this programme point to obvious beneficial effects, in reducing the rate of transmission of the virus to newborn babies. This report appraises the PMTCT programme at this hospital, in order to identify existing shortcomings and to institute actions for improvements.
MethodsPregnant women attending the antenatal clinic of this hospital were regularly counselled for HIV testing. Those who consented to testing for HIV and who tested positive, were enrolled for the PMTCT programme. Medication for the prevention of transmission was given to each of the pregnant women according to the protocol guidelines provided by the provincial health department. Similarly, newborn babies were treated, immediately after birth with medication to prevent transmission as outlined in the protocol. This report looks at the relative number of women who were referrals to Dr George Mukhari Hospitals without prior counselling for HIV infection. In addition, the relative rate of low CD4 counts among those who tested positive and reasons for refusing to be tested were determined.
ResultsFrom 1 January – 30 November 2005, a total of 11 717 pregnant patients were seen at the ANC. During the same period, first time visits by patients who underwent counselling for PMTCT were 526, out of whom 439 (83.5%) patients were referrals. Nine hundred and ninety two (992) women accepted to be tested for HIV with a prevalence rate of 27.4%. All the 272 women who tested positive had CD4 counts with 104 of them (38.2%) having low CD4 counts. Out of the 104 patients with low counts who were to benefit from antiretroviral (ARV) medication, only 23 (22.1%) were on medication. Reasons given by women for not accepting HIV testing included: “Not ready “; “No reason”; “I will only test if my partner accepts the test” and “I will test but not at this clinic”.
ConclusionPregnant women referred from peripheral sites are often not counselled for HIV/PMTCT programme (83.5% in this report). The reluctance of women with low CD4 counts, to be placed on the ARV medication, was due to the need for the women to make repeat visits for counselling before ARV is given. They are also required to be accompanied by a relation/ friend to ensure compliance to medication – a difficult acceptance of disclosure of status.
194
GOOD START STUDY RESULTS: EARLY HIV TRANSMISSION, HIV-FREE SURVIVAL AND INFANT FEEDING ISSUES
FROM THE GOOD START STUDY GROUP, andM. Colvin, CADRED. Jackson, J. Willumsen, University of the Western CapeT. Doherty, Health Systems TrustM. Chopra, J. Levin, Medical Research CouncilA. Goga, South Africa National Department of Health P. Moodley, Nelson Mandela Medical School
Study Aims & ObjectivesThe primary aim of the study was to measure operational effectiveness of the SA National PMTCT Programme. This was the 1st large study of this type. The objectives were to:
1. Measure the perinatal vertical HIV transmission rate at 3-4 weeks postpartum.
2. Measure the postnatal vertical HIV transmission rate at 36 weeks.3. Measure HIV-Free survival in infants at 36 weeks. 4. Examine infant feeding patterns in the context of HIV
Study Setting Three of the original 18 South African National PMTCT pilot sites
chosen: Umlazi (KZN). Paarl (W Cape). Rietvlei (E Cape).
Purposively selected to reflect different: socio-economic regions; health infra-structure; rural-urban locations; and HIV prevalence.
Research Design Recruitment of HIV positive mothers from local PMTCT sites either
antenatally or post delivery.
195
Follow-up home visits until 36 weeks (9 months) after delivery. Sample size calculated to determine overall HIV transmission at 36
weeks (+3.5% overall and +5.0-7.5% per site). Final Sample: 665 HIV+ women. Lost to follow-up at 36 weeks 21% -
less than expected.
Data Collection Data collected by trained field researchers or trained CHWs. Semi-structured interviews in the home. Field Researchers or CHWs visited every 2 weeks until 9 weeks, then
monthly until 36 weeks. Dried blood spots collected by heel prick (baby) at 3, 24 and 36
weeks to determine HIV infection and finger prick (mother) at 3 and 36 weeks to measure viral load.
Figure 1 Sociodemographics
196
Table 1 Quality of CarePaarl Rietvlei Umlazi p-value
Syphilis test performed 138 (98.6%) 48 (28.6%) 229 (82.7%) <0.001Emergency C/S 4 (2.9%) 21 (12.5%) 87 (31.4%) <0.001Elective C/S 9 (6.6%) 14 (8.4%) 40 (14.6%) 0.02ROM > 4 hours 19 (13.6%) 3 (1.8%) 80 (28.9%) <0.001Delivery complications 29 (20.7%) 25 (14.9%) 183 (66.1%) <0.001Mother given NVP as per protocol
95 (67.9%) 45 (26.8%) 154 (55.6%) <0.001
Mother not given NVP 8 (5.7%) 56 (33.3%) 48 (17.3) <0.001Infant NVP as per protocol
123 (87.9%) 121 (72.0%)
210 (75.8%) <0.001
Infant not given NVP 7 (5%) 29 (17.3%) 20 (7.2%) <0.000NVP n(%) mother and baby
126 (90.0%) 94(56.0%) 214 (77.3%) <0.001
Neither 1 (0.7%) 11 (6.5%) 5 (1.8%) <0.001
Paarl demonstrated the best quality of PMTCT care, while in Rietvlei many problems were seen with programme quality (Table 1) and was also the most socioeconomically disadvantaged (Figure 1).
Early Perinatal Transmission (at 3-4 weeks postpartum)Paarl - 8.6%.Umalzi - 11.9%.Rietvlei - 13.7%.These results compare favourably to HIVNET012 at 6 weeks - 11.9%. The differences between sites were not statistically significant.
Risk Factors for Early Transmission Low birth weight, ANC visits <3 and Maternal Viral load were all statistically significant predictors of early transmission (p<0.05).
Conclusions at 3-4 Weeks Postpartum Our 3 week transmission rates are similar to the 6-8 week
transmission in the NVP arm of HIVNET012 (11.9%). Indication that peri-partum NVP prophylaxis is effective under
operational programme conditions.
197
Cumulative Transmission - However shows substantial transmission in the postpartum period, especially in Rietvlei.At 24 weeks: Paarl - 13.2%; Umlazi 17.6%; Rietvlei 22.6%At 36 weeks: Paarl - 15.6%; Umlazi 22.6%; Rietvlei 29.7%
HIV-Free Survival at 36 Weeks Postpartum% of infants who are HIV-negative AND alive @ 36 weeks (9 months):
Paarl = 84.0%. Umlazi = 73.4%. Rietvlei = 64.3%.
These differences are statistically significant at p=0.0003. Paarl and Umlazi are similar to clinical trials of PMTCT, whereas Rietvlei has results similar to placebo in these same trials.
Predictors of Hiv-Free SurvivalMaternal Viral Load is the only independent risk factor for HIV-Free survival at 36 weeks. However, the difference between Paarl and Umlazi can be attributed to higher exposure to breastmilk feeding, while the difference between Paarl and Rietvlei appears attributable to health services quality (i.e. # of ANC visit and syphilis testing).
Conclusions HIV-Free SurvivalUsing HIV-free survival as a primary measure of effectiveness it is clear that:
In Paarl, the PMTCT programme has been successful. In Rietvlei, the health care quality has limited the success of this
programme. In Umlazi, the programme has had some impact, but that
improvements can be made, e.g. appropriate feeding choices.
Influence of Feeding Method on 3-36 Week Hiv TransmissionExclusive or Predominant Breastfeeding - 9 (13.2%).
198
Mixed Breastfeeding and Formula Feeding - 33 (14.5%).Exclusive Formula Feeding - 12 (8.3%).
Classifying Infant Feeding Patterns Multiple patterns of feeding were actually observed and did not fit
cleanly into the traditional categories described above. Issues raised included: When to measure feeding (3 weeks, 12
weeks, 24 weeks, etc.); How to handle one-time or intermittent lapses to other feeding methods; What is ‘rapid’ weaning; and how to derive simple groupings of complex patterns
Analysing infant feeding data is complex due to the dynamic nature of infant feeding practices so that potential for misclassification is high in current feeding categorisations.
More work is being undertaken to assess the variability in HIV transmission and HIV-free survival based on infant feeding groups
Limitations Not a clinical trial – aim was to measure operational effectiveness. Not powered or designed to assess sub-components of the PMTCT
Programme. Generalisability – sites not randomly selected. Potential for recall bias. Potential for testing error – sensitivity of the tests at times tested (3,
24, 36 weeks) range from 80-97%. Loss to follow-up – 21% - better than routine programme and better
than expected.
Recommendations Address Inequities – Disadvantaged areas may need more resources
(technical assistance, staff, funding) per mother/baby served to assure success (quality) of the PMTCT programme.
199
Improve PHC/MCWH – Comprehensive Approach e.g. Increase # & quality of ANC visits, IMCI, increase immunisation rates, reduce malnutrition.
Reduce maternal viral loads – HAART Therapy for mothers. Continue PMTCT Programme - Consider combination therapies to
further reduce early/perinatal transmission.
200
ATTITUDE OF PREGNANT WOMEN TOWARDS THE USE OF CONDOMS
Mashamba TJ, Dlamini EN, Mojapelo RPDepartment of Obstetrics and Gynaecology, Dr George Mukhari Hospital, Ga-Rankuwa, Pretoria
IntroductionThe prevalence of HIV infection is on the increase in South Africa and an increasing number of people are becoming aware of this pandemic. A stable sexual relationship and the use of condoms are ways to reduce the trend in prevalence of the disease. This study reports on an evaluation of pregnant women’s attitudes towards the use of condoms and the impact of such attitude on voluntary HIV testing; prevalence of HIV infection and reasons for use or non-use of condoms.
MethodsConsecutive patients attending the antenatal clinic at Dr George Mukhari Hospital, were counselled for voluntary HIV testing and the test was performed for those who had given consent. Every patient who participated in the study, then had a one-one interview by a midwife, during which a questionnaire was administered to record information regarding the pregnant women’s attitude to the use of condoms. In addition, to the demographic profile of the women and testing for HIV infection, other outcome measures included: number of sexual partners, previous and current use of condoms, partner’s attitude towards the use of condoms and reasons for or against the use of condoms.
ResultsTwo hundred and twenty-four (224) pregnant women aged between 15 and 44 years participated in the study. The majority of the women (53.15) were para 1-2 while 24.6% were nulliparous. The women were interviewed and tested at 28.6+7.2 (mean +SD) weeks of gestation. The number of sexual partners ranged from: single partner (50.5%), 2-3 partners (41.5%) while 8% disclosed having > 4 partners. HIV prevalence among those tested was 38.3% while 13.8% of the women declined being tested. Those who had previously used condoms were 79% and 35.7% are current users. Partners/husbands who had agreed to use condoms were 67.4% but only 31.7% of all the male partners had ever been tested for HIV infection. Among couples who were not current user of condoms, reasons varied from: “No reason”, “Rapid ejaculation”; “both partners are negative for HIV”; “Not part of his culture to use condoms”. Among reasons given by those who are current users of condoms, the two predominant reasons were: “To prevent cross infection of HIV” and “To prevent STI and pre-term labour”.
ConclusionThere seems to be wide spread and adequate knowledge by pregnant women, of the danger of HIV pandemic and the merit of using condoms to prevent infections. Husbands/partners were shown to be the major influence in determining whether or not the women would use condoms. In spite of this, there was lack of interest by the men to know their HIV status. The evidence of multiple sexual partners among 50% of these women must be a point of concern to all health-givers.
201
DOES MATERNAL HIV INFECTION CAUSE INTRAUTERINE GROWTH RESTRICTION. A COMMUNITY-BASED ULTRASOUND STUDY
EJ Coetzee, Dept O&G, Groote Schuur Hospital/University Cape TownF Isaacs, Cape Peninsula University of Technology
IntroductionIt is a perception that mothers infected with HIV more often deliver pre-term and that their newborn are smaller and growth restricted. We therefore did a community based study of fetal growth at 2 local midwife obstetric units [MOU].
MethodA prospective cohort study was done on HV infected and uninfected women attending Khayelitsha and Guguletu MOUs [KMOU & GMOU respectively] from June 2003 to December 2004, to establish whether there is an association between HIV and intra-uterine growth restriction [IUGR].Ultrasound imaging was was used to monitor fetal growth from +- 22 weeks to 36 weeks gestation. The Biparietal Diameter [BPD], abdominal circumference [AC] and femur length [FL] were measured at 22, 28, 32 and 36 weeks gestational age. Birth weight, gestational age at delivery and gender were included.CD4 T lymphocytes counts were done where possible.Statistical analysis was done to see if there were any differences in the above parameters between infected and uninfected patients. The difference in preterm labour between the 2 groups was also observed.
ResultsA total of 414 patients were recruited; 173 from KMOU and 242 from GMOU.194 HIV infected women were included in the study group and 220 uninfected women in the control group. The attrition rate at 28 weeks was 12%, at 32 weeks 23% and at 36 weeks it was 39%. The mean maternal age was 24.3 years, mass 67 kg and height was 1.58m. There was no difference between the groups for these parameters apart from age where the difference from 24.8 [infected] to 23.8 [uninfected] was statistically different, but not clinically important.The individual parameters will be presented, but in summary there were no statistical differences in any of the parameters measured at any gestational age between the 2 groups.There was also no difference in the incidence of preterm labour. Birth weights were similar for both groups.
ConclusionIn this study, there is no difference in IUGR or preterm delivery between HIV infected and uninfected women.
202
A COMPARATIVE CASE STUDY ANALYSIS OF TWO PMTCT FOLLOW-UP PROGRAMS
M Loveday, D Jackson, N Mbombo, T Doherty, P Tlebere, L Treger
BackgroundA decision was made by the National Department of Health at the end of 2001 to implement two PMTCT sites in each province. Over the past two years, there has been substantial scale-up of PMTCT programs across the country. The objective of this study was to compare two PMTCT programs which have been in existence for four years, to determine what systems factors contribute to the functioning of these programs.
Site A is Paarl in the West Coast Winelands District of the Western Cape which comprises the town of Paarl surrounded by commercial farms and a large informal settlement community. There is one regional hospital, a community health centre and numerous clinics.
Site B is Umzimkhulu sub-district in the Eastern Cape. It is a very poor rural area with poor infrastructure which formed part of the old Transkei homeland. It has one hospital and 14 clinics.
MethodThis was a qualitative case study. Data collection methods consisted of semi-structured interviews with 16 respondents who were all involved in the management and running of the PMTCT program. These included sub-district HIV/AIDs coordinators, PMTCT coordinators, maternity matrons, maternity ward and PHC clinic staff.
203
ResultsVCT:Human Resources At Site A, professional nurses both in the hospital and clinic were not routinely trained in VCT. Lay counsellors were trained by a private psychologist for a month. They were then supported, supervised and monitored by a local NGO. They work part-time only, usually in the mornings. Once a month, emotional support was provided be a debriefing session with a psychologist.
At Site B, all PNs were trained in VCT. However, staff turnover was a problem. No sooner are all staff trained than someone leaves and more training has to be organized. In the hospital, a number of staff in the maternity ward had been trained, but due to staff rotation there can be times when no one in the maternity ward has VCT training. Five lay counsellors were attached to each facility to provide counselling from 08h00 – 16h00 on weekdays. The lay counsellors were trained for two weeks by VCT trainers from the sub-district. The lay counsellors were supposed to be supported, supervised and monitored by the clinic sisters, but the clinic sisters had never been told how or what to supervise, support or monitor. Remuneration through the District Municipality was problematic and the counsellors were last paid in 2003. Personal sellers supposed to promote VCT in the community had recently started work. The sub-district HIV/AIDs coordinator was supposed to supervise and monitor their work, but was too busy.
Referral PathwaySite AThe referral pathway was complicated as ANC services are not provided at the PHC clinics. Pregnant women are referred to the hospital OPD for ANC. After delivery at the maternity facility in the hospital which was at another venue, patients were discharged and asked to go back to the OPD for post-natal care. PMTCT clients were referred from the post-natal ward to
204
another section of the OPD and eventually referred back to their local clinic
In spite of the complicated referral pathway described above, transferring information between the hospital and clinics is both effective and efficient. For example, all patients who have attended ANC have been told about the PMTCT program and if they agreed to go on the program, they received VCT.
Site B The referral pathway was very simple from the local clinic to the hospital for the delivery and then back to the local clinic. However, in spite of this, the transferring of information was less effective than in Site A. In addition, many of the women in the maternity ward say that although they have attended ANC in the sub-district they have not been told about the PMTCT program or had VCT.
In the table, laboratory and pharmaceutical services followed by nutritional supplementation and finally routine monitoring and evaluation are discussed. At both sites the turn-around time for ELISA tests both at hospitals and clinics was similar. However, at Site B, the turn-around time was longer at certain times, specimens or results get lost and the staff were less confident of the results. The clinics in Site B have had to cope with stock-outs of rapid test kits, nutritional supplementation for babies and nevirapine tablets. In addition, they had never had been issued with nevirapine syrup in spite of the number of deliveries which take place in the community far from the hospital.
Routine monitoring and evaluation is a problem at both sites and no data on HIV transmission to infants on the program is available at either site. The percentage of women who get nevirapine at Site A is 86% at Site A
205
compared to 10% at Site B. At Site A, the percentage of babies given nevirapine was 99% compared to 12% at Site B.
ConclusionInformation about the HIV transmission rate to infants on the PMTCT program is not accessible or available at a sub-district or district level. As a result, local health managers and managers of the PMTCT program are unable to monitor the extent of the success of the PMTCT program.
Although there are faults with the system at Site A, as medicines for the program, testing kits and nutritional supplementation are available, mothers on the PMTCT program do not default. At Site B, although the referral pathway is simpler and all nurses are trained in VCT, the poor performance of the support services, pharmaceutical and laboratory in particular, and the unavailability of nutritional supplementation appear to contribute to considerable defaulting from the program.
RecommendationsGiven that nevirapine is highly successful in reducing the transmission of HIV to newborns, it is essential that the PMTCT program functions well and is monitored effectively.
In Paarl, local clinics should provide ANC services and all professional nurses should be trained in VCT.
In Rietvlei, the problems with the laboratory and pharmaceutical services must be addressed to improve the performance of the PMTCT program. In addition, PCR diagnostic tests should be introduced for testing at 14 weeks according to the national protocol.
206
RESULTSTHEMES SITE A SITE B
LABORATORY SERVICES
Turn Around Time for an Elisa Hospital: 1 – 2 days Clinics: 2 – 4 weeks TAT for a PCR 1 – 3 weeks
Staff satisfied with quality
Turn Around Time for an Elisa Hospital: 1 – 2 days Clinics: 1-3 weeks However, over December and January due to shortage of
staff in the lab, the TAT was over a month. Results for some tests “get lost” Staff not satisfied with quality
Stock outs of Rapid Test Kits Never
Stock outs of Rapid Test Kits Have had stock outs of rapid test kits. Last year when Parasheek test kits were brought in to
replace the Abbott ones, no one taught the staff what to do, so no 2nd tests were done for a couple of months.
PHARMACEUTICAL SERVICES There has never been a shortage of a
nevirapine or cotrimoxazole Nevirapine tablets are not stocked at the
clinics anymore
No nevirapine tablets at clinics for a year Nevirapine syrup has never been supplied to clinics. The
pharmacist says the bottle is too big and much will be wasted before it expires.
NUTRITIONAL SUPPLEMENTATION
Is supplied to infants on the program for 6 months
Never a shortage
Is supplied to infants for 12 months. Shortage last year for up to 8 months. One clinic supplying 4 instead of the recommended 8 tins.
ROUTINE MONITORING AND EVALUATION
No information on transmission rate to children at 14 weeks
86% of women delivering at hospital get nevirapine
99% of newborns given nevirapine 100% of newborns given AZT since April
2004 82% of women opting to formula feed
No information on transmission rate to children at 12 months
10% of women who delivered at hospital given nevirapine 12 % of newborns born at hospital given nevirapine No other data available
207
REVIEW OF BEST PRACTICES: DIFFERENCES BETWEEN DEVELOPED AND DEVELOPING HEALTHCARE SETTINGS FOR THE PREVENTION OF MATERNAL-TO-CHILD (PMTCT) TRANSMISSION OF HIV/AIDS
JM DippenaarSenior Lecturer Nursing ScienceMedunsa. University of Limpopo
IntroductionThe question of HIV/AIDS and the transmission of HIV from mother to child during pregnancy and birth are complex issued and even more so in the developed world with lack of resources. Midwives and nurses working in the rural areas in South Africa are faced with a dilemma and often feel powerless. In the final year nursing class, the realisation of the need to make sure that the learners leave the education with a good guideline and understanding of what is and what can and should be done regardless of the lack of resources prompted this study.
The teaching guide for PMTCT for low resource settingsA color-coded guide was developed for teaching purposes based on the available evidence of PMTCT HIV best practices compared with the WHO guides for low resource settings and other evidence. It compares the best practices in the developed healthcare systems, during pregnancy, birth and post delivery in terms of the risks, mode and incidence of transmission, contributing factors, period and time of highest risk, evidence-based interventions and treatment of choice and costs and side effects of the medication with other evidence.
On the other hand, the minimum standard of practice in low resource settings are evaluated in terms of evidence-based risk of transmission, guidelines for treatment, factors to consider in pregnancy, during birth and after delivery with special reference to breastfeeding practices and alternatives. It also indicates the risk associated with minimum treatment regimes and considers the costs for single dose treatment and the replacement feeding for a baby for a period of 6 months.
208
The learner should know the difference between the best practice and minimum standards of care. Often the learners are only exposed to minimum standards of care. In order to make a difference and give care of quality, it is required that every learner that enters the profession be well equipped and knowledgeable as well as confident in decision-making. This requires not only that they know and practice according to the guidelines of the DOH in terms of PMTC programmes, but also apply innovative and critical thinking in practice.
Modifiable Risk FactorsOf importance are the factors other than medical intervention and ART that play a role in the determination of the transmission of the virus and the well-being of the mother. These are listed under modifiable risk factors to alert the nurse or midwife what to look for and what other interventions to consider to assess the well-being of the mother e.g. the building of the immune system by the introduction of Vit A in the diet, the intrapartum modified interventions and the changed breastfeeding practices, with emphasis on cracked nipples and Candida infections of the baby as a factor for the MTC transmission in the postnatal period.
Evidence-based interventions for interventions to PMTCT of HIV in low resource settingConsidering all the evidence an algorithm was developed as basis for decision-making in low-resource settings, guiding the decision-making process. It asks 10 questions and depending on the answer the choice of action can be made.
ConclusionThis guide was developed to aid the teaching of basic and post-basic nursing students at a level 7 outcomes-based curriculum at a university. Considering the 500 babies that died recently in Botswana due to the changed breastfeeding practices, this instrument could be developed in a
209
decision-making guide for nurse practitioners and need to be subjected to empirical testing in further research.
210
RECOMMENDATIONS FOR SAFE INTRAPARTUM PRACTICES TO LIMIT VERTICAL TRANSMISSION OF HIV
A du Preez, E du PlessisNorth West University (Potchefstroom Campus)
An emergency reaction is required in Africa because HIV/AIDS is a reality which may be regarded as a developing crisis and a catastrophe. Because of the high vulnerability of women against HIV/AIDS there arose a need for health service provision to the HIV positive woman to focus specifically on the reduction of the transmission of HIV/AIDS from mother to child. Without the necessary preventative measures as many as 25-35% of the children of HIV positive mothers may be infected. The biggest percentage of infections, however, takes place during labour and the birth process. In first world countries the mother has access to choices and facilities to make an informed decision about antiretroviral therapy, as well as the method of birth. In the North-West Province not all these options and facilities are available, and therefore the knowledge and skills of midwives must be deployed to reduce vertical transmission of HIV during the intrapartum practice. It is important that midwives have the necessary knowledge about intrapartum practices and vertical transmission of HIV, in order to distinguish between risky and safe intrapartum practices.
A quantitative survey design was used.
Recommendations were accordingly formulated for nursing education, research and practice. This research particularly focused on improving midwives’ knowledge about intrapartum practices to reduce the vertical transmission of HIV, so that this knowledge may result in improved intrapartum practice.
211
IS THE BABY FRIENDLY HOSPITAL INITIATIVE (BFHI) STILL POSSIBLE WITHIN THE CONTEXT OF RISING HIV TRANSMISSION RATES AND THE USE OF FREE FORMULA?
Linda Glynn & Louise GoosenMowbray Maternity Hospital
The Baby Friendly Hospital Initiative (BFHI) is a joint international initiative by WHO and UNICEF, launched in 1991, to protect, promote and maintain breastfeeding within all hospitals/clinics delivering mothers.In the 21st century, with the rise of HIV, breastfeeding has been discouraged and formula feeding encouraged. The risk of HIV infection from breastfeeding has to be compared with the risk of increased morbidity and mortality from not breastfeeding. Breastfeeding protects babies from diarrhoea, infections particularly respiratory in the first months of life and remains optimal nutrition for all babies.All mothers are counselled and given the opportunity to choose which method they wish to use to feed there babies. However within the BFHI context, breastfeeding is to be protected and promoted. BFHI has been shown to improve breastfeeding rates. “In Cuba, where 49 of the country's 56 hospitals and maternity facilities are baby-friendly, the rate of exclusive breastfeeding at four months almost tripled in six years - from 25% in 1990 to 72% in 1996. In the first two years of BFHI implementation at the Central Hospital of Libreville in Gabon, cases of neonatal diarrhoea fell by 15%, diarrhoeal dehydration declined by 14% and mortality fell by 8%.” (www.unicef.org)In South Africa, free formula is given out for six months if the mother chooses not to breastfeed. Within the BFHI context, how do you become baby friendly if the mothers are using formula, teats and bottles?Within the hospital policy, the PMTCT programme is covered and the hospital uses sterile containers to make and store formula and babies are cup fed. Therefore no need for teats and bottles. Due to the increased risk of contamination, dummies should be discouraged regardless of feeding choices. Within the overall criteria for attaining BFHI status, formula feeding is not an issue. The main issue about whether we should continue with BFHI, even with rising HIV rates, is to protect and promote breastfeeding for all the HIV negative mothers within our country. Latest studies from Zimbabwe and Zambia show that exclusive breastfeeding does not have the transmission risk as previously thought. However it has been proven time and time again that mothers who choose to formula feed increase the risk of diarrhoeal diseases, respiratory infections and hospitalizations 6 times more within the first months of life. The WHO/UNAIDS/UNICEF infant feeding guidelines state that replacement feeding needs to be acceptable, feasible, affordable, sustainable and safe. Is this possible in South Africa today?One of the BFHI criteria is that staff needs to be trained to be able to help mothers breastfeed, manage breastfeeding problems and support mothers to maintain safe breastfeeding practices after discharge. Should this not be the way forward in a resource poor country, with increasing financial constraints and most importantly the health and nutrition of our children – the future of our country – at stake?
MAKING ANTIRETROVIRALS MORE ACCESSIBLE TO PREGNANT WOMEN IN KHAYELITSHA
Liesl DietrichObstetric Community MOMowbray Maternity Hospital
Introduction In 2004, CD4 count testing was started with the plan to refer the
pregnant women with CD4 counts <200 to the local ARV clinic (not the level 2 hospital unless complicated).
The HIV prevalence in Khayelitsha was 33% in 2004 and as a result, the queues at the Site B ARV clinic were long. In the past, the MOU (Midwife Obstetric Unit) mother did not get appointments and thus HAART was not started in pregnancy (often told to present after pregnancy). A prolonged treatment readiness programme precluded many pregnant women from accessing treatment.
We were, as a result, approached to start a satellite ARV clinic at Khayelitsha MOU in December 2004.
The percentage of pregnant women infected with HIV at KMOU was 29.5%
(Dec ‘04 - Nov ’05). During this same period, 9.4% of those diagnosed HIV positive,
required Highly Active Antiretroviral Therapy (HAART).
Methods of Establishing KMOU HIV/ARV Clinic MMH Community Senior Medical Officer trained by Ubuntu ARV clinic
doctors. Protocols introduced - see Figure 4. The ARV clinic is conducted weekly on-site assisted by KMOU
midwife, “Mothers to Mothers to be” support group and counsellors.
Aims Explore feasibility of having ARV/High Risk HIV clinic for pregnant
women with low CD4 counts on the site of the MOU.
213
Explore the value of having an ARV clinic on site for HAART treatment.
Methods of Data Collection The study population are pregnant women attending KMOU with CD4
counts <200. MOU Prevention of Mother to Child Transmission (PMTCT)
Programme register. The PMTCT programme identifies mothers requiring HAART (CD4 counts are routinely tested on all HIV positive mothers at booking).
MOU ARV register.
Discussion The High Risk HIV/ARV clinic at KMOU is a pilot project. Between 1 December 2004 and 30 November 2005, 5148 pregnant
patients booked at KMOU. Of these 4896 were tested for HIV of whom 1445 were diagnosed as HIV positive ie. 29.5% . Of those positive, 9.4% required HAART.
The high risk HIV clinic at KMOU ensures prompt assessment of patients requiring HAART. A significant number of patients present late at booking (31 - 34+/40 - see Figure 1) and thus a fast track system is essential.
This prevents unnecessary delays in commencing treatment allowing the unborn baby to benefit as well by decreasing transmission rates (see Figure 2). As mothers present late to the clinic we are forced to start HAART as a matter of urgency,
The longer the mother is on HAART prior to delivery, the lower the transmission rate. We aim to have patients at least 6-8/52 on HAART before delivery.
Problems encountered include high nursing turnover (thus continuous training is necessary); training of other doctors also needs to occur.
Obstacles faced by the HIV clinic: two patients defaulted clinic visits; two patients moved elsewhere, two attended other ARV clinics, two
214
experienced miscarriages, one had preterm delivery and two had stillbirths prior to commencing HAART.
The clinic provides “one-stop” care to our patients which alleviates issues of non-compliance (see Figure 3).
Results Two doctors trained (one recently moved to the Eastern Cape) Current doctor - received clinical training;
- attended an HIV course; - attended the dispensing course.
KMOU High Risk HIV/ARV clinic established in December 2004. 136 patients assessed for HAART of which 125 were started on
treatment. 11 left the clinic for various reasons (see Figure 1).
Conclusion On-site clinic enables fast tracking of patients. On-site clinic allows one stop treatment. On-site clinic disseminates skills and knowledge about ARVs to
doctors. There is a plan to integrate the ARV clinic into the High Risk
Antenatal Doctor clinic at the KMOU.
215
Diagrams
216
217
FETAL ALCOHOL SPECTRUM DISORDER (FASD) - A SOUTH AFRICAN PERSPECTIVE
Denis L ViljoenHuman Genetics Department, National Health Laboratory Service & Faculty of Health Sciences, University of Witwatersrand
Fetal Alcohol Syndrome (FAS) in South African populations represents the most serious birth defect. FAS is endemic in poor communities where family units have become dysfunctional and maternal education, nutrition and social and health services are at their poorest. Previous research has proven that a very high proportion of school-entry children in communities throughout the Northern Cape Province are affected with fetal alcohol spectrum disorder (FASD).
Two communities were invited to participate in the three phase prevention and intervention programmes. Birth records were collected from the local hospital & primary health care clinics. Criteria for inclusion were infants born within one calendar year seen at 9-18 months and followed up at 18-24 months. Two trained clinicians independently examined infants, to form a preliminary diagnosis. The Griffiths Mental Development Scales (GMDS) were completed on infants to assess development over six areas: locomotor, personal-social, hearing and speech, eye-hand coordination and executive performance. Subscale quotients and a general developmental quotient (DQ) were obtained. Mothers of participating infants were interviewed using an interview schedule developed and tested on local populations. Demographic details and any substance abuses were recorded and analysed. A Becks Depression Inventory assessing levels of depression amongst mothers in the community completed the data. De Aar’s Phase One prevalence rates (n=392) showed 15 (3.8%) FAS infants, 33(8.4%) with Partial FAS (PFAS), totalling 48 (12.2%) FASD affected infants. Prevalence rates obtained in Phase Three (n=164) reflect the presence of FASD in 18 (11%) of infants. Eighty -seven (25.1%) mothers were clinically depressed. Of the infants diagnosed with FASD (11) 25% of their mothers were severely depressed. Upington’s preliminary data illustrates similar findings of 54 (16%) of the 339 examined infants diagnosed within the Fetal Alcohol Spectrum Disorder. Of those examined 107 (31%) required some form of nutritional supplement. Prevalence rates of infants diagnosed with FASD concur with rates of diagnosis at school-going age. The public health implications for South Africa are immense and complicated by increased depression amongst mothers in these communities and the obvious lack of nutritional supplements for underweight infants. It is strongly urged that this be a starting point to reducing FASD and breaking the negative cycle.
218
A REVIEW OF 482 NEONATAL DEATHS AT A LEVEL II HSOPITAL
FS Bondi
The PPIP programme has been used in South Africa since 2000 to provide data on perinatal mortality from sentinel sites. Although our hospital was one of these sites, it dropped out in 2002 because of logistic and personnel problems.This is a non-PPIP audit of all neonatal deaths at Madadeni Nursery prior to the establishment of a NICU for our region.
Material and MethodsThis is a descriptive, prospective study involving all 482 deaths in babies 500g and above that were admitted at Madadeni Nursery between January 2002 and December 2005. The main reason for the audit was to determine the causes of death in non-ventilated infants and to evaluate the factors associated with fatal outcome.A special audit capturing form was used to keep accurate records and information obtained was documented by the author on all deaths soon after they demised. The data collected included basic maternal demographic and obstetric information such as: age, parity, mode of delivery and antenatal visits. For babies, data included: birth weight, apgar score and time of death.Since, in many instances, the allocation of one death to one cause is somewhat artificial when multiple causes operate synergistically, for the purpose of this series, the cause of death is the disease which initiated the train of morbid events leading directly to death. Also, in this report, perinatal asphyxia referred to severely depressed infants with apgar of 4 or less at five minutes.
ResultsGeneralDuring the 36 month period of this study, there were 20 276 deliveries (including 713 stillbirths) in Madadeni Hospital and it’s allied clinics. About
219
42% (8448) of these babies were admitted into the nursery. Their weight distribution was 1490 LBW (18%), 382 VLBW (5%) and 87 ELBW (1%) of the 8448 admissions. Overall, 18% of the entire admissions were LBW.
MortalityMortality figures revealed that 482 of the 8448 (6%) admissions died. The M:F ratio amongst the fatal cases was 1.7:1. About 77% (370 of 482) of those with fatal outcome were LBW and low apgar (below 7 at 5 minutes) was present in 53% of them. There were 65 infants with feeble heart beats and gasping respiration at admission i.e. moribund. The period before demise was available for 449 cases (Table 1). Of note is that 94% of the patients were early neonatal deaths.
Maternal FactorsThe majority of the mothers (333 of 482, 69%) reside within 15km of Madadeni and the rest live in distant places like farms. The age distribution of these mothers revealed that 149 (31%) were aged below 18 years and 138 (29%) were older than 35 years. Parity was one in 202 (42%) and three or more in 135 (28%) of the mothers. Whilst 44% (213) had one or no antenatal visits, 22% of mothers attended five or more times.
Causes of deathsPrematurity-related complications were the commonest cause of death, accounting for 158 of the 482 cases with fatal outcome. Perinatal asphyxia, respiratory distress and infection were the other leading causes of mortality (Table II).
DiscussionThis study was undertaken so as to identify the variety of causes of neonatal deaths (NND) in a level II hospital. As in the PPIP studies, we have shown that the commonest causes of neonatal deaths are prematurity, perinatal asphyxia and infections. These three factors
220
accounted for 71% (341 cases) of deaths. However, we believe our study has provided more detailed or expanded diagnostic categories that were not evident in PPIP. For instance, pulmonary haemorrhage or DIC and hypothermia featured prominently in our series. Whilst DIC usually has an underlying cause such as septicaemia, for the purpose of this study, we believe it was the immediate event leading to fatal outcome. Also, in this study, hypothermia occurred in our outborn babies en-route to Madadeni.
Of note, also is that in this investigation, deaths occurred too soon. This is likely due to limited and ill-equipped staff providing perinatal care. Worldwide, it is well known that 75% of NND occur in the first seven days and this is usually due to weak health systems.
Finally, whilst this study has its limitations, such as diagnostic classifications, we believe it does provide a broad overview of the problems leading to neonatal death in a peripheral hospital.
Table I Duration of Admission before DemiseDuration of Admissions Number of cases0-6 hours 88 (19.6)6-12 hours 49 (10.9)12-24 hours 80 (17.8)24-72 hours 153 (34.1)4-7 days 54 (12.0)7 days 25 (5.6)Total 449 (100)Deaths within 24 hours 48%Deaths within 7 days 94%
TREND IN SURVIVAL OF NON-VENTILATED VERY LOW BIRTH WEIGHT INFANTS (1993-2005) AT MADADENI HOSPITAL
FS BondiMadadeni Hospital
IntroductionSurvival of very low birth weight (VLBW) babies has been the subject of many studies in both developed and developing countries. However, most of these reports are focused on infants in tertiary care centres in large metropolitan areas. It is difficult to extrapolate the data obtained in major centres to peripheral hospitals because of a number of factors. These include, poor socio-economic conditions, absence of intensive facilities and limited number of staff with knowledge and skills in neonatal care in smaller hospitals.
Madadeni Hospital and it’s nine midwifery-run clinics provides the main neonatal services in northern KwaZulu-Natal for a population of about 1.5 million. The nursery has capacity for 40 babies. Respiratory support for moderate to severely distressed babies is provided mainly by NCPAP. The nearest NICU is about 300km away in Pietermaritzburg. Thus, frequently critically ill or very premature babies are cared for in our nursery. It is against this backdrop that we have conducted this study for, we believe, a large number of public hospitals in South Africa operate under similar circumstances.The primary aim of this investigation is to determine the survival rate (SR) up to hospital discharge in babies weighing 500g-1499g from 1993 to 2005.
MethodsThe first phase of this study comprised 758 babies, who were studied retrospectively from 1993-2001. The results of that study revealed that only 160 of the 758 (21%) infants survived. As a result of this dismal record, we instituted a series of programmes in 2002 aimed at improving SR of VLBW. The second phase comprised 476 babies who were
223
prospectively investigated between 2002 and 2005 to determine whether the interventions listed below had any impact on SR:1. Devolution of maternity services to the clinics.2. Nevirapine to HIV exposed babies.3. Early use of nasal CPAP.4. Intermittent kangaroo mother care.5. Trained two nurses in neonatal medicine.6. Monthly visits by a consultant neurologist.Survival rate (SR) was defined as the percentage of babies living up to hospital discharge at 2000g.
ResultsPerinatal Features of VLBW infants admitted to Madadeni NurseryA total of 1234 VLBW babies (M:F=1:1.4), representing 3.7% of the 33 423 entire admissions from 1993 to 2005 were involved in this series. About 24% (294 of 1234) weighed between 500-999g whilst the remaining 940 cases weighed 1000g or more.Antenatal care (one or more visits) was present in 54% of the mothers. Only 179 or 14.5% of the babies were outborn.The mode of delivery was per vaginuum in 93% of the 1234 VLBW babies and the remaining 7% were caesars.Whilst we were unable to determine the number of VLBW babies exposed to HIV, the number of infants receiving Nevirapine at Madadeni Nursery has steadily increased: 261, 440 and 976 for the years 2002, 2003 and 2005 respectively. Contrarily, only 4.2% of our mothers were WR positive.
SurvivalsOverall, only 354 of the 1234 VLBW (28.7%) infants that were studied between 1993 and 2005 survived. The SR for the 2002-2005 cohort was much better than the 1993-2001 group, 40.8% against 21.1% respectively and this was evident in all weight categories. The trend in SR is depicted in Graph 1. It was lowest in 1999 (15.1%) and highest in 2002 (56.7%). Of
224
note is that although SR improved after the implementation of a variety of intervention programmes in 2002, there was no consistent pattern.
MortalityThe commonest cause of death in the 2002-2005 group was prematurity and its complications namely: respiratory distress syndrome, immaturity, necrotising enterocolitis and intraventricular haemorrhage. The diagnosis of immaturity was entertained in infants weighing below 800g in whom other causes of death could not be identified.
Low Apgar (below 6 at 5 minutes) or perinatal asphyxia, with or without hypoxic ischaemic encephalopathy, was the second commonest cause of death. Respiratory distress incorporated pneumonias and other ill-defined causes of severe rib retraction. Hypothermia accounted for about 10% of the fatal cases. Bleeding disorders were those infants who exhibited pulmonary haemorrhage and/or dessimated intravascular coagulopathy terminally. The causes of death for the period 1993-2001 could not be established.
DiscussionIn South Africa, three levels of neonatal care have been identified. In the private sector, babies have access to the best available technology. The second group consists of infants born in large public hospitals. They also have access to all levels of care except that infants below 1000g may not be ventilated as a result of limited resources. The final group comprises babies delivered outside the major centres, who frequently receive only rudimentary neonatal care. This investigation was undertaken to determine the survival rates (SR) of VLBW infants in level II nursery with sparse resources.This before- and after-study involved a total of 1234 VLBW infants that were admitted to our nursery between 1992-2005. The first 758 of these babies were admitted from 1993-2003. These were retrospectively analysed and it was found that only 21% survived. This figure contrasts
225
sharply with the SR of about 90% in recent reports from major centres in South Africa.From 2002, we put in place a number of low cost programmes aimed at improving SR of VLBW infants. These include exclusive breastfeeding, liberal use of nasal CPAP and kangaroo mother care. The period (2002-2005) following the implementation of these interventions resulted in a remarkable improvement in SR to 40% and this improvement was evident in all weight categories.Although our investigation has an advantage of bringing to focus the relatively poor outcome of VLBW in resource-poor settings, it should be interpreted with caution. This is because the effective implementation and sustainability of the strategies adopted in this report was hampered by many problems. These include, low nurse-infant ratio, overcrowding of the patients, the siege of HIV and the rapid rotation or departure of core nurses. It is possible that these factors further compromised the quality of care given to our patients and thus the outcome. The Perinatal Problem Identification Programme (PPIP) has noted that substandard care is a major impediment to optimal neonatal care, especially in the peripheral hospital and clinics.
The main causes of death in this series namely, prematurity and low Apgar, compare favourably with those in a tertiary setting. However, infection featured less frequently in the present report and this is probably due to under-diagnosis. The other difference was that whilst hypothermia featured prominently in the current series, it does not seem to feature in the earlier reports.
In conclusion, whilst every infant needs the best start in life, the reality is that in developing countries, many newborns do not have access to optimal neonatal care. Nevertheless, it is possible to reduce neonatal deaths substantially even in the absence of highly complex technology.
226
227
NEONATAL CHARACTERISTICS AND OUTCOME OF BABIES WEIGHING ≤1250 GMS AT BIRTH FOR 2003-2004 AT KING EDWARD VIIITH HOSPITAL, DURBAN, SOUTH AFRICA.
Adhikari M, Singh R, Moodley A. Department of Paediatrics Nelson R Mandela School of Medicine, University of KwaZulu Natal.
BackgroundPerinatal audit has provided the basis for improving and providing standards of care in perinatology. Babies with low birth weight have a greater likelihood of dying in the neonatal period and infancy than babies with adequate birth weight. Based on previous very poor outcome of a mortality of greater than 90% babies less than 1000gms were not offered ventilation. This was based on severe resource constraints and the lack of support available for the handicapped. Over the past few years at King Edward VIIIth Hospital five years surfactant replacement therapy has been safely be given to babies of all gestational ages and weights followed by nCPAP . Therefore, in the 1980s a decision, based on restricted resoures and poor clinical condition at birth, was taken at Priorities in Perinatal Care to limit ventilatory care to babies weighing less than 1000 gms. However, there were exceptions to this practice and with time the care and the outcomes of these vulnerable babies appears to have improved considerably.Papers were presented at the Abbott Round Table Meeting in 2005 presenting a case for the small vulnerable baby weighing less <1000 gms at birth. The perinatal data form the Neonatal Unit at King Edward VIIth Hospital have shown improved survival over the years. Follow-up of those who attend the clinic has shown good neurodevelopmental outcomes.The severe resource restrictions including that of staff, increased admission of low birth weight babies often result in the cut-off weight for resuscitation to be increased to 1250 gms.
AimThis audit was undertaken to establish the outcome of babies weighing ≤1250gms at birth.
228
Methods The clinical characteristics and follow-up details of all babies born weighing ≤1250gms at birth born in 2003 & 2004 and followed to the end of 2005 were reviewed.Maternal and neonatal data were recorded on the follow-up forms of those mothers who agreed to attend the neonatal clinic. Counselling for the clinic attendance was undertaken by the nursing staff. Only mothers living in the catchment area of KEH were requested to attend the clinic. Those from a distance were given detailed summaries on referral to the clinic nearest their residence.
Statistical AnalysisAll data were captured in Epi Info 2000 and analysed on this programme.
ResultsBirth weightsFor the period 2003 to 2004, there were a total of 12550 deliveries, 2553 (20%) were low birth weight. During this period, 122 babies weighing 750-999gms were born, 75 died, 47 survived (39% survival); 291 babies weighing 1000-1250gms were born, 105 died and 186 survived (64% survival).51 babies weighing 750-999gms and 186 weighing 1000-1250gms were reviewed, a total of 237 babies.
Neonatal characteristics64% were light for dates, 47% of the pregnancies had associated obstetric complications (PIH/eclampsia, abruptio, PROM, multiple pregnancy) and 69% were delivered by caesearean section. Major respiratory problems (107 babies) were HMD in 54%, pneumonia in 42%. Forty-eight babies had abnormal scans, 10% of these had significant IVH. Infections were diagnosed in 90 babies (22 septicaemia, 54 suspected sepsis, 3 congenital syphilis, 8 NECs, 2 TB exposed, 1 CMV).
229
Of those receiving ventilatory support, 33 were ventilated (2<1000gms) and 41 given NCPAP (5 <1000gms).
Follow-upOf the 51 babies weighing 750-999gms, 14 attended clinic and 186 weighing 1000-1250gms. Of the 200 babies 31% (63) never attended the clinic, 35% (69) attended for 6-12 months, 37% (71) for 13 -24 months. Of those attending for more than 1 year, 2 babies were microcephalic, one hydrocephalic, 1 floppy, 4 had ROP, no babies were deaf. 48 mothers were HIV positive, 11 negative and the status of rest were unknown. Six mothers and 2 babies died, all HIV TB related.
ConclusionFollow-up was poor despite the extensive counseling of mothers. Of those weighing 750-999gms, the majority did not attend follow-up. The reasons may not be clear and the assumption that the babies have died may not be correct either. Of those who were available at 13-24 months the outcome was acceptable. It would appear to be reasonable to provide optimal care for these babies. The major issue is the outcome of those not attending clinic. It is necessary to conduct an in-depth audit which includes a follow-up period of two years to detect major medical and social problems in order to understand the lack of. A further longer-term study is required to establish the outcomes at school, parental responses to the care we offer to very small babies.
230
PERINATAL MORTALITY, NEONATAL MORTALITY AT KING EDWARD VIIITH HOSPITAL, DURBAN, 2004
Adhikari M*, J Moodley^, R Singh*Department of Paediatrics*, Department of Obstetrics^.Nelson.R.Mandela School Of Medicine.
BackgroundFor many years perinatal audit has provided the basis for improving and providing standard of care in Obstetric and neonatal practice at King Edward VIII Hospital, a high risk referral centre. In many areas the advanced midwife has to manage the mother and the baby in the labour ward and the nursery. Thus training of advanced midwives was undertaken from the 1980s. Realistic outreach programmes were developed as far as it was possible in the Province. Over the years there has been an improvement in the care and outcomes of the newborn. Equally important the quality of referral of both mother and baby have improved.
AimThe aim of this analysis was to review the perinatal mortality and specific aspects of neonatal mortality related to obstetric practice.
MethodsData on every neonatal death were recorded and included maternal, delivery and neonatal details.
Statistical AnalysisAll data were captured on EPI Info 2000 and analysed on this programme.
ResultOverallA total of 6039 babies were delivered of whom 3299 (54%) were admitted to the nursery and 1310 were low birth weight (22%). 167 babies died, 127 were early neonatal deaths and 38 (23%) were late and post neonatal
231
deaths. The ENNDR was 21. 385 babies were stillborn, the SBR was 63.7, the ratio of SB:NND 2.3:, PNM 84. An average of 14 babies die per month – an increase in the numbers of deaths was noted in January, July and November 16,18 & 19 respectively. LBW infants comprised 87% (146/167) of all deaths.The percentage survival of the birth categories were 999gm - 30%, 1000-1500gm - 77%, 1500-2499gm - 96%, 2500gms - 99%. Corrected survival for babies weighing 2500gm at birth - 99.6%.Multiple pregnancy rate was 23/1000, in the United Kingdom it is 12/1000. Complications in pregnancy were seen in 114 of the 167 (68%) of the neonatal deaths which included PIH, abruption placentae, multiple pregnancy, IUI/PROM, FD/MSL, IUGR. Caesarean section was the mode of delivery in 52% and 22% delivered vaginally.13% of mothers had lost previous babies. 20% of all mothers whose babies were admitted to the neonatal unit were HIV positive.
Neonatal DetailsThe major cause of death was asphyxia (61%) in babies of weighing >2500gms and in LBWI with IVH 28%, proven sepsis in 10%, clinical sepsis in 13%, pulmonary conditions (HMD, pulmonary haemorrhage and pneumonia) in 24.6% and NEC in 2.7%.Eleven percent of the deaths were HIV associated.107 were ventilated (preterm 82 and term infants 25). 54% of the NND occurred within 48 hours of birth. The major cause of death in those dying in the late neonatal period was septicaemia.Periventricular leucomalacia was diagnosed in 12 (7%) of the deaths. Three babies weighed 750gm and a fourth was a term infant weighing more than 2500gm – all died in the first week of life and all, therefore, the insult must have occurred in utero.In 1985, the ENNDR was 35 and this declined to 25 in 1999. In 2003, it was 30 and now stands at 21.
Conclusion
232
The ENNDR has declined with improving intervention, SBR is unchanged and need some urgent explanation. The proportion of LBW has remained unchanged over the years. There has been an increase in LNND due to sepsis - one has to consider whether respiratory intervention prolonged an inevitable death or if HIV infection (intrauterine) played a role.The number of HIV positive mothers is not a true reflection of the situation. The role of HIV/AIDS in the newborn has to be examined and the need to do CD4 counts, HIV DNA PCR AND HIV Viral loads on all newborns exposed to HIV+ve mothers need to be considered.
233
MATERNAL AND NEONATAL PROFILE AND IMMEDIATE OUTCOME OF EXTREMELY LOW BIRTHWEIGHT BABIES – IMPORTANT LESSONS
MPB Mawela1, T Mashamba2
1. Division of Neonatology, Department of Pediatrics2. Department of Obstetrics & Gynaecology
Dr George Mukhari Hospital/University of Limpopo (Medunsa Campus)
SummaryThis study was done to ascertain the maternal and neonatal profiles and immediate outcome of extremely low birth weight babies admitted to the neonatal unit in the year 2004 and to use the data to determine how the management of this group of babies could be improved.
Subjects and MethodsThis was a retrospective analysis of case records of all babies <1000g who were admitted to the neonatal unit from 1 January 2004 – 31 December 2004.The following maternal characteristics were determined – age, parity, antenatal care status (booking status), pregnancy complications, place and mode of delivery.The babies’ profile were also determined for gender, Apgar scores both at 1 minute and 5 minutes, admission temperature, weight, gestational age and most common diagnosis on admission to the neonatal unit. The time to death (length of stay in the unit) and causes of death were also determined.
ResultsDuring the study period, a total of 1378 babies were admitted to the neonatal unit. Eighty-eight of these babies (6,3%) were extremely low birth weight babies.
The maternal ages ranged from 15-43 years with the majority of mothers being in the age group 18-35 (83%). 66% of the mothers received some antenatal care. The commonest pregnancy complications that led to
234
preterm labour were spontaneous preterm labour (41,4%), hypertensive disorders (28%) and foetal distress (20%). Most of the babies were inborn (84%) and were delivered by vaginal delivery (75%)
The BabiesEighty eight babies <1000g were admitted to the unit, 43 males, 42 females and sex was not recorded in 3 babies. Seventy three (83%) of these babies died in the unit, an alarmingly high mortality rate. Half of the patients died within the first 72 hours of admission. The mean Apgar scores at 1 minute was 4 and at 5 minutes was 5. The majority (93%) of babies were found to be hypothermic on admission with a range of admission temperatures between 320C-380C. The weight range of these babies was 300g-990g with a mean weight of 781g and a mean gestational age of 26,6 weeks.
The commonest diagnosis on admission are given in the table below:DIAGNOSIS NUMBER PERCENTAGERespiratory distress 82 93%Birth asphyxia 5 5,6%Others 1 1,4%
None of the babies were ventilated (according to unit policy).
Respiratory distress syndrome was a cause of death in 71% of these babies who died within 72 hours, while sepsis was the commonest cause of death in half of the patients who survived beyond three days.
The majority of the survivors were in the weight category 750 – 999g and 73% of these survivors were born from mothers who had antenatal care.
DiscussionThe mortality in the group of patients was extremely high (83%). Birth weights in the survivors were higher as compared to non-survivors. The mean Apgar scores at 1 minute and 5 minutes were low and may contribute to the high mortality. Hypothermia is an important risk factor
235
for death and hypothermia was found universally in most patient on admission. Half of the babies died within the first 72 hours of admission due to respiratory distress syndrome and this may be a reflection of the current unit policy not to ventilate babies <1000g.
ConclusionThe lessons learnt from this report are briefly:
The need for a delivery room management plan which will include prompt and appropriate resuscitation of ELBW babies in a warm area.
Immediate transportation of these babies from labour ward to the neonatal unit in warm incubators.
Providing other means of respiratory support for these babies other than ventilation e.g. nasal CPAP and conduct ongoing audits to guide effective interventions and policies within the neonatal unit.
236
HUMAN MILK BANKING IN SOUTH AFRICA
L GoosenMowbray Maternity Hospital
IntroductionBefore HIV and AIDS become a reality in SA we did have organised human milk banks (HMB). The first post HIV HMB was started by Prof Anna Coutsoudis in 2001.
The iThemba Lethu Breastmilk Bank supplies donor milk to the iThemba Lethu Transition Home in Durban. In Gauteng we have the SA Breastmilk Reserve, now a section 21 company. Having heard Prof Coutsoudis’s presentation on human milk banking, a Cape Town group of IBCLC’s (International Board Certified Lactation Consultants) accepted the challenge. Subsequently ‘Milk Matters’ evolved as the Cape Town Human Milk Bank Branch. The intention was to feed orphans but our project evolved differently: We presently supply Dr Paul Roux’s Kids Positive initiative at GSH with
donor milk for children admitted with chronic diarrhoea. However our primary objective is to supply donor milk to micro-prems.
Interest and growth in Human Milk Banking in SA continues to be phenomenal and negotiations with the National Department of Health regarding the setting up of a National Regulating Body have commenced.
In spite of the limited recourses at hand ‘Milk Matters’ is succeeding in providing an ever increasing number of infants with a constant supply of safe donor milk.
To date ‘Milk Matters’ has been instrumental in organizing and setting up three pasteurisers in Cape Town. These are situated at GSH, TBH and Panorama Medi Clinic. Although the hospitals are encouraged to find
237
donors amongst their own patient population, the bulk of the milk is still supplied by ‘Milk Matters’.
The practicalitiesProf Anna Coutsoudis was able to assist us in obtaining a donation from UNICEF. This was used to purchase freezers, pasteurisers and print posters to seek donors.
Most of our initial donors were mothers who were expressing more than they needed for their own premature infants. The respective NICU’s would then alert us of the milk left in their freezers.
The practicalities of obtaining a screening form, collecting, transporting and providing safe milk to our babies remains a challenge.
All donors are required to fill in a screening form, which includes the inevitable question of HIV testing. First choice is to have a recent HIV screening result. Failing this we obtain permission from the donor to screen her milk. We provide protocol guidelines but encourage our branch hospitals to edit these to suit their own circumstances.1. Donors who contact us are provided with autoclaved glass jars to
express into, with the relative instructions pertaining to hygiene and storage.
2. As they are mostly expressing for premature babies, we ask our donors to use one jar per expression and to cool then freeze it straight away.
3. The milk is pasteurised by the Holder method i.e. heated to 63°C for 30 minutes, cooled rapidly and refrozen. We have recently learnt about the flash method of pasteurising and may very well implement it soon.
4. Internationally milk is pooled before pasteurising; this is supported by regular bacteriological and virological tests.
238
5. Presently only monthly bacteriological tests are done at GSH where most of our pasteurising is done.
6. We, therefore, prefer to keep the milk in the jar that it was received in, pasteurised in and refrozen. Ideally the NICU refrigerates these defrosted jars of pasteurised milk and withdraw what they need over the next 24 hours. When used in a syringe driver, at room temperature, it would be safe to follow the relative NICU policy regarding the time formula is safely kept, usually around ± 6 hours.
ResultsThe results are what keep us motivated. The NICUs using donor milk have reduced their NEC significantly. Seven hospitals, 3 public (with another standing in the wings) and 4 from the private sector are presently using donor milk.
Most importantly, however, Milk Banks must not take over the mother’s role as the primary provider of mothers milk for her baby. First choice for any baby is still his mother’s milk, even if she is HIV positive, in which case, the milk is pasteurised by Pretoria’s Pasteurisation Method. Donor milk is meant for those babies whose mothers are unable to provide milk for their own babies. The same principle applies to the private sector.
ConclusionIf there are babies in your nursery who could benefit from donor milk or a nearby orphanage with babies suffering from chronic diarrhoea, why not facilitate the setting up of another human milk bank. Any one of us would be more than happy to share what we have learnt so far. Contact Louise or Linda at 021 659-5599 or Jenny at 083 7716230.
239
INFANT FEEDING PRACTICES IN A HIGH HIV PREVALENCE RURAL DISTRICT OF KWAZULU-NATAL
Ghuman MR, Morris GP, Saloojee H.
IntroductionAppropriate feeding practices are of fundamental importance for the survival, growth, and development, of infants and children everywhere. The WHO and UNICEF recommend exclusive breastfeeding for six months. In 1998, the South African Demographic and Health Survey (SADHS) showed that only 10% of mothers exclusively breastfeed at 3 months. Several researchers internationally have found that breastfeeding is supplemented from an early age (even in the first month), with milk, water, fruit juice, tea, gruel, cereal, fruit and vegetables. Research has confirmed that infant feeding practices are influenced by numerous factors. However ultimately mothers feed their infants in a manner they feel comfortable with, even if it is not always the most appropriate choice.
Early mixed feeding is of concern as it is one of the factors that is responsible for malnutrition, growth faltering and the high mortality rate in infants in developing countries. Poor infant feeding and weaning practices can lead to stunted growth, delayed motor and mental development, immune incompetence, frequent attacks of diarrhoeal disease, macro- and micro-nutrient deficiencies and, most importantly, interference with the realisation of full human potential.
Definitions of Feeding Patterns
Exclusive breastfeedingThe infant has received only breast milk from his/her mother or a wet nurse, or expressed breast milk and no other liquids, or solids with the exception of drops or syrups consisting of vitamins, mineral supplements, or medicines.
Exclusive formula feedingGiving baby a formula milk and any other fluid, with the exclusion of breast milk (personal communication Rollins NC and Coutsoudis A on 26/06/2005).
Mix FeedingGiving a baby some breast milk and also any other fluid, even a teaspoon of water.
240
MethodsThe study was conducted in the Ugu-North Health District, 50km south of Durban in KwaZulu-Natal (KZN). The resident population of 650,000 is Zulu speaking and predominantly rural. The health infrastructure consists of a 300-bed community hospital (GJ Crookes Hospital) situated at Scottburgh and 19 fixed clinics. Almost all pregnant women deliver their infants at this hospital, which was declared Baby-Friendly in 1995. A prospective study was undertaken. A cohort of 168 mothers, who delivered their babies at GJ Crookes Hospital from 22 August 2003 to 21 September 2003 were interviewed within 24 hours of delivery and followed up at 14 weeks post-partum at their immunisation points in local clinics.
Figure 1: Flow of participants
ResultsThe mean age of study participants was 24 years. Most (87%) participants were single while few (12%) were legally married and living with their partner and 85.6% had received some form of schooling. A third of
BBA live out of study area: 1 (0.3%)
BBA live in the study area: 2 (0.7%)
Total Deliveries: 280 (100%)
Deliveries in GJ Crookes Hospital: 277 (99%)
Born before arrival(BBA): 3 (1.0%)
Stillbirths: 17 (6.1%)
Eligible for study: 170 (60.7%)
Live out of region:90 (32.1%)
Refused to be interviewed: 2 (0.7 %)
Enrolled in study:168 (60%)
Drop-out at follow-up:51 (30%)
Interviewed at 14 weeks: 117 (70%)
241
participants were still at school while falling pregnant, and 38.6% of them said they would not return to school. About 40% of participants had an income of less than R1000, 37% had electricity and 18% had an electric stove. More than one third of mothers were using river water and only 9% had flush toilet. There were 23 mothers who were on PMTCT programme and their babies received nevirapine.
Feeding Practices at BirthThe vast majority (162 [97%]) of babies received breast milk as their first feed. The remainder were formula-fed (5 [3%]). Two-third of babies were fed within half an hour of birth (a baby-friendly criterion). The majority (85.1%) of mothers fed colostrum to their babies: 23 (13.2%) said they threw it away. Most (40%) believed that it was “dirty milk.”
Mothers were asked how they would be feeding their babies at home for the next 14 weeks: the majority (61.9%) said breastfeeding and a high proportion (32.7%) said mixed feeding. Participants who proposed to breastfeed exclusively offered variety of reasons. The majority mentioned disease prevention. When asked for the reason for choosing mixed feed, most of them pertained to their convenience (i.e. mother going to school or work).
Feeding Practices at 14 WeeksOf the 117 mothers at follow-up, just over half (62 [53%]) were still breastfeeding, 22 (18.8%) were formula feeding and 33 (28.2%) were breast and formula feeding. Sixty-one (52.1%) infants had received water by 14 weeks and 85 (72.6%) were given solids. Eighty-one (69.2%) received both soft porridge and cereals. There were only 5 (4.3%) mothers who could practise safe transition from exclusive breastfeeding to formula feeding. Only 23 (17.9%) mothers were exclusively breastfeeding at 14 weeks. The main reason for giving solids was that the baby was still hungry after taking milk feeds.
242
Table 1: Infant feeding practices at follow-up (n = 117)Feeding practice
FrequencyPercentage
Exclusive breastfeeding 21 17.9Exclusive formula feeding 1 0.9Safe transition from EBF to FF 5 4.3
Mixed feedingBreast and formula feeding 5 4.3Breastfeeding + solids 41 35.1Formula feeding + solids 16 13.6Breast and formula feeding + solids
28 23.9
Total 117 100.0
Figure 2: Participants’ feeding practices at baseline, as predicted and at follow-up (n = 117)
0102030405060708090
100
breast formula breast andformula
Perc
ent Baseline
PredictedFollow up
There was a decrease in breastfeeding and an increase in formula feeding. Slightly fewer participants were breast and formula feeding at follow-up than predicted. Reasons for changing feeding practice are shown in Figure 3.
243
Figure 3: Reasons for changing feeding practice between baseline and follow-up
0 5 10 15
Medical condition
Work related
Domestic pressure
Going to school
Baby was not full
Mother HIV positive
Mother died
Number of respondants
Only socio-economic status (SES) and use of nevirapine was significantly associated with feeding at baseline. High SES mothers were more likely to formula feed their infants than low SES mothers (p = 0.03). Mothers on PMTCT were also more likely to formula feed than the mothers who were not on PMTCT programme (p = 0.019).Only parity was significantly associated with colostrum use at baseline. Primiparous mothers were more likely to give the colostrum to the baby than the multiparous mothers (p = 0.002). DiscussionA high percentage of mothers were teenagers and were still attending school when they fell pregnant. This represents a very high level of teenage fertility and is a serious source of concern to the government, communities and researchers. Despite a high awareness about HIV/AIDS, MTCT knowledge among mothers in the study area was low. Also most of mothers receiving advice on infant feeding were unaware of the increased risk of HIV infection through breastfeeding. The study identified high breastfeeding initiation rates but early introduction of supplementary feeds. This relates well to the high level of breastfeeding initiation (95%) found in previous South African studies.
244
Primiparous mothers were more likely to give colostrum to their babies (p=0.002) than multiparous. They may have been more receptive to modern messages, and old enough to make their own decisions, and have their own social network. Notwithstanding the high rate of breastfeeding initiation, the study findings are alarming. Many mothers proposed to formula and mixed feed their infants at birth and even more practised formula and mixed feeding before 14th week post-partum. Mothers reported that the decision to feed their infants something other than breast milk was mainly their own, followed by the advice from their mother (infant’s grandmother) and infant’s father. The fact that the majority of mothers did not live with the infant’s father could be the reason why the infant’s father did not feature as a major role player in influencing the mother to give the infant something other than breast milk. In Ugu North Health District, avoidance of breastfeeding is not a safe option for many women. More than a third of the study participants (37%) were using river water and almost half used wood as their source of fuel for cooking. Even if formula feeds were provided freely in this area with one of the highest prevalence of HIV in the world, women do not have the facilities to prepare feeds safely. However, exclusive breastfeeding does not appear to be a viable option either. Currently, the most common mode of feeding is mixed feeding, which is associated with increased mortality and morbidity and the highest rates of MTCT. Health services in developing countries formulating polices concerning HIV and infant feeding must proactively support exclusive breastfeeding to make this a realistic choice for both HIV-uninfected mothers and HIV-infected women who wish to breastfeed.
245
JOEYS LIVE – KANGAROO MOTHER CARE SAVES LIVES
RC Pattinson, Anne-Marie Bergh, AF Malan*, Roz Prinsloo, for PPIP sentinel sitesMRC Maternal and Infant Health Care Strategies Research Unit and University of Pretoria*Neonatal Medicine, School of Paediatrics and Adolescent Health, University of Cape Town Background and AimKangaroo mother care (KMC) is recommended as a strategy to improve the quality of neonatal care and infant survival. More and more hospitals appear to implement KMC, but we have no information or data on the number of hospitals practicing KMC or how they are doing it. Some provinces have special programmes and policies, but apart from anecdotal reports, we don’t know if KMC is making any difference. The aim of this study was therefore to establish whether there was an association between neonatal death rates and the introduction of KMC in hospitals using the Perinatal Problem Identification Programme (PPIP) in South Africa. MethodA survey was conducted of the PPIP sentinel sites in South Africa, requesting information on the practice of KMC in the hospital and if practised, when it had been initiated. Data on live births and the neonatal deaths of infants between 1000g and 1999g for each institution was obtained from the national PPIP database and, where applicable, divided into two periods, before and after the introduction of KMC. Relative risks were used for comparison.
ResultsThe response rate to the survey was 54%, with 78 of the 145 sites responding. Every province and level of care were represented. Seventy (90%) of the responding hospitals were practicing KMC.
Of the 78 sites, 49 had data in the PPIP database. Nine of these had to be excluded from statistical analysis due to missing or unreliable data. The 40 remaining hospitals yielded a total sample size of 17855 births between
246
1000-1999g. Of these, 8 hospitals had not initiated KMC by January 2005, 21 hospitals had PPIP data for a period after KMC had commenced, and 11 hospitals had PPIP data for periods before and after the introduction of KMC. The neonatal death rate (NNDR) for all hospitals with no KMC or before the introduction of KMC was 87.29/1000 live births, whereas the NNDR for hospitals with KMC or after the introduction of KMC was 71.40/1000 live births (Relative Risk 0.81; 95% Confidence Intervals 0.72-0.91).
The sample size for the 11 hospitals with reliable PPIP data for periods before and after the initiation of KMC was 8197 live births, with 3665 before and 4532 after the introduction of KMC. The number of deaths were 318 and 275 respectively. Therefore the NNDR was 86.77/1000 live births before KMC and 60.68/1000 live births after KMC had been introduced, yielding a reduction of 30% in the neonatal death rate (Relative Risk 0.62 95% Confidence Intervals 0.53-0.73).
The results should, however, be interpreted with caution. A large number of respondents (37%) did not have PPIP data in the national database. The comparison between sites that had not or had implemented KMC is also open to significant bias. This is somewhat counteracted by results extracted for hospitals with “before-and-after” data. The study also did not compare the results with the neonatal deaths of larger infants. As only data from PPIP sites were used, we have no information on other institutions. Although this study was not very elegant, the magnitude of reduction in deaths and the large samples of neonates between 1000g and 1999g add some robustness to data.
ConclusionThis survey resulted in the first demonstration of the value of national surveys such as the “Saving Babies” perinatal care surveys based on the
247
PPIP national database for gauging the potential impact of recommendations. The large and significant reduction in the NNDR of neonates between 1000g and 1999g is associated with the introduction of KMC. KMC is recommended as the method of choice for caring for stable neonates in all hospitals that care for immature infants in South Africa.
AcknowledgementThe authors would like to thank all the PPIP users for replying to the survey and continuing to supply PPIP data to the national database. Without you, this study would not have been possible.
248
UKUBAMBA UMTWANA KUWE OUTREACH: IMPLEMENTATION OF KANGAROO MOTHER CARE IN MPUMALANGA
Annemarie Davis1, Anne-Marie Bergh2, Elise van Rooyen2, RC Pattinson21 Sub-directorate: Nutrition, Mpumalanga Department of Health and Social Services, 2MRC Research Unit for Maternal and Infant Health Care Strategies and University of Pretoria
IntroductionThe Ukubamba Umtwana Kuwe Outreach is a priority project of the Sub-directorate: Nutrition of the Mpumalanga Department of Health and Social Services within the Integrated Nutrition Programme. It is aimed at implementing kangaroo mother care (KMC) as a sustainable practice in all hospitals in the province between 2004 and 2006.
AimThe project is combined with a randomised trial testing the effectiveness of two different implementation outreach strategies built around a multimedia KMC implementation package.
MethodIn 2004, the project included 8 hospitals and in 2005, another 11 hospitals. In 2006, an additional 7 hospitals will be covered. All targeted hospitals are invited to participate and their CEOs sign an undertaking of commitment to implementation. Participating hospitals attend an introductory workshop and receive the implementation package. They are paired and then randomly allocated to two different strategies. Hospitals in one group receive additional training at a site of excellence (off-site, ‘hands-on’ facilitation). Hospitals in the other group are visited twice during a period of a few months (on-site facilitation). The process of implementation is continuously monitored and evaluated. After about 6-8 months, all participating hospitals are scored on a progress-monitoring checklist during a walk-through visit. Figure 1 gives a graphic overview of the process.
249
Figure 1. Facilitation and monitoring process
Each year 2004 - 2006May - June
Hospitals A – M Hospitals N – Z14 hospitals* 13 hospitals
2 on-site facilitation visits 1 off-site, ‘hands-on’ training workshop
*1 hospital re-designated before completion of project
JulyHospitals scored on the standardised progress-monitoring instrument
(‘walk-through’)
ResultsFigure 2 gives a detailed breakdown of the scores of the hospitals that implemented KMC in 2004 and 2005, as well as the 2005, second walk-through scores for the hospitals that implemented in 2004.
250
Figure 2. Results for 2004 and 2005, according to paired hospitals
ON-SITE FACILITATION OFF-SITE FACILITATION
Hospital
Score1st walk-through*
Score2nd walk-through* Hospital
Score1st walk-through*
Score2nd walk-through*
A 15.98 20.42 N 14.90 14.35B 21.58 21.23 O 18.65 11.92C 23.79 26.88 P 20.85 20.15
D 11.38To be scored in 2006
Q 23.29 22.71
E 11.92To be scored in 2006
R 13.81
To be scored in 2006
F 20.04To be scored in 2006
S 8.67
To be scored in 2006
G 11.92 To be scored in
T 10.29 To be
scored in
2006 2006
H 17.79To be scored in 2006
U 14.63
To be scored in 2006
I 0.00To be scored in 2006
V 16.52
To be scored in 2006
* Maximum score possible = 30
ON-SITE FACILITATION OFF-SITE FACILITATION
Median score 15.98 Median score 14.90Mean score 15.05 Mean score 15.73
OVERALL SCORES FOR ALL HOSPITALS TOGETHER, 2004-2005Median score 15.84 Mean score 15.45
At the end of 2005, 16 of the 18 hospitals already included in the programme had reached at least the level of “evidence of practice”, with seven of these getting to the level of routine. In one hospital, no implementation took place (score = 0/30) and another one only managed to reach the level of “taking ownership” (<10/30).
251
ConclusionIt seems as if there is no significant difference in effectiveness between on-site and off-site facilitation. More hospitals need to be covered before conclusive evidence will be available.
Implementation progress in all hospitals should be monitored periodically until KMC has been well institutionalised. Hospitals need continued support for about one to two years in order to be able to maintain a level of sustainable practice. After having reached the potential of sustainable practice, continued monitoring of KMC should be part of the comprehensive quality assurance programme aimed at monitoring quality of care.
252
DEVELOPING AN EVIDENCE-BASED EARLY COMMUNICATION INTERVENTION PROGRAMME FOR VERY LOW BIRTH WEIGHT NEONATES AND THEIR MOTHERS
Alta KritzingerClinic for High Risk Babies (CHRIB), Department of Communication Pathology, University of Pretoria
IntroductionAn increased risk for communication delay and developmental disabilities (which symptoms include communication disorders) is found in infants with very low birth weight, born to mothers with low literacy skills, raised in families living in poverty, and in the shadow of AIDS. These characteristics relate to the mothers and their very low birth weight neonates in the Kangaroo Mother Care (KMC) Unit of Kalafong Hospital. Since the link between disability and poverty is well established (Guralnick, 2004; Msall, Bobis & Field, 2006), the concern is the information needs of the infants’ parents (Guralnick, 2004), especially those with low literacy skills. This paper is presented from the perspective of Communication Pathology, more specifically the speciality field of early communication intervention (ECI) (Rossetti, 2001). Best practice in ECI directs the clinician to start as early as possible to increase benefits for infants and families. The perinatal period offers unique opportunities for intervention, as mothers are available, especially if mother-infant attachment is enhanced by the practice of KMC. The importance of promoting early communication skills in infants is well-known, since early language proficiency predicts later academic success in school-going children (Rossetti, 2001). Communication delay and the sequelae of developmental disabilities may therefore be minimized by addressing the long-term goal of school readiness already in the perinatal period.
Aim of the paper
253
The aim of the paper is to discuss the underpinnings and the content of an ECI programme for mothers with very low birth weight neonates in a KMC unit in a large peri-urban hospital.
The aim of the ECI programme is to establish a pattern of responsive communication interaction between the mothers and their infants in order to facilitate the infants’ communication development as early as possible so that delayed communication development may be minimized and that they gain some resilience against the adverse environments in which they grow up. The underpinnings of the ECI programme were gleaned from literature on the developmental characteristics of full-term newborns and research findings on high risk infants. Bruner (1977) described the natural maternal reciprocal communication interaction patterns with full-term newborns. Full-term newborns display amazing capabilities such as the ability to engage their mothers with sophisticated eye contact seeking behaviours (Owens, 2005). Another significant underpinning of the programme was the findings of Gottlieb (1971) about the sequence of fetal sensory development. According to Gottlieb (1971), tactile and hearing sensations develop before vision during fetal life, which implies that the ECI programme should be based upon the concept of sequential sensory development, since the recipients of the intervention, the very low birth weight infants, are born before fetal development can be completed. Eye contact seeking behaviours of the newborn depend on the visual sense and should therefore only be stimulated after the sense of hearing has been stimulated.
Findings by Lecanuet, Granier-Deferre and Busnel (1995) provided insight into normal fetal auditory processing development. Since newborn infants are born with a preference for their mothers’ voices (Owens, 2005), there is evidence of auditory learning before birth. These findings were integrated in the ECI programme, since hearing is the most important
254
sense for speech and language development, followed by vision which adds to the reciprocal nature of the mother-newborn communication interaction.
Underpinnings of the ECI programme gleaned from knowledge about high-risk infants included the following: Since mothers and their very low birth weight infants are usually separated after birth while the infant receives intensive medical and nursing care, the normal attachment process is jeopardized (Rossetti, 2001). Mothers and their high-risk infants do not have the opportunity to experience the last five steps of the 12 step attachment process which starts with the planning of the pregnancy (Klaus and Kennell, 2003). Another framework used in the ECI programme is the three states of neonates at risk, first described by Gorski, Davidson and Brazelton (1979). The three states, the in-turned state, coming out and reciprocity state, are developmental stages that infants pass through when moving from illness to health (Rossetti, 2001). The framework has been used to categorize the infants’ developmental stages and design corresponding levels of the programme.
Further underpinnings of the ECI programme were derived from a single case study about the emergence of early communication skills in a very low birth weight infant (McInroy & Kritzinger, 2005). The successive development of the infant’s sensory systems corresponded with the development of precursors of language. While the infant was in the in-turned state (31-32 weeks), he started to display reflexive responses to sound and voices, which represent the language content component of the three precursors of language development (Lahey, 1989). When the infant entered the coming-out state (33-34 weeks), the first cry patterns were observed, which correspond with the precursors of language form. Upon entering the reciprocal state (37-38 weeks) the first moments of eye contact were observed, indicating that the precursors of language use were emerging. The successive emergence of precursors to the three components of language in the infant, indicated that hearing developed
255
first, followed by vocal development, with reciprocal interaction, which depends on vision, as the last component of language to emerge. The successive development of prescursors to language development therefore corresponded with successive sensory development, first described by Gottlieb (1971).
Interesting detail about the mother-infant communication interaction in the same study (McInroy & Kritzinger, 2005) revealed that the mother displayed passive or no interaction attempts with the infant in the neonatal intensive care unit, even when the infant progressed through the three states, and had to be prompted to interact with the infant. The lack of mother-infant communication interaction in the study has also been described by Rossetti (2001) and considered as a strong rationale why parents require guidance in interacting appropriately when separated from their sick infants after preterm birth.
The ECI programme was therefore designed around the key concepts of graded sensory input and infant states. When the infant is in the in-turned and coming out states, only tactile and auditory input should be provided, in order to avoid over stimulation of the developing sensory systems. When the reciprocal state emerges, the visual component of communication stimulation may be added to the graded sensory stimulation provided by the mother. The mother may now provide both auditory and visual input simultaneously, but in a responsive interactive manner while doing KMC.
The characteristic infant communicative behaviours that may be expected in the in-turned and coming-out states, are as follows: The infant sleeps and keeps the eyes closed most of the time. The eyes may open briefly and the infant may perform some movements, but lies quiet most of the time. The infant is easily disorganized when not in the KMC position and may display signs of stress, such as finger splaying, startles and uncoordinated movements.
256
The ECI programme content during the in-turned and coming-out states implies that the infant’s mother will keep the infant in the KMC position. She should follow the infant's lead and subtle communication signals, and allow him/her to sleep and only respond to the infant when awake. In this manner, the foundations of responsive interaction are already established (Bruner, 1977). The infant should be protected from intrusive noise and bright light while the mother provides appropriate auditory challenges to the infant brain (Nelson, 2000). Auditory challenges are provided when the mother talks and sings softly to the baby. She responds to the infant's stress signs by providing continuous KMC. During this period, the infant learns to respond to the mother's voice and may start producing soft vocalizations.
The characteristic infant communicative behaviours during the reciprocal state are the ability to make eye contact, to look around, to fixate their gaze on objects and to vocalize more often. The infant will also now display self-comforting behaviours, suck to feed successfully, and respond to the mother. When the infant is in the reciprocal state the mother should continue with KMC, but add the visual dimension to the interaction with the infant. She must position herself for eye contact with her infant and attempt to interact when the baby is awake. She must be guided to maintain eye contact with the infant, and to talk and sing to baby using “motherese” (Gleitman, Newport & Gleitman, 1984 in Rossetti, 2001). The mother should listen to her infant and repeat and expand on her own vocalizations. The frequency of interaction may gradually be increased, she should continue to respond to the infant’s stress signs and monitor environmental stimuli to reduce stress.
In order to successfully train the mothers, clinicians may use certain intervention strategies. Despite the low literacy skills of the mother, a handout in the mother’s language of preference should be provided. A culturally sensitive approach should always be followed. When talking to
257
the mother start with her focus of attention. Demonstrate the desired behaviours and do not only describe them. Manage language barriers, adapt your vocabulary, but never talk in a patronizing way to the mother. Build a trusting relationship with the mother and reinforce desired behaviours. Be flexible, keep the conversation interactive, use minimal prompts to encourage the mother and ask open questions in order to reduce communication pressure.
ConclusionThe ECI programme was already piloted and the effect of programme on mothers must now be determined in order to provide possible evidence for the programme. A three-group experimental design study is planned and will be executed soon. The outcomes of the study may provide guidelines for the role and responsibilities of speech-language therapists in a KMC unit.
258
AN ONGOING AUDIT OF THE KANGAROO MOTHER CARE UNIT AT KALAFONG HOSPITAL
Elise van Rooyen Department of Paediatrics, Kalafong Hospital, MRC Research Unit for Maternal and Infant Health Care Strategies, University of Pretoria
BackgroundA 20-bed kangaroo mother care (KMC) unit was established at Kalafong Hospital, Pretoria, Gauteng Province, South Africa, where continuous and intermittent KMC is practiced. The unit was opened on 6 July 1999. All infants discharged from the unit were followed up at a clinic, which is held in the unit weekly. A special audit capturing form was developed in order to keep accurate records of the patients admitted to the unit.
ObjectiveThe objective of the poster was to present the data of the audit results collected over a 6-year period in the KMC unit at Kalafong hospital from 1 August 1999 to 31 July 2005.
MethodAll patients admitted to the KMC unit from 1 August 1999 to 31 July 2004 were included. A data sheet was completed for each admission. The same form was used to record follow-up clinic attendances. Data captured on the sheet included the following: birth, admission and discharge dates, birth, admission and discharge weights, gestational age of the infants, transfer dates out of the unit due to apnoea or infection, feeding practices, number of infants on oxygen and time period, number of deaths, follow-up clinic attendances. The data was captured on the computer in Excel and analysed each year.
ResultsDuring the study period, 2294 infants were admitted to the KMC unit. Details of the total admissions, admissions per month, average length of stay in days and the bed occupancy in the unit are summarised in Table 1.
259
When looking at the length of stay the longest period that a patient stayed in the unit was 165 days. The reason for the long stay was because the infant was oxygen dependent and could not be discharged on oxygen.
Bed occupancy rate in % 58 68 73 75 85 71 72%72%*A ten-bedded cubicle closed for 3 months due to repairs to the roof
Gestational age data of the infants admitted to the unit has only been collected for the past 2 years. Many of the mothers do not know the date of their last menstrual period and are therefore unsure of their dates and the gestational age of their infants. The infants’ gestational ages are then calculated by using the Ballard Scoring system. The admitting doctor calculates these scores soon after birth. Twenty six percent of infants admitted to the KMC unit had a gestational age of less than 30 weeks at birth. The average gestational age of infants on admission to the KMC unit was 34-35 weeks. Twenty two percent of infants had gestational ages of 32 weeks or less on admission to the KMC unit and 22% infants were discharged with a gestational age of 34 weeks or less.
The infants admitted to the unit were allocated to different weight categories according to their birth and admission weights. The results are summarised in Table 2 and 3. Fifty three percent (1210) of infants had a birth weight of 1500 grams or less. Ten percent (232) of infants had a birth weight of 1000 grams or less. Forty seven percent (1087) of infants were admitted to the unit with a weight of 1500 grams or less.
Before implementation of KMC at Kalafong Hospital, infants were discharged at a weight of 1750 grams or more. After implementation of KMC, 51% (1168) infants were discharged from the unit weighing less than 1751 grams (Figure 1). In Table 4 the percentages of infants discharged at different weight categories are presented. More infants could be accommodated in the unit because it was possible to discharge infants at lower weights and thus sooner. Forty two percent of infants were discharged weighing less than 1701 grams.
Of the 2294 infants admitted to the KMC unit, 17 (0,7%) infants died in the unit or within 24 hours of being transferred back to the intensive care unit (ICU) (Table 5). One hundred and sixteen (6%) infants were sent back to the high care unit (HCU) due to apnoea or possible infection. Sixty infants had to be readmitted from home because they did not have satisfactory weight gain or because they had lost weight.
Table 5Deaths, Transfers and ReadmissionsYear 1 2 3 4 5 6 TotalNumber of patients admitted 319 351 369 428 408 409 2294Infants that died in the unit 0 3 5 4 4 1 *17 (0,7%)Infants T/F back to HCU with apnoea / possible infection 25 24 17 22 29 34 151 (6,6%)
Infants readmitted from home 5 18 12 19 6 14 # 73 (3%)*6 expected deaths - (trisomy 18, spina bifida, microcephaly, AIDS, prune belly, PDA)*2 deaths during RSV outbreak*8 unexpected deaths*1 death associated with maternal depression#47% infants readmitted from home during winter months
The analysis of deaths that occurred revealed that there had been six expected deaths and 10 unexpected deaths (Table 5). One of the unexpected deaths occurred in a mother and infant pair where the mother was severely depressed. Due to her depression and poor response to communication, it was only in retrospect that it was realised that the mother also had psychiatric problems. From this incident, we realised that it is very risky to expect a mother to be the primary care taker of her
262
premature infant if she has a severe depression or suffers from a psychological problem. Mothers who show signs of mental health problems are therefore excluded from the KMC unit and their infants receive conventional neonatal care. Characteristics of infants that died are summarised in Table 5. In order to establish whether there had been a seasonal variation in infant deaths, the data was analysed according to the months of the year in which the deaths had occurred.
Table 6Characteristics of Infants that DiedBirth weight < 1250 grams 58.8%Weight at death < 1500 grams 52.9%< 7 days in KMC 35.3%Receiving oxygen 47.1%HIV exposed 23.5%Died in April – September (Winter) 76.5%Died in April – May (staff change) 41.2%
Seventy seven percent of infant deaths occurred during the winter months, April to September and 41% deaths occurred during the months April and May. Each year 60% of the nursing staff in the wards change and this staff change occur at the beginning of April each year. The high percentage of infant deaths during this period may be due to the lack of proper orientation and training in neonatal resuscitation methods. Infants were discharged much sooner and at a lower weight than in the past and it was therefore important to see how many infants did not have satisfactory weight gain of at least 10 grams per day. Infants who lost weight or did not gain weight were readmitted to the unit. Only 73 infants (3%) had to be readmitted during the 6-year period (Table 5). In order to see whether the readmissions had a seasonal pattern, the data was analysed and it was found that 47% infants were readmitted during the winter months, April to September. Therefore, readmissions did not increase during the colder months compared to the warmer months. The main factors that played a role in infants’ readmissions were mothers
263
failing to practice KMC continuously or not feeding the infant at regular intervals.Characteristics of infants transferred back to the HCU are summarised in Table 7. From the data it is clear that the smaller infants were more prone to complications, which necessitated them to be transferred back to the HCU (72% of infants transferred weighed less than 1501 grams). Nearly half of all the transfers (46%) occurred during the first week after admission to the KMC unit. The most common reason for transferring infants back to the HCU was apnoea-like incidents or aspiration of feeds during or shortly after feeds. Nearly all the infants that were transferred to the KMC unit were on tube feeds and the transition of tube to cup and breastfeeding occurred in the unit. During the transition period, the mothers needed a lot of support from the nursing staff in order to acquire the skill to feed their premature infants and to learn the correct feeding techniques, which would prevent complications. This support may have been lacking. One third of infants that had to be transferred back to the HCU were oxygen dependent. The data was analysed to see whether there was a seasonal pattern when transfers occurred, but no pattern was found. During the winter months, April to September, 45% of transfers occurred and during the staff change period, 12% of transfers occurred.
Table 7Characteristics of Infants Transferred back to HCUInfants transferred back to the HCU 151 (6.6%)Birth weight < 1250 gram 54%Admission weight < 1250 gram 39%Admission weight < 1500 gram 72%Average discharge weight 1977 gramAverage days in KMC 30 daysAverage days in KMC (all patients included) 14 daysLength of stay before transfer:< 7 days 46%< 21 days 83%On oxygen 33%HIV exposed 20%Season of Year:T/F 1 April – 30 September (winter) 45%T/F 1 April – 30 September (Staff change) 12 %
264
One of the components of KMC is exclusive breastfeeding. The infants at Kalafong hospital are fed breast milk. Initially they receive expressed breast milk via oro- or nasogastric tube, then via syringe or cup until feeding at the breast is established. Infants that were HIV exposed received pasteurised breast milk via tube or cup.
Figure 2 KMC Unit Infant Feeding Methods
Breastfeeding has important anti-infective properties, which play an important role in the prevention of infections and necrotising enterocolitis. This may be one of the reasons why so few infants (6%) developed hospital acquired infections. The feeding methods of infants in the KMC unit are summarised in Figure 2. Only 10% of infants received formula feeds. The average weight gain of the infants in the KMC unit was 24 grams per day. It was important to follow-up the infants that had been discharged from the unit to see whether the infants who were discharged at a lower weight were thriving at home. A follow-up clinic was established and Figure 3 summarises the attendance rate. Only one infant was abandoned during the period of the audit.
265
Figure 4 KMC Follow-up Clinic Attendance Rate
ConclusionThe KMC unit has resulted in an increased capacity of Kalafong Hospital to deal with its increasing number of high-risk low birth weight infants by creating a cost-effective and safe step-down facility for the infants from the neonatal intensive and high care units. With information gathered from the continuous audit, changes in clinical practice were made to improve the care in the KMC unit.
266
FARA NGWANA OUTREACH: IMPLEMENTATION OF KANGAROO MOTHER CARE IN GAUTENG
Dulcie Tsotsetsi1, SS Masilela1,Ria van der Walt1, Anne-Marie Bergh2, Elise van Rooyen2, RC Pattinson21 Directorate: Public Health, Gauteng Department of Health; 2MRC Research Unit for Maternal and Infant Health Care Strategies and University of Pretoria
IntroductionThe Fara Ngwana Outreach is part of the broader programme of the Sub-directorate: Maternal, Child and Women’s Health of the Gauteng Department of Health that aims to contribute to the improvement of the long-term health outcomes for and the perinatal care of mothers and infants. It started with support for the implementation of kangaroo mother care (KMC) and was subsequently expanded to a more integrated approach that also includes activities related to the Better Births and Baby-friendly Hospital Initiatives and the introduction of childbirth companions. In 2005, a new support structure was built into the programme by involving the district coordinators in supervising implementation of these initiatives.
AimBefore the start of Fara Ngwana one-off, one-day training workshops were held with 15 hospitals with a view to implementation of KMC. These were, unfortunately, not very successful and only six hospitals (40%) continued with implementation. Although introductory training workshops and seminars are a necessary component of awareness-making processes for changing practice, we came to realise that more continuous support and guidance was needed for practices to become sustainable. The aim of this poster was to report on the KMC implementation progress of 12 hospitals in Gauteng Province, where additional support was provided.
MethodIn 2003, 7 hospitals were targeted for KMC implementation support and in 2005, another 5 hospitals. Designated participants from all hospitals
267
attended an introductory launch workshop and received a multimedia implementation package. Hospitals were paired and then randomly allocated to two different support outreach strategies. Hospitals in one group received additional face-to-face training at a site of excellence (off-site, ‘hands-on’ facilitation). Hospitals in the other group were visited twice during a period of a few months (on-site, face-to-face facilitation). After about 6-8 months all participating hospitals were scored with a standardised instrument during a walk-through visit. The maximum score is 30.
ResultsTable 1 gives a breakdown of the scores of individual paired hospitals. Table 2 gives a summary of the progress of hospitals after 6-8 months.
Table 1 Scores of paired hospitals, out of 30On-site facilitation Off-site facilitationHospital A 17.06 16.79 Hospital EHospital B 17.33 19.23 Hospital FHospital C 14.90 12.19 Hospital GHospital D 20.58 14.63 Hospital JHospital H 17.06 15.17 Hospital KHospital I 14.08 15.71 Hospital LMean: 16.84 Mean: 15.62Median: 17.06 Median: 15.44
Table 2 Implementation progress of hospitals after 6-8 months
No implementation 0 hospitalsTaking ownership 0 hospitalsEvidence of KMC practice 10 hospitalsOn the road to routine and institutionalised practice 2 hospitals Evidence of routine and institutionalised practice 0 hospitalsEvidence of sustainable practice 0 hospitals
ConclusionAll 12 hospitals reached at least the level of “evidence of practice” (>10/30) on their progress scores. It appears as if a more systematic facilitation approach to implementation yields better and/or faster results than approaches based on (voluntary or compulsory) one-off training.
268
However, there does not seem to be a trend with regard to one outreach strategy faring better than the other. Contextual factors may have also played a role in each hospital’s achievement of progress.
269
"ON-SITE" VERSUS "OFF-SITE" FACILITATION: A RANDOMISED TRIAL OF OUTREACH STRATEGIES
Anne-Marie Bergh, RC Pattinson, Elise van RooyenMRC Research Unit for Maternal and Infant Health Care Strategies and University of Pretoria
IntroductionThe MRC Research Unit for Maternal and Infant Health Care Strategies is involved in a long-term research programme testing the effectiveness of different outreach strategies for the introduction of new health care interventions and for the improvement of current practices in perinatal care. In a study done on the introduction of kangaroo mother care (KMC) in KwaZulu-Natal Province in 2002, it was found that on-site, face-to-face facilitation, combined with a well designed multimedia implementation package was more effective than using the package on its own.
Aim The main aim of the subsequent phase of the study was to test the effectiveness of one other outreach strategy, namely off-site, face-to-face facilitation at a centre of excellence. This would be measured against the effectiveness of on-site, face-to-face facilitation.
MethodBetween 2003 and 2005, a randomised trial was conducted in public hospitals in the Mpumalanga and Gauteng Provinces. Thirty hospitals targeted for support with KMC implementation were paired with respect to their geographical location (urban:rural), level and annual number of births. One hospital in each pair was randomly allocated to receive either on-site, face-to face facilitation or off-site facilitation at a centre of excellence.
Hospitals were invited to participate in an outreach. The Chief Executive Officer of each hospital had to sign a commitment of participation. All hospitals also sent delegates to an introductory workshop, where each hospital received an implementation package and was informed about the outreach strategy to which it had been allocated.
270
On-site facilitation entailed two on-site visits of 2 to 3 hours to each hospital at 4-week intervals, starting 6 to 8 weeks after the introductory workshop. Off-site facilitation entailed a one- or two-day, ‘hands-on’ training workshop at hospitals identified as centres of excellence. This took place 6 to 8 weeks after the introductory workshop. The centres used in this study were Kalafong, Witbank and Themba Hospitals.Implementation progress was scored by means of a standardised instrument during a walk-though visit 6 to 8 months after the introductory workshop. The progress-monitoring model on which the instrument is based, is divided into three phases: pre-implementation, implementation and institutionalisation. Each of these phases have two steps, starting with awareness making and a conscious decision to implement, through to taking ownership and observing evidence of practice, up to evidence of routine and institutionalised practice, with the ultimate goal being sustainable practice. The maximum score is 30 and hospitals scoring more than 10 out of 30 have reached the level of “evidence of practice”. (See Figure 1.)
Implementation phaseStage 3 Taking ownership 6 points 10Stage 4 Evidence of practice 7 points 17
Institutionalisation phaseStage 5 Evidence of routine and integration 7 points 24Stage 6 Sustainable practice 6 points 30
TOTAL 30 POINTS 30 POINTS
ResultsUsing the Wilcoxon signed rank test, no significant difference was found in the effectiveness of the two outreach strategies (p=0.307). The median score for the on-site facilitation group was 17.06 (range 00.00-23.79) and
271
for the off-site facilitation group 15.17 (range 08.67-23.29). The mean scores were 15.62 and 15.79 respectively.
Twenty-eight of the 30 hospitals in the trial reached at least the level of “evidence of practice” after 6 to 8 months. One hospital in the on-site group had made no attempts at implementation and scored 0, whereas another hospital in the off-site group could only manage a score of 8.7 out of 30. Figure 2 gives a graphic depiction of the distribution of the scores of individual hospitals in the two groups.
Figure 2 Distribution of scores of individual hospitals
ConclusionThe implementation of a new health care intervention on a provincial scale is best achieved by a carefully designed educational package, combined with face-to-face facilitation by respected resource persons, on site or at a centre of excellence. The choice of outreach strategy is dependent on local circumstances and cost.As effective implementation strategies are costly, trade-offs may need to be made between educational effectiveness and cost-benefits. This could be done by categorising hospitals in terms of ability to function without additional support and then decide on differential strategies, according to
272
each health care facility’s capacity to implement a new health care intervention.
The results of testing the effectiveness of different outreach strategies could also inform policy decisions with regard to different kinds of roll-out programmes implemented by provincial and national health authorities.
273
TREATMENTS FOR BREAST ENGORGEMENTS DURING LACTATION: A SYSTEMATIC REVIEW
L Mangesi, G MuzonziniEffective Care Research Unit, East London Hospital Complex, University of Fort Hare, University of Witwatersrand
IntroductionBreast milk is the best food for babies as breastfed babies are healthier than formula-fed babies. Exclusive breastfeeding means that the mother must not feed the baby anything except for breast milk. Serious problems of high rate of HIV transmission occur if the mother is mixing the feeds. Exclusive breastfeeding has been identified as one way of decreasing infant under-five mortality and morbidity rate.
Breast engorgement is the overfilling of the breast milk that causes discomfort and pain to the mother if the baby's demand of breast milk is less than the amount of milk that the mother produces. This is a common problem to breastfeeding mothers. Primary engorgement occurs in the first few days after the baby is born and it occurs when the mother's body is still trying to adjust to the amount of milk that the baby demands. Secondary engorgement occurs later and it occurs when the mother is not feeding as frequently as she used to or the baby's demand has decreased.
It is important that the problem of breast engorgement be prevented but if it occurs it needs to be managed as soon as possible. This may cause a lot of pain to the mother and she may end up being discouraged even if she intended to breastfeed exclusively. This may result in her changing her feeding options and mixing the feeds. This is dangerous for the baby as it may increase the rate of mother to child transmission of HIV. Many methods of treating breastfeeding engorgement have been introduced. It is not known which ones are highly effective compared to the others. It is important that this topic be reviewed as the review may have positive public health implications.
ObjectivesTo identify the best forms of treatment for women who suffer breast engorgement.
MethodWe will collect relevant randomised controlled trials and include them without considering their results. Trial authors will be contacted where neccessary for clarity and additional information. Information from trials will be entered in data tables and will be checked for accuracy. There will be double entry of data by individual authors on Review Manager 4.2 computer software for analysis. For dichotomous data we will use relative risks and 95% confidence intervals and the results will be pooled using the fixed effects model. Where there is marked heterogeneity indicated by I² greater than 50%, random effects model will be used. For continuous data we will use weighted mean difference and 95% confidence interval.
ResultsWill be presented at the conference.
Conclusion
274
Will be presented at the conference.
275
EFFECTIVENESS OF THE IMPLEMENTATION OF THE BASIC ANTENATAL CARE (BANC) PACKAGE IN THE NELSON MANDELA BAY METRO (PORT ELIZABETH)
J S Snyman, L Jantjes, J D Makin, RC Pattinson.MRC Maternal and Infant Health Care Strategies Research Unit& Nelson Mandela Metropolitan University
According to the Perinatal Care Surveys of South Africa unexplained stillbirths are the most common recorded category of perinatal death. The most likely causes of these deaths are intrauterine growth restriction (IUGR), post-maturity, congenital abnormalities and uro-genital infections in the mother. All of these conditions can be detected during good antenatal care. According to Moran and Mangate, as long as the woman attends antenatal care, deaths resulting form IUGR, post-maturity and syphilis are usually avoided (Moran & Mangate, 2004:23-37). Surveys have indicated that 95% of women countrywide attend antenatal care when pregnant (Ijumba, Ntuli & Barron, Ed’s., 2003:94). Therefore the high proportion of unexplained stillbirths is probably a good indication that the quality of antenatal care is poor (Pattinson, 2003:4-22).
The assumption is made that the implementation of the BANC package will improve the quality of antenatal care in primary health care clinics.
Objectives of the Basic Antenatal Care Package:1. Short term:
o To implement a clinic-retained checklist which would assist in identifying risk factors and guide the change to the new WHO schedule of visits.
o To develop clinic-specific protocols for patient management and referral criteria compatible with current national norms and standards.
o To define (or re-define) referral routes.o To initiate antenatal care at pregnancy confirmation.
276
2. Medium term: Quality antenatal care improvement measured by scoring antenatal cards.
3. Long term: Reduction of stillbirths (Not included in this study).
The Basic Antenatal Care Package (BANC):
The World Health Organisation (WHO) produced a quality improvement package known as Integrated Management of Pregnancy and Childbirth, endorsed by FIGO. Pattinson adapted (with permission) these flow charts for South Africa’s conditions and a multimedia Implementation Package for Basic Antenatal Care (BANC) was developed, including a purpose-written Basic Antenatal Care Reader and “Training of Trainers” modules to guide users through the implementation process.
Methodology:• Ten primary health care clinics were paired for similarities and
randomly allocated to intervention (BANC programme) or antenatal card audit.
• Implementation was done in three steps:– Pre-implementation audit or scoring antenatal cards. – Implementation of the BANC package through the Training of
trainers approach.– Post–implementation audit two months after implementation.
277
Quality measured using the Philpott/Voce scoring system:
The quality of ANC care is measured through reviewing the patient held antenatal card using the Phillpott/Voce scoring system (Philpott & Voce, 2001: 68-76)
The checklist has 25 criteria divided into three main categories namely History, Examination and Interpretation and Decisions. The gestational age at booking was added.
Results: Short term achievements A clinic retained checklist to assist identification of risk factors was
introduced. The new WHO schedule of visits was implemented. Referral routes were defined. Clinic-specific protocols for patient management and referral criteria,
compatible with current national norms and standards were developed.
Ongoing audit was introduced. Antenatal records were standardized.
278
Results: To initiate antenatal care at pregnancy confirmation:
Gestational age at first visit
26.626.4
23.2
25.8
21
22
23
24
25
26
27
intervention Control
Wee
ks
The gestational age at first visit in the intervention group declined from a mean of 26.6 weeks to 23.2, but this was not significant. In the audit group, the gestational age at first visit remained constant at 26.4 weeks before and 25.8 weeks after. A longer period of implementation may be necessary to demonstrate significant change.Medium term: Quality improvement of care measured by the scoring of antenatal cards
Results: Total ScoreTotal score comparison
15.4
15.1
17.1
16.5
14
14.5
15
15.5
16
16.5
17
17.5
Intervention Control
Audit One (July'05) Audit Two (Nov'05)
Pp=0.002
Pp=0.014Pp=p
2
279
244 cases were scored (intervention group 95 before and 59 after and audit group 40 before and 90 after). The total score includes all 25 criteria.A significant increase was noted in the intervention group from 15.4 to 17.1 (p=0.002).The audit group also increased significantly form 15.1 to 16.5.(p=0.014)
Results: SF PlotSFPlot comparison for intervention and control groups
1.07
1.35
1.71.6
0
0.2
0.4
0.6
0.8
1
1.2
1.4
1.6
1.8
Intervention Control
p=0.0031p=0.25
This variable was created by combining four important criteria namely LMP/EDD; SF plot at first visit; SF plotting at follow-up visits and Interpretation of the graph.The intervention group improved significantly from 1.07 before to 1.7 after (p=0.0031). The audit group increased from 1.35 to 1.6 (p=0.25) but it was not significant.
280
Results: Three Main Categories
Three main categories comparing intervention and control group for before and after intervention
40
50
60
70
80
90
Intervention Control intervention control intervention control
Perc
enta
ge
History Examination Interpretation & Decision
A significant improvement in scores was noted in all three categories in the intervention group, but not in the audit group.
Conclusion:The BANC programme significantly improved the quality of care of antenatal patients as measured by the antenatal card scores, and empowered clinics to comply with national maternal care requirements. Audit alone had a small effect to improve quality of care. The unexpectedly low increase in antenatal score could be due to the inherent weaknesses of trainer of trainer methodology, mainly the dilution effect at each level and conditions at clinic level.
281
CERVICAL DILATATION, DESCENT, MOULDING AND POSITION – HOW GOOD ARE OBSTETRICIANS WITH CLINICAL SIGNS OF LABOUR PROGRESS?
E J Buchmann Chris Hani Baragwanath Hospital and University of the Witwatersrand
IntroductionIt seems essential that clinical information entered onto the partogram - cervical dilatation, descent, moulding and position – should reflect what is correct and true. No studies have been done to determine if doctors agree on these clinical findings done simultaneously in individual patients. The objective of this study was to measure inter-observer agreement in these clinical assessments in labour.
MethodsThis was a cross-sectional comparative study done in the Chris Hani Baragwanath Hospital Labour Ward. Patients studied were women in the active phase of labour, at term, with a live baby in a cephalic presentation. Patients with previous caesarean section were excluded. The researcher (EJB) performed abdominal and vaginal examinations within 5 minutes of the same examinations done by the clinician on duty (consultant obstetrician or registrar) in the labour ward. Cervical dilatation, descent, moulding and position were measured. At each examination, the researcher and the clinician on duty were not aware of each other’s findings. The researcher was also unaware of the patient’s parity, obstetric history and previous intrapartum clinical findings. Ultrasound examination of the fetal head was done by the researcher on a consecutive sample of patients to verify the findings on position. Kappa analysis for inter-observer agreement was done for cervical dilatation, descent and moulding using Epi-Info 6 statistical software.
ResultsFive hundred and eight patients were examined. The clinicians on duty were registrars (55%) and obstetric consultants (44%). Cervical dilatation
282
was measured by both the researcher and the clinician on duty in 498 patients, and in 250 (50%) there was agreement. There was disagreement by 1 cm in 192 (39%) of patients, by 2 cm in 50 (10%), and by 3 cm in 6 (1%) of patients. The Kappa score for rater agreement was 0.52. Descent in fifths was measured by both the researcher and the clinician on duty in 506 patients. The findings are shown in Table 1. The findings on descent according to station are shown in Table 2. Agreement on sagittal suture and lambdoid suture moulding scores are shown in Tables 3 and 4 respectively.
Table 1 Agreement between the researcher and the clinician on duty as regards level of the fetal head in fifths (N=506). Descent ≤2/5 is suggestive of engagement. The shaded blocks show agreement. Kappa=0.43
Researcher:Clinician on duty:
Head≤2/5 Head ≥3/5
Head ≤2/5 71 50Head ≥3/5 58 327
Table 2 Agreement between the researcher and the clinician on duty as regards station of the fetal head (N=446). Station ≥+1 is suggestive of engagement. The shaded blocks show agreement. Kappa = 0.39
EJB:Clinician on duty:
Station ≥+1 Station ≤0
Station ≥+1 47 35Station ≤0 55 309Kappa = 0.39
Table 3 Agreement between the researcher and the clinician on duty as regards sagittal suture moulding score (N=482). Shaded blocks show agreement. Kappa = 0.15.
Table 4 Agreement between the researcher and the clinician on duty as regards lambdoid suture moulding score (N=326). The shaded blocks show agreement. Kappa = 0.08.
Position of the fetal head was ascertained by both the researcher and the clinician on duty in 452 patients. There was agreement on position in 163 cases (36%), and a difference of 45 degrees in 93 (21%). The difference was 90 degrees in 54 (12%), 135 degrees in 69 (15%) and 180 degrees in 75 cases (17%). Ultrasound verification in 30 consecutive cases showed that the clinician on duty differed from the ultrasound by 90 degrees or more in 18 cases (60%) and the researcher differed from the ultrasound by 90 degrees or more in 3 cases (10%). Thirteen of the 18 errors by the clinician on duty were the result of transposition of the anterior and posterior fontanelles.
ConclusionThere was moderate agreement between the researcher and clinician on duty in measurement of cervical dilatation. Agreement on engagement, by fifths and by station, was fair to moderate. The researcher and clinician frequently disagreed on moulding scores, especially in assessment of lambdoid moulding. It is possible that the problems with lambdoid moulding assessment were the result of transposition of the fontanelles as shown by the ultrasound verification. There was also poor agreement on position of the fetal head, with ultrasound verification suggesting problems with the clinician on duty’s assessment. All of these clinical measurements are considered important in assessment of labour progress, but only cervical dilatation showed acceptable inter-observer agreement. Descent, moulding and position in this study were poorly reproducible, suggesting that these clinical assessments are either too difficult for clinicians in a teaching hospital or that the clinicians place no value on their accurate assessment. This presents a challenge to teachers of obstetric clinical skills.
284
IMPROVING THE QUALITY OF OBSERVATIONS, RECORDINGS AND DECISIONS DURING LABOUR
Anna Voce*, Hugh Philpott*, Nokuzola Mzolo*, Dolly Nyasulu**, Cathy Connolly**** School of Family and Public Health Medicine, University of KwaZulu-Natal** Maternal, Child and Woman’s Health Directorate, Department of Health, KwaZulu-Natal*** Medical Research Council
Introduction:Both the Saving Mothers 1999-2001 report (DOH 2002) and the Saving Babies 2001 report (MRC Unit for Maternal and Infant Strategies, et al 2001) recommended that a quality assurance programme should be implemented to ensure that the partogram is used during the management of labour. In response to the above recommendations, a checklist has been developed to assist maternity services supervisors to conduct a monthly audit of the labour records of women that deliver in their unit.
Objectives: (1) Conduct a baseline assessment of: (a) the quality of recordings during the management of labour, and (b) the quality of intrapartum care as measured by perinatal indicators; (2) Identify deficiencies in the recordings during the management of labour; (3) Compare the following: (a) providing feedback on the findings of the baseline assessment only; (b) a supervisory intervention; (c) a training intervention; (d) no intervention; (4) Conduct an end-of intervention assessment of: (a) the quality of recordings during the management of labour; and (b) the quality of intrapartum care as measured by perinatal indicators; (5) Identify lessons learned and develop recommendations for improving the quality of recordings during the management of women in labour.
MethodAnd action-research design was implemented in four randomly selected rural Level 1 Hospitals in KwaZulu-Natal. Both quantitative and qualitative data collection and analysis techniques were utilised. Quantitative measurements and analyses were applied to assess the quality of a representative number of randomly selected labour records from deliveries that had occurred in the 6-month period prior to the commencement of the study, and in the immediate month and the 6th month post intervention. Data for the perinatal care indicators was collected from service registers. Qualitative data was collected, analysed and acted on during the intervention phase in the hospital in which the supervisory intervention and the training intervention were implemented. Background information was also collected on health system factors, and this was collected from routinely available data and through interview of maternity supervisors.
ResultsThe baseline assessment revealed a generally poor quality of care as measured by perinatal care indicators (PNMR range 42-52/1000, PCI range 3-7), and a generally poor quality of labour recordings (with 22-33% of women admitted not monitored at all, and of those that were monitored, the score for fetal monitoring ranging between 27%-61%, the score for monitoring progress of labour ranging between 44-72% and the score for monitoring maternal condition ranging between 7-62%).
285
A description of the main features of each intervention will be provided.
The results of the first post-intervention assessment will be available at the end of February 2006. The results of the second post-intervention assessment will be available in May 2006.
286
CHANGES IN NEONATAL MORTALITY AFTER THE INTRODUCTION OF A NEONATAL OUTREACH PROGRAMME IN LIMPOPO PROVINCE
DH Greenfield, PL Mashao, NC Mzolo, AFMalan, BA RobertsonCentre for Rural Health, University of KwaZulu-Natal and Department of Paediatrics and Child Health, Polokwane
IntroductionThe outreach programme, the Limpopo Initiative for Newborn Care (LINC), was set up with the broad aim of improving the care of newborn infants in the Province. It was started in 2003 and is, in 2006, still ongoing.The main activities were:
Staff training (enrolled nurses and nursing assistants, midwives and doctors);
Visiting the newborn care facilities in all the hospitals in the Province;
Developing tools eg guidelines, a standard admission record;Support for Kangaroo Mother Care (KMC);Advising hospital and unit managers;Collecting accurate statistics.
MethodsThe effectiveness of care, as judged by neonatal mortality, was assessed by using the births and deaths data collected in the Province. The perinatal statistics were collected from the hospitals in the Province from 1 January 2003 to 31 December 2005. The perianatal and neonatal mortality rates were calculated. The specific rates which were assessed were:
Early neonatal mortality rate (ENNMR) for all infants with a birth weight of more than 999g. A limitation of this figure is that term infants may die as the result of intrapartum hypoxia, which does not reflect the quality of newborn care. Early neonatal mortality rate for infants with a birth weight of 1000 –
1999g.
287
ResultsTable 1 shows the changes in the neonatal mortality rates.
In the Province, there has been a decrease in the ENNMR for both the birth weight more than 999g, and for those with a birth weight of 1000–1999g. In the latter category, the decrease has been greater, 17.3% compared with 14.0%. The trend for the decrease to be greater in the 1000–1999g birth weight category is present in all the Districts except for Capricorn, where there has been an increase. This is the district in which the tertiary hospital is situated. One of the factors causing this may be that the deaths of the referred infants are being recorded in Capricorn rather than in the district of birth. The tertiary hospital data is skewed in that it handles a greater percentage of problems cases. The distances for referring the patients (newborn infants) are great and there are often serious ambulance delays, resulting in the transferred infants often arriving in less than optimal condition.
None of the reductions, however, are statistically significant. The closest to significance is in Vhembe District where the p value is 0.08, using the chi-square test in 3 x 2 tables. The increase in mortality is statistically significant in Capricorn District with a p-value of 0.001
The 3 districts where there has been the greatest decrease in the mortality rate in the 1000–1999g infants are the same 3 districts where there are hospitals which have applied for accreditation for quality newborn care. There is considerable variability in the neonatal mortality rates between the hospitals in single districts. For neonatal mortality rate in the 1000–1999g infants, there is a range from an 80% decrease to an 80% increase in different hospitals.
ConclusionsThere has been an overall decrease in the neonatal mortality, in the Province, in infants with a birth weight of more than 999g and also in
288
those with a birth weight of 1000–1999g. This is a marker of improved newborn care.
The reasons for this are considered to be:1. The enthusiasm of the staff, especially the nursing staff. They
have taken their training seriously and have implemented the changes which have been recommended. Supportive doctors have also helped to raise the standard of care.
2. The use of Enrolled Nurses and Enrolled Nursing Assistants has made a big difference to the quality of observations which are being done, especially at night.
3. The almost universal use of KMC in the hospitals in the Province for caring for stable small infants.
4. In individual hospitals where there has been a significant improvement, there has almost always been a good unit manager or midwife in charge of the newborn care, and supportive hospital management.
5. Teaching: It is clear when visiting the hospitals that the knowledge and skills that have been taught have been largely implemented
6. Hospital visits: These have been a source of encouragement to the hospital staff, and also an opportunity to correct and improve on the patient care practices.
7. Acquisition of equipment: Although equipment per se does not improve care, the fact that appropriate equipment has been purchased, has made it possible to provide a better standard of care for the small and sick infants.
One of the constraints to maintaining and further decreasing the neonatal mortality rates is the serious lack of staff, especially midwives, in many of the hospitals.
289
290
Table 1 Early Neonatal Mortality Rates in Limpopo Province
ENNMR: Early neonatal mortality rate / 1000 live birthsBW: Birth weight
291
ACCREDITATION OF NEWBORN CARE – THE NEXT STEP
AF Malan, DH Greenfield, NC Mzolo, PL Mashao, BA Robertson
IntroductionObjective evaluation and accreditation of newborn care remains a desirable goal. We report on the experience with the accreditation tool presented at the previous Conference on Priorities in Perinatal Care.
MethodsAll facets of newborn care demonstrated and discussed during the Limpopo Initiative for Newborn Care (LINC) project were assessed.
Three aspects were looked at:1. Provision of newborn care as demonstrated by facilities, equipment,
staffing, support services, use of provincial guidelines and admission records, hospital policies, KMC practices, training of personnel, resource materials, and documentation of perinatal mortality review meetings. A standardized check list was used.
2. Statistics and neonatal mortality rates over 3-year period. 3. Quality of care as determined by the records of both medical and
nursing staff. A format for each of the 8 common conditions was used deciding whether the care was acceptable or not.
ResultsThe checklist could be easily and objectively assessed. Similarly the neonatal statistics were not problematic. The completion of the admission record and note keeping, however, were generally not systematic and satisfactory. It was difficult to find the required data for each condition, and the scoring system was too subjective.
292
DiscussionThe checklist provided a good evaluation of the care provided. Mortality rates were influenced by many factors including number of births, obstetric practices, and referrals. Our assessment of quality of care according to patient records has already been referred to.
The aim was to award “Excellent newborn care” which turned out to be an all-or-none decision. Some graded accreditation would be more encouraging and appropriate for smaller hospitals.
RecommendationsWe suggest the following:1. Keep the checklist for assessment of the provision of newborn care.2. Evaluate newborn survival in the 1–2kg birth weight group. This will
exclude the very small ones and eliminate any obstetric bias (mainly fetal hypoxia) in the infants over 2kg.
3. Simplify the evaluation of records to generic items with the addition of only a few specific markers.
4. Award accreditation in three categories such as Silver, Gold and Platinum according to clearly defined criteria bases on points 1 – 3 above.
293
DO INITIATIVES LIKE: THE BETTER BIRTH INITIATIVE (BBI), THE WHO/UNICEF BABY FRIENDLY HOSPITAL INITIATIVE (BFHI) AND KANGAROO MOTHER CARE (KMC) IMPROVE THE QUALITY OF PERINATAL CARE?
Louise GoosenMowbray Maternity Hospital
IntroductionIt is admirable that the South African Health sector is continually striving to improve perinatal health outcomes with initiatives like PEP, PMTCT, BBI, BFHI and KMC. The question is; do such initiatives achieve better quality of perinatal care? This talk will discuss the last three titles mentioned above.
Initiatives1. BBI or the Better Birth Initiative
The brainchild of Prof Justus Hofmeyr. In brief, BBI promotes natural labour and child birth with minimal intervention, unless medically indicated. All the recommendations are research-based and are therefore proven best practice. Sadly, in many instances, it was the reduction of HIV transmission to neonates rather than proven best practice that has led to the successful implementation of BBI.In my opinion, whether BBI is adhered to in part or in totality it does improve patients’ labour and birth experiences. Worldwide it has evolved into the Mother Friendly Hospital Initiative.
2. BFHI, the Baby Friendly Hospital initiative. The aim of the BFHI is to promote safe infant feeding practices. However with the onslaught of the HI Virus and the hugely negative affect it has had on breastfeeding, the positive impact of the BFH Initiative has, in my opinion, been vastly understated. With all the negative publicity on HIV and BF and documents like the Human Science Research Council (SHRC) entitled 'South African National HIV
294
Prevalence, HIV Incidence, Behaviour and Communication Survey, 2005' published at the end of 2005 which recommends that HIV positives mother’s choices regards feeding their infants should be restricted to formula. While breastfeeding is under such pressures, we can hardly expect BF rates to improve but will do well to sustain them.One factor of BFHI is almost impossible to implement affectively and that is Step 10. Unless the staffing situation at state clinics improves, the staff receive regular updates on breastfeeding management and huge numbers of community peer counsellors are trained, we can labour, educate help and encourage as much as we like but our long term breastfeeding rates will continue to decline.The concern for lack of support in the community is as relevant to formula feeding mothers as it is to breastfeeding mothers. All mothers of young infants should have access to reliable information when it comes to their infants’ health and well being.
2. Kangaroo Mother Care, KMC . How fortunate that there is nothing but good news about KMC. Mothers should be able to enjoy their KMC experience whether their baby was born vaginally or by caesarean, whether breastfed or otherwise. Should her baby be premature or ill she should still be encouraged to KMC once her baby’s condition has stabilised.All who participate stand to gain: 1. The mother and her infant, whether KMC is practiced after
birth or as soon as possible thereafter. 2. The staff dealing with both the mother and the baby.3. The institution that encourages KMC.4. The Health Budget or Medical Aid.The challenge is that KMC has still not been implemented in all our institutions and that where implemented, it still needs constant driving to maintain it. We have some way to go before it becomes second nature to health workers and parents alike.
295
ConclusionIn conclusion; YES, it is worth pursuing initiatives like BBI, BFHI and KMC in your institution. No institutions can claim to have a 100% best practice 100% of the time, so even if you can achieve 20 or 30% it is worth putting in the effort. Why? Because YES, these initiatives do improve the quality of Perinatal Care.
296
CLINICAL DECISION-MAKING IN LABOUR - HOW DO PART TIME MIDWIVES FARE?
Sheila ClowDivision of Nursing & Midwifery, UCT
IntroductionIn South Africa, the majority of registered nurses are also qualified as registered midwives. However, there is no database that indicates which of these professionals retains currency of knowledge and clinical expertise. In the metropolitan areas, due to the population pressure, there are posts designated for registered midwives. However, in the rural areas, the registered nurse is expected to retain competence in all fields of nursing and midwifery. The staff allocation system favours rotation of staff through all areas which, although understandable, does not build expertise in areas that require in-depth knowledge and skills. In effect, this means that these professionals function in intrapartum settings as part time midwives.When the first Saving Mothers report was released in 1999, the Minister of Health noted, ‘In almost half of all the maternal deaths reported there was an opportunity to prevent that death, but that opportunity was missed.’ Further the majority of missed opportunities by health providers occur at the primary level. This begs 3 questions, the answers to which will indicate what type of challenge faces the health service:
1. Do we recognise/know how to recognise problems?2. Do we know what to do?3. Do we do it?
For correct clinical management to take place, not only is it essential for health professionals to be caring and technically skilful, but they must also have the correct, accurate and full information about the progress of labour, and an understanding of the implications of this information. While the correct use of the partograph is recognised by the World Health Organisation as a key strategy for effective management of labour and timely referral of developing complications, it is merely a recording instrument. Where these are incomplete, incorrect conclusions are
297
reached resulting in inaccurate diagnoses or substandard care. Unless there is clinical understanding and reasoning behind its use, the partograph will remain just a recording instrument. Any efforts to increase the disciplined and complete use must address the more fundamental issues of clinical reasoning.Clinical reasoning needs at least the following building blocks:
Knowledge. Accurate and full clinical assessment. Analysis and application of theory to clinical findings.
Two particular questions are central to clinical reasoning, namely:1. Is it that the process and progress of labour are inadequately
understood, and thus observations are done incompletely resulting in premature or inaccurate conclusions?
2. Is it that clinical skills are poorly developed and that there is little confidence in one’s ability to make a firm clinical finding?
Bloom described a taxonomy of cognitive levels Knowledge Comprehension Application Analysis Synthesis Evaluation Training programmes that are currently available tend to address the lower levels of cognitive functioning, i.e. knowledge & comprehension, rather than the higher levels, e.g. application, analysis, & synthesis, which are necessary for quality clinical practice.
InterventionA training programme to improve the quality of clinical management in labour at primary level by registered midwives in the public sector health service was launched in the Western Cape. The baseline level of functioning and evaluation of the immediate effect of the training was determined. The training intervention aimed to:
Enhance the correct and appropriate use of the partograph for clinical management in labour.
298
Develop the necessary clinical understanding amongst midwives for labour management.
Pre- and post-training tests each lasting about 45 minutes were done on the training day. These were matched for content areas and cognitive levels to test:
knowledge of the correct use of the partograph. knowledge of labour. application and interpretation of clinical information. appropriate clinical decision-making.
The following questions were asked:1. What are the current knowledge and skills of registered midwives
working in intrapartum primary care settings?2. Is there a difference between those registered midwives working
fulltime in intrapartum maternity settings and those who do not?
ResultsThe results relate to 88 primary level respondents. The 3 rural region’s scores are combined to reflect a single rural score. This is compared with the metro region. Data illustrate the scores for the use of the partograph separately from evaluation of labour knowledge, analysis, and assessment.
Pre-test resultsThe overall score obtained in the pre-test was 52.9% in the metro region and 49.5% in the rural regions.
Partograph documenting There is a trend of a higher average score in the metro region in all variables although these do not reach statistical significance. Incompleteness usually reflected risk assessment not being recorded. Of concern are the low scores obtained for correct reflection of the information. This was most common with fetal data and the misrepresentation of time, e.g. timelines representing 2 hourly instead of
299
½ hourly intervals. This has serious implications for determining referral in relation to the progress of labour
Illustration 1 Partograph documenting
Partograph documenting
0 10 20 30 40 50 60 70 80
Partograph score
Completion
Correctness
Average score (%)
RuralMetro
Knowledge, analysis and assessmentThe average score of the evaluation section of the test was 44.5% in the metro and 41.6% in the rural regions. There is a trend of a higher average score in the metro region in most variables although these do not reach statistical significance. Both regions scored better with knowledge (which is a lower order of cognitive thinking) than analysis.
Illustration 2 Comparison of knowledge, analysis and assessment scores
300
0 20 40 60 80
Knowledge
Analysis
Maternal assessment
Fetal assessment
Progress of labour assessment
Average score (%)
RuralMetro
301
It is of concern that fetal assessment and progress of labour fare so poorly. This included the inability to diagnose established labour or recognise fetal distress. It also displayed misinterpretation of latent phase being poor progress of labour and ignoring of risks present.
Post-test resultsIn most parameters there was a statistically significant improvement in the second score. In both metro and rural regions, there was an improvement in the partograph documenting. This was most apparent in the correctness of documenting. However the rural regions still lagged behind the metro region.
Illustration 3 Partograph documenting in metro and rural regions
Evaluation of knowledge and analysisIn both metro and rural regions there was an improvement in the evaluation. This was largely due to improvements in assessing fetal wellbeing and progress of labour. However, the metro region maintained a higher average score. Whilst there were statistically significant improvements in most parameters for the rural region, the evaluation scores were generally weaker than in the metro region.
Illustration 4 Post test evaluations for metro and rural regions
Metro Rural T testKnowledge 67.6 55.8 0.01Analysis 47.2 44.8 0.45
302
Fetal assessment 72.3 60.0 0.07Maternal assessment 63.2 50.0 0.008Progress of labour 47.1 44.6 0.49
DiscussionOverall there were lower scores in the rural regions where nurses function as “part-time” midwives. While there were improvements evident in the post-test, these were greater in the metro region. In general, there is generally a lower than desired level of knowledge and analytical skill apparent amongst all the midwives in this study.
The implications are that there will be a cascade of poor clinical management, which is costly in terms of lives, resources and time. It is essential to address the factors which contribute to this. It is the higher order thinking that is necessary to make reasoned conclusions of the often
Cascade of poor clinical management
Decreased knowledge & analytical skills inadequate interpretation wrong or incomplete diagnosis incorrect management decision potential for missed opportunities
complex developments in labour. Benner et al, state, “Although scientific evidence is essential to good practice, the clinician must develop skills of reasoning that are closer to moving picture whose sequence, development, change and nuance can be considered.” For part-time midwives this level of functioning could be difficult to achieve.
RecommendationsMaternity care has distinct requirements in terms of practice. Unlike most other disciplines there is a minimum of two lives requiring vigilant and knowledgeable attention. Intrapartum care should be regarded as high care and thus requires the attention of practitioners who have specialist skills. There needs to be a recognition that experienced and skilled midwifery practitioners are scarce. To this end a database of registered midwives whose knowledge and practice is current, is required.
303
Allocation of registered midwife staff to maternity settings should be kept as constant as possible to ensure that the best quality decision making is done, retained and fostered. This is especially necessary for registered midwives working in rural areas.Focussed in-service training and further education is not an optional extra or luxury – it is important to the service to ensure that omissions or errors are minimised and morbidity and mortality is reduced.
Managers at all levels should actively encourage midwives to undergo further training.
Mechanisms should be developed to ensure sufficient funding:o to support these midwives’ tuition costs, as well as o to pay for locum staff.
Training and mentoring policies and implementation to strengthen and improve midwifery clinical practice.
Sustainable quality assurance programme in relation to labour management.
A continuing professional development system needs to be implemented.
Areas to be addressed in training programmes should include: the correct use of the partograph (Guidelines and protocols to be
applied consistently). strengthening the knowledge base. developing clinical reasoning skills (training programmes must
address higher order cognitive thinking).
ConclusionIntrapartum care should be done by full-timers.