The 3D jigsaw puzzle: mapping large indoor spaces Ricardo Martin-Brualla 1 , Yanling He 1 , Bryan C. Russell 2 , and Steven M. Seitz 1 1 University of Washington 2 Intel Abstract. We introduce an approach for analyzing annotated maps of a site, together with Internet photos, to reconstruct large indoor spaces of famous tourist sites. While current 3D reconstruction algorithms often produce a set of disconnected components (3D pieces) for indoor scenes due to scene coverage or matching failures, we make use of a provided map to lay out the 3D pieces in a global coordinate system. Our approach leverages position, orientation, and shape cues extracted from the map and 3D pieces and optimizes a global objective to recover the global layout of the pieces. We introduce a novel crowd flow cue that measures how people move across the site to recover 3D geometry orientation. We show compelling results on major tourist sites. Keywords: Indoor scene reconstruction, maps, 3D jigsaw puzzle. 1 Introduction Recent breakthroughs in computer vision now allow us to model our world in 3D with extraordinary accuracy and visual fidelity from just about any set of overlapping photos [1–3]. However, a limitation of state-of-the-art 3D reconstruc- tion techniques from Internet photos is that large scenes tend to break up into a collection of disconnected pieces due to gaps in the depicted scene coverage or matching failures. Rather than a single, fully-connected Vatican model, for instance, we get a collection of smaller 3D pieces for different rooms, such as the Sistine Chapel, the Raphael Rooms, and the Hall of Maps, each having their own 3D coordinate system. A major challenge is to automatically put these 3D pieces together correctly into a global coordinate frame. This is akin to solving a 3D jigsaw puzzle, where the scale, rotation, and translation of the 3D pieces must be recovered with respect to the global coordinate frame. Solving the 3D jigsaw puzzle is extremely difficult using image information alone due to the aforementioned coverage and matching failures. Instead, we seek to leverage readily available map data to solve the 3D jigsaw puzzle. Such data provides additional information that helps constrain the spatial layout of the 3D pieces. For example, a map of the Vatican shows an annotated floorplan of the different rooms, with a legend providing the names of the rooms and any objects located inside the rooms. Such maps are plentiful and widely available, for example in tourist guidebooks (e.g. Rick Steves, Lonely Planet, Baedeker) and online (e.g. planetware.com).
Transcript
The 3D jigsaw puzzle: mappinglarge indoor spaces
Ricardo Martin-Brualla1, Yanling He1, Bryan C. Russell2, and Steven M. Seitz1
1University of Washington 2Intel
Abstract. We introduce an approach for analyzing annotated maps ofa site, together with Internet photos, to reconstruct large indoor spacesof famous tourist sites. While current 3D reconstruction algorithms oftenproduce a set of disconnected components (3D pieces) for indoor scenesdue to scene coverage or matching failures, we make use of a providedmap to lay out the 3D pieces in a global coordinate system. Our approachleverages position, orientation, and shape cues extracted from the mapand 3D pieces and optimizes a global objective to recover the globallayout of the pieces. We introduce a novel crowd flow cue that measureshow people move across the site to recover 3D geometry orientation. Weshow compelling results on major tourist sites.
Keywords: Indoor scene reconstruction, maps, 3D jigsaw puzzle.
1 Introduction
Recent breakthroughs in computer vision now allow us to model our world in3D with extraordinary accuracy and visual fidelity from just about any set ofoverlapping photos [1–3]. However, a limitation of state-of-the-art 3D reconstruc-tion techniques from Internet photos is that large scenes tend to break up intoa collection of disconnected pieces due to gaps in the depicted scene coverageor matching failures. Rather than a single, fully-connected Vatican model, forinstance, we get a collection of smaller 3D pieces for different rooms, such asthe Sistine Chapel, the Raphael Rooms, and the Hall of Maps, each having theirown 3D coordinate system. A major challenge is to automatically put these 3Dpieces together correctly into a global coordinate frame. This is akin to solvinga 3D jigsaw puzzle, where the scale, rotation, and translation of the 3D piecesmust be recovered with respect to the global coordinate frame.
Solving the 3D jigsaw puzzle is extremely difficult using image informationalone due to the aforementioned coverage and matching failures. Instead, weseek to leverage readily available map data to solve the 3D jigsaw puzzle. Suchdata provides additional information that helps constrain the spatial layout ofthe 3D pieces. For example, a map of the Vatican shows an annotated floorplanof the different rooms, with a legend providing the names of the rooms and anyobjects located inside the rooms. Such maps are plentiful and widely available,for example in tourist guidebooks (e.g. Rick Steves, Lonely Planet, Baedeker)and online (e.g. planetware.com).
2 R. Martin-Brualla, Y. He, B. C. Russell, S. M. Seitz
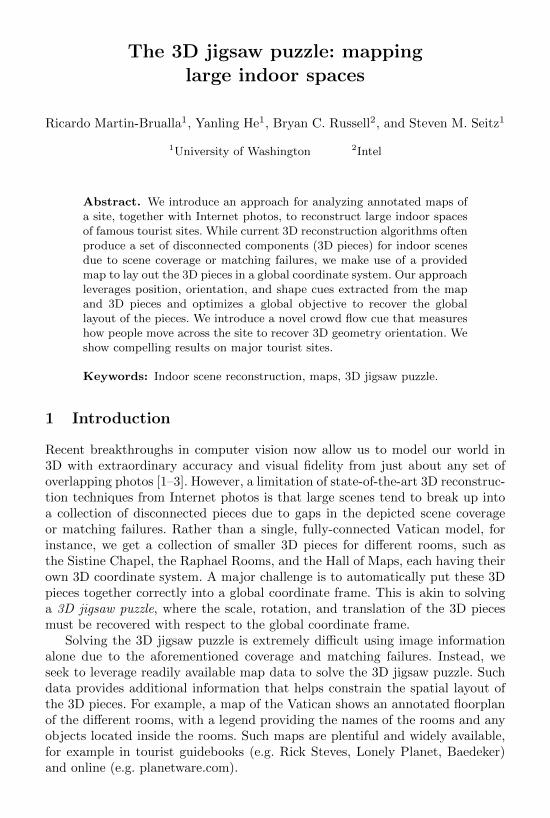
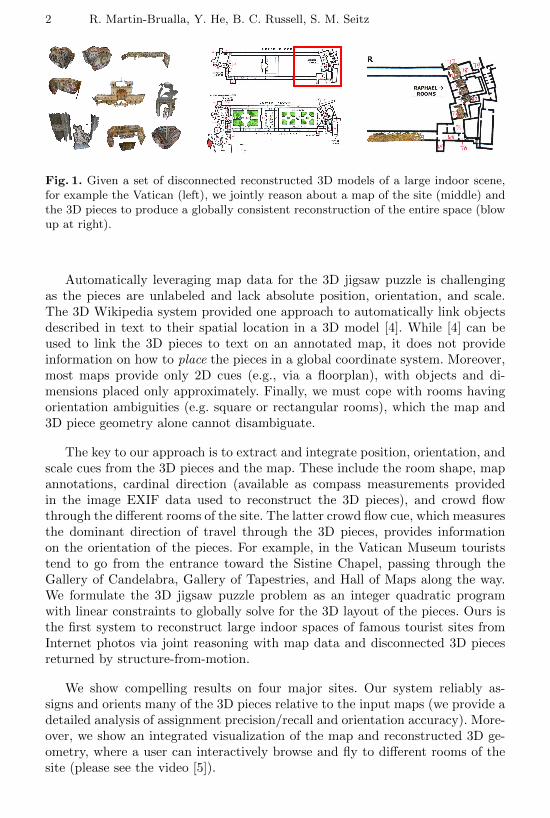
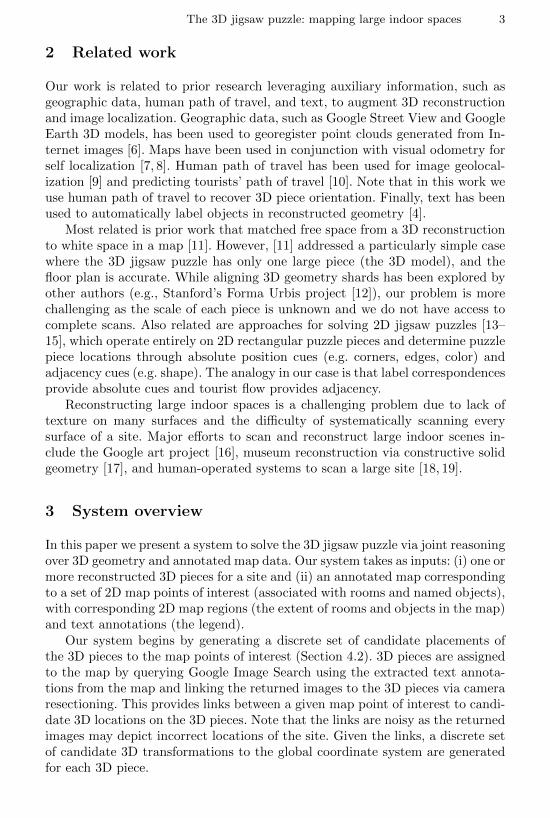
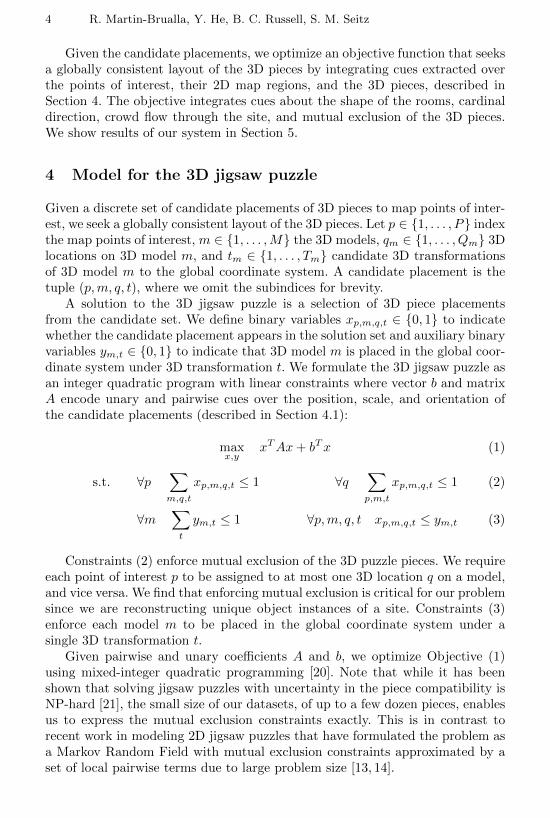
Fig. 1. Given a set of disconnected reconstructed 3D models of a large indoor scene,for example the Vatican (left), we jointly reason about a map of the site (middle) andthe 3D pieces to produce a globally consistent reconstruction of the entire space (blowup at right).
Automatically leveraging map data for the 3D jigsaw puzzle is challengingas the pieces are unlabeled and lack absolute position, orientation, and scale.The 3D Wikipedia system provided one approach to automatically link objectsdescribed in text to their spatial location in a 3D model [4]. While [4] can beused to link the 3D pieces to text on an annotated map, it does not provideinformation on how to place the pieces in a global coordinate system. Moreover,most maps provide only 2D cues (e.g., via a floorplan), with objects and di-mensions placed only approximately. Finally, we must cope with rooms havingorientation ambiguities (e.g. square or rectangular rooms), which the map and3D piece geometry alone cannot disambiguate.
The key to our approach is to extract and integrate position, orientation, andscale cues from the 3D pieces and the map. These include the room shape, mapannotations, cardinal direction (available as compass measurements providedin the image EXIF data used to reconstruct the 3D pieces), and crowd flowthrough the different rooms of the site. The latter crowd flow cue, which measuresthe dominant direction of travel through the 3D pieces, provides informationon the orientation of the pieces. For example, in the Vatican Museum touriststend to go from the entrance toward the Sistine Chapel, passing through theGallery of Candelabra, Gallery of Tapestries, and Hall of Maps along the way.We formulate the 3D jigsaw puzzle problem as an integer quadratic programwith linear constraints to globally solve for the 3D layout of the pieces. Ours isthe first system to reconstruct large indoor spaces of famous tourist sites fromInternet photos via joint reasoning with map data and disconnected 3D piecesreturned by structure-from-motion.
We show compelling results on four major sites. Our system reliably as-signs and orients many of the 3D pieces relative to the input maps (we provide adetailed analysis of assignment precision/recall and orientation accuracy). More-over, we show an integrated visualization of the map and reconstructed 3D ge-ometry, where a user can interactively browse and fly to different rooms of thesite (please see the video [5]).
The 3D jigsaw puzzle: mapping large indoor spaces 3
2 Related work
Our work is related to prior research leveraging auxiliary information, such asgeographic data, human path of travel, and text, to augment 3D reconstructionand image localization. Geographic data, such as Google Street View and GoogleEarth 3D models, has been used to georegister point clouds generated from In-ternet images [6]. Maps have been used in conjunction with visual odometry forself localization [7, 8]. Human path of travel has been used for image geolocal-ization [9] and predicting tourists’ path of travel [10]. Note that in this work weuse human path of travel to recover 3D piece orientation. Finally, text has beenused to automatically label objects in reconstructed geometry [4].
Most related is prior work that matched free space from a 3D reconstructionto white space in a map [11]. However, [11] addressed a particularly simple casewhere the 3D jigsaw puzzle has only one large piece (the 3D model), and thefloor plan is accurate. While aligning 3D geometry shards has been explored byother authors (e.g., Stanford’s Forma Urbis project [12]), our problem is morechallenging as the scale of each piece is unknown and we do not have access tocomplete scans. Also related are approaches for solving 2D jigsaw puzzles [13–15], which operate entirely on 2D rectangular puzzle pieces and determine puzzlepiece locations through absolute position cues (e.g. corners, edges, color) andadjacency cues (e.g. shape). The analogy in our case is that label correspondencesprovide absolute cues and tourist flow provides adjacency.
Reconstructing large indoor spaces is a challenging problem due to lack oftexture on many surfaces and the difficulty of systematically scanning everysurface of a site. Major efforts to scan and reconstruct large indoor scenes in-clude the Google art project [16], museum reconstruction via constructive solidgeometry [17], and human-operated systems to scan a large site [18, 19].
3 System overview
In this paper we present a system to solve the 3D jigsaw puzzle via joint reasoningover 3D geometry and annotated map data. Our system takes as inputs: (i) one ormore reconstructed 3D pieces for a site and (ii) an annotated map correspondingto a set of 2D map points of interest (associated with rooms and named objects),with corresponding 2D map regions (the extent of rooms and objects in the map)and text annotations (the legend).
Our system begins by generating a discrete set of candidate placements ofthe 3D pieces to the map points of interest (Section 4.2). 3D pieces are assignedto the map by querying Google Image Search using the extracted text annota-tions from the map and linking the returned images to the 3D pieces via cameraresectioning. This provides links between a given map point of interest to candi-date 3D locations on the 3D pieces. Note that the links are noisy as the returnedimages may depict incorrect locations of the site. Given the links, a discrete setof candidate 3D transformations to the global coordinate system are generatedfor each 3D piece.
4 R. Martin-Brualla, Y. He, B. C. Russell, S. M. Seitz
Given the candidate placements, we optimize an objective function that seeksa globally consistent layout of the 3D pieces by integrating cues extracted overthe points of interest, their 2D map regions, and the 3D pieces, described inSection 4. The objective integrates cues about the shape of the rooms, cardinaldirection, crowd flow through the site, and mutual exclusion of the 3D pieces.We show results of our system in Section 5.
4 Model for the 3D jigsaw puzzle
Given a discrete set of candidate placements of 3D pieces to map points of inter-est, we seek a globally consistent layout of the 3D pieces. Let p ∈ {1, . . . , P} indexthe map points of interest, m ∈ {1, . . . ,M} the 3D models, qm ∈ {1, . . . , Qm} 3Dlocations on 3D model m, and tm ∈ {1, . . . , Tm} candidate 3D transformationsof 3D model m to the global coordinate system. A candidate placement is thetuple (p,m, q, t), where we omit the subindices for brevity.
A solution to the 3D jigsaw puzzle is a selection of 3D piece placementsfrom the candidate set. We define binary variables xp,m,q,t ∈ {0, 1} to indicatewhether the candidate placement appears in the solution set and auxiliary binaryvariables ym,t ∈ {0, 1} to indicate that 3D model m is placed in the global coor-dinate system under 3D transformation t. We formulate the 3D jigsaw puzzle asan integer quadratic program with linear constraints where vector b and matrixA encode unary and pairwise cues over the position, scale, and orientation ofthe candidate placements (described in Section 4.1):
maxx,y
xTAx+ bTx (1)
s.t. ∀p∑m,q,t
xp,m,q,t ≤ 1 ∀q∑p,m,t
xp,m,q,t ≤ 1 (2)
∀m∑t
ym,t ≤ 1 ∀p,m, q, t xp,m,q,t ≤ ym,t (3)
Constraints (2) enforce mutual exclusion of the 3D puzzle pieces. We requireeach point of interest p to be assigned to at most one 3D location q on a model,and vice versa. We find that enforcing mutual exclusion is critical for our problemsince we are reconstructing unique object instances of a site. Constraints (3)enforce each model m to be placed in the global coordinate system under asingle 3D transformation t.
Given pairwise and unary coefficients A and b, we optimize Objective (1)using mixed-integer quadratic programming [20]. Note that while it has beenshown that solving jigsaw puzzles with uncertainty in the piece compatibility isNP-hard [21], the small size of our datasets, of up to a few dozen pieces, enablesus to express the mutual exclusion constraints exactly. This is in contrast torecent work in modeling 2D jigsaw puzzles that have formulated the problem asa Markov Random Field with mutual exclusion constraints approximated by aset of local pairwise terms due to large problem size [13, 14].
The 3D jigsaw puzzle: mapping large indoor spaces 5
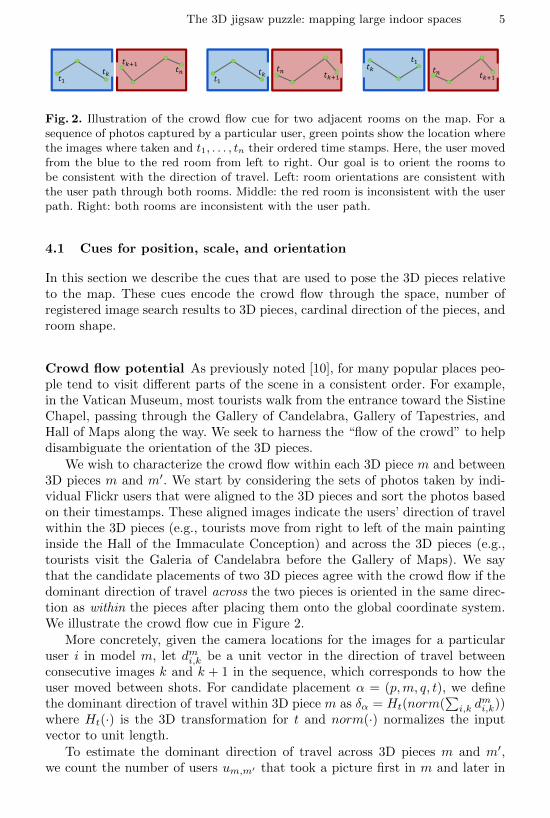
Fig. 2. Illustration of the crowd flow cue for two adjacent rooms on the map. For asequence of photos captured by a particular user, green points show the location wherethe images where taken and t1, . . . , tn their ordered time stamps. Here, the user movedfrom the blue to the red room from left to right. Our goal is to orient the rooms tobe consistent with the direction of travel. Left: room orientations are consistent withthe user path through both rooms. Middle: the red room is inconsistent with the userpath. Right: both rooms are inconsistent with the user path.
4.1 Cues for position, scale, and orientation
In this section we describe the cues that are used to pose the 3D pieces relativeto the map. These cues encode the crowd flow through the space, number ofregistered image search results to 3D pieces, cardinal direction of the pieces, androom shape.
Crowd flow potential As previously noted [10], for many popular places peo-ple tend to visit different parts of the scene in a consistent order. For example,in the Vatican Museum, most tourists walk from the entrance toward the SistineChapel, passing through the Gallery of Candelabra, Gallery of Tapestries, andHall of Maps along the way. We seek to harness the “flow of the crowd” to helpdisambiguate the orientation of the 3D pieces.
We wish to characterize the crowd flow within each 3D piece m and between3D pieces m and m′. We start by considering the sets of photos taken by indi-vidual Flickr users that were aligned to the 3D pieces and sort the photos basedon their timestamps. These aligned images indicate the users’ direction of travelwithin the 3D pieces (e.g., tourists move from right to left of the main paintinginside the Hall of the Immaculate Conception) and across the 3D pieces (e.g.,tourists visit the Galeria of Candelabra before the Gallery of Maps). We saythat the candidate placements of two 3D pieces agree with the crowd flow if thedominant direction of travel across the two pieces is oriented in the same direc-tion as within the pieces after placing them onto the global coordinate system.We illustrate the crowd flow cue in Figure 2.
More concretely, given the camera locations for the images for a particularuser i in model m, let dmi,k be a unit vector in the direction of travel betweenconsecutive images k and k + 1 in the sequence, which corresponds to how theuser moved between shots. For candidate placement α = (p,m, q, t), we definethe dominant direction of travel within 3D piece m as δα = Ht(norm(
∑i,k d
mi,k))
where Ht(·) is the 3D transformation for t and norm(·) normalizes the inputvector to unit length.
To estimate the dominant direction of travel across 3D pieces m and m′,we count the number of users um,m′ that took a picture first in m and later in
6 R. Martin-Brualla, Y. He, B. C. Russell, S. M. Seitz
m′. For candidate placements α and α′ with m 6= m′, we denote the dominantdirection of travel across the two pieces in the global coordinate system as theunit vector δα,α′ = sign(um,m′ − um′,m) · norm(Ht′(cm′) − Ht(cm)) where cmis the 3D centroid of 3D piece m. Note that if most users travel from m to m′,δα,α′ will point in the direction from 3D piece m to m′ in the global coordinatesystem. We define the crowd flow cue for candidate placements α and α′ as thesum of inner products:
Aα,α′ = < δα,α′ , δα > + < δα,α′ , δα′ > (4)
Unary potentials For each candidate placement we extract unary poten-tials for assignment φassign(α), cardinal direction φcard(α), and room shapeφshape(α). We concatenate these potentials into vector Φ(α) and, given weightsw, define the unary coefficients b as:
bα = wTΦ(α) (5)
We wish to leverage the vast amounts of labeled imagery online to connect themap points of interest to their locations in the 3D pieces. Using the text annota-tion for each point of interest in the map, we issue a query to Google Image Searchconcatenating the annotation text with the site name, followed by registering thereturned images to the 3D pieces. We define φassign(α) = count(p,m, q) as thenumber of images retrieved by querying for the text associated with map pointof interest p that are registered to the 3D location q in model m.
A small fraction of Flickr images contain heading information in EXIF tags(e.g., via compass). Although we have found such data to be sparse and notalways reliable, we can exploit it when available. The cardinal direction potentialφcard(α) measures the compatibility of compass measurements corresponding toimages used to reconstruct a 3D piece to a cardinal direction given on the map(e.g. “north”). Let Cm > 0 be the number of images used to reconstruct 3Dpiece m having a heading and Cm,t be the number of such images that agree onthe orientation of the provided cardinal direction within τ degrees after applying3D transformation t into the global coordinate system. We define the potentialto be φcard(α) = Cm,t/Cm.
Next we wish to encode how well the 3D piece matches the shape of a given2D region on the map. We encode the shape by projecting the structure-from-motion points of model m onto the map via transformation t and rasterize thepoints into a grid of cells. The shape potential φshape(α) is a weighted sum ofthree terms: (i) the ratio of intersection area over union between the 2D regionand occupied grid cells, (ii) average truncated distance of each grid cell to the2D map region edge, and (iii) fraction of grid cells that lie outside of the region.
4.2 Generating candidate placements
In this section we describe how to generate the set of candidate placements of3D pieces to map points of interest. First, we parse the map into a set of regions
The 3D jigsaw puzzle: mapping large indoor spaces 7
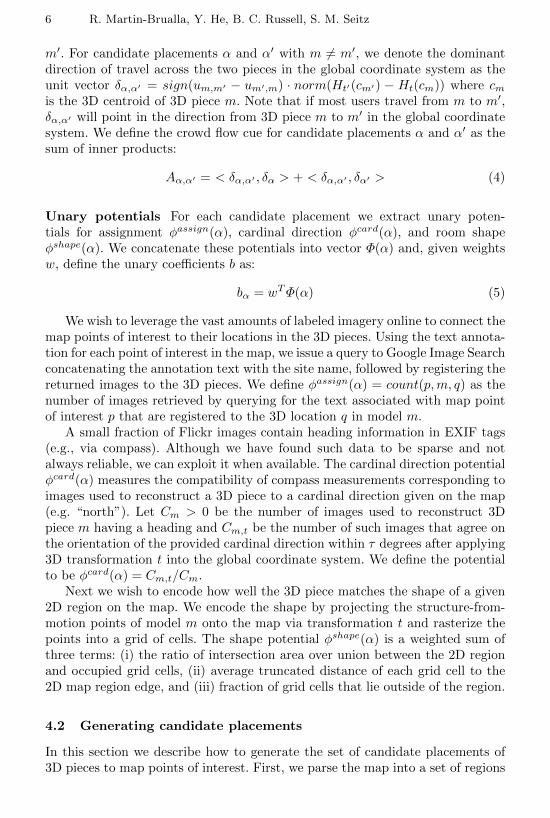
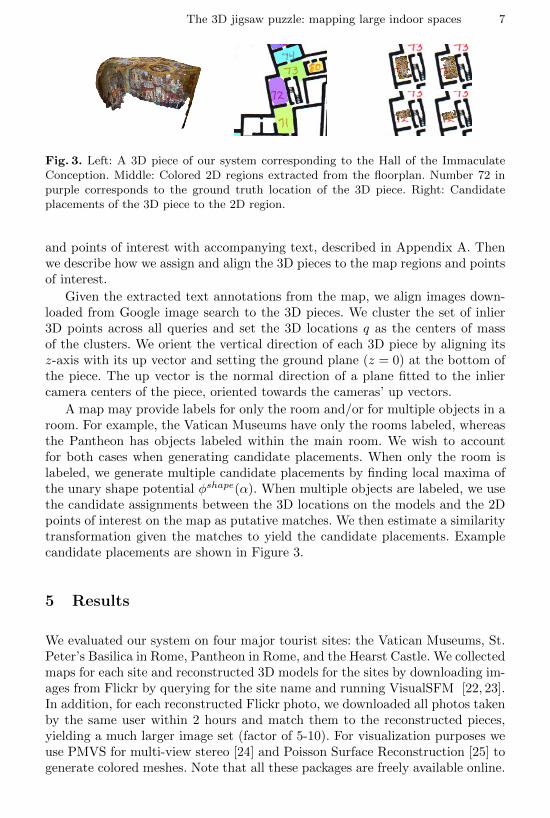
Fig. 3. Left: A 3D piece of our system corresponding to the Hall of the ImmaculateConception. Middle: Colored 2D regions extracted from the floorplan. Number 72 inpurple corresponds to the ground truth location of the 3D piece. Right: Candidateplacements of the 3D piece to the 2D region.
and points of interest with accompanying text, described in Appendix A. Thenwe describe how we assign and align the 3D pieces to the map regions and pointsof interest.
Given the extracted text annotations from the map, we align images down-loaded from Google image search to the 3D pieces. We cluster the set of inlier3D points across all queries and set the 3D locations q as the centers of massof the clusters. We orient the vertical direction of each 3D piece by aligning itsz-axis with its up vector and setting the ground plane (z = 0) at the bottom ofthe piece. The up vector is the normal direction of a plane fitted to the inliercamera centers of the piece, oriented towards the cameras’ up vectors.
A map may provide labels for only the room and/or for multiple objects in aroom. For example, the Vatican Museums have only the rooms labeled, whereasthe Pantheon has objects labeled within the main room. We wish to accountfor both cases when generating candidate placements. When only the room islabeled, we generate multiple candidate placements by finding local maxima ofthe unary shape potential φshape(α). When multiple objects are labeled, we usethe candidate assignments between the 3D locations on the models and the 2Dpoints of interest on the map as putative matches. We then estimate a similaritytransformation given the matches to yield the candidate placements. Examplecandidate placements are shown in Figure 3.
5 Results
We evaluated our system on four major tourist sites: the Vatican Museums, St.Peter’s Basilica in Rome, Pantheon in Rome, and the Hearst Castle. We collectedmaps for each site and reconstructed 3D models for the sites by downloading im-ages from Flickr by querying for the site name and running VisualSFM [22, 23].In addition, for each reconstructed Flickr photo, we downloaded all photos takenby the same user within 2 hours and match them to the reconstructed pieces,yielding a much larger image set (factor of 5-10). For visualization purposes weuse PMVS for multi-view stereo [24] and Poisson Surface Reconstruction [25] togenerate colored meshes. Note that all these packages are freely available online.
8 R. Martin-Brualla, Y. He, B. C. Russell, S. M. Seitz
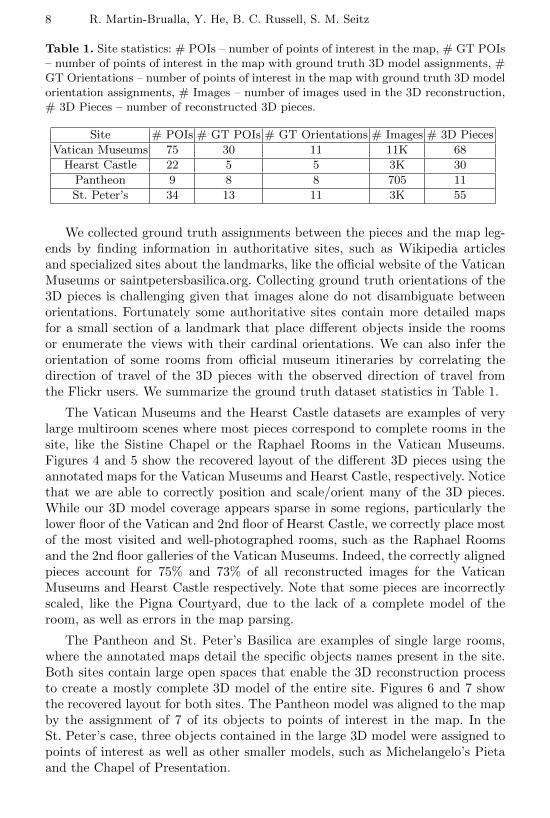
Table 1. Site statistics: # POIs – number of points of interest in the map, # GT POIs– number of points of interest in the map with ground truth 3D model assignments, #GT Orientations – number of points of interest in the map with ground truth 3D modelorientation assignments, # Images – number of images used in the 3D reconstruction,# 3D Pieces – number of reconstructed 3D pieces.
Site # POIs # GT POIs # GT Orientations # Images # 3D Pieces
Vatican Museums 75 30 11 11K 68
Hearst Castle 22 5 5 3K 30
Pantheon 9 8 8 705 11
St. Peter’s 34 13 11 3K 55
We collected ground truth assignments between the pieces and the map leg-ends by finding information in authoritative sites, such as Wikipedia articlesand specialized sites about the landmarks, like the official website of the VaticanMuseums or saintpetersbasilica.org. Collecting ground truth orientations of the3D pieces is challenging given that images alone do not disambiguate betweenorientations. Fortunately some authoritative sites contain more detailed mapsfor a small section of a landmark that place different objects inside the roomsor enumerate the views with their cardinal orientations. We can also infer theorientation of some rooms from official museum itineraries by correlating thedirection of travel of the 3D pieces with the observed direction of travel fromthe Flickr users. We summarize the ground truth dataset statistics in Table 1.
The Vatican Museums and the Hearst Castle datasets are examples of verylarge multiroom scenes where most pieces correspond to complete rooms in thesite, like the Sistine Chapel or the Raphael Rooms in the Vatican Museums.Figures 4 and 5 show the recovered layout of the different 3D pieces using theannotated maps for the Vatican Museums and Hearst Castle, respectively. Noticethat we are able to correctly position and scale/orient many of the 3D pieces.While our 3D model coverage appears sparse in some regions, particularly thelower floor of the Vatican and 2nd floor of Hearst Castle, we correctly place mostof the most visited and well-photographed rooms, such as the Raphael Roomsand the 2nd floor galleries of the Vatican Museums. Indeed, the correctly alignedpieces account for 75% and 73% of all reconstructed images for the VaticanMuseums and Hearst Castle respectively. Note that some pieces are incorrectlyscaled, like the Pigna Courtyard, due to the lack of a complete model of theroom, as well as errors in the map parsing.
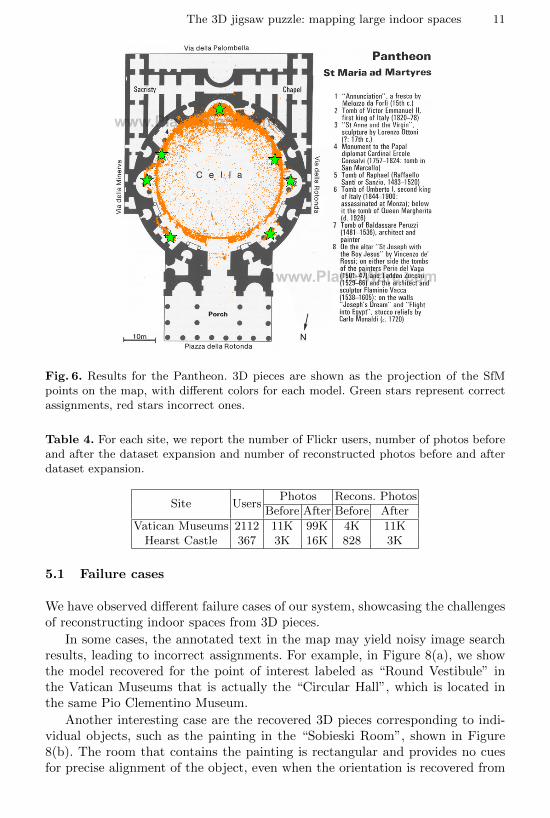
The Pantheon and St. Peter’s Basilica are examples of single large rooms,where the annotated maps detail the specific objects names present in the site.Both sites contain large open spaces that enable the 3D reconstruction processto create a mostly complete 3D model of the entire site. Figures 6 and 7 showthe recovered layout for both sites. The Pantheon model was aligned to the mapby the assignment of 7 of its objects to points of interest in the map. In theSt. Peter’s case, three objects contained in the large 3D model were assigned topoints of interest as well as other smaller models, such as Michelangelo’s Pietaand the Chapel of Presentation.
The 3D jigsaw puzzle: mapping large indoor spaces 9
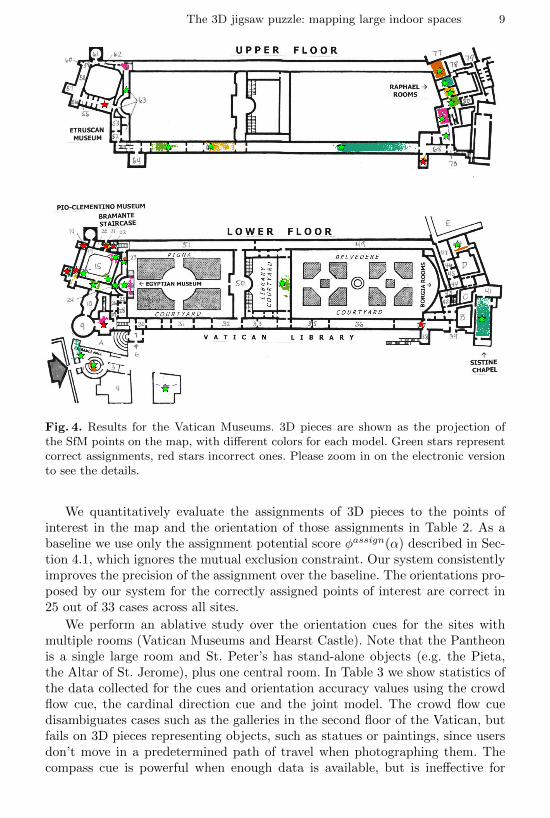
Fig. 4. Results for the Vatican Museums. 3D pieces are shown as the projection ofthe SfM points on the map, with different colors for each model. Green stars representcorrect assignments, red stars incorrect ones. Please zoom in on the electronic versionto see the details.
We quantitatively evaluate the assignments of 3D pieces to the points ofinterest in the map and the orientation of those assignments in Table 2. As abaseline we use only the assignment potential score φassign(α) described in Sec-tion 4.1, which ignores the mutual exclusion constraint. Our system consistentlyimproves the precision of the assignment over the baseline. The orientations pro-posed by our system for the correctly assigned points of interest are correct in25 out of 33 cases across all sites.
We perform an ablative study over the orientation cues for the sites withmultiple rooms (Vatican Museums and Hearst Castle). Note that the Pantheonis a single large room and St. Peter’s has stand-alone objects (e.g. the Pieta,the Altar of St. Jerome), plus one central room. In Table 3 we show statistics ofthe data collected for the cues and orientation accuracy values using the crowdflow cue, the cardinal direction cue and the joint model. The crowd flow cuedisambiguates cases such as the galleries in the second floor of the Vatican, butfails on 3D pieces representing objects, such as statues or paintings, since usersdon’t move in a predetermined path of travel when photographing them. Thecompass cue is powerful when enough data is available, but is ineffective for
10 R. Martin-Brualla, Y. He, B. C. Russell, S. M. Seitz
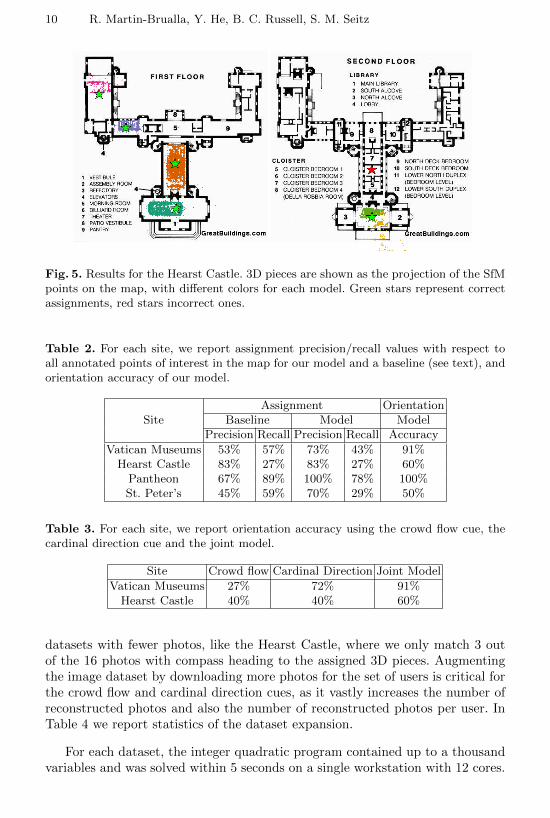
Fig. 5. Results for the Hearst Castle. 3D pieces are shown as the projection of the SfMpoints on the map, with different colors for each model. Green stars represent correctassignments, red stars incorrect ones.
Table 2. For each site, we report assignment precision/recall values with respect toall annotated points of interest in the map for our model and a baseline (see text), andorientation accuracy of our model.
SiteAssignment Orientation
Baseline Model ModelPrecision Recall Precision Recall Accuracy
datasets with fewer photos, like the Hearst Castle, where we only match 3 outof the 16 photos with compass heading to the assigned 3D pieces. Augmentingthe image dataset by downloading more photos for the set of users is critical forthe crowd flow and cardinal direction cues, as it vastly increases the number ofreconstructed photos and also the number of reconstructed photos per user. InTable 4 we report statistics of the dataset expansion.
For each dataset, the integer quadratic program contained up to a thousandvariables and was solved within 5 seconds on a single workstation with 12 cores.
The 3D jigsaw puzzle: mapping large indoor spaces 11
Fig. 6. Results for the Pantheon. 3D pieces are shown as the projection of the SfMpoints on the map, with different colors for each model. Green stars represent correctassignments, red stars incorrect ones.
Table 4. For each site, we report the number of Flickr users, number of photos beforeand after the dataset expansion and number of reconstructed photos before and afterdataset expansion.
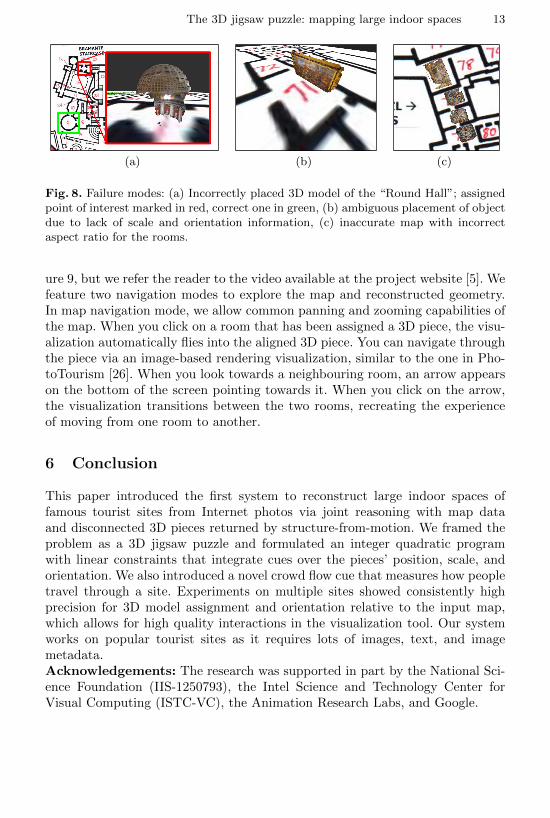
We have observed different failure cases of our system, showcasing the challengesof reconstructing indoor spaces from 3D pieces.
In some cases, the annotated text in the map may yield noisy image searchresults, leading to incorrect assignments. For example, in Figure 8(a), we showthe model recovered for the point of interest labeled as “Round Vestibule” inthe Vatican Museums that is actually the “Circular Hall”, which is located inthe same Pio Clementino Museum.
Another interesting case are the recovered 3D pieces corresponding to indi-vidual objects, such as the painting in the “Sobieski Room”, shown in Figure8(b). The room that contains the painting is rectangular and provides no cuesfor precise alignment of the object, even when the orientation is recovered from
12 R. Martin-Brualla, Y. He, B. C. Russell, S. M. Seitz
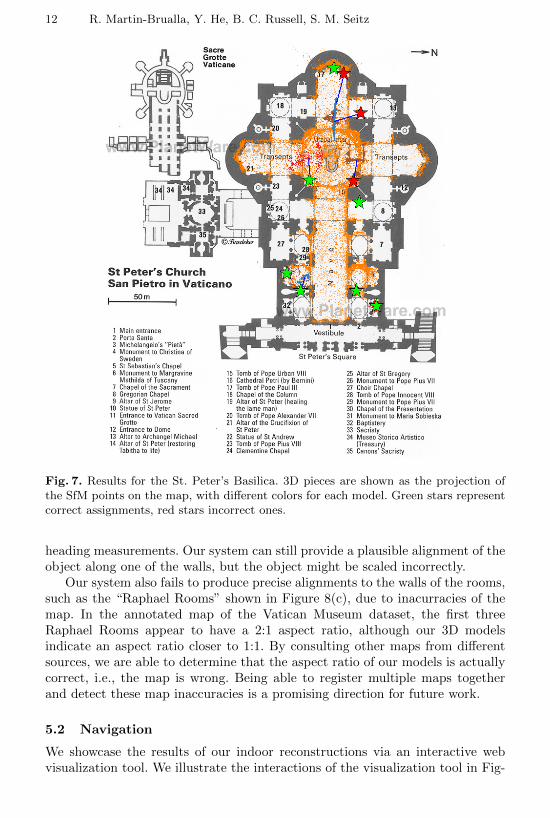
Fig. 7. Results for the St. Peter’s Basilica. 3D pieces are shown as the projection ofthe SfM points on the map, with different colors for each model. Green stars representcorrect assignments, red stars incorrect ones.
heading measurements. Our system can still provide a plausible alignment of theobject along one of the walls, but the object might be scaled incorrectly.
Our system also fails to produce precise alignments to the walls of the rooms,such as the “Raphael Rooms” shown in Figure 8(c), due to inacurracies of themap. In the annotated map of the Vatican Museum dataset, the first threeRaphael Rooms appear to have a 2:1 aspect ratio, although our 3D modelsindicate an aspect ratio closer to 1:1. By consulting other maps from differentsources, we are able to determine that the aspect ratio of our models is actuallycorrect, i.e., the map is wrong. Being able to register multiple maps togetherand detect these map inaccuracies is a promising direction for future work.
5.2 Navigation
We showcase the results of our indoor reconstructions via an interactive webvisualization tool. We illustrate the interactions of the visualization tool in Fig-
The 3D jigsaw puzzle: mapping large indoor spaces 13
(a) (b) (c)
Fig. 8. Failure modes: (a) Incorrectly placed 3D model of the “Round Hall”; assignedpoint of interest marked in red, correct one in green, (b) ambiguous placement of objectdue to lack of scale and orientation information, (c) inaccurate map with incorrectaspect ratio for the rooms.
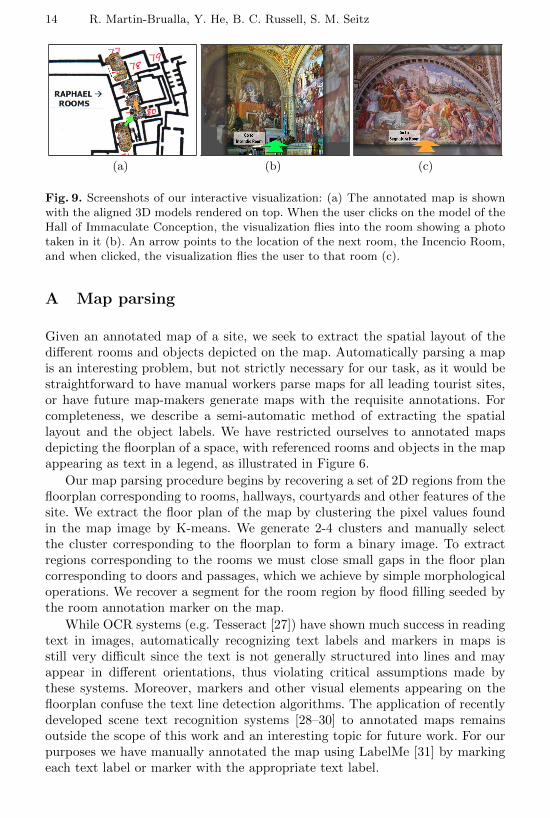
ure 9, but we refer the reader to the video available at the project website [5]. Wefeature two navigation modes to explore the map and reconstructed geometry.In map navigation mode, we allow common panning and zooming capabilities ofthe map. When you click on a room that has been assigned a 3D piece, the visu-alization automatically flies into the aligned 3D piece. You can navigate throughthe piece via an image-based rendering visualization, similar to the one in Pho-toTourism [26]. When you look towards a neighbouring room, an arrow appearson the bottom of the screen pointing towards it. When you click on the arrow,the visualization transitions between the two rooms, recreating the experienceof moving from one room to another.
6 Conclusion
This paper introduced the first system to reconstruct large indoor spaces offamous tourist sites from Internet photos via joint reasoning with map dataand disconnected 3D pieces returned by structure-from-motion. We framed theproblem as a 3D jigsaw puzzle and formulated an integer quadratic programwith linear constraints that integrate cues over the pieces’ position, scale, andorientation. We also introduced a novel crowd flow cue that measures how peopletravel through a site. Experiments on multiple sites showed consistently highprecision for 3D model assignment and orientation relative to the input map,which allows for high quality interactions in the visualization tool. Our systemworks on popular tourist sites as it requires lots of images, text, and imagemetadata.Acknowledgements: The research was supported in part by the National Sci-ence Foundation (IIS-1250793), the Intel Science and Technology Center forVisual Computing (ISTC-VC), the Animation Research Labs, and Google.
14 R. Martin-Brualla, Y. He, B. C. Russell, S. M. Seitz
(a) (b) (c)
Fig. 9. Screenshots of our interactive visualization: (a) The annotated map is shownwith the aligned 3D models rendered on top. When the user clicks on the model of theHall of Immaculate Conception, the visualization flies into the room showing a phototaken in it (b). An arrow points to the location of the next room, the Incencio Room,and when clicked, the visualization flies the user to that room (c).
A Map parsing
Given an annotated map of a site, we seek to extract the spatial layout of thedifferent rooms and objects depicted on the map. Automatically parsing a mapis an interesting problem, but not strictly necessary for our task, as it would bestraightforward to have manual workers parse maps for all leading tourist sites,or have future map-makers generate maps with the requisite annotations. Forcompleteness, we describe a semi-automatic method of extracting the spatiallayout and the object labels. We have restricted ourselves to annotated mapsdepicting the floorplan of a space, with referenced rooms and objects in the mapappearing as text in a legend, as illustrated in Figure 6.
Our map parsing procedure begins by recovering a set of 2D regions from thefloorplan corresponding to rooms, hallways, courtyards and other features of thesite. We extract the floor plan of the map by clustering the pixel values foundin the map image by K-means. We generate 2-4 clusters and manually selectthe cluster corresponding to the floorplan to form a binary image. To extractregions corresponding to the rooms we must close small gaps in the floor plancorresponding to doors and passages, which we achieve by simple morphologicaloperations. We recover a segment for the room region by flood filling seeded bythe room annotation marker on the map.
While OCR systems (e.g. Tesseract [27]) have shown much success in readingtext in images, automatically recognizing text labels and markers in maps isstill very difficult since the text is not generally structured into lines and mayappear in different orientations, thus violating critical assumptions made bythese systems. Moreover, markers and other visual elements appearing on thefloorplan confuse the text line detection algorithms. The application of recentlydeveloped scene text recognition systems [28–30] to annotated maps remainsoutside the scope of this work and an interesting topic for future work. For ourpurposes we have manually annotated the map using LabelMe [31] by markingeach text label or marker with the appropriate text label.
The 3D jigsaw puzzle: mapping large indoor spaces 15
References
1. Agarwal, S., Snavely, N., Simon, I., Seitz, S.M., Szeliski, R.: Building rome in aday. In: International Conference on Computer Vision. (2009)
2. Agarwal, S., Furukawa, Y., Snavely, N., Simon, I., Curless, B., Seitz, S.M., Szeliski,R.: Building rome in a day. Commun. ACM 54(10) (October 2011) 105–112
3. Shan, Q., Adams, R., Curless, B., Furukawa, Y., Seitz, S.M.: The visual Turingtest for scene reconstruction. In: Joint 3DIM/3DPVT Conference (3DV). (2013)
4. Russell, B.C., Martin-Brualla, R., Butler, D.J., Seitz, S.M., Zettlemoyer, L.: 3DWikipedia: Using online text to automatically label and navigate reconstructed ge-ometry. ACM Transactions on Graphics (SIGGRAPH Asia 2013) 32(6) (November2013)
6. Wang, C.P., Wilson, K., Snavely, N.: Accurate georegistration of point clouds usinggeographic data. In: 3DV. (2013)
7. Levin, A., Szeliski, R.: Visual odometry and map correlation. In: IEEE ComputerVision and Pattern Recognition or CVPR. (2004)
8. Brubaker, M., Geiger, A., Urtasun, R.: Lost! Leveraging the crowd for probabilisticvisual self-localization. In: IEEE Computer Vision and Pattern Recognition orCVPR. (2013)
9. Kalogerakis, E., Vesselova, O., Hays, J., Efros, A.A., Hertzmann, A.: Image se-quence geolocation with human travel priors. In: Proceedings of the IEEE Inter-national Conference on Computer Vision (ICCV ’09). (2009)
10. Simon, I.: Scene Understanding Using Internet Photo Collections. PhD thesis,University of Washington (2010)
11. Kaminsky, R., Snavely, N., Seitz, S.M., Szeliski, R.: Alignment of 3D point cloudsto overhead images. In: Workshop on Internet Vision. (2009)
12. Koller, D., Trimble, J., Najbjerg, T., Gelfand, N., Levoy, M.: Fragments of thecity: Stanford’s digital forma urbis romae project. J. Roman Archaeol. Suppl. 61(2006) 237–252
13. Cho, T.S., Avidan, S., Freeman, W.T.: The patch transform. IEEE Transactionson Pattern Analysis and Machine Intelligence 32(8) (2010) 1489–1501
14. Cho, T.S., Avidan, S., Freeman, W.T.: A probabilistic image jigsaw puzzle solver.In: IEEE Conference on Computer Vision and Pattern Recognition (CVPR). (2010)
15. Gallagher, A.: Jigsaw puzzles with pieces of unknown orientation. In: IEEE Con-ference on Computer Vision and Pattern Recognition (CVPR). (2012)
16. : Google art project. http://www.google.com/culturalinstitute/project/art-project
17. Xiao, J., Furukawa, Y.: Reconstructing the world’s museums. In: Proceedings ofthe 12th European Conference on Computer Vision. (2012)
18. Liu, T., Carlberg, M., Chen, G., Chen, J., Kua, J., Zakhor, A.: Indoor localizationand visualization using a human-operated backpack system. In: Indoor Positioningand Indoor Navigation (IPIN), 2010 International Conference on. (2010)
19. Xiao, J., Owens, A., Torralba, A.: SUN3D: A database of big spaces reconstructedusing SfM and object labels. In: International Conference on Computer Vision.(2013)
23. Wu, C.: VisualSFM - a visual structure from motion system.http://ccwu.me/vsfm/ (2011)
24. Furukawa, Y., Ponce, J.: Accurate, dense, and robust multi-view stereopsis. IEEETrans. Pattern Analysis and Machine Intelligence 32(8) (2010) 1362–1376
25. Kazhdan, M., Bolitho, M., Hoppe, H.: Poisson surface reconstruction. In: Proceed-ings of the 4th Eurographics Symposium on Geometry Processing (SGP). (2006)61–70
27. : tesseract-ocr. https://code.google.com/p/tesseract-ocr/28. Epshtein, B., Ofek, E., Wexler, Y.: Detecting text in natural scenes with stroke
width transform. 2013 IEEE Conference on Computer Vision and Pattern Recog-nition 0 (2010) 2963–2970
29. Goodfellow, I.J., Bulatov, Y., Ibarz, J., Arnoud, S., Shet, V.: Multi-digit numberrecognition from street view imagery using deep convolutional neural networks.CoRR abs/1312.6082 (2013)
30. Bissacco, A., Cummins, M., Netzer, Y., Neven, H.: Photoocr: Reading text inuncontrolled conditions. In: The IEEE International Conference on ComputerVision (ICCV). (December 2013)
31. Russell, B.C., Torralba, A., Murphy, K.P., Freeman, W.T.: Labelme: A databaseand web-based tool for image annotation. Int. J. Comput. Vision 77(1-3) (May2008) 157–173