18
connectsmart.com The 5 Most Critical MSP Metrics… And Why You Are Losing Revenue If You Aren’t Tracking Them Correctly! In an MSP business, timely, accurate data is king. [email protected]
| Date post: | 17-Jun-2018 |
| Category: |
Documents |
| Upload: | truonglien |
| View: | 213 times |
| Download: | 0 times |
connectsmart.com
The 5 Most Critical MSP Metrics… And Why You Are Losing
Revenue If You Aren’t Tracking Them
Correctly!
In an MSP business, timely, accurate data is king.

Introduction
In an MSP business, timely, accurate data is king. It can be the difference between profitable relationships and lost customers. Luckily, there are technologies available to connect all aspects of our business and allow us to do more with less by presenting more data than we could have possibly imagined.
With technologies like Professional Services Automation (PSA) and Remote Monitoring and Management (RMM), much has been written and argued regarding which metrics are most critical for a service provider to track. While many of them are obvious, not all of them can tell the full story on their own. The purpose of this eBook is to not only discuss the 5 most critical metrics for any service provider business, but to educate on what it actually means to track them effectively in an effort to maximize your profit.
The 5 most critical MSP metrics are:
• Agreement Profitability• Utilization by Member• Actual Customer Satisfaction• SLA Compliance• Exception Management
While metrics like revenue, sales forecast, and accounts receivable are critical, they are also straightforward and easily understood. For these reasons, they are not taken into account in this eBook. Instead, we explore the multi-faceted metrics that can easily be taken or gathered out of context and how to ensure your business’ health is always maximized real-time.
The methodology behind these metrics is validated by 30 years of direct, successful MSP experience as well as feedback from thousands of providers across the globe. Based on this first hand experience leveraging PSA and RMM solutions in our practice, Connections for Business found that it was often just not possible to properly track these metrics using the built in capabilities of these tools. As a result, we created a dashboard-based platform to centralize and visualize key metrics in real time and enable management by Exception. After a number of other MSP’s requested use of the platform, ConnectSMART was created and is now used by more than 1,200 service providers around the globe.
connectsmart.com 1.
The 5 Most Critical MSP Metrics
2.
1. Agreement Profitability
As a service provider transitions from time and materials billing to an MSP model, one of the first key financial metrics that must be tracked is profitability per agreement. Basic as it may seem, there are several factors that must be taken into consideration in order to avoid under or overvaluing an agreement (impacting profit, margin, and cost). Specifically, you must look at the impact of effective rate, product bundling, and disparity in value.
The False Security of Effective Rate
In case it is new to you, effective rate is the total amount invoiced divided by the number of hours against the contract and defines what your billing rate would be if you were billing hourly, instead of under contract. While it ignores a number of important dependencies in and of itself, it is a good place to start understanding profitability. For example, one of our high profile clients is a nationwide restaurant chain that we provide managed firewalls for each location to. As we worked together, we couldn’t shake the sneaking suspicion that the relationship was not profitable - despite what our basic metrics told us. So, we began a deeper dive that lead to the realization that our senior engineers had ‘dibs’ on servicing this client. If an issue came up, our most expensive engineers would dispatch onsite, perform a minor service, and accept a gracious offer to a world-class steak lunch. While our most highly compensated resources provided exceptional service, interns could have easily performed it just as well! It can certainly be argued that the senior engineers could perform the work much faster, it wasn’t nearly fast enough. When I looked at the effective rate, it hid the true cost of these engineers working the tickets!
The 5 Most Critical MSP Metrics
connectsmart.com 3.
The Bundling Dilemma
Another MSP trend impacting the true profitability of an agreement is the bun-dling of many different items into a single contract. HaaS (Hardware as a Service), BDRs (Backup and Disaster Recovery Devices), SPLA (Service Provider License Agreement) licensing, SPAM services etc. are often now part of a single service agreement. Almost all of our core agree-ments have some elements of hard costs associated with them. If we do not take those costs out of the equation when looking at profitability we do not have an accurate picture of whether we are making money or losing money.
Missing the Margin Boat
The other key issue impacting agreement profitability is disparity in total contract values. Often when determining agree-ment profitability, people will look at all agreements in total. While simpler, it hides the details within each agreement and skews the results. We have agreements as small as $1,000 per month and as large as $60,000 plus per month.
If we are overpriced, not performing enough service, or not providing enough value on one single contract, we risk losing the customer on renewal. On the other hand, if we are servicing a customer that should be re-priced or let go, we are losing money, losing capacity, and jeopardizing other customer relationships. These things are never seen when looking at agree-ments as a whole. You must look at each agreement on its own to understand your true profitability, but monitoring this can be a time consuming endeavor.
The 5 Most Critical MSP Metrics
4.
The Power of LLGM
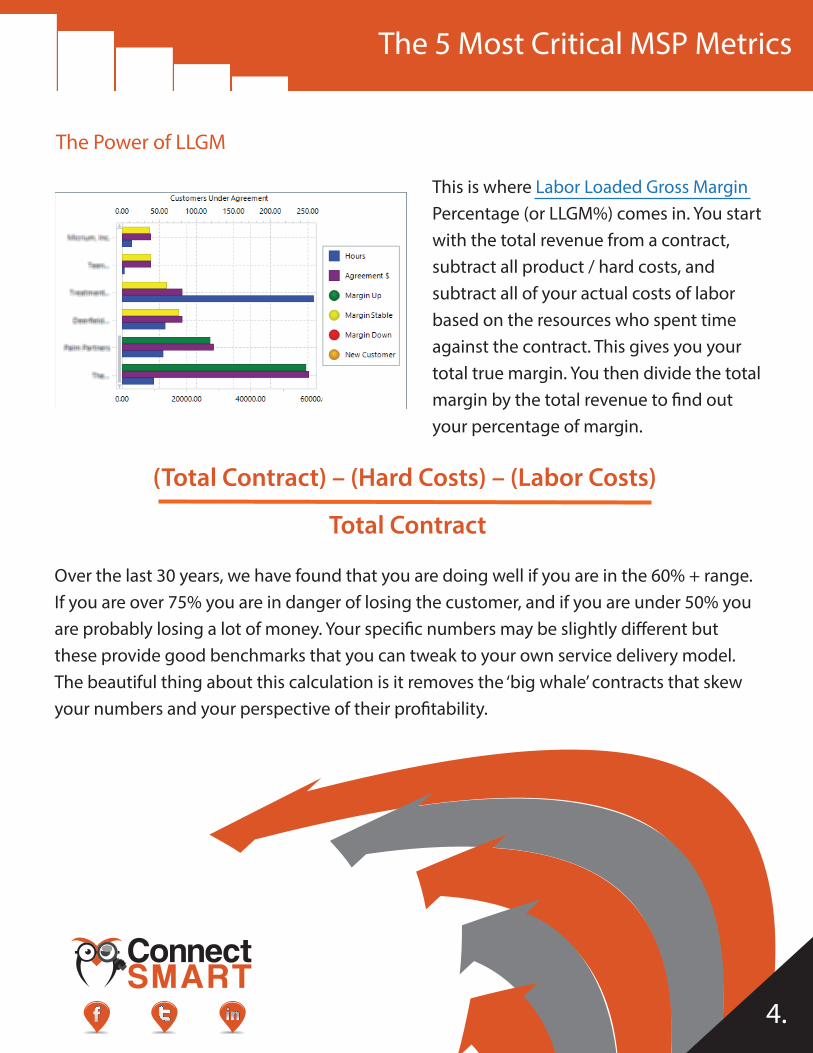
This is where Labor Loaded Gross Margin Percentage (or LLGM%) comes in. You start with the total revenue from a contract, subtract all product / hard costs, and subtract all of your actual costs of labor based on the resources who spent time against the contract. This gives you your total true margin. You then divide the total margin by the total revenue to find out your percentage of margin.
(Total Contract) – (Hard Costs) – (Labor Costs) Total Contract
Over the last 30 years, we have found that you are doing well if you are in the 60% + range. If you are over 75% you are in danger of losing the customer, and if you are under 50% you are probably losing a lot of money. Your specific numbers may be slightly different but these provide good benchmarks that you can tweak to your own service delivery model. The beautiful thing about this calculation is it removes the ‘big whale’ contracts that skew your numbers and your perspective of their profitability.
The 5 Most Critical MSP Metrics
Customer Efficiency Score
Think LLGM is scary? We did too! Back in 2006/7, we were looking for ways to incentivize our engineers based on the profitability of contracts. During this time, we continually faced the realization that engineers are not finance people and would often draw incorrect conclusions when it came to profitability. If they saw that we were at an average effective rate of $200+ per contract, their assumption was that we paid them $25-$40 per hour and the owners gladly took home the rest of the money at their expense. This issue was especially exacerbated on contracts that included hosting or other significant hard costs. This was not good for morale and had to be immediately addressed. We tried to focus them initially on LLGM%, but their eyes glazed over! We had to find a better way to communicate the true profitability of contracts and properly incentivize them.
It was through this dilemma that we created a customer efficiency score or CES. We knew that our target of LLGM% was 70% in a perfect world. Yet in grade school we all learned a perfect score was 100% -- so we simply added an offset of 30 to the “perfect” 70% LLGM to create a customer efficiency score of 100%. We created a CES gadget in ConnectSMART and selected seven BETA customers to monitor during the initial quarter. We presented the CES model to our engineers and discussed how increased efficiency at each of these customers would raise the average score. We gave $50 to each engineer for every half of a percentage point the average CES increased. The result – we raised our CES over 5 percent during the first quarter. We gladly paid each eligible engineer an additional $540 ($3,300 total) and realized a return of $11,200. Best of all, those same efficiencies are still in place six years later!
connectsmart.com 5.
The Balancing Act
All key metrics have a yin and yang - for every action there is an equal and opposite reaction. What does this mean for LLGM (or any profitability measure)? The easiest way to misrepresent the profitability of any contract is to not work on it, or misallocate the work. That is where balancing metrics like utilization by member and customer satisfaction come in.
The 5 Most Critical MSP Metrics
6.
2. Utilization by Member
For almost every service organization, time keeping is like kryptonite. Every service manager and owner knows how important it is (for everyone else) to track their time in real-time. Without real-time time entry it is impossible to have accurate reporting for SLA metrics or accurate descriptions for work performed, among a host of other issues. It is one thing to know the problem, how about the solution?
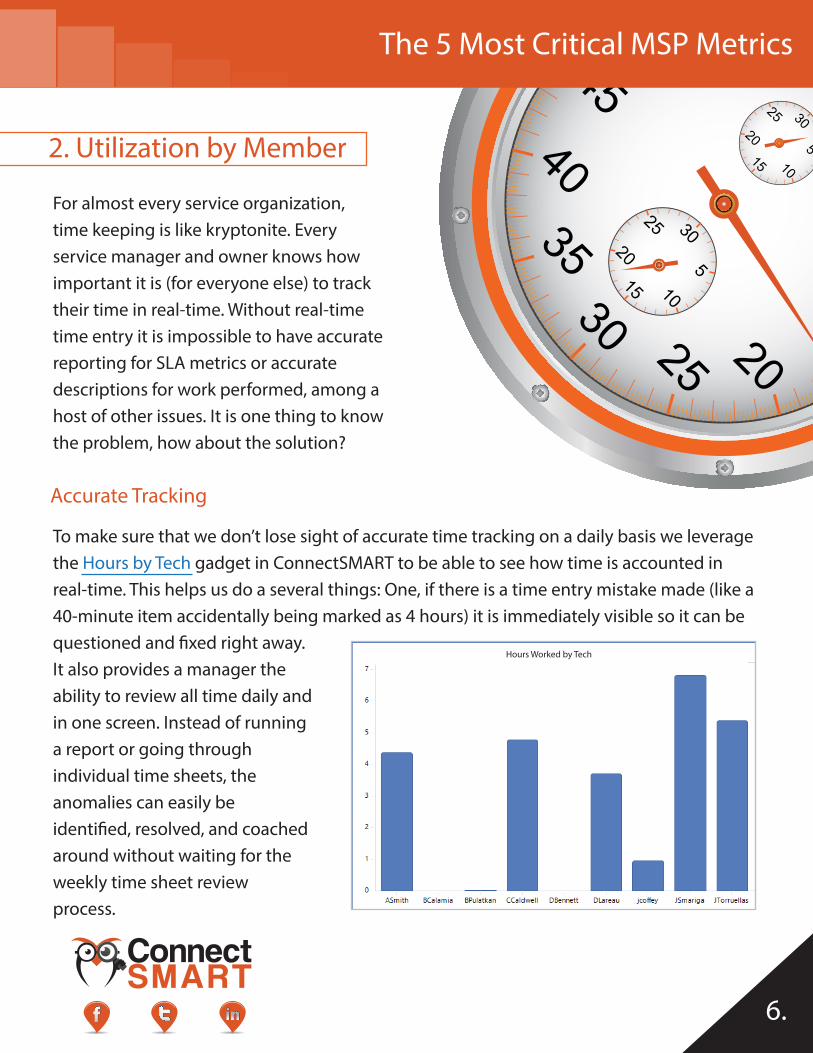
Accurate Tracking
To make sure that we don’t lose sight of accurate time tracking on a daily basis we leverage the Hours by Tech gadget in ConnectSMART to be able to see how time is accounted in real-time. This helps us do a several things: One, if there is a time entry mistake made (like a 40-minute item accidentally being marked as 4 hours) it is immediately visible so it can be questioned and fixed right away. It also provides a manager the ability to review all time daily and in one screen. Instead of running a report or going through individual time sheets, the anomalies can easily be identified, resolved, and coached around without waiting for the weekly time sheet review process.
The 5 Most Critical MSP Metrics
Hours Worked by Tech
connectsmart.com 7.
The Billable Time Veil
We began measuring utilization like most everyone else. While the tracking of billable time (defined as time that is either truly billed or would be billed against a prepaid contract) is important, we realized that it definitely was not the answer in itself. Especially since we have different goals for different roles. I have a minimum expectation of 80% for helpdesk technicians, 76.5% for my engineers, 70% for a project engineer, 60% for a VCIO, 50% for a service manager, and displaying each one’s utilization requires either different scales, multiple charts, or ignoring certain people. We wanted everyone to be held accountable to his or her own goals. Everyone always seems busy, but we needed to hold everyone accountable at the end of each week.
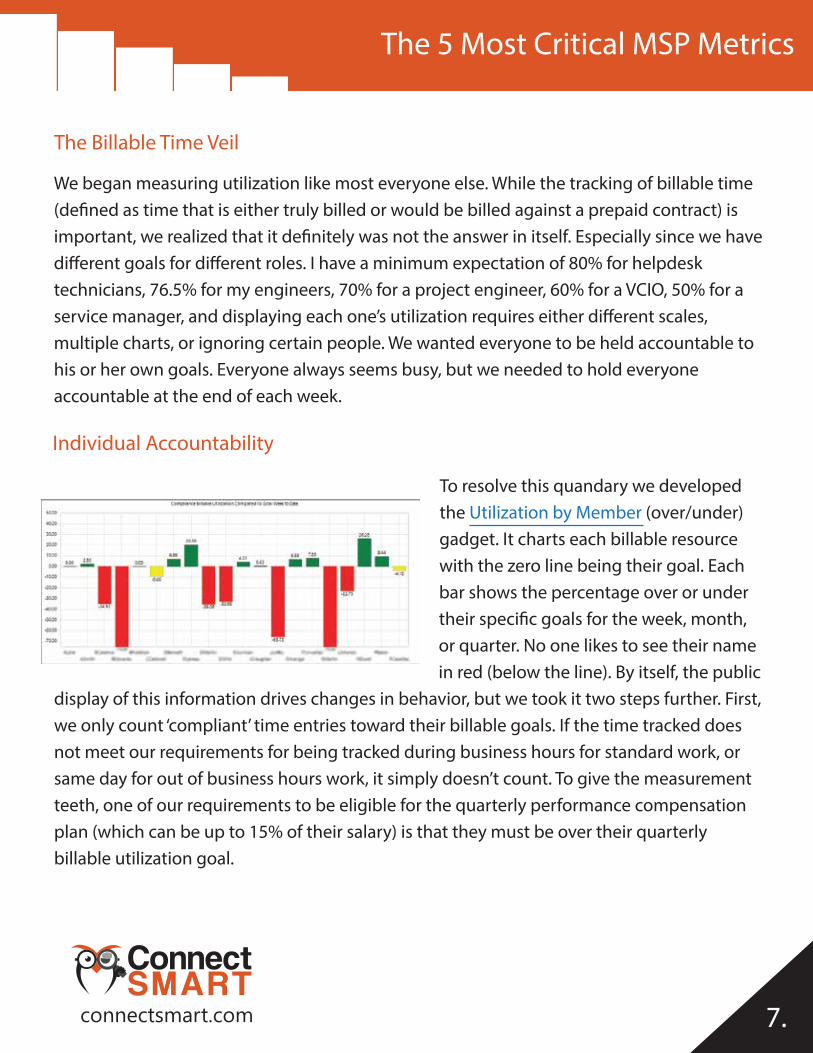
Individual Accountability
To resolve this quandary we developed the Utilization by Member (over/under) gadget. It charts each billable resource with the zero line being their goal. Each bar shows the percentage over or under their specific goals for the week, month, or quarter. No one likes to see their name in red (below the line). By itself, the public
display of this information drives changes in behavior, but we took it two steps further. First, we only count ‘compliant’ time entries toward their billable goals. If the time tracked does not meet our requirements for being tracked during business hours for standard work, or same day for out of business hours work, it simply doesn’t count. To give the measurement teeth, one of our requirements to be eligible for the quarterly performance compensation plan (which can be up to 15% of their salary) is that they must be over their quarterly billable utilization goal.
The 5 Most Critical MSP Metrics

8.
In holding each individual accountable for their own utilization we found that engineers who might be eligible for three weeks of vacation would actually plan their time off to not impact their eligibility for the bonus pool. Not only did this allow us to maintain consistent levels of customer service, it avoided the internal headache of managing long stretches of PTO. Tracking utilization in this manner ensures that our data is accurate, our SLA’s are met, and our customer satisfaction and profitability are maximized.
3. Actual Customer Satisfaction
Customer satisfaction is the key currency in any service provider business. It impacts the top and bottom line as well as your ability to onboard new customers. Surveys have traditionally been the primary method used to track satisfaction and there are many different survey methodologies and even more written on how best to deploy them. Things like Net Promoter Score and social listening can play a part, but the power of direct customer feedback should always be an integral factor. While getting that feedback is extremely powerful, the initial hurdle is always getting a customer to fill out the survey in the first place!
Integrate Your Responses
Facing this issue ourselves, we began to experiment with alternative processes to increase customer feedback and scoring. We started by modifying the text of our completed ticket notification in a way that takes customers through the survey in order to close the ticket (thanks JoomConnect for the great idea!).
The 5 Most Critical MSP Metrics
connectsmart.com 9.
Promote Visibility
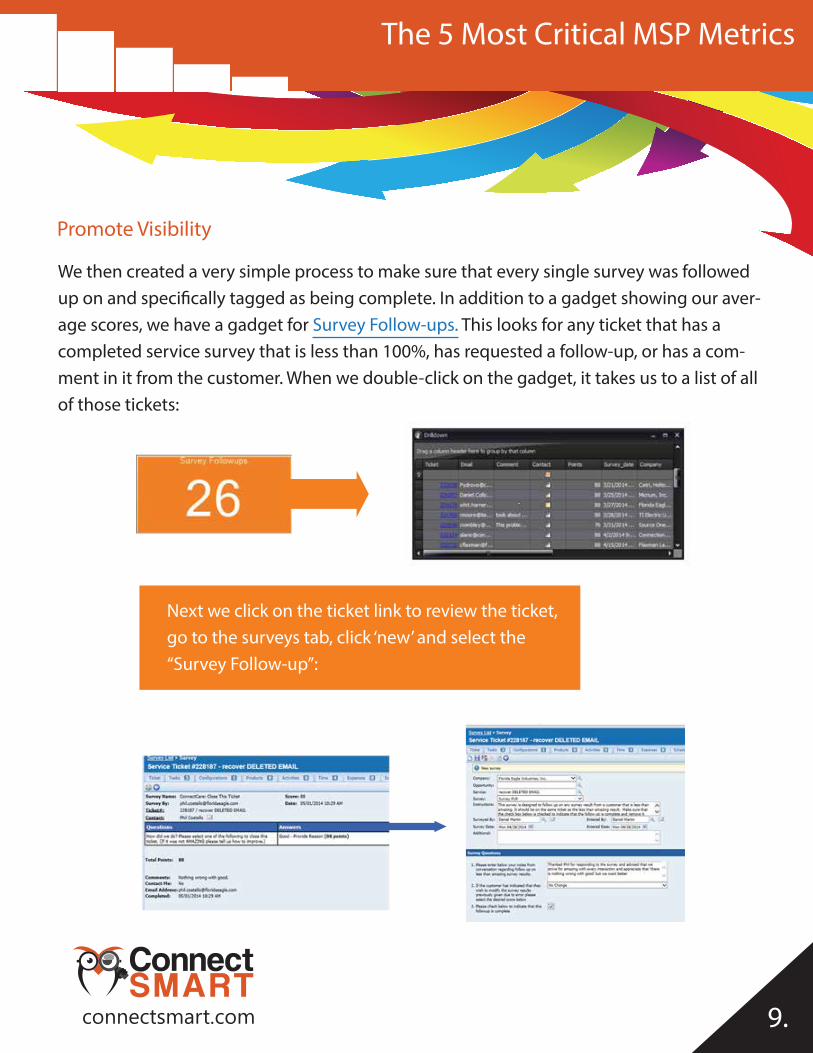
We then created a very simple process to make sure that every single survey was followed up on and specifically tagged as being complete. In addition to a gadget showing our aver-age scores, we have a gadget for Survey Follow-ups. This looks for any ticket that has a completed service survey that is less than 100%, has requested a follow-up, or has a com-ment in it from the customer. When we double-click on the gadget, it takes us to a list of all of those tickets:
Next we click on the ticket link to review the ticket, go to the surveys tab, click ‘new’ and select the “Survey Follow-up”:
The 5 Most Critical MSP Metrics
10.
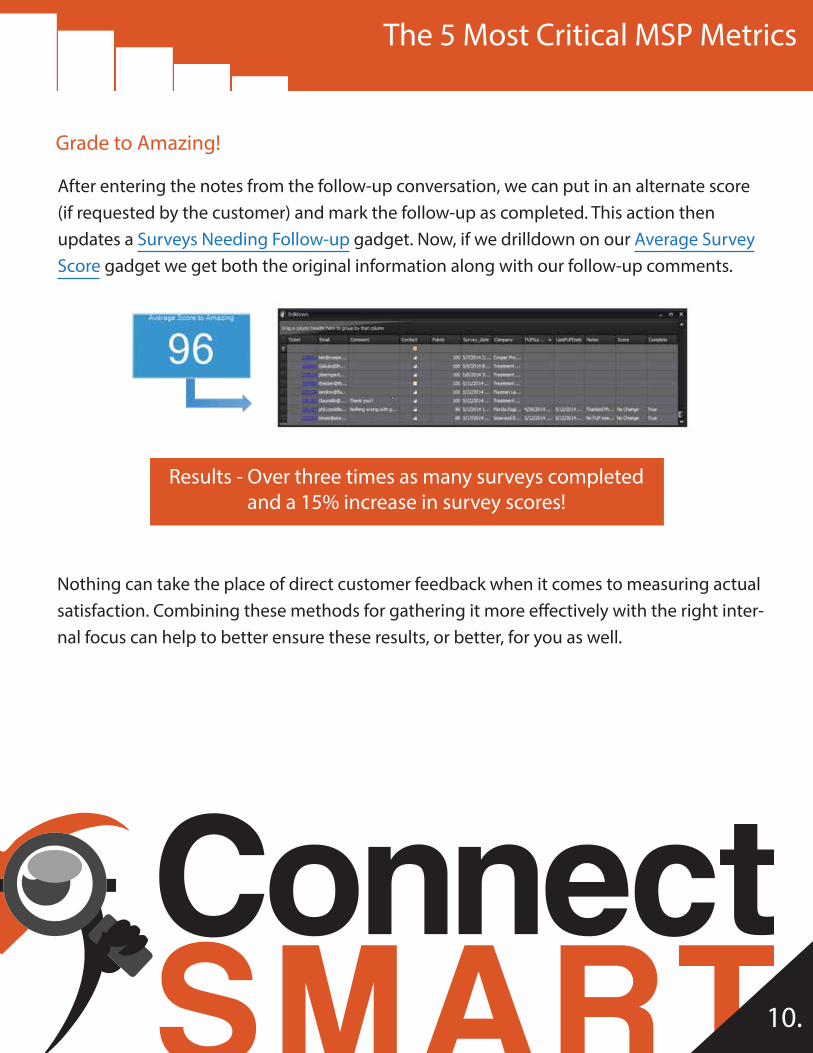
Grade to Amazing!
After entering the notes from the follow-up conversation, we can put in an alternate score (if requested by the customer) and mark the follow-up as completed. This action then updates a Surveys Needing Follow-up gadget. Now, if we drilldown on our Average Survey Score gadget we get both the original information along with our follow-up comments.
Results - Over three times as many surveys completed and a 15% increase in survey scores!
Nothing can take the place of direct customer feedback when it comes to measuring actual satisfaction. Combining these methods for gathering it more effectively with the right inter-nal focus can help to better ensure these results, or better, for you as well.
The 5 Most Critical MSP Metrics
10.
4. SLA Compliance If Customer Satisfaction is the new currency for service providers, SLA compliance is the money manager that drives maximum return. Every claim you make while selling a product or service must be validated. This validation can come from customers, 3rd parties, or things like guarantees. As a service provider, SLA’s are your guarantees to customers that they can trust you and depend on you. Contracts can be breached based on missed SLA’s, and often times, you have to pay customers for SLA misses which impacts margin, profit, and churn. With so much on the line, you can’t afford mistakes in the real-time tracking and execution of your SLA’s.
Like the other metrics discussed thus far, there is more than meets the eye when it comes to accurately tracking SLA compliance. SLA’s are in fact one of the more difficult metrics to accurately present, and there are actually two keys to SLA Management - Setting it up accurately in the first place and making them visible and trackable in real time.
Build a Solid Foundation
Setting SLA’s up accurately from the beginning relies heavily on your understanding of internal processes and procedures that translate into
what constitutes a response versus a resplan (excludes time against the ticket for things
like holds, or waiting for client responses).
The 5 Most Critical MSP Metrics
11.
Coordinating your customer’s experience with the implementation of your tracking system or PSA is usually the hardest part. If a customer opens a ticket and receives an email that says “We have opened a ticket for you and here is your ticket number”, does this qualify as a response? Before you answer too quickly, it depends on what expectations you have created for your customers and what is agreed to in your contract. For our organization, an email is only a response if it is caused by human intervention. Even so, it isn’t the most important metric that we measure in our SLA management. A three to five minute response time looks really good in a marketing document, but what would your customer say is your actual response time? We have found that time to customer interaction is probably the most critical element of the SLA. The Resplan time is what we refer to as the “Customers Felt Response”, or when there is engagement between the customer and someone who can resolve their problem. As long as we continually communicate with our customer and keep them informed of progress, the resolution time isn’t typically as important as time to customer interaction and Resplan time.
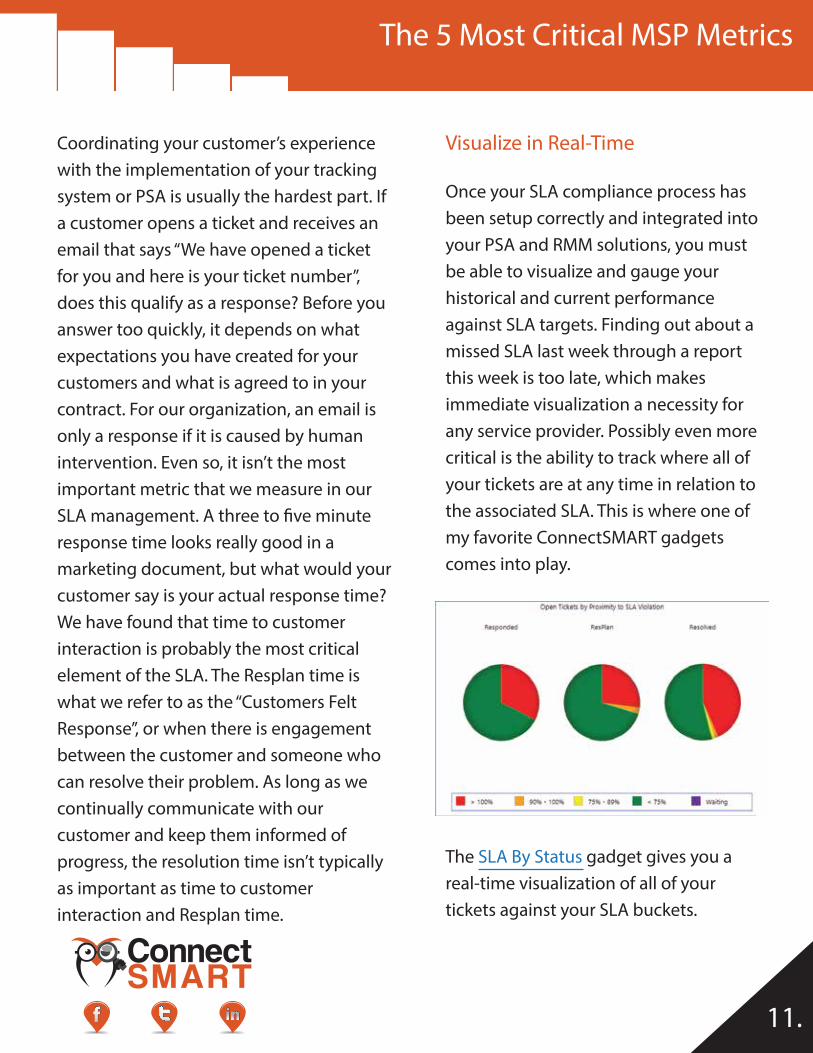
Once your SLA compliance process has been setup correctly and integrated into your PSA and RMM solutions, you must be able to visualize and gauge your historical and current performance against SLA targets. Finding out about a missed SLA last week through a report this week is too late, which makes immediate visualization a necessity for any service provider. Possibly even more critical is the ability to track where all of your tickets are at any time in relation to the associated SLA. This is where one of my favorite ConnectSMART gadgets comes into play.
The SLA By Status gadget gives you a real-time visualization of all of your tickets against your SLA buckets.
Visualize in Real-Time
The 5 Most Critical MSP Metrics
connectsmart.com 12.
Since the first two SLA buckets, Response and Resplan Time, do not typically require an engineer there is no excuse for ever missing them. It doesn’t really matter how many tickets have not been responded to or hit resplan as long as the ticket is “in the green”. Having your entire team able to see this visually at any time means they can grab the tickets that are in danger (in the orange or yellow areas) to prevent them from turning red.
This level of visibility of SLA compliance across all tickets gives you the tools you need to never miss an SLA again and ensure your customers are satisfied (or even Amazed!).
5. Exception Management
A key principle behind ConnectSMART’s methodology is not just having visibility to important metrics but managing exceptions as they occur. An exception is a crack in your path to success where things get lost – including profitability! An easy example of an exception would be tickets not responded.
Any ticket that hasn’t been responded to can be an indicator of a future problem if not managed correctly and can end up negatively affecting your average response time. There are many exceptions in each of our businesses, and while not everyone faces the same ones, here are a few of my favorites:
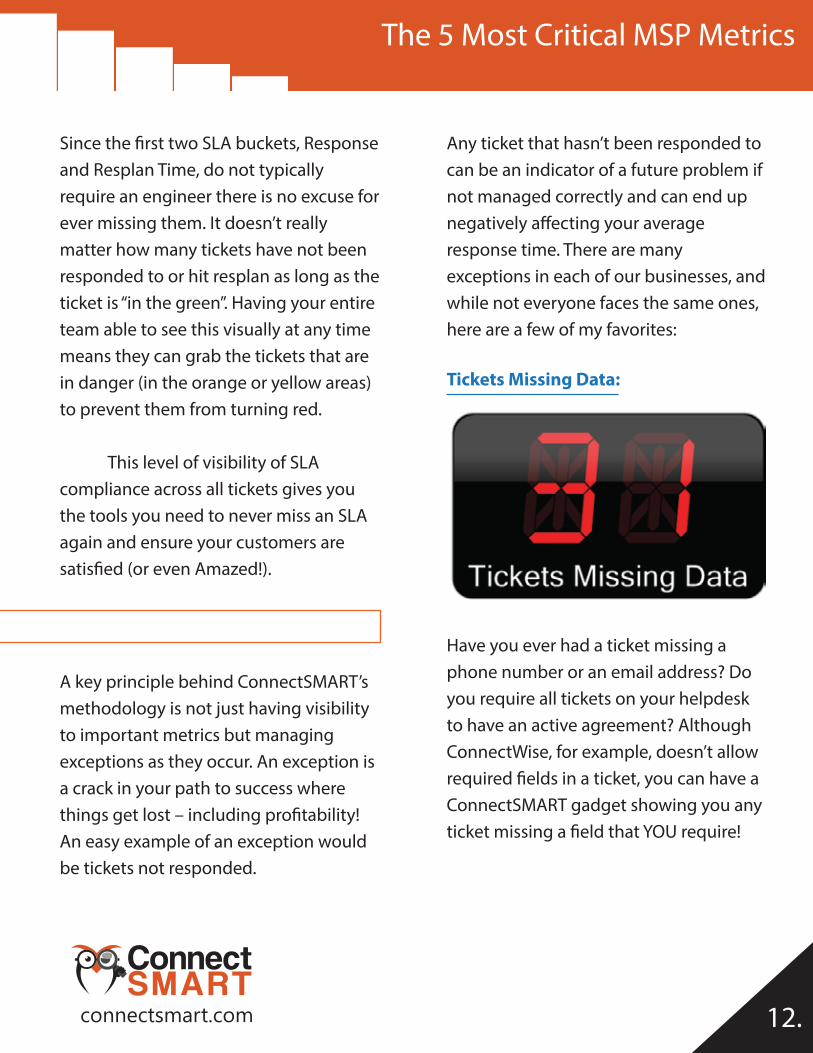
Tickets Missing Data:
Have you ever had a ticket missing a phone number or an email address? Do you require all tickets on your helpdesk to have an active agreement? Although ConnectWise, for example, doesn’t allow required fields in a ticket, you can have a ConnectSMART gadget showing you any ticket missing a field that YOU require!
The 5 Most Critical MSP Metrics
13.
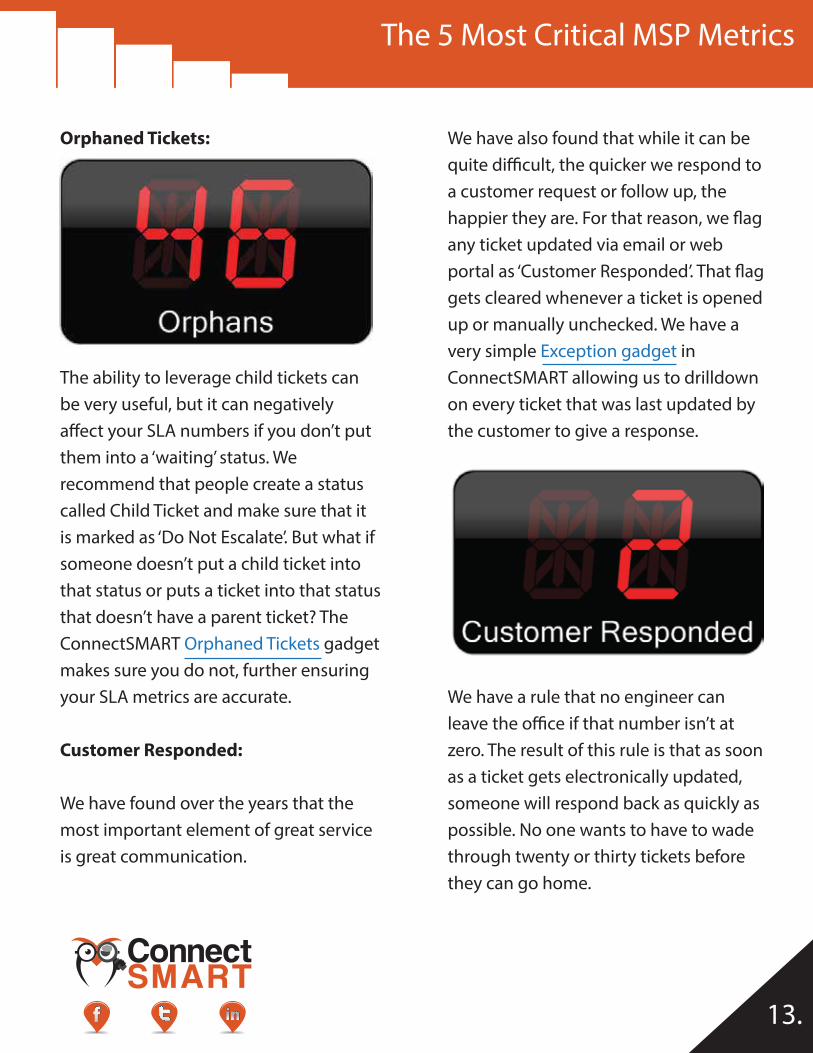
Orphaned Tickets:
The ability to leverage child tickets can be very useful, but it can negatively affect your SLA numbers if you don’t put them into a ‘waiting’ status. We recommend that people create a status called Child Ticket and make sure that it is marked as ‘Do Not Escalate’. But what if someone doesn’t put a child ticket into that status or puts a ticket into that status that doesn’t have a parent ticket? The ConnectSMART Orphaned Tickets gadget makes sure you do not, further ensuring your SLA metrics are accurate.
Customer Responded:
We have found over the years that the most important element of great service is great communication.
We have also found that while it can be quite difficult, the quicker we respond to a customer request or follow up, the happier they are. For that reason, we flag any ticket updated via email or web portal as ‘Customer Responded’. That flag gets cleared whenever a ticket is opened up or manually unchecked. We have a very simple Exception gadget in ConnectSMART allowing us to drilldown on every ticket that was last updated by the customer to give a response.
We have a rule that no engineer can leave the office if that number isn’t at zero. The result of this rule is that as soon as a ticket gets electronically updated, someone will respond back as quickly as possible. No one wants to have to wade through twenty or thirty tickets before they can go home.
The 5 Most Critical MSP Metrics

connectsmart.com 14.
Leverage Your Awakening
When we first implemented this process it revealed several critical things. First, there were a lot of things slipping through this particular crack. Whether it was lack of response to child tickets that were never seen (there is no resource to send an email to), closed tickets that didn’t re-open, or tickets that were too old, they all could be explained but lead to dissatisfaction none-the-less. Second, as we increased our speed to electronic responses, many customers increased their electronic communication. This immediately shifted about 20% of the ticket load from voice calls to electronic and we found that customers were calling less because they could get their answer the way they wanted - which was electronically.
The 5 Most Critical MSP Metrics
15.
Conclusion
While much has been written regarding the metrics that drive a successful service provider, most of it focuses on individual metrics and leaves out a number of critical factors relating to dependencies and the combined process. When overlooked, you risk having what you believe to be accurate metric data actually masking problems and giving you a false sense of confidence. After 30 years of leveraging these technologies and realizing these problems first hand, we hope this eBook is just the start to us sharing what we’ve learned with you so that you can jumpstart success and bypass these core metric issues altogether.
If you are stressed out by not having a locked down corporate score card that aligns all employees to success each day, don’t worry! Sign up for your FREE TRIAL of ConnectSMART and you can be well on your way in only 30 minutes! Questions or comments? We are always available to help you at (954) 624-9566.
The 5 Most Critical MSP Metrics
About Dan Martin - Vice President and Owner – Connections for Business�Vice President of ConnectSMARTFor the past 16 years, Dan Martin has served as Vice President of Connections for Business, a leading MSP in South Florida since 1976. In this role, he is responsible for all aspects of the business as an integral part of the executive team. Dan’s efforts ensure that clients always have the best possible, most proactive solutions available and that their systems deliver in the most efficient manner possible. As VP of ConnectSMART, Dan leverages this first hand MSP experience to actively grow the company and ensure the product roadmap always leads the market and delivers real-time visibility to service providers around the globe. A trusted advisor to many in the industry, Dan also speaks at numerous IT conferences nationwide.
About Connections for BusinessFor over 30 years, Connections for Business has delivered affordable, enterprise-class IT service and support that starts with alignment to your company’s growth, not technology, and lets you to focus on growing your business without investing time or worry into IT. We extend the leadership team at more than 2,000 companies in South Florida, ensuring they leverage technology as a competitive advantage in their markets and always have scalable, fast, and transparent IT driving their business growth without the traditional cost, concern, or overhead.
About ConnectSMARTOver 1,200 MSP's and IT Service Providers trust ConnectSMART to gain accountability, efficiency, and profitability faster by making their entire data set actionable for the first time via a real time dashboard and KPI based platform that continually provides a live, complete feed of your company's health, efficiency, and delivery and aligns every employee to business success every day.
For the past 16 years, Dan Martin has served as Vice President of Connections for Business, a leading MSP in South Florida since 1976. In this role, he is responsible for all aspects of the business as an integral part of the executive team. Dan’s efforts ensure that clients always have the best possible, most proactive solutions available and that their systems deliver in the most efficient manner possible. As VP of ConnectSMART, Dan leverages this first hand MSP experience to actively grow the company and ensure the product roadmap always leads the market and delivers real-time visibility to service providers around the globe. A trusted advisor to many in the industry, Dan also speaks at numerous IT conferences nationwide.
The 5 Most Critical MSP Metrics
connectsmart.com


![Beyond Reach: The Critical Facebook Metrics You Should Measured [webinar deck]](https://static.documents.pub/doc/80x56/554ee70db4c905911d8b5037/beyond-reach-the-critical-facebook-metrics-you-should-measured-webinar-deck.jpg)


