38
ENERGY DEMOCRACY BEYOND UTILITY 2.0 TO John Farrell February 5, 2015
| Date post: | 14-Jul-2015 |
| Category: |
Presentations & Public Speaking |
| Upload: | john-farrell |
| View: | 755 times |
| Download: | 1 times |
E N E R G Y D E M O C R A C YB E Y O N D U T I L I T Y 2 . 0 T O
John Farrell February 5, 2015

T H E P R E L U D E

Per capita electricity useAverage annual retail electricity pricesInterstate transmission spendingWind and solar power capacity
c1900 199019801970 2000 2010
Sources: World Bank, EIA, US Census, SEIA, LBNL
“GOLDEN AGE”
• Regulated monopolies • Profits from sales • Profits from new
power plants • “bigger is better”
SHOCK & COMPETITION STABILITY DEREGULATION
• PURPA allows non-‐utility generation
• Prices rise • Sales slow • Competition starts
• Prices fall • Demand rises
• Independent producers rise, as do interstate transactions
• Feds open wholesale market
• States adopt renewable standards and net metering
• Some states introduce competition for generation and retail sales
• Wind+Solar go exponential
• Demand flattens
TRANSITION
• States offer “decoupling”
• States adopt energy efficiency standards
RULE CHANGES
MARKET CHANGES
T H E U . S . E L E C T R I C I T Y T I M E L I N E
Today’s turmoil isn’t the first change in the U.S.
electricity system

Per capita electricity useAverage annual retail electricity pricesInterstate transmission spendingWind and solar power capacity
c1900 199019801970 2000 2010
Sources: World Bank, EIA, US Census, SEIA, LBNL
• Regulated monopolies • Profits from sales • Profits from new
power plants • “bigger is better”
SHOCK & COMPETITION STABILITY DEREGULATION
• PURPA allows non-‐utility generation
• Prices rise • Sales slow • Competition starts
• Prices fall • Demand rises
• Independent producers rise, as do interstate transactions
• Feds open wholesale market
• States adopt renewable standards and net metering
• Some states introduce competition for generation and retail sales
• Wind+Solar go exponential
• Demand flattens
TRANSITION
• States offer “decoupling”
• States adopt energy efficiency standards
RULE CHANGES
MARKET CHANGES
“GOLDEN AGE”
T H E U . S . E L E C T R I C I T Y T I M E L I N E

Per capita electricity useAverage annual retail electricity pricesInterstate transmission spendingWind and solar power capacity
1980 2000 2010
Sources: World Bank, EIA, US Census, SEIA, LBNL
“GOLDEN AGE”
• Regulated monopolies • Profits from sales • Profits from new
power plants • “bigger is better”
SHOCK & COMPETITION STABILITY DEREGULATION
• PURPA allows non-‐utility generation
• Prices rise • Sales slow • Competition starts
• Prices fall • Demand rises
• Independent producers rise, as do interstate transactions
• Feds open wholesale market
• States adopt renewable standards and net metering
• Some states introduce competition for generation and retail sales
• Wind+Solar go exponential
• Demand flattens
TRANSITION
• States offer “decoupling”
• States adopt energy efficiency standards
RULE CHANGES
MARKET CHANGES
T H E U . S . E L E C T R I C I T Y T I M E L I N E
c1900 19901970

Per capita electricity useAverage annual retail electricity pricesInterstate transmission spendingWind and solar power capacity
c1900 19801970 2000 2010
Sources: World Bank, EIA, US Census, SEIA, LBNL
“GOLDEN AGE”
• Regulated monopolies • Profits from sales • Profits from new
power plants • “bigger is better”
SHOCK & COMPETITION STABILITY DEREGULATION
• PURPA allows non-‐utility generation
• Prices rise • Sales slow • Competition starts
• Prices fall • Demand rises
• Independent producers rise, as do interstate transactions
• Feds open wholesale market
• States adopt renewable standards and net metering
• Some states introduce competition for generation and retail sales
• Wind+Solar go exponential
• Demand flattens
TRANSITION
• States offer “decoupling”
• States adopt energy efficiency standards
RULE CHANGES
MARKET CHANGES
T H E U . S . E L E C T R I C I T Y T I M E L I N E
1990

T H E U . S . E L E C T R I C I T Y T I M E L I N E
Per capita electricity useAverage annual retail electricity pricesInterstate transmission spendingWind and solar power capacity
c1900 19901970 2000 2010
Sources: World Bank, EIA, US Census, SEIA, LBNL
“GOLDEN AGE”
• Regulated monopolies • Profits from sales • Profits from new
power plants • “bigger is better”
SHOCK & COMPETITION STABILITY DEREGULATION
• PURPA allows non-‐utility generation
• Prices rise • Sales slow • Competition starts
• Prices fall • Demand rises
• Independent producers rise, as do interstate transactions
• Feds open wholesale market
• States adopt renewable standards and net metering
• Some states introduce competition for generation and retail sales
• Wind+Solar go exponential
• Demand flattens
TRANSITION
• States offer “decoupling”
• States adopt energy efficiency standards
RULE CHANGES
MARKET CHANGES
1980
T H E P R E S E N T ( S T R E S S E S )

3.2
3.3
3.4
3.5
3.6
3.7
3.8
2000 2001 2002 2003 2004 2005 2006 2007 2008 2009 2010 2011 2012 2013
P E A K
S TA G N A N T R E TA I L S A L E S
trillion kilowatt-hours

R I S I N G P E A K D E M A N D
75%
100%
125%
2002 2003 2004 2005 2006 2007 2008 2009 2010 2011 2012
Eastern Interconnection
ERCOT (Texas)
Western Interconnection
CombinedSource: EIA, 2014
Summer Peak Demand by Grid Balancing Regions (2002 = 100%)

$0
$3,000
$6,000
$9,000
$12,000
1982 1985 1988 1991 1994 1997 2000 2003 2006 2009 2012
Wind
SolarSource: Lawrence Berkeley Labs
FA L L I N G R E N E W A B L E E N E R G Y C O S T S
U.S. Installed Cost of Wind and Solar Power ($/kilowatt)

R I S I N G R E N E W A B L E E N E R G Y C A PA C I T Y
0
10,000
20,000
30,000
40,000
50,000
60,000
70,000
2003 2004 2005 2006 2007 2008 2009 2010 2011 2012 2013
Wind
Solar
Geothermal
Installed Wind and Solar Power Capacity (Megawatts)
Source: SEIA, Lawrence Berkeley Labs

R I S I N G R E N E W A B L E E N E R G Y S H A R EU.S. Power Plant Capacity Additions, 2003 through 1st Half of 2014
Source: EIA
0%
25%
50%
75%
100%
2003 2004 2005 2006 2007 2008 2009 2010 2011 2012 2013 2014H
Fossil fuel Renewable

R I S I N G R E N E W A B L E E N E R G Y ( A N D D G ) S H A R EU.S. Power Plant Capacity Additions, 2003 through 1st Half of 2014
Source: EIA
0%
25%
50%
75%
100%
2003 2004 2005 2006 2007 2008 2009 2010 2011 2012 2013 2014H
21.5%19.2%
5.8%3.1%2.3%
0.6%
18.3%12.4%
6.1%6.2%3.8%2.3%
1.8%
1.3%1.1%
0.5%0.3%0.1%
12.7%
6.7%56.4%
37.1%31.9%
60.9%52.8%
53%
31.7%
15.5%
3.3%3.1%
43.5%
44.5%
28%
44.3%
37.4%
23.3%28.8%40.8%
57%
75%
90.4%92.9%
9.8%4.6%
16.3%
5.9%3.7%2.2%
Coal Gas Wind Small solar Big solar
Tota
l GW
Ad
ded
0
15
30
45
60
Total GW added
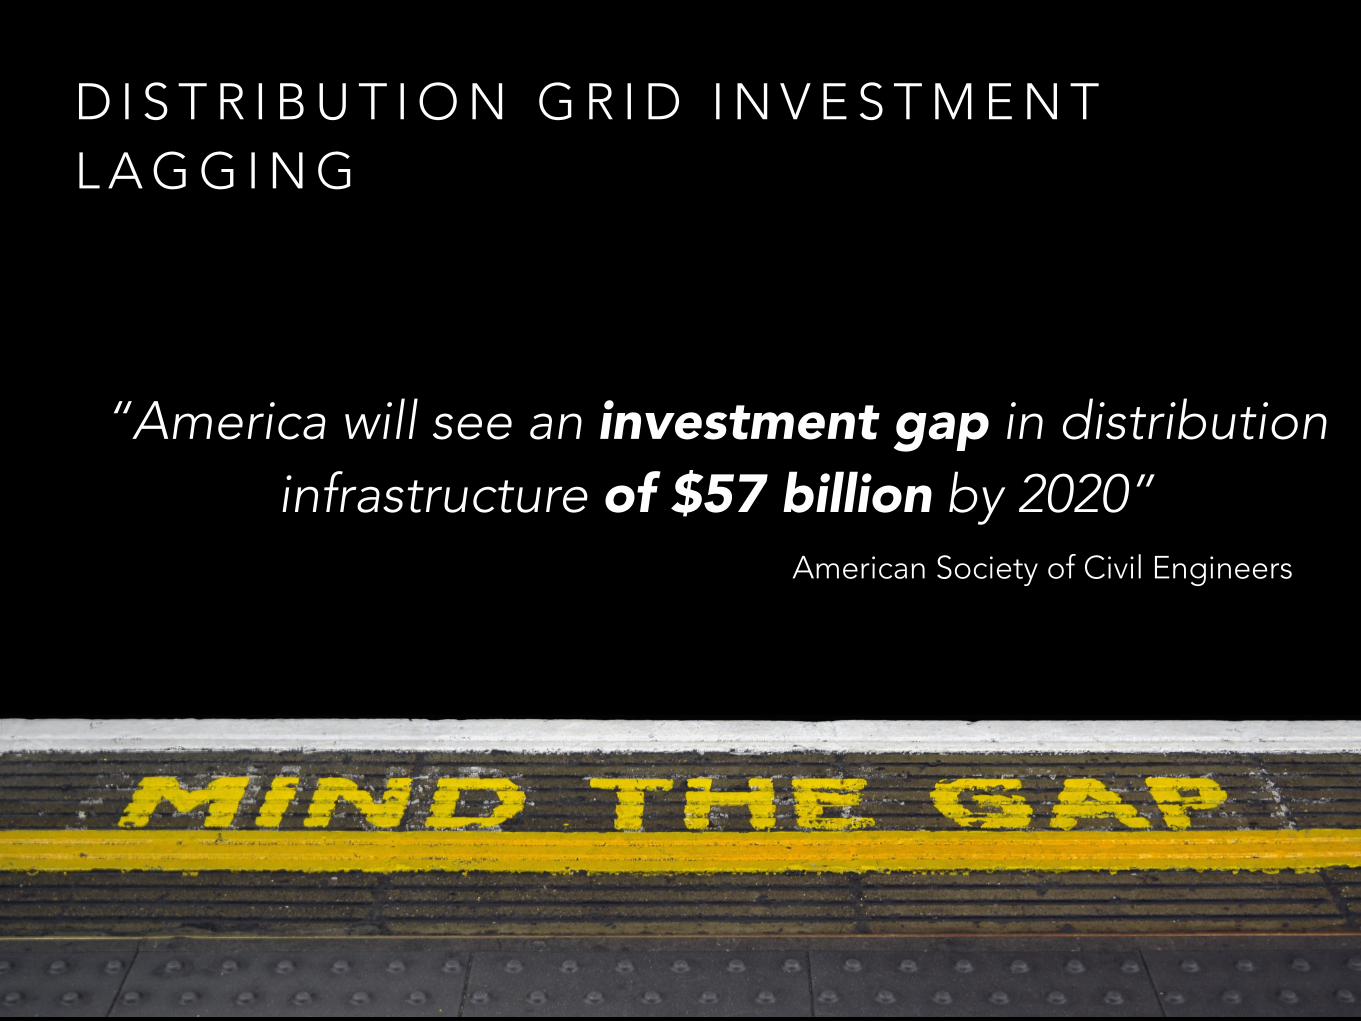
D I S T R I B U T I O N G R I D I N V E S T M E N T L A G G I N G
American Society of Civil Engineers
“America will see an investment gap in distribution infrastructure of $57 billion by 2020”
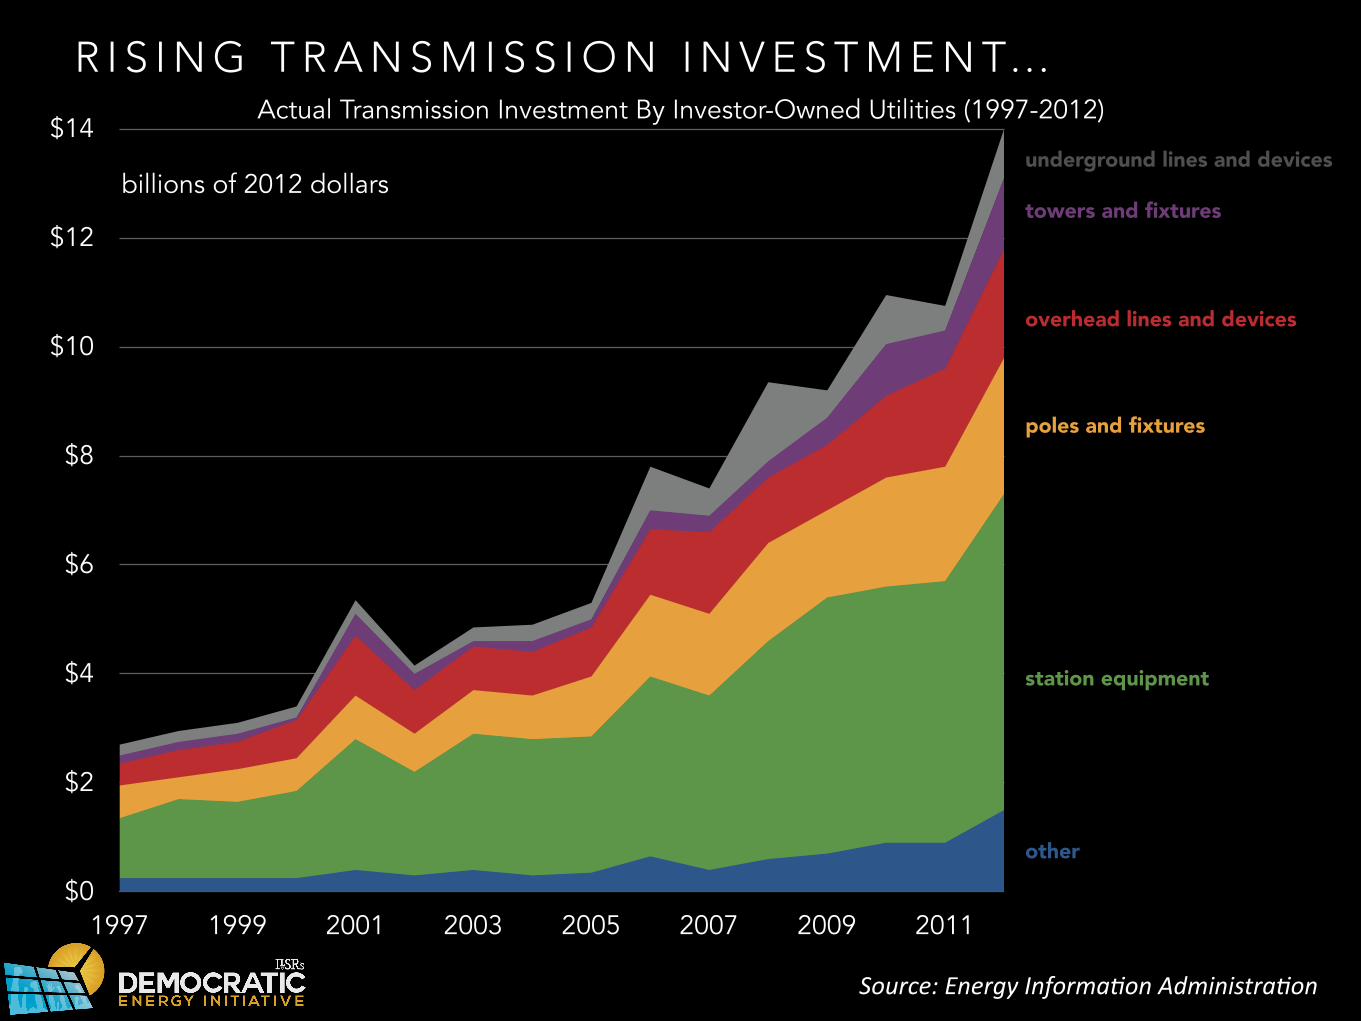
R I S I N G T R A N S M I S S I O N I N V E S T M E N T…
station equipment
$0
$2
$4
$6
$8
$10
$12
$14
1997 1999 2001 2003 2005 2007 2009 2011
billions of 2012 dollars
Source: Energy InformaCon AdministraCon
underground lines and devices
towers and fixtures
overhead lines and devices
poles and fixtures
other
Actual Transmission Investment By Investor-Owned Utilities (1997-2012)

T H E P R E S E N T ( R U L E S )
N O N - W I R E S P L A N N I N G
Federal process requires non-utility intervention

V E R M O N T E N E R G Y E F F I C I E N C Y P R O G R A M S AV I N G S
Ener
gy E
ffici
ency
Ben
efits
, 201
0 ($
/MW
h)
$0
$20
$40
$60
$80
$100
$120
$140
$160
$180
$200
Avoided energy,
capacity and transmission
Avoided distribuIon, line losses, reserves
Risk benefits, other adders, water
O&M, other fuel savings, low-‐income adders
Greenhouse gas
emissions
State-level criteria NOT considered
by federal regulators
Adapted from: Public Utilities Fortnightly
http://www.fortnightly.com/fortnightly/2013/04/looking-beyond-transmission

L A R G E V. S M A L L P R I S O N E R ’ S D I L E M M A
Not an actual proposal, for illustration purposes only
Two ways to deliver regional reliability and
energy
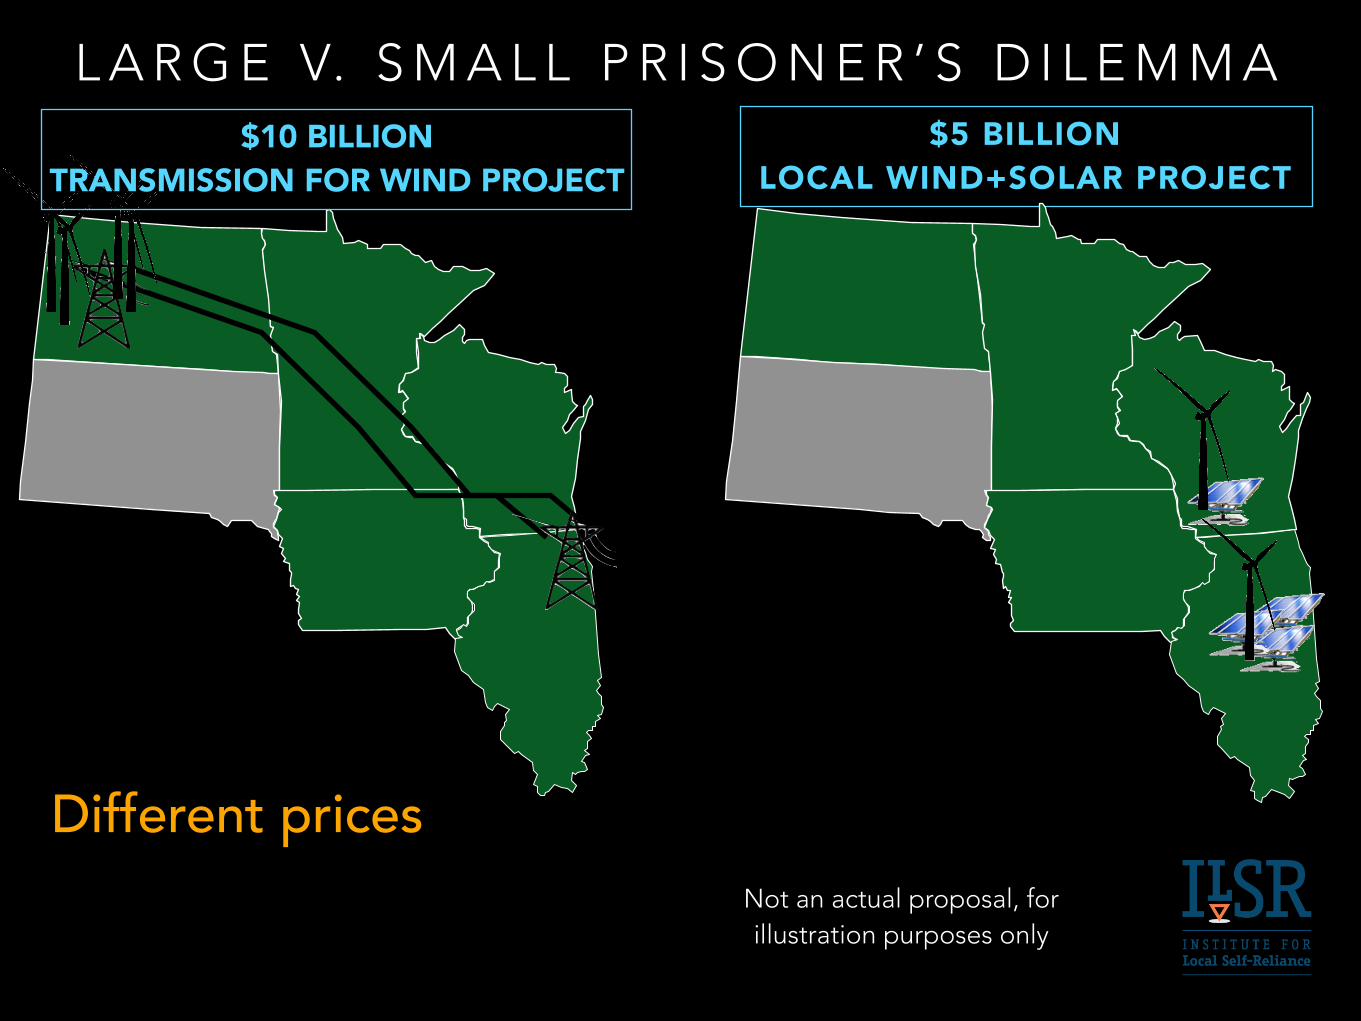
$5 BILLION LOCAL WIND+SOLAR PROJECT
$10 BILLION TRANSMISSION FOR WIND PROJECT
Not an actual proposal, for illustration purposes only
L A R G E V. S M A L L P R I S O N E R ’ S D I L E M M A
Different prices
$5 BILLION LOCAL WIND+SOLAR PROJECT
$1
$4
$1
$2 $2
$3
$2
$10 BILLION TRANSMISSION FOR WIND PROJECT
Not an actual proposal, for illustration purposes only
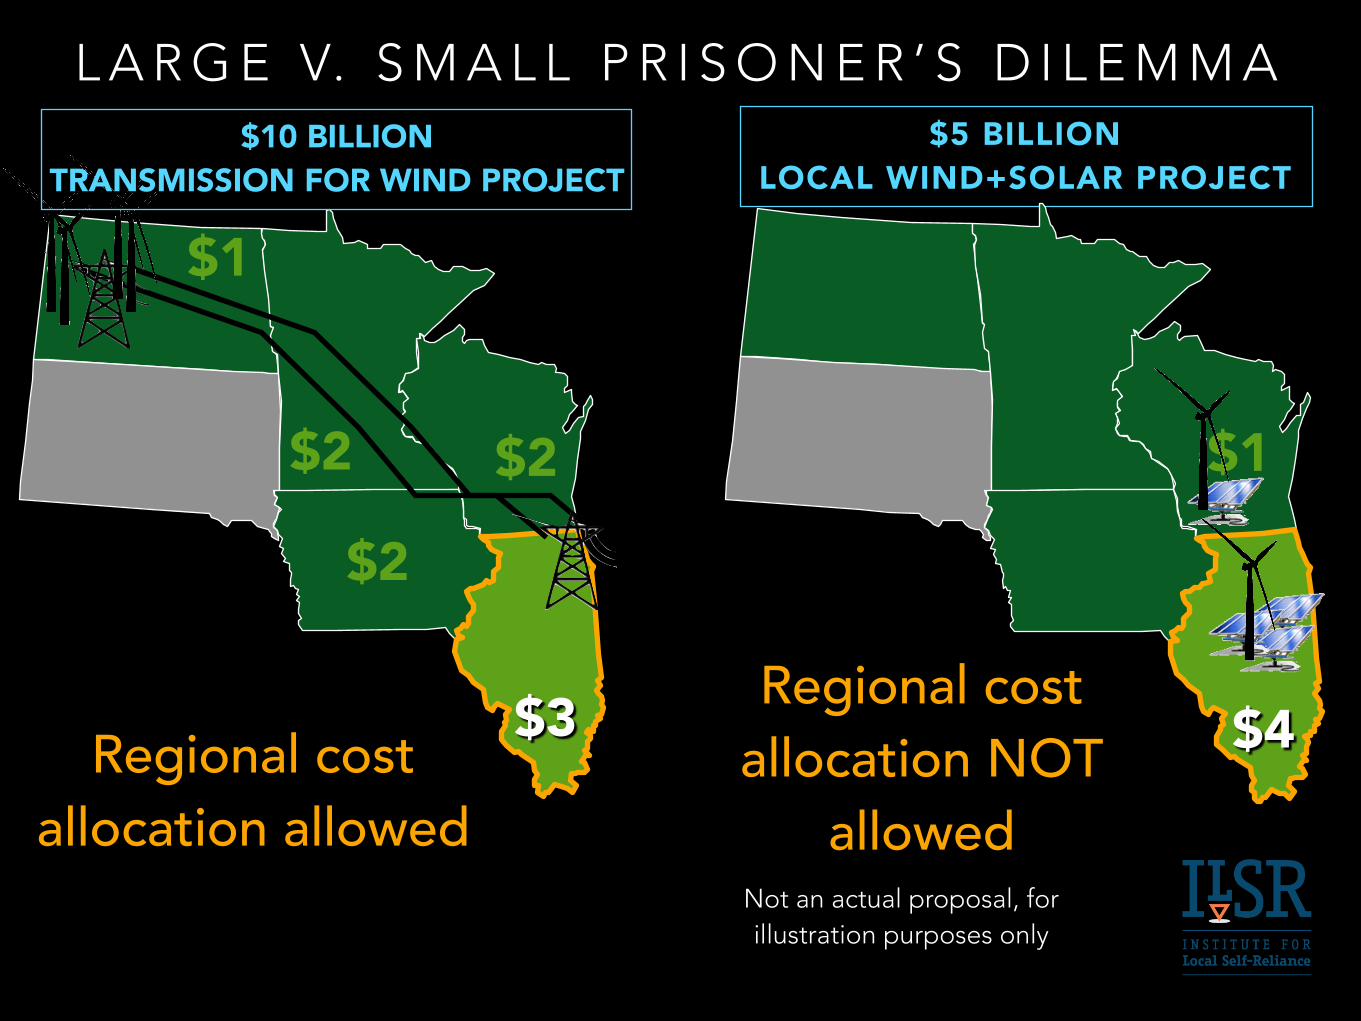
L A R G E V. S M A L L P R I S O N E R ’ S D I L E M M A
Regional cost allocation allowed
Regional cost allocation NOT
allowed
$5 BILLION LOCAL WIND+SOLAR PROJECT
$1
$4
$1
$2 $2
$3
$2
State chooses transmission because it pays less
$10 BILLION TRANSMISSION FOR WIND PROJECT
Not an actual proposal, for illustration purposes only
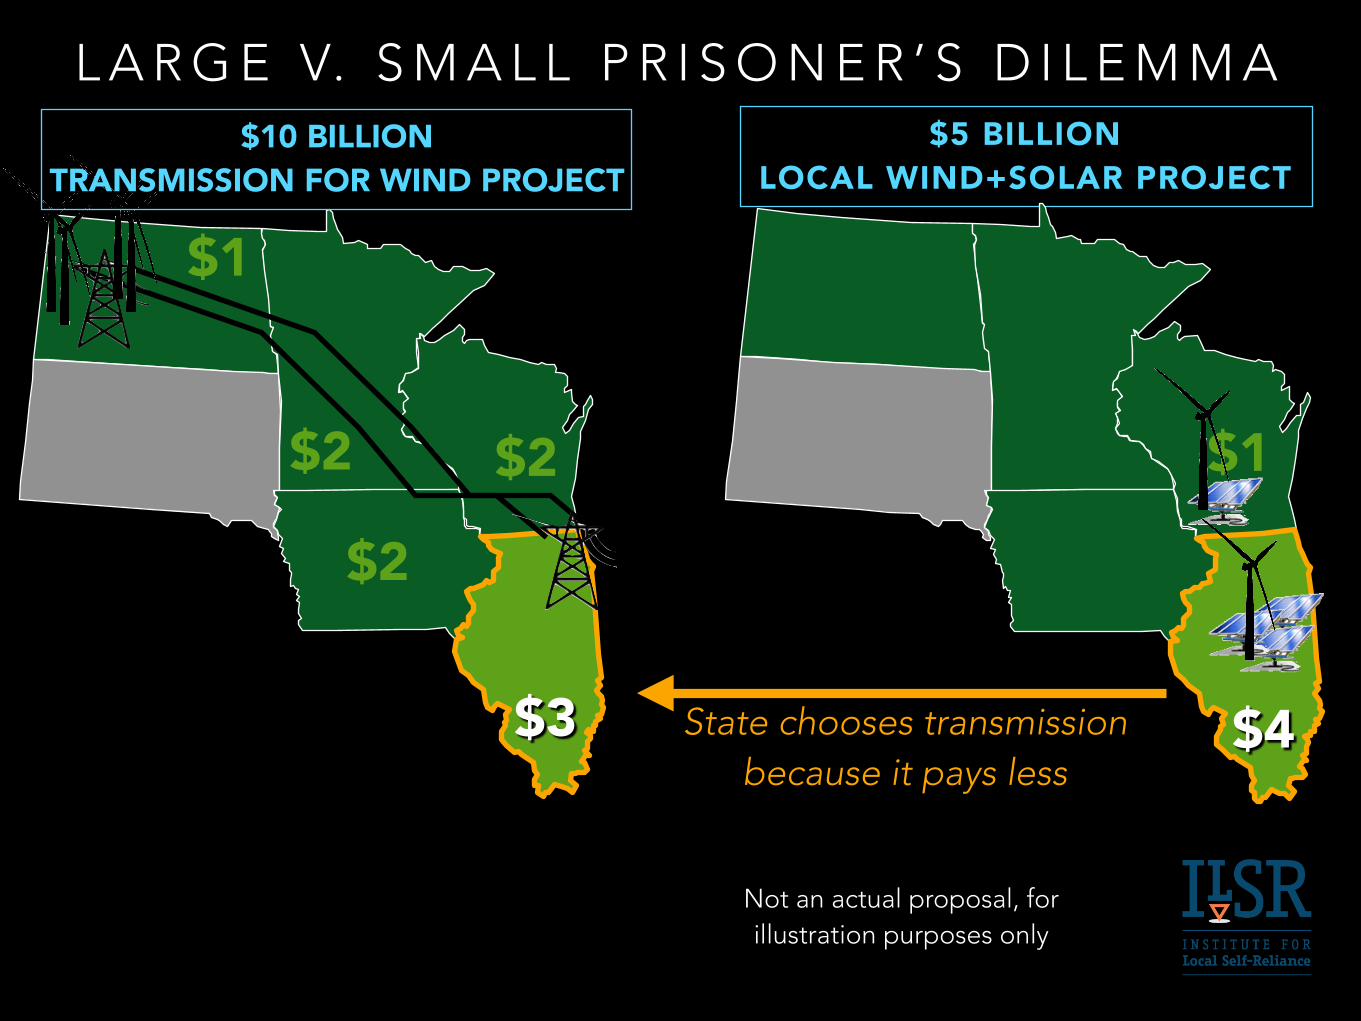
L A R G E V. S M A L L P R I S O N E R ’ S D I L E M M A

L A R G E V. S M A L L P R I S O N E R ’ S D I L E M M A$5 BILLION
LOCAL WIND+SOLAR PROJECT
$1
$4
$1
$2 $2
$3
$2
State chooses transmission because it pays less
Region pays twice as much for same reliability and clean
energy benefit
$10 BILLION TRANSMISSION FOR WIND PROJECT
Not an actual proposal, for illustration purposes only

B A L K A N I Z E D B U S I N E S S M O D E L S

T H E P R E S E N T ( R E S U LT S )

W O R S E N I N G U T I L I T Y C R E D I T R AT I N G S
0%
25%
50%
75%
100%
1970 1980 1990 2000 2011Source: Peter Kind
AAA
AA+ AA AA-
A+ A A-
BBB+ BBB
BBB-
A+ A A-
AA+ AA AA-
BBB+ BBB
BBB+ BBB
BBB+ BBB
A+ A A-
A+ A A-
A+ A A-
AA+ AA AA-
BBB-BBB-BBB-

$ 4 8 B I L L I O N AT S TA K E
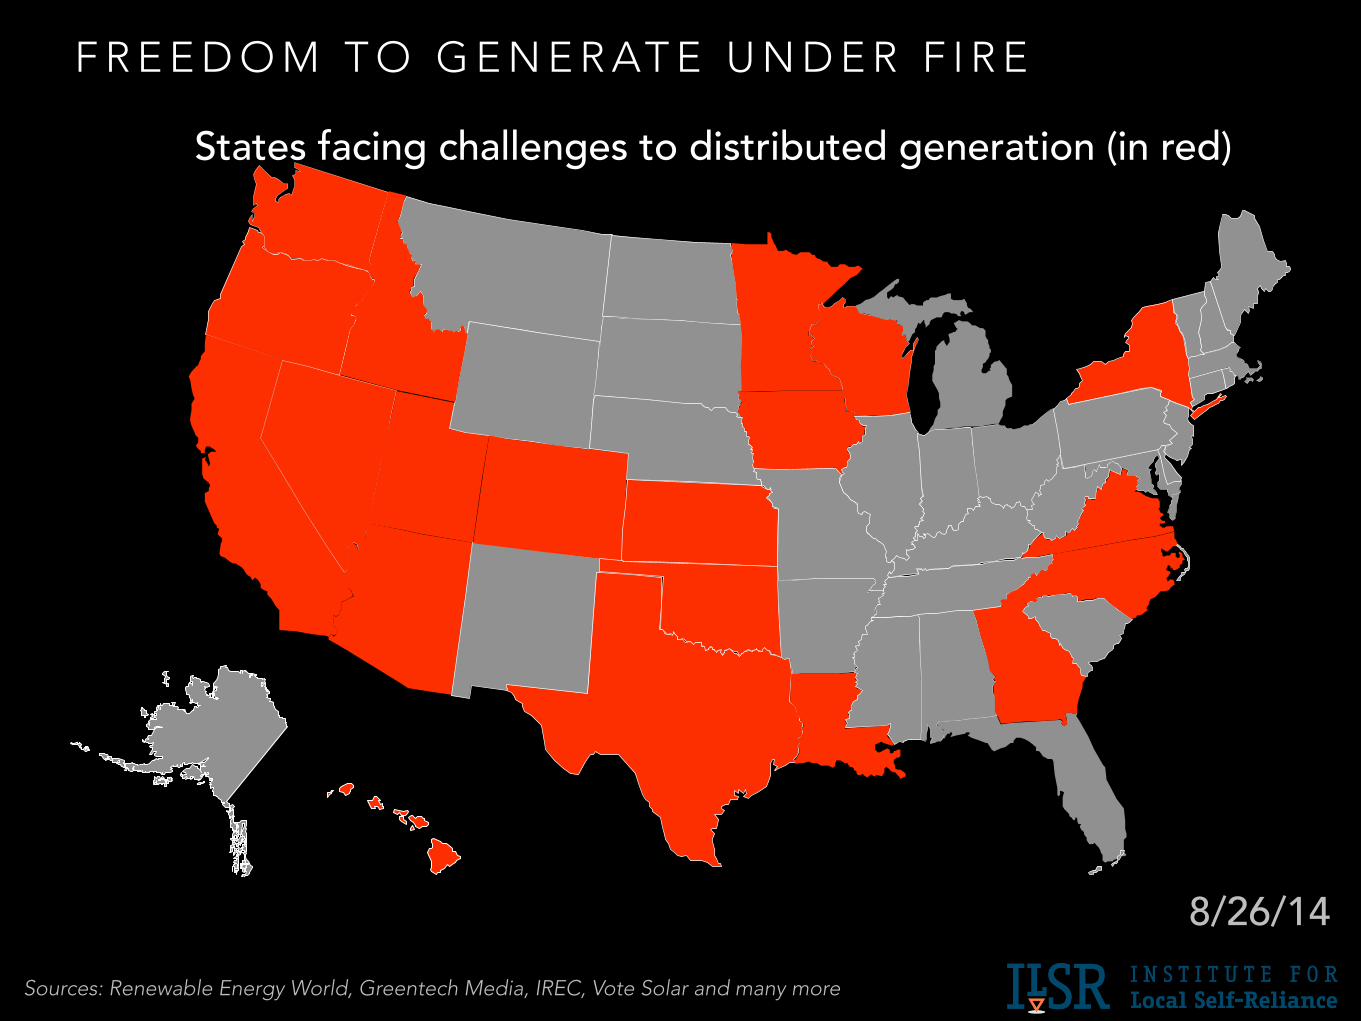
F R E E D O M T O G E N E R AT E U N D E R F I R E
States facing challenges to distributed generation (in red)
Sources: Renewable Energy World, Greentech Media, IREC, Vote Solar and many more
8/26/14

T H E F U T U R E

S TAT E S P I O N E E R I N G U T I L I T Y 2 . 0

LOW-CARBONEFFICIENTFLEXIBLE LOW-CARBONEFFICIENTFLEXIBLE
“Utility 2.0” principles or “pillars”
Utility 2.0
ELECTRICITY SYSTEM
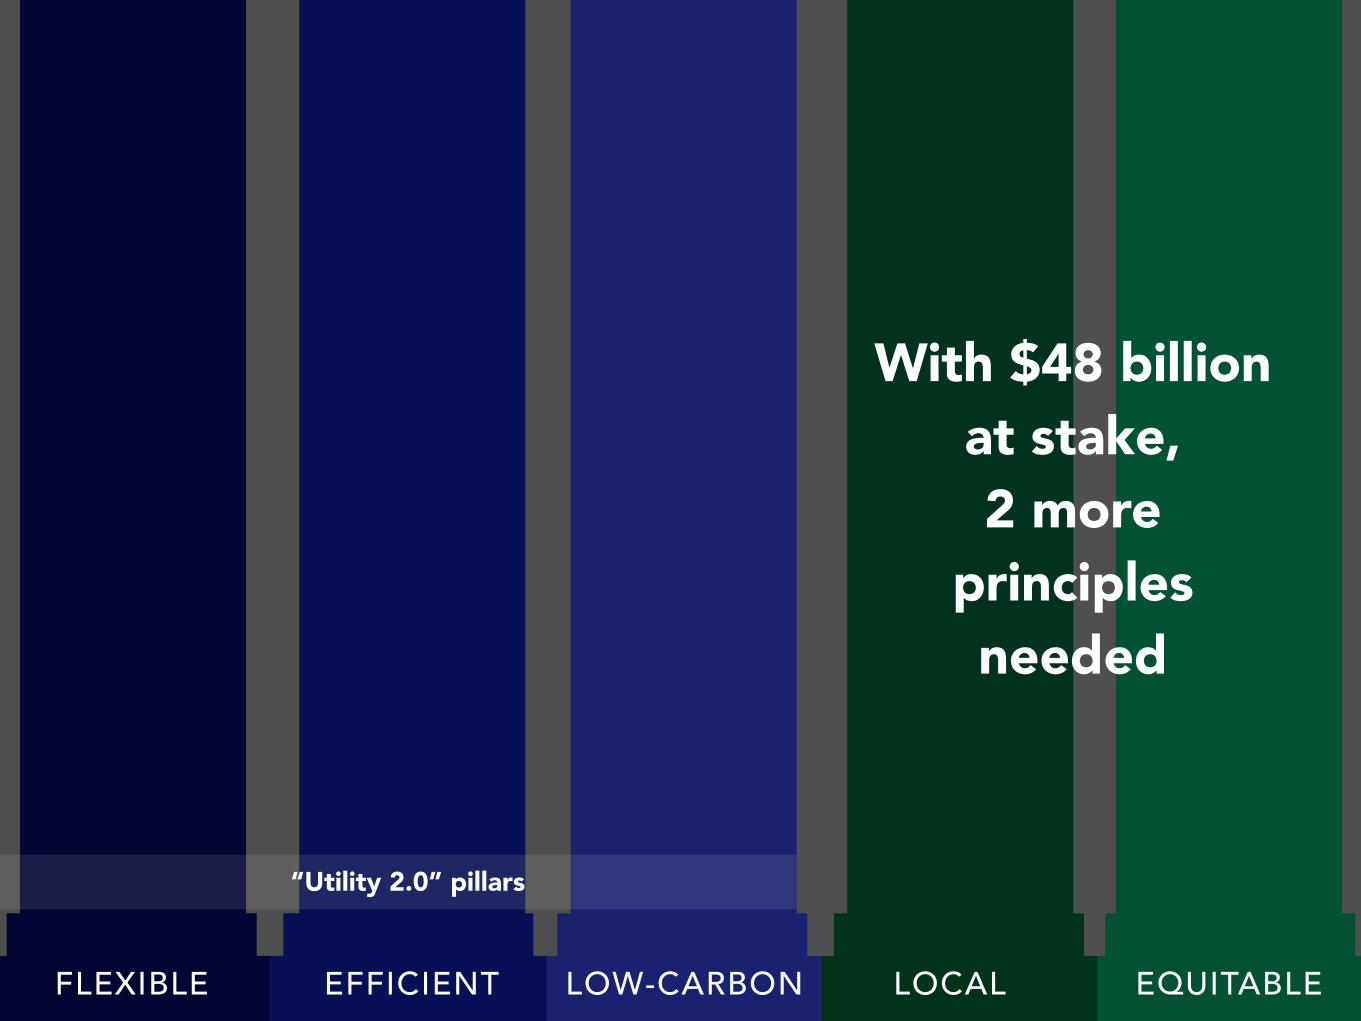
EQUITABLELOCALLOW-
CARBONEFFICIENTFLEXIBLE LOW-CARBONEFFICIENTFLEXIBLE LOCAL EQUITABLE
“Utility 2.0” pillars
With $48 billion at stake, 2 more
principles needed

EQUITABLELOCALLOW-
CARBONEFFICIENTFLEXIBLE LOW-CARBONEFFICIENTFLEXIBLE LOCAL EQUITABLE
FIVE PILLARS OF ENERGY DEMOCRACY
“Utility 2.0” pillars
$48 billion
“Utility 3.0”

EQUITABLELOCALLOW-
CARBONEFFICIENTFLEXIBLE
DEMAND RESPONSE MARKET
ANCILLARY SERVICES MARKET
E N E R G Y S T O R A G E
R O O F T O P S O L A R
F E E D - I N TA R I F F
N E T M E T E R I N G
VIRTUAL NET METERING, E.G. COMMUNITY SOLAR
ENERGY STORAGE
RENEWABLE ENERGY STANDARD
E N E R G Y S T O R A G E ENERGY STORAGE
ON-BILL REPAYMENT
ELECTRIC VEHICLES
W/ DG SET-ASIDE
LOW-CARBONEFFICIENTFLEXIBLE LOCAL EQUITABLE
POLICIESTECHNOLOGY
LEGEND
FIVE PILLARS OF ENERGY DEMOCRACY
INDEPENDENT LOCAL GRID OPERATOR
REAL-TIME PRICING
SIMPLE ENERGY
MANAGE-MENT
“Utility 2.0” pillars

E N E R G Y D E M O C R A C Y I N A C T I O N
INDEPENDENTLOCAL GRID
MANAGER
= super efficient buildings
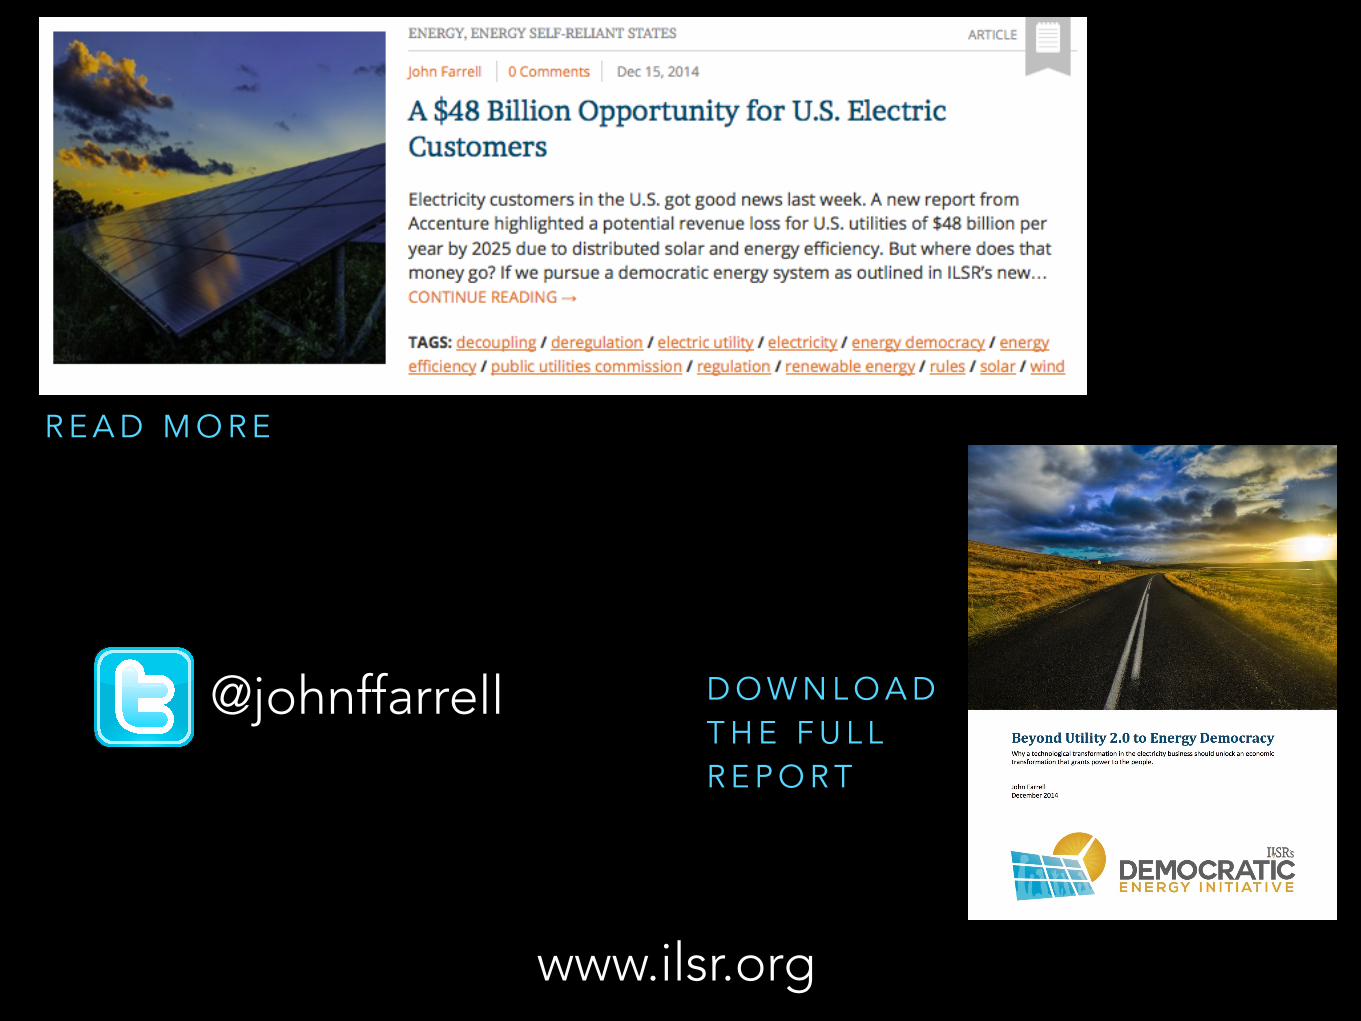
www.ilsr.org
D O W N L O A D T H E F U L L R E P O R T
R E A D M O R E
@johnffarrell


