58
The 7Twelve ® Portfolio Craig L. Israelsen, Ph.D. 2013 www.7TwelvePortfolio.com 1
| Date post: | 28-Dec-2015 |
| Category: |
Documents |
| Upload: | gervase-morrison |
| View: | 221 times |
| Download: | 2 times |

The 7Twelve® Portfolio
Craig L. Israelsen, Ph.D.
2013
www.7TwelvePortfolio.com 1
This document is a research report presenting portfolio research and analysis.
This document is neither investment advice nor an investment solicitation.
Implementation of the 7Twelve portfolio is no guarantee of performance.
---------------------------------------------------------------------------------------------
This is a copyrighted document, copying for redistribution is prohibited unless written permission is
obtained from Craig L. Israelsen
The term 7Twelve® is a registered trademark belonging to Craig L. Israelsen
Copyright © 2008-2013 Craig L. Israelsen
All rights reservedwww.7TwelvePortfolio.com 2
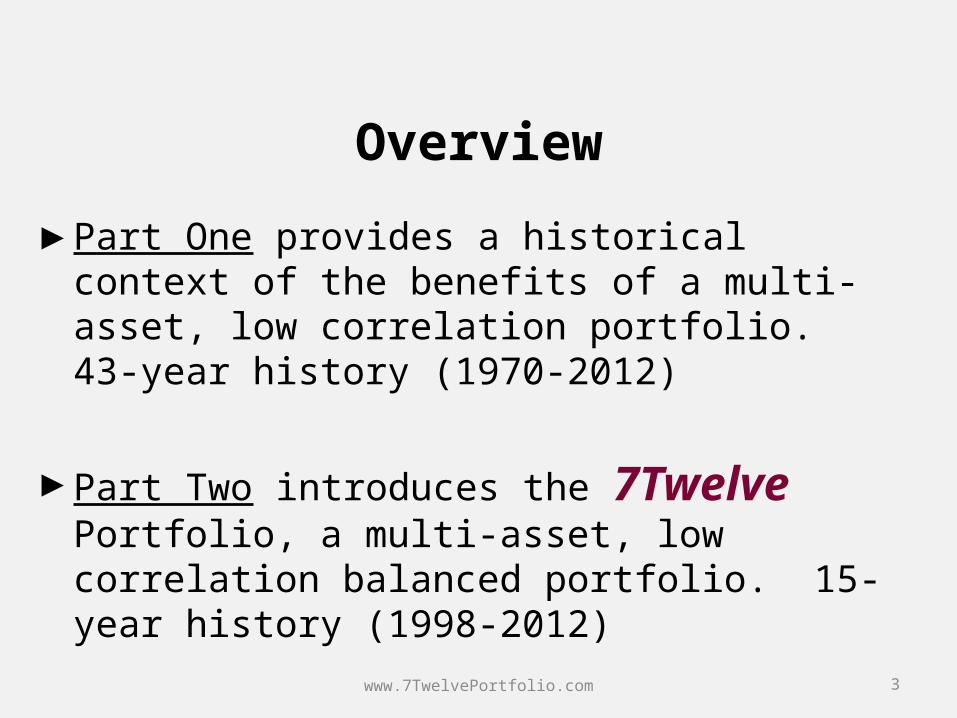
Overview
►Part One provides a historical context of the benefits of a multi-asset, low correlation portfolio. 43-year history (1970-2012)
►Part Two introduces the 7Twelve Portfolio, a multi-asset, low correlation balanced portfolio. 15-year history (1998-2012)
www.7TwelvePortfolio.com 3

Part One: 43-year Asset Class Review
www.7TwelvePortfolio.com 4
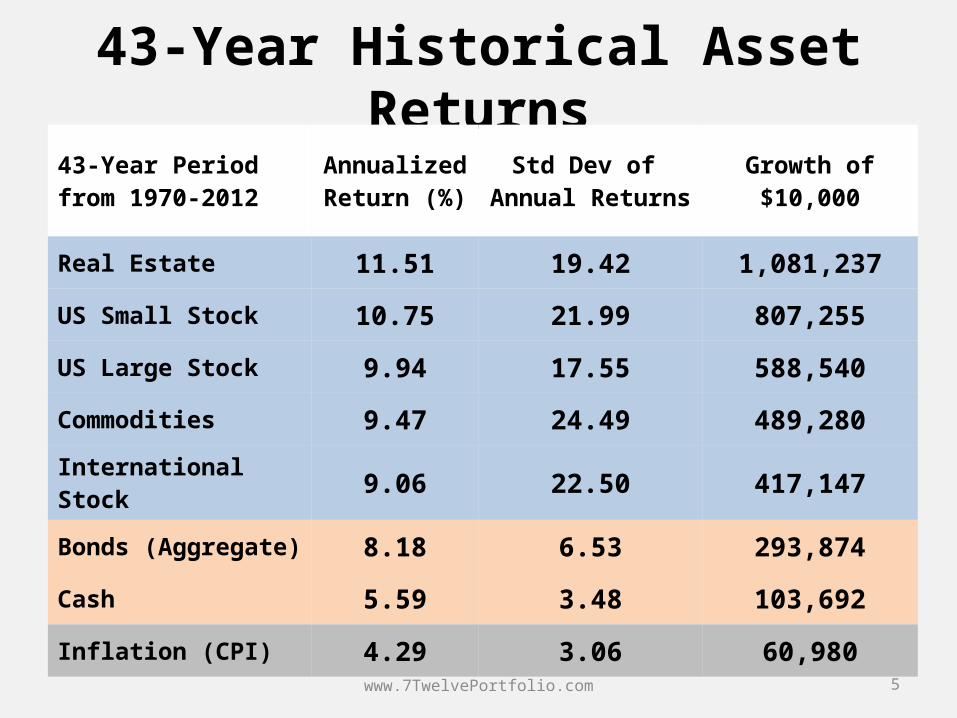
43-Year Historical Asset Returns43-Year Period from 1970-2012
Annualized
Return (%)
Std Dev of Annual Returns
Growth of $10,000
Real Estate 11.51 19.42 1,081,237
US Small Stock 10.75 21.99 807,255
US Large Stock 9.94 17.55 588,540
Commodities 9.47 24.49 489,280
International Stock 9.06 22.50 417,147
Bonds (Aggregate) 8.18 6.53 293,874
Cash 5.59 3.48 103,692
Inflation (CPI) 4.29 3.06 60,980www.7TwelvePortfolio.com 5
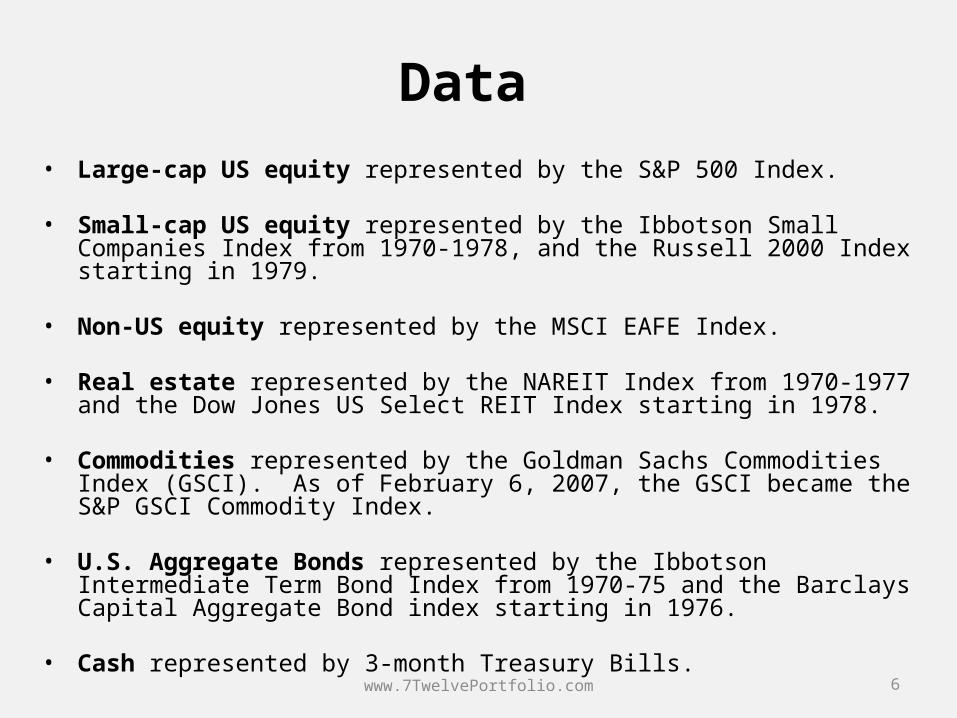
Data • Large-cap US equity represented by the S&P 500 Index.
• Small-cap US equity represented by the Ibbotson Small Companies Index from 1970-1978, and the Russell 2000 Index starting in 1979.
• Non-US equity represented by the MSCI EAFE Index.
• Real estate represented by the NAREIT Index from 1970-1977 and the Dow Jones US Select REIT Index starting in 1978.
• Commodities represented by the Goldman Sachs Commodities Index (GSCI). As of February 6, 2007, the GSCI became the S&P GSCI Commodity Index.
• U.S. Aggregate Bonds represented by the Ibbotson Intermediate Term Bond Index from 1970-75 and the Barclays Capital Aggregate Bond index starting in 1976.
• Cash represented by 3-month Treasury Bills.
www.7TwelvePortfolio.com 6
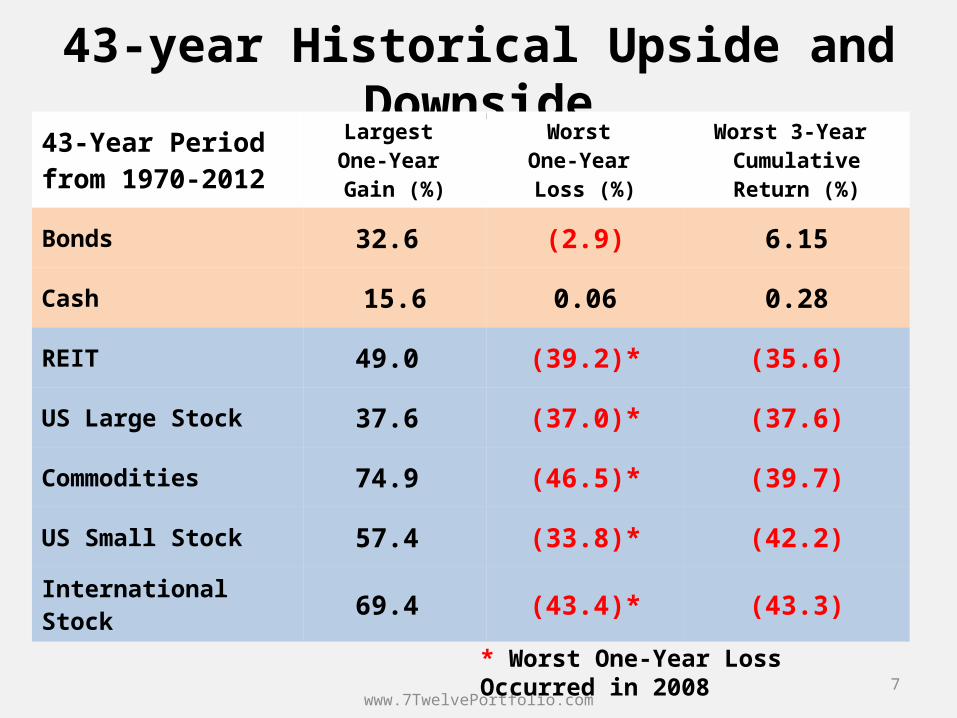
43-year Historical Upside and Downside43-Year Period from 1970-2012
Largest One-Year Gain (%)
Worst One-Year Loss (%)
Worst 3-Year Cumulative Return (%)
Bonds 32.6 (2.9) 6.15
Cash 15.6 0.06 0.28
REIT 49.0 (39.2)* (35.6)
US Large Stock 37.6 (37.0)* (37.6)
Commodities 74.9 (46.5)* (39.7)
US Small Stock 57.4 (33.8)* (42.2)
International Stock 69.4 (43.4)* (43.3)
www.7TwelvePortfolio.com
* Worst One-Year Loss Occurred in 2008 7
www.7TwelvePortfolio.com 8
-50-40-30-20-100104
5
6
7
8
9
10
11
12
Cash
REIT
Commodities
Bonds
Non-US Equity
Small US Equity
Large US Equity
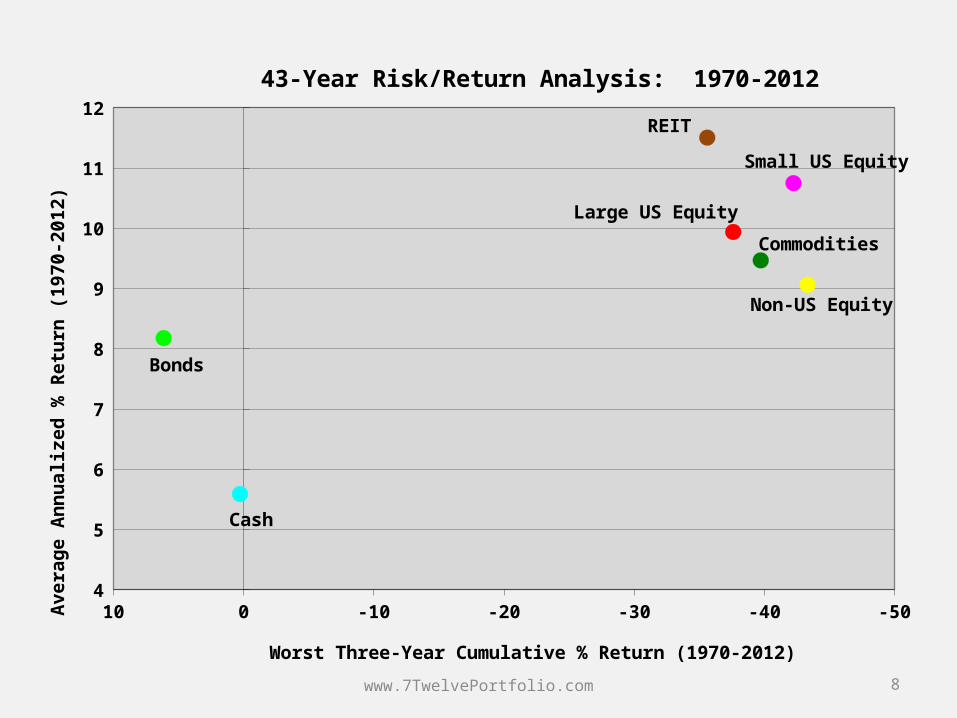
43-Year Risk/Return Analysis: 1970-2012
Worst Three-Year Cumulative % Return (1970-2012)
Av
era
ge
An
nu
aliz
ed
% R
etu
rn (
19
70
-20
12
)
www.7TwelvePortfolio.com 9
-50-40-30-20-100104
5
6
7
8
9
10
11
12
Cash
REIT
Commodities
Bonds
Non-US Equity
Small US Equity
Large US Equity
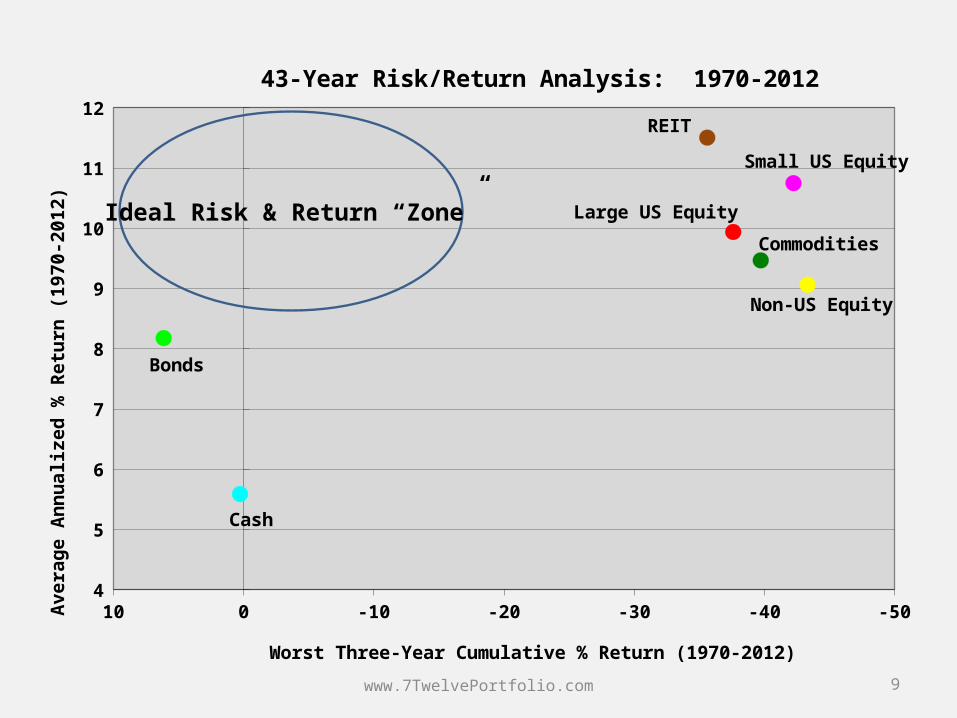
43-Year Risk/Return Analysis: 1970-2012
Worst Three-Year Cumulative % Return (1970-2012)
Av
era
ge
An
nu
aliz
ed
% R
etu
rn (
19
70
-20
12
)
Ideal Risk & Return “Zone”
To be diversified, a portfoliomust combine multiple ingredients that have
low correlation with each other.
www.7TwelvePortfolio.com 10
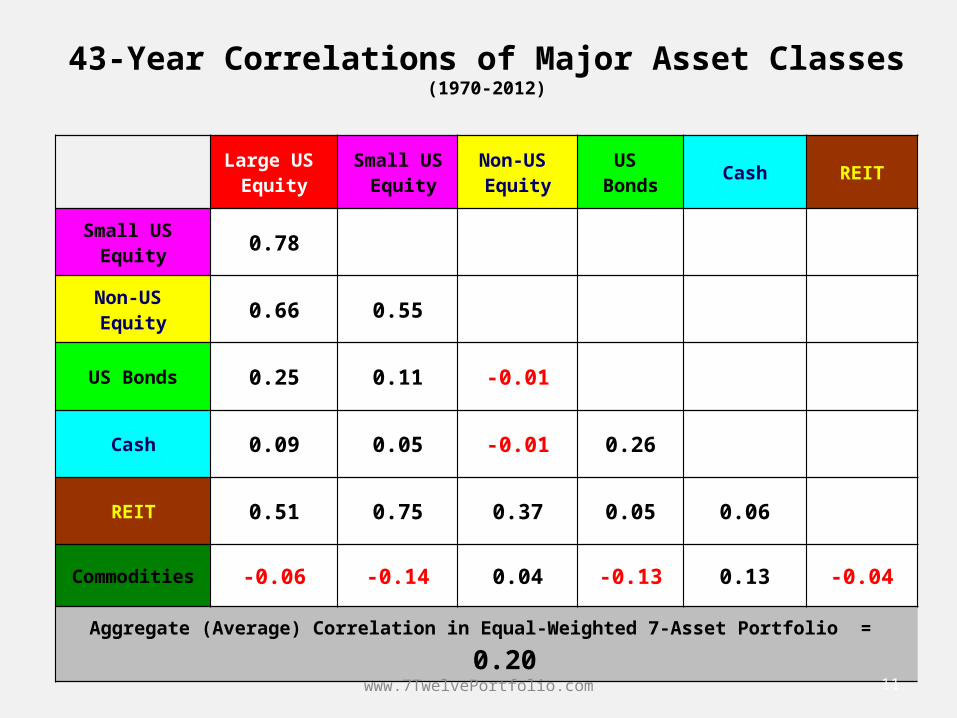
43-Year Correlations of Major Asset Classes(1970-2012)
Large US Equity
Small US Equity
Non-US Equity
US Bonds
Cash REIT
Small US Equity 0.78
Non-US Equity 0.66 0.55
US Bonds 0.25 0.11 -0.01
Cash 0.09 0.05 -0.01 0.26
REIT 0.51 0.75 0.37 0.05 0.06
Commodities -0.06 -0.14 0.04 -0.13 0.13 -0.04
Aggregate (Average) Correlation in Equal-Weighted 7-Asset Portfolio = 0.20
www.7TwelvePortfolio.com 11
Rolling 10-Year Correlations
Using S&P 500 as comparison baseline index
www.7TwelvePortfolio.com 12
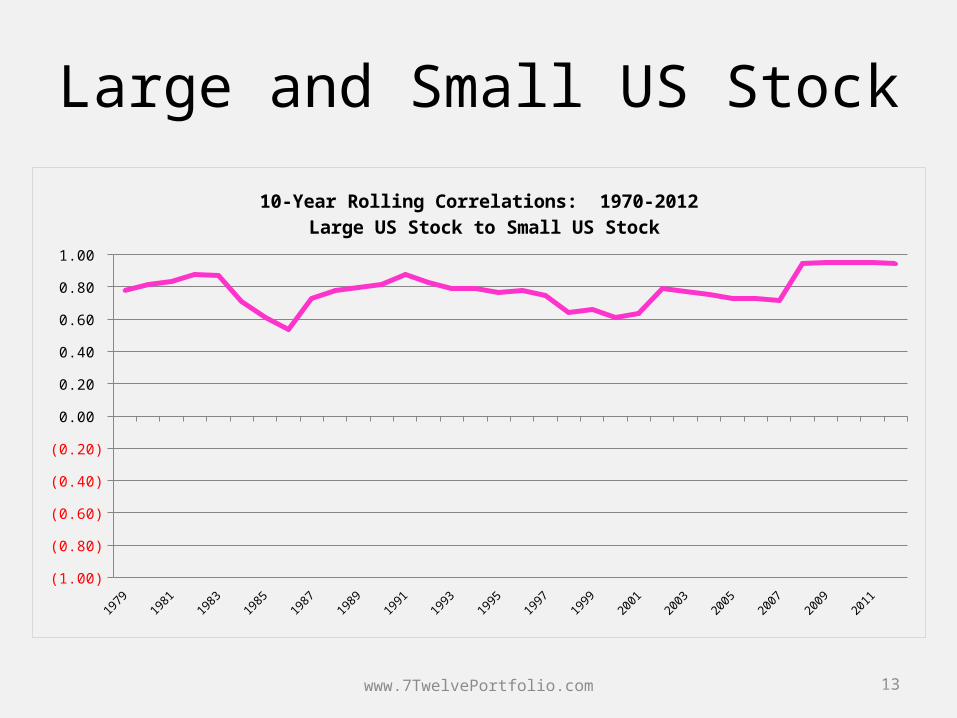
Large and Small US Stock
www.7TwelvePortfolio.com 13
19791980
19811982
19831984
19851986
19871988
19891990
19911992
19931994
19951996
19971998
19992000
20012002
20032004
20052006
20072008
20092010
20112012
(1.00)
(0.80)
(0.60)
(0.40)
(0.20)
0.00
0.20
0.40
0.60
0.80
1.00
10-Year Rolling Correlations: 1970-2012 Large US Stock to Small US Stock
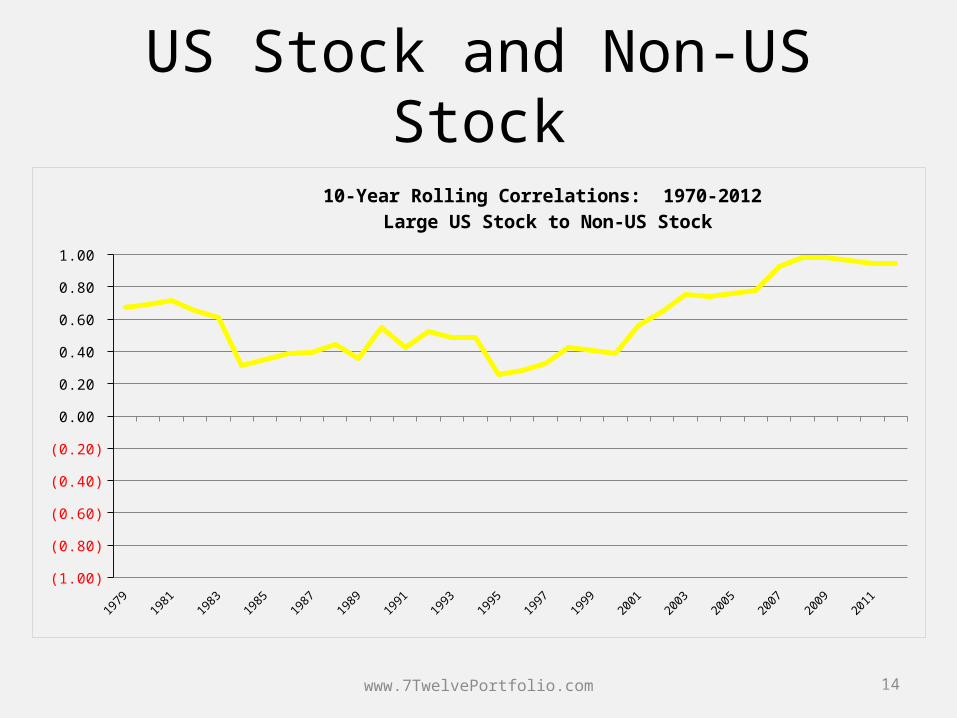
US Stock and Non-US Stock
www.7TwelvePortfolio.com 14
19791980
19811982
19831984
19851986
19871988
19891990
19911992
19931994
19951996
19971998
19992000
20012002
20032004
20052006
20072008
20092010
20112012
(1.00)
(0.80)
(0.60)
(0.40)
(0.20)
0.00
0.20
0.40
0.60
0.80
1.00
10-Year Rolling Correlations: 1970-2012 Large US Stock to Non-US Stock
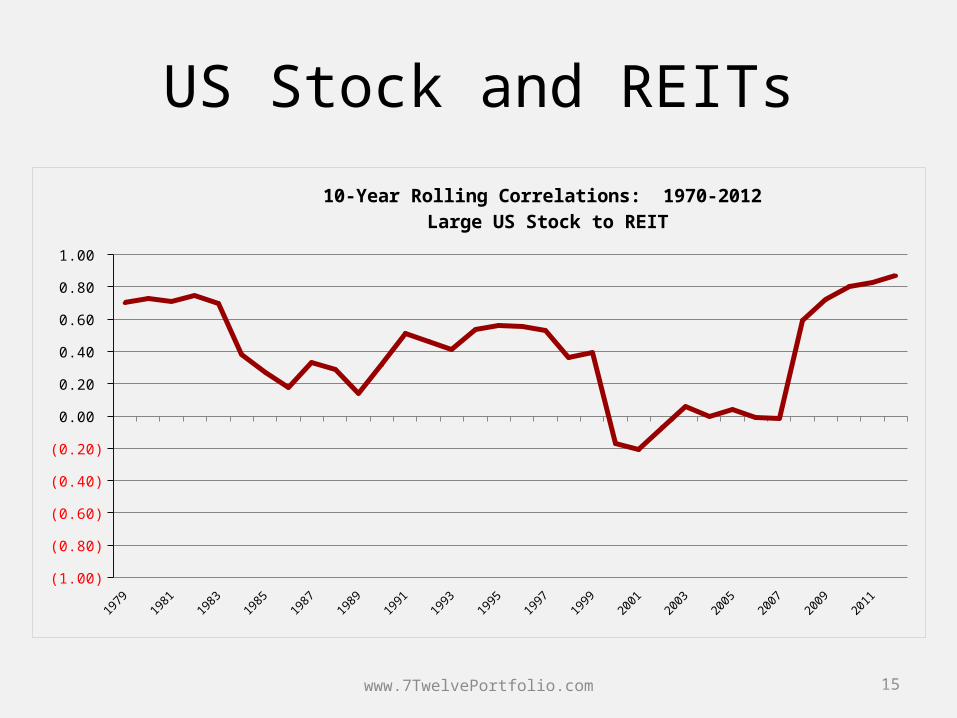
US Stock and REITs
www.7TwelvePortfolio.com 15
19791980
19811982
19831984
19851986
19871988
19891990
19911992
19931994
19951996
19971998
19992000
20012002
20032004
20052006
20072008
20092010
20112012
(1.00)
(0.80)
(0.60)
(0.40)
(0.20)
0.00
0.20
0.40
0.60
0.80
1.00
10-Year Rolling Correlations: 1970-2012 Large US Stock to REIT
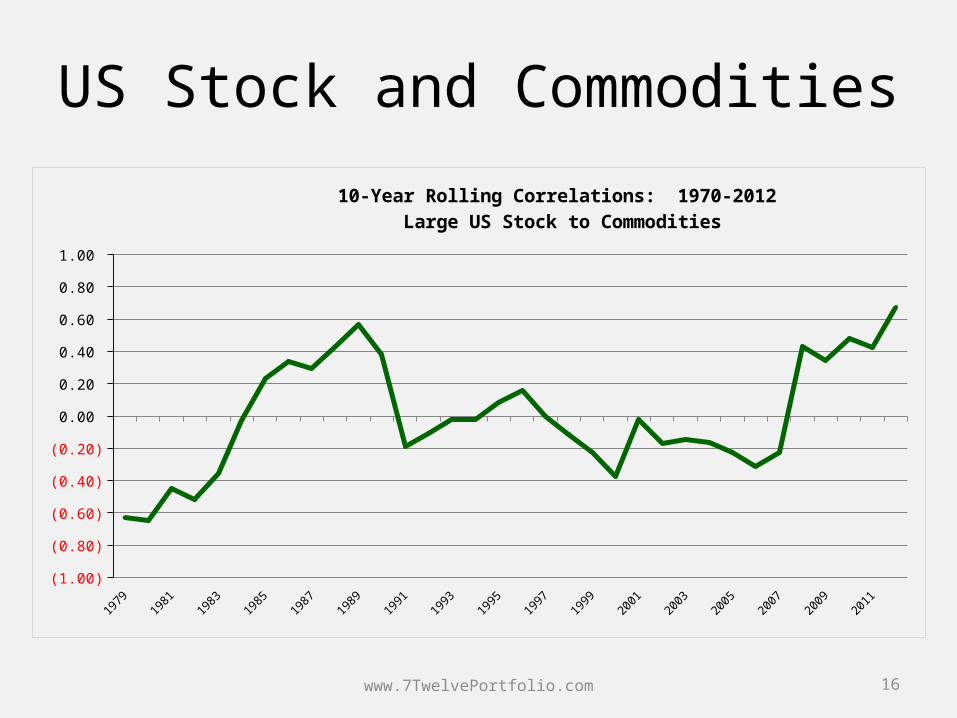
US Stock and Commodities
www.7TwelvePortfolio.com 16
19791980
19811982
19831984
19851986
19871988
19891990
19911992
19931994
19951996
19971998
19992000
20012002
20032004
20052006
20072008
20092010
20112012
(1.00)
(0.80)
(0.60)
(0.40)
(0.20)
0.00
0.20
0.40
0.60
0.80
1.00
10-Year Rolling Correlations: 1970-2012 Large US Stock to Commodities
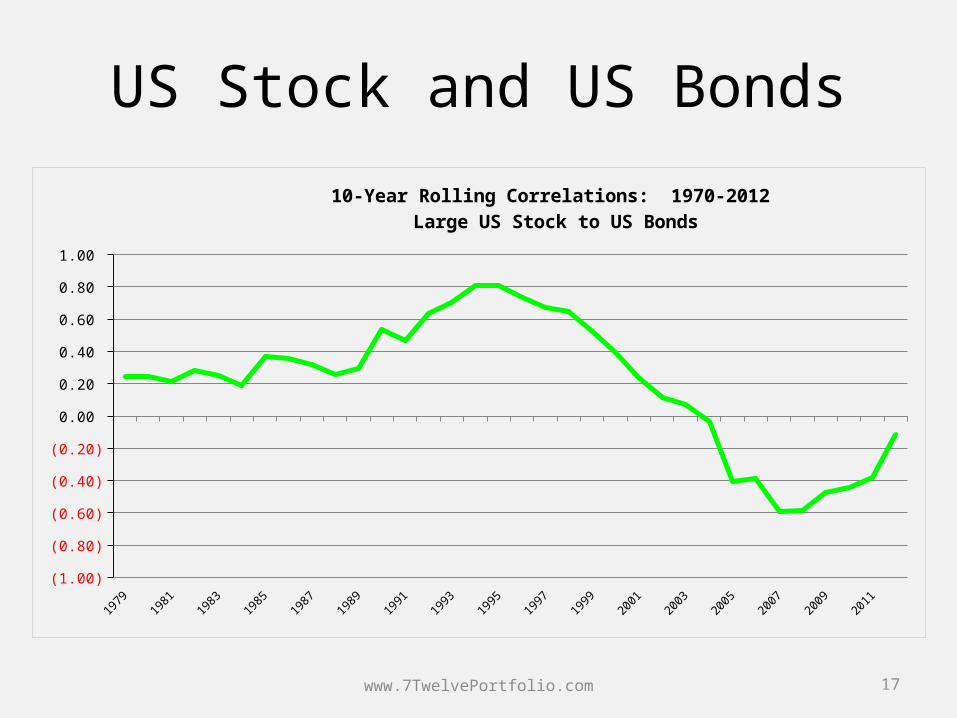
US Stock and US Bonds
www.7TwelvePortfolio.com 17
19791980
19811982
19831984
19851986
19871988
19891990
19911992
19931994
19951996
19971998
19992000
20012002
20032004
20052006
20072008
20092010
20112012
(1.00)
(0.80)
(0.60)
(0.40)
(0.20)
0.00
0.20
0.40
0.60
0.80
1.00
10-Year Rolling Correlations: 1970-2012 Large US Stock to US Bonds
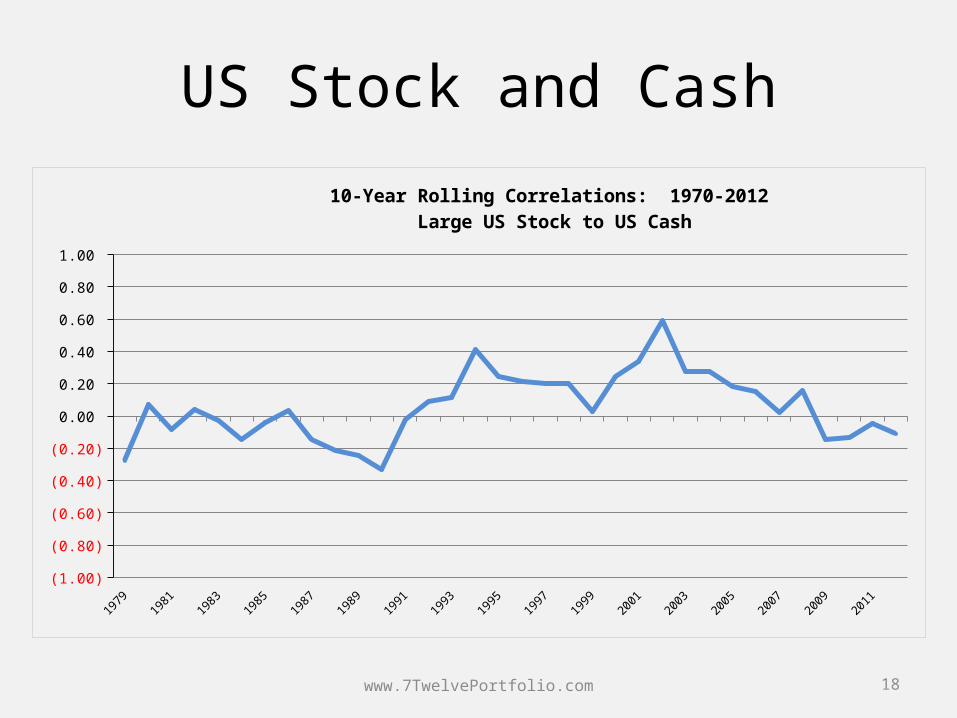
US Stock and Cash
www.7TwelvePortfolio.com 18
19791980
19811982
19831984
19851986
19871988
19891990
19911992
19931994
19951996
19971998
19992000
20012002
20032004
20052006
20072008
20092010
20112012
(1.00)
(0.80)
(0.60)
(0.40)
(0.20)
0.00
0.20
0.40
0.60
0.80
1.00
10-Year Rolling Correlations: 1970-2012 Large US Stock to US Cash
Meaningful portfolio diversification requires
Depth and Breadth
Mutual Funds/ETFs = DepthWide variety of funds = Breadth
www.7TwelvePortfolio.com 19
The following slide demonstrates portfolio performance as
diversity (or breadth)increases.
www.7TwelvePortfolio.com 20
www.7TwelvePortfolio.com 21
2.5 3.0 3.5 4.0 4.5 5.0 5.5 6.0 6.5 7.05
6
7
8
9
10
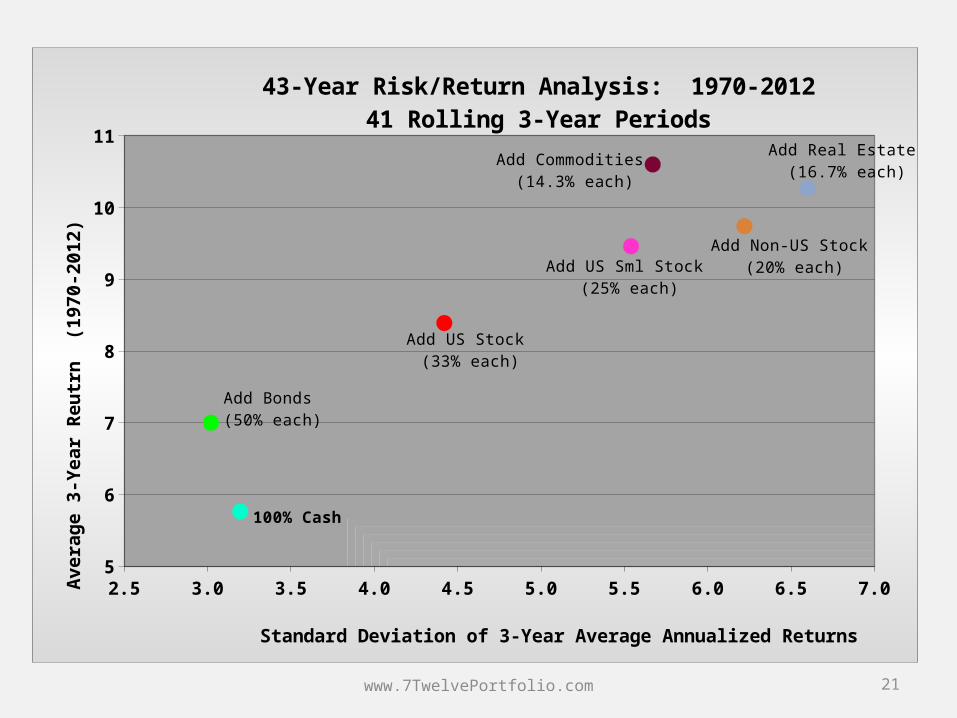
11Add Commodities
(14.3% each)
Add Real Estate (16.7% each)
Add Non-US Stock (20% each)Add US Sml Stock
(25% each)
Add US Stock (33% each)
Add Bonds (50% each)
100% Cash
43-Year Risk/Return Analysis: 1970-201241 Rolling 3-Year Periods
Standard Deviation of 3-Year Average Annualized Returns
Av
era
ge
3-Y
ea
r R
eu
trn
(1
97
0-2
01
2)
When built correctly, a multi-asset portfolio achieves
equity-like returns with
bond-like risk
www.7TwelvePortfolio.com 22
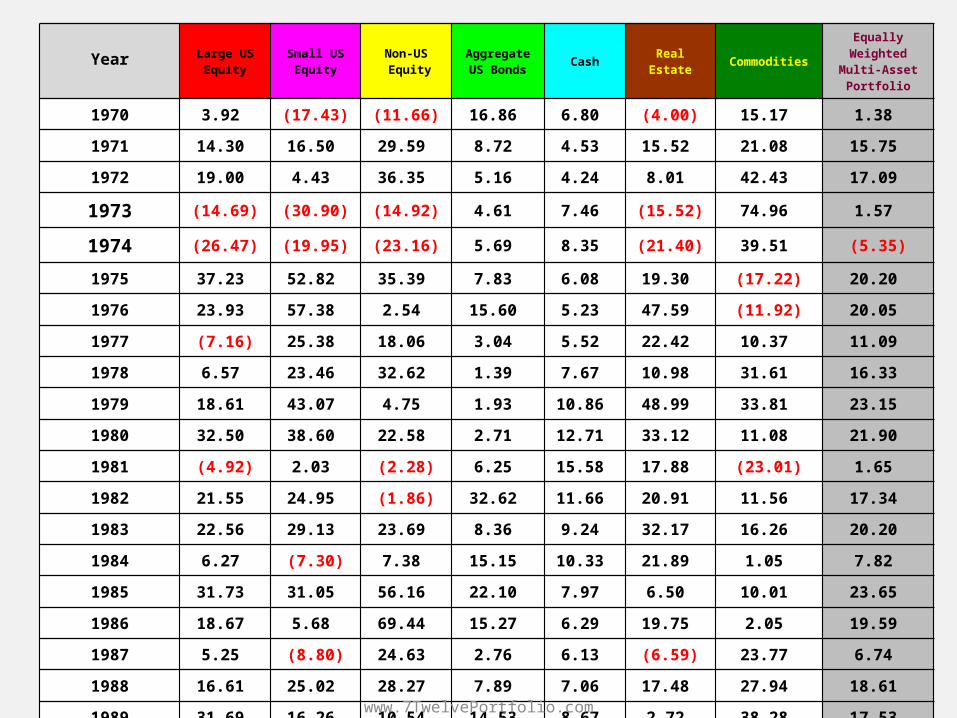
Year Large US Equity
Small US Equity
Non-US Equity
Aggregate US Bonds
Cash Real Estate CommoditiesEqually
Weighted Multi-Asset Portfolio
1970 3.92 (17.43) (11.66) 16.86 6.80 (4.00) 15.17 1.38
1971 14.30 16.50 29.59 8.72 4.53 15.52 21.08 15.75
1972 19.00 4.43 36.35 5.16 4.24 8.01 42.43 17.09
1973 (14.69) (30.90) (14.92) 4.61 7.46 (15.52) 74.96 1.57
1974 (26.47) (19.95) (23.16) 5.69 8.35 (21.40) 39.51 (5.35)
1975 37.23 52.82 35.39 7.83 6.08 19.30 (17.22) 20.20
1976 23.93 57.38 2.54 15.60 5.23 47.59 (11.92) 20.05
1977 (7.16) 25.38 18.06 3.04 5.52 22.42 10.37 11.09
1978 6.57 23.46 32.62 1.39 7.67 10.98 31.61 16.33
1979 18.61 43.07 4.75 1.93 10.86 48.99 33.81 23.15
1980 32.50 38.60 22.58 2.71 12.71 33.12 11.08 21.90
1981 (4.92) 2.03 (2.28) 6.25 15.58 17.88 (23.01) 1.65
1982 21.55 24.95 (1.86) 32.62 11.66 20.91 11.56 17.34
1983 22.56 29.13 23.69 8.36 9.24 32.17 16.26 20.20
1984 6.27 (7.30) 7.38 15.15 10.33 21.89 1.05 7.82
1985 31.73 31.05 56.16 22.10 7.97 6.50 10.01 23.65
1986 18.67 5.68 69.44 15.27 6.29 19.75 2.05 19.59
1987 5.25 (8.80) 24.63 2.76 6.13 (6.59) 23.77 6.74
1988 16.61 25.02 28.27 7.89 7.06 17.48 27.94 18.61
1989 31.69 16.26 10.54 14.53 8.67 2.72 38.28 17.53
1990 (3.10) (19.48) (23.45) 8.96 7.99 (23.44) 29.08 (3.35)
www.7TwelvePortfolio.com
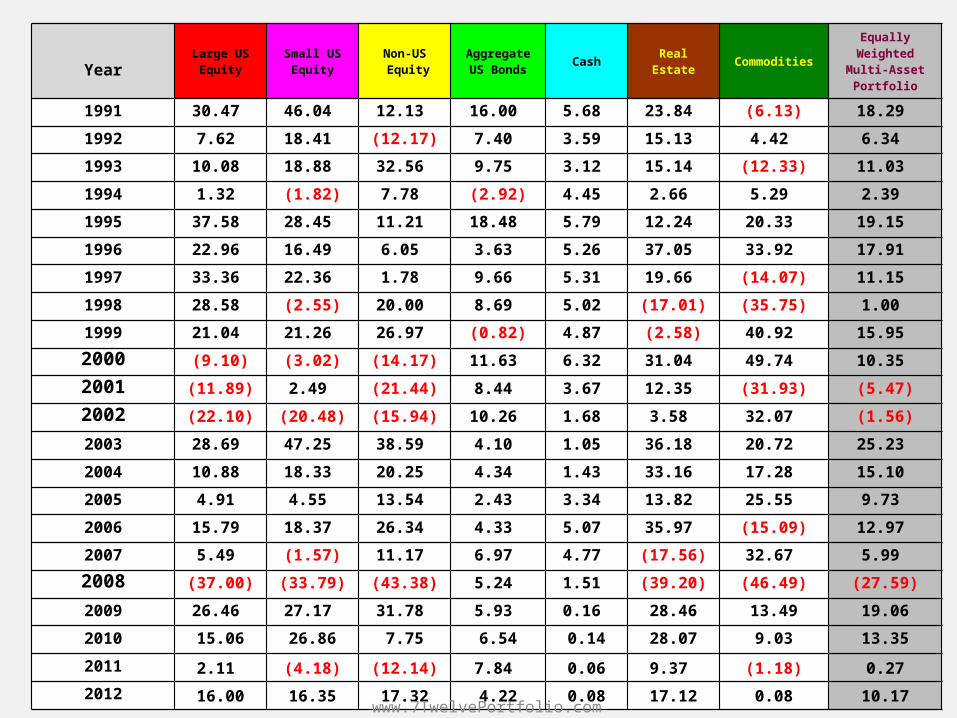
YearLarge US
EquitySmall US
EquityNon-US Equity
Aggregate US Bonds
Cash Real Estate CommoditiesEqually
Weighted Multi-Asset Portfolio
1991 30.47 46.04 12.13 16.00 5.68 23.84 (6.13) 18.29
1992 7.62 18.41 (12.17) 7.40 3.59 15.13 4.42 6.34
1993 10.08 18.88 32.56 9.75 3.12 15.14 (12.33) 11.03
1994 1.32 (1.82) 7.78 (2.92) 4.45 2.66 5.29 2.39
1995 37.58 28.45 11.21 18.48 5.79 12.24 20.33 19.15
1996 22.96 16.49 6.05 3.63 5.26 37.05 33.92 17.91
1997 33.36 22.36 1.78 9.66 5.31 19.66 (14.07) 11.15
1998 28.58 (2.55) 20.00 8.69 5.02 (17.01) (35.75) 1.00
1999 21.04 21.26 26.97 (0.82) 4.87 (2.58) 40.92 15.95
2000 (9.10) (3.02) (14.17) 11.63 6.32 31.04 49.74 10.35
2001 (11.89) 2.49 (21.44) 8.44 3.67 12.35 (31.93) (5.47)
2002 (22.10) (20.48) (15.94) 10.26 1.68 3.58 32.07 (1.56)
2003 28.69 47.25 38.59 4.10 1.05 36.18 20.72 25.23
2004 10.88 18.33 20.25 4.34 1.43 33.16 17.28 15.10
2005 4.91 4.55 13.54 2.43 3.34 13.82 25.55 9.73
2006 15.79 18.37 26.34 4.33 5.07 35.97 (15.09) 12.97
2007 5.49 (1.57) 11.17 6.97 4.77 (17.56) 32.67 5.99
2008 (37.00) (33.79) (43.38) 5.24 1.51 (39.20) (46.49) (27.59)
2009 26.46 27.17 31.78 5.93 0.16 28.46 13.49 19.06
2010 15.06 26.86 7.75 6.54 0.14 28.07 9.03 13.35
2011 2.11 (4.18) (12.14) 7.84 0.06 9.37 (1.18) 0.27
2012 16.00 16.35 17.32 4.22 0.08 17.12 0.08 10.17
www.7TwelvePortfolio.com
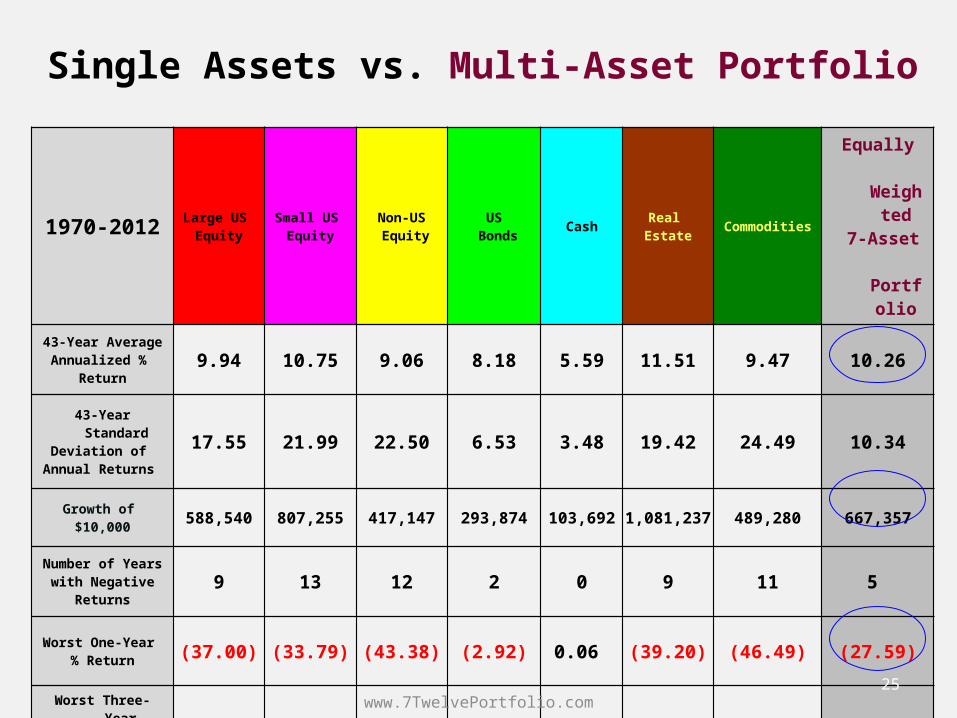
Single Assets vs. Multi-Asset Portfolio
1970-2012
Large US Equity
Small US Equity
Non-US Equity
US Bonds
Cash Real Estate
Commodities
Equally
Weighted
7-Asset Portfolio
43-Year Average Annualized %
Return9.94 10.75 9.06 8.18 5.59 11.51 9.47 10.26
43-Year Standard
Deviation of Annual Returns
17.55 21.99 22.50 6.53 3.48 19.42 24.49 10.34
Growth of $10,000 588,540 807,255 417,147 293,874 103,692 1,081,237 489,280 667,357
Number of Years
with Negative Returns
9 13 12 2 0 9 11 5
Worst One-Year % Return (37.00) (33.79) (43.38) (2.92) 0.06 (39.20) (46.49) (27.59)
Worst Three-Year
Cumulative % Return
(37.61) (42.24) (43.32) 6.15 0.28 (35.61) (39.72) (13.30)
www.7TwelvePortfolio.com25
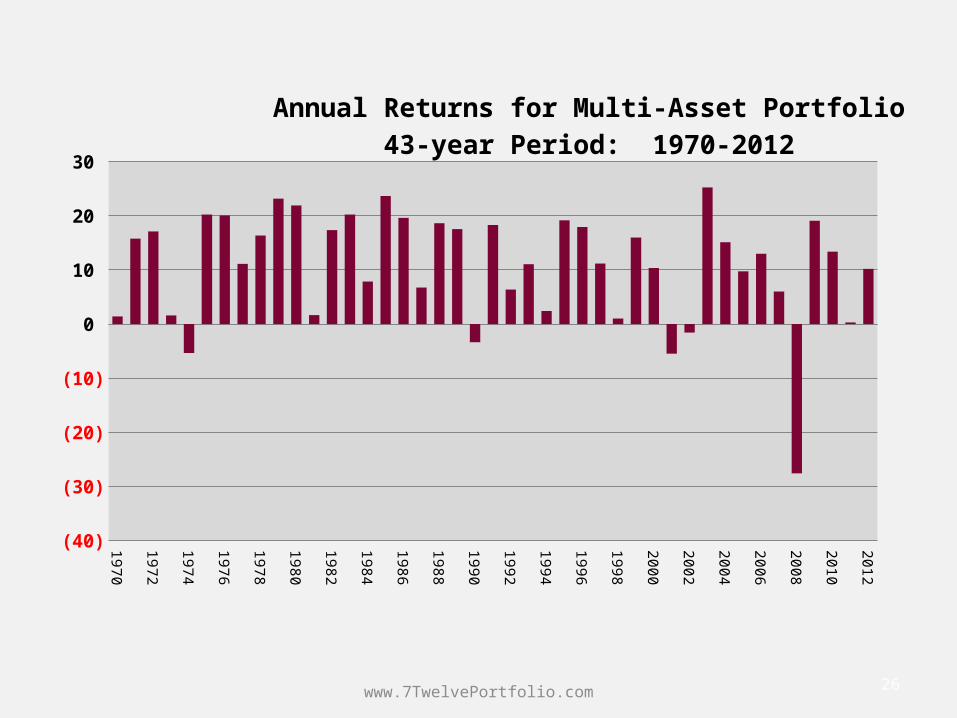
www.7TwelvePortfolio.com 26
1970197119721973197419751976197719781979198019811982198319841985198619871988198919901991199219931994199519961997199819992000200120022003200420052006200720082009201020112012
(40)
(30)
(20)
(10)
0
10
20
30
Annual Returns for Multi-Asset Portfolio43-year Period: 1970-2012
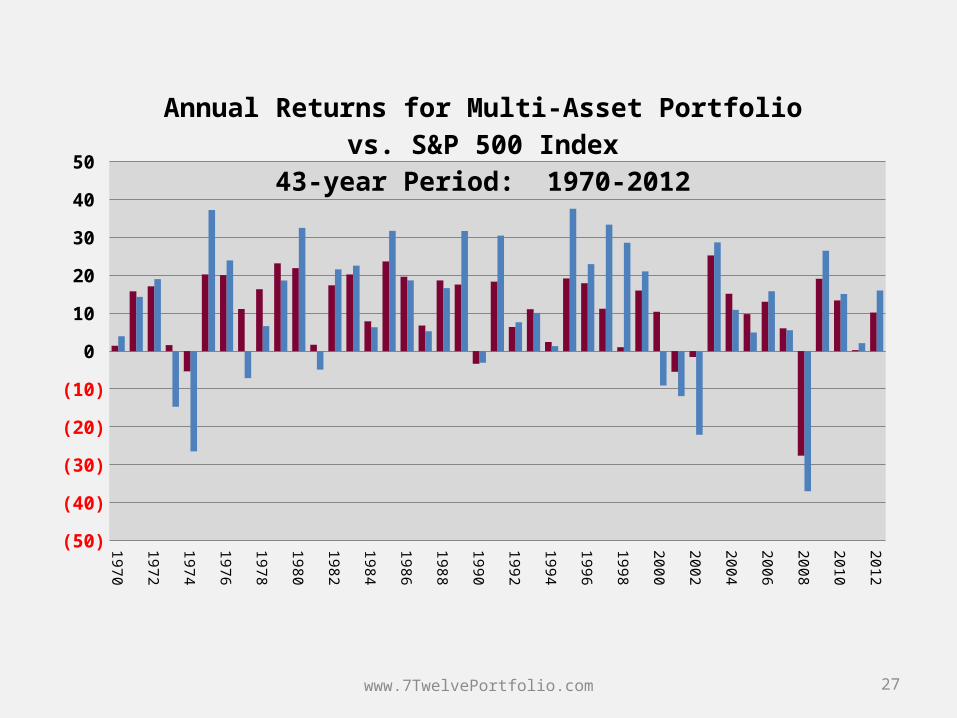
www.7TwelvePortfolio.com 27
1970197119721973197419751976197719781979198019811982198319841985198619871988198919901991199219931994199519961997199819992000200120022003200420052006200720082009201020112012
(50)
(40)
(30)
(20)
(10)
0
10
20
30
40
50
Annual Returns for Multi-Asset Portfolio vs. S&P 500 Index43-year Period: 1970-2012
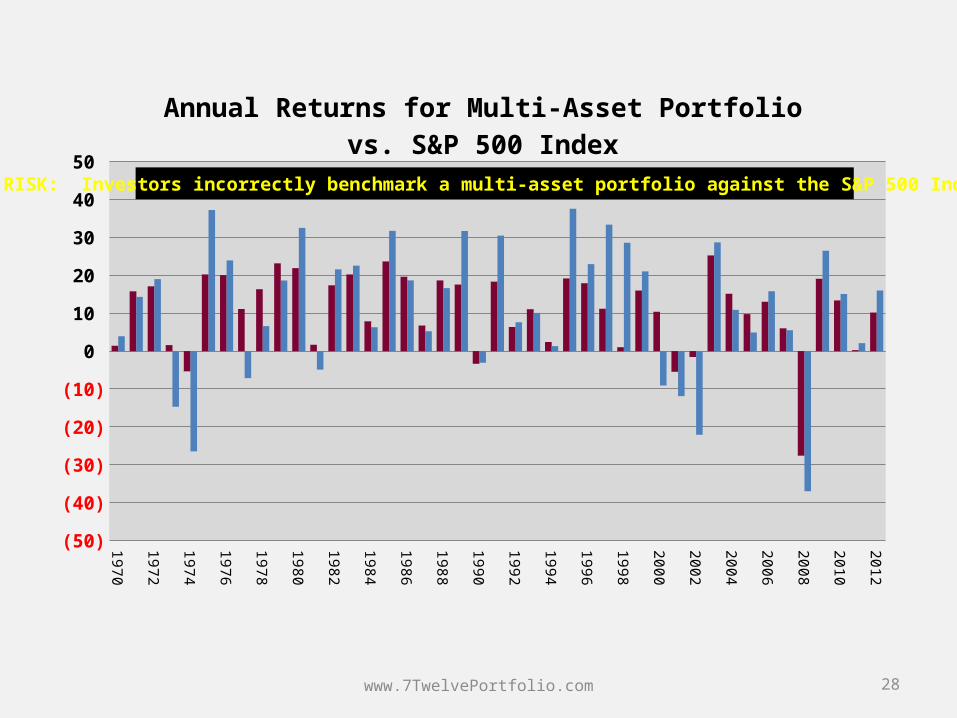
www.7TwelvePortfolio.com 28
1970197119721973197419751976197719781979198019811982198319841985198619871988198919901991199219931994199519961997199819992000200120022003200420052006200720082009201020112012
(50)
(40)
(30)
(20)
(10)
0
10
20
30
40
50
Annual Returns for Multi-Asset Portfolio vs. S&P 500 Index43-year Period: 1970-2012
RISK: Investors incorrectly benchmark a multi-asset portfolio against the S&P 500 Index
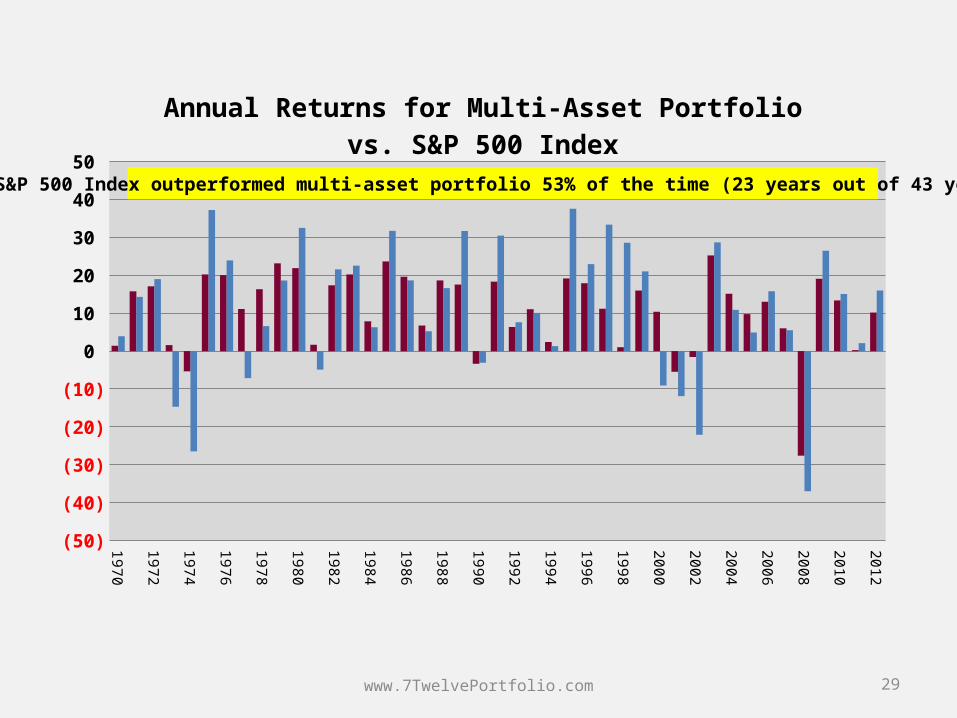
www.7TwelvePortfolio.com 29
1970197119721973197419751976197719781979198019811982198319841985198619871988198919901991199219931994199519961997199819992000200120022003200420052006200720082009201020112012
(50)
(40)
(30)
(20)
(10)
0
10
20
30
40
50
Annual Returns for Multi-Asset Portfolio vs. S&P 500 Index43-year Period: 1970-2012
S&P 500 Index outperformed multi-asset portfolio 53% of the time (23 years out of 43 years)
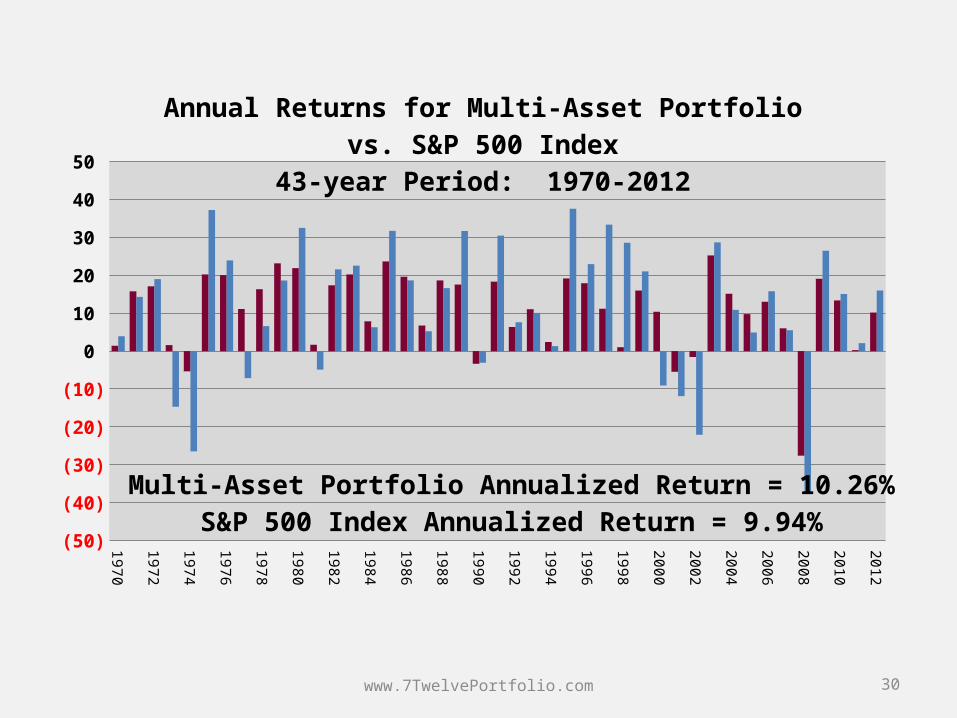
www.7TwelvePortfolio.com 30
1970197119721973197419751976197719781979198019811982198319841985198619871988198919901991199219931994199519961997199819992000200120022003200420052006200720082009201020112012
(50)
(40)
(30)
(20)
(10)
0
10
20
30
40
50
Annual Returns for Multi-Asset Portfolio vs. S&P 500 Index43-year Period: 1970-2012
Multi-Asset Portfolio Annualized Return = 10.26%S&P 500 Index Annualized Return = 9.94%
Key to Long-Term Success
Reducing the
frequency and magnitude of losses
www.7TwelvePortfolio.com 31
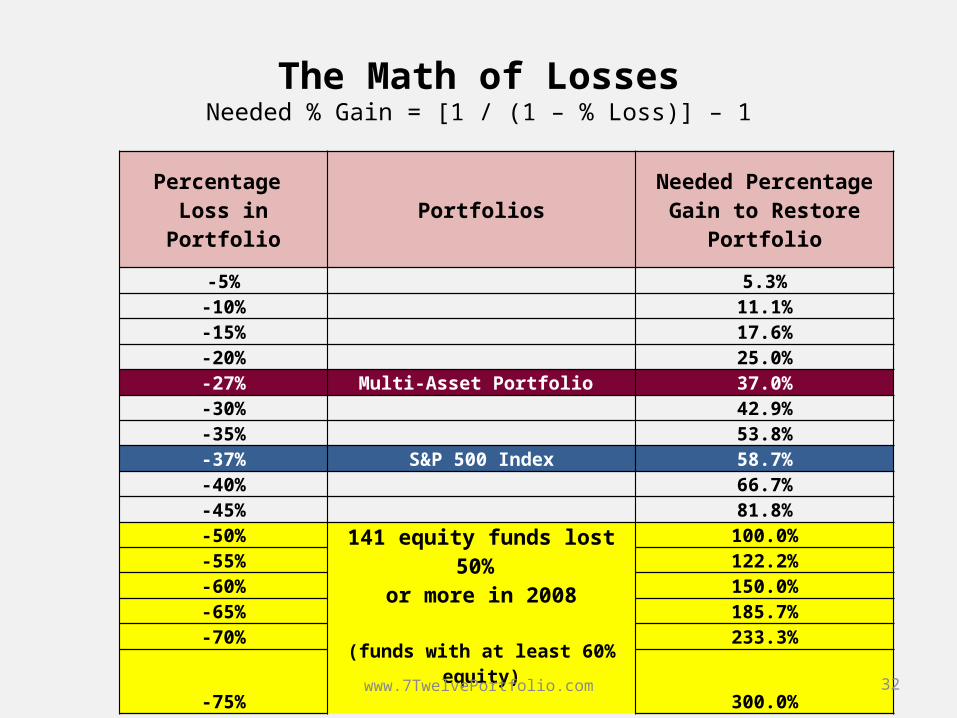
The Math of LossesNeeded % Gain = [1 / (1 – % Loss)] – 1
Percentage Loss in Portfolio Portfolios
Needed Percentage Gain to Restore
Portfolio
-5% 5.3%-10% 11.1%-15% 17.6%-20% 25.0%-27% Multi-Asset Portfolio 37.0%-30% 42.9%-35% 53.8%-37% S&P 500 Index 58.7%-40% 66.7%-45% 81.8%-50%
141 equity funds lost 50% or more in 2008
(funds with at least 60% equity)
100.0%-55% 122.2%-60% 150.0%-65% 185.7%-70% 233.3%-75% 300.0%
www.7TwelvePortfolio.com 32
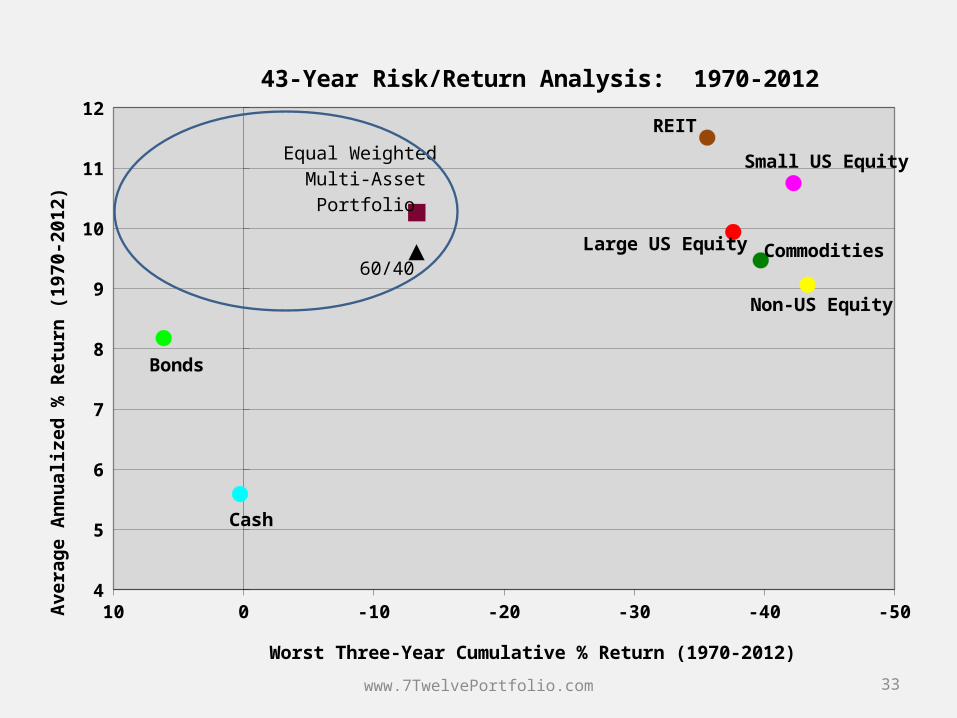
www.7TwelvePortfolio.com 33
-50-40-30-20-100104
5
6
7
8
9
10
11
12
Cash
REIT
60/40
Equal Weighted Multi-Asset Portfolio
Commodities
Bonds
Non-US Equity
Small US Equity
Large US Equity
43-Year Risk/Return Analysis: 1970-2012
Worst Three-Year Cumulative % Return (1970-2012)
Av
era
ge
An
nu
aliz
ed
% R
etu
rn (
19
70
-20
12
)
Performance of Multi-Asset Portfolio
During Post-Retirement Distribution Phase
www.7TwelvePortfolio.com 34
Starting Year
Ending Year
100% Bond Portfolio
60% US Stock/40% Bond Portfolio
Multi-Asset Portfolio
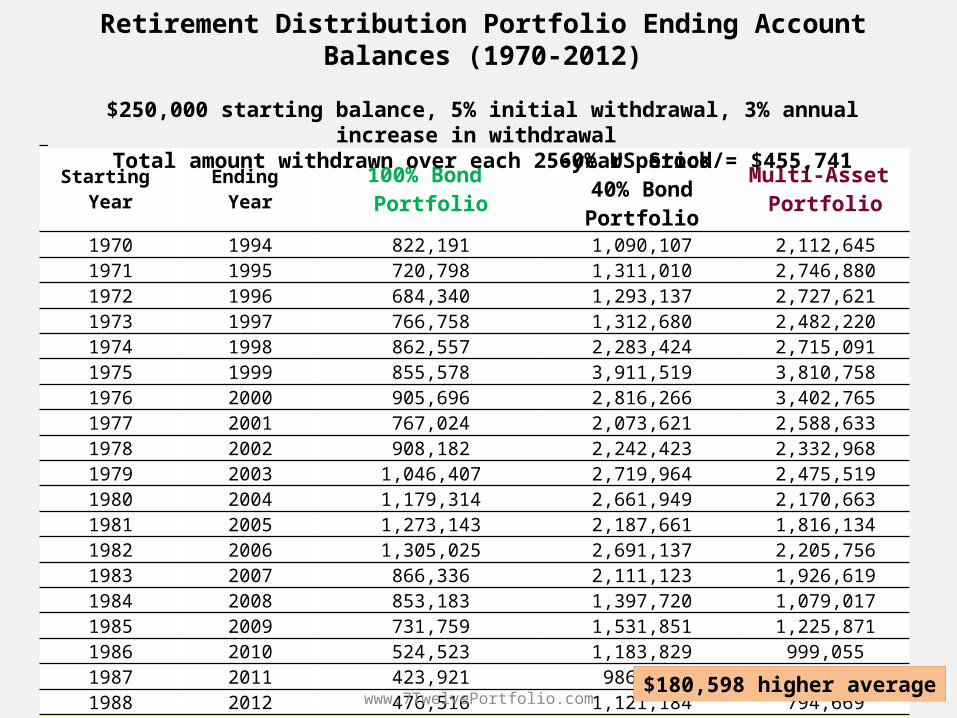
1970 1994 822,191 1,090,107 2,112,6451971 1995 720,798 1,311,010 2,746,8801972 1996 684,340 1,293,137 2,727,6211973 1997 766,758 1,312,680 2,482,2201974 1998 862,557 2,283,424 2,715,0911975 1999 855,578 3,911,519 3,810,7581976 2000 905,696 2,816,266 3,402,7651977 2001 767,024 2,073,621 2,588,6331978 2002 908,182 2,242,423 2,332,9681979 2003 1,046,407 2,719,964 2,475,5191980 2004 1,179,314 2,661,949 2,170,6631981 2005 1,273,143 2,187,661 1,816,1341982 2006 1,305,025 2,691,137 2,205,7561983 2007 866,336 2,111,123 1,926,6191984 2008 853,183 1,397,720 1,079,0171985 2009 731,759 1,531,851 1,225,8711986 2010 524,523 1,183,829 999,0551987 2011 423,921 986,426 745,5061988 2012 476,516 1,121,184 794,669
Average Ending Balance 840,697 1,943,528 2,124,126
www.7TwelvePortfolio.com
Retirement Distribution Portfolio Ending Account Balances (1970-2012)
$250,000 starting balance, 5% initial withdrawal, 3% annual increase in withdrawal Total amount withdrawn over each 25-year period = $455,741
35$180,598 higher average

Part Two: 7Twelve Portfolio model
www.7TwelvePortfolio.com 36
Building a Multi-Asset Low Correlation Portfolio
The 7Twelve® Portfolio
• 7 Core Asset Classesutilizing
• 12 Underlying Funds
www.7TwelvePortfolio.com 37
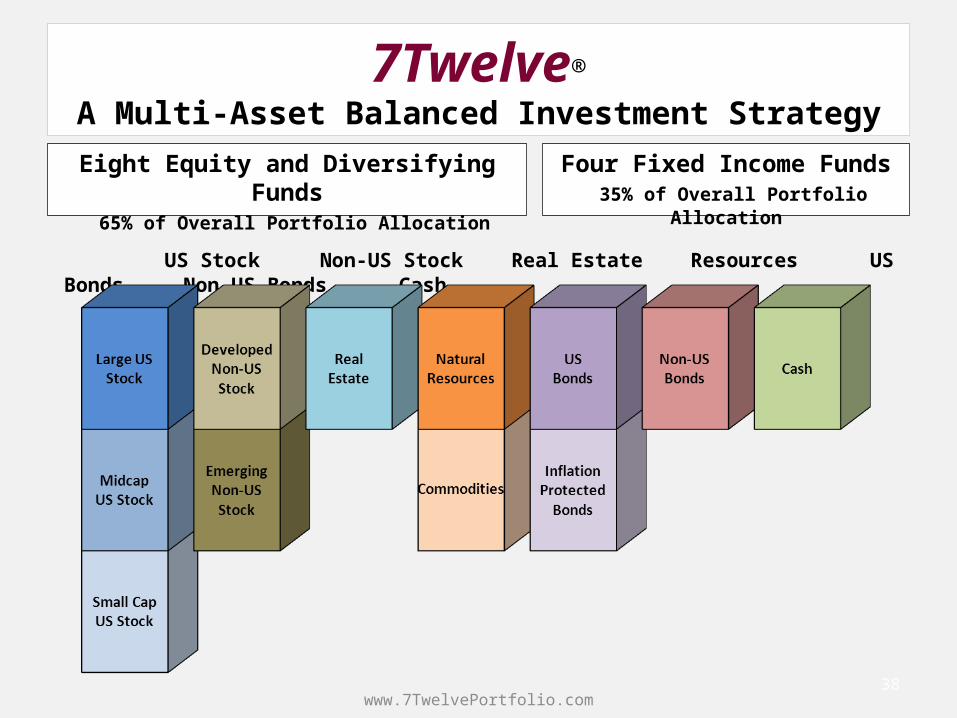
7Twelve®
A Multi-Asset Balanced Investment Strategy
www.7TwelvePortfolio.com38
Eight Equity and Diversifying Funds 65% of Overall Portfolio Allocation
Four Fixed Income Funds 35% of Overall Portfolio Allocation
US Stock Non-US Stock Real Estate Resources US Bonds Non-US Bonds Cash

www.7TwelvePortfolio.com 39
Large US Stock 8.33%
Mid Cap US Stock 8.33%
Small US Stock 8.33%
Non-US Stock 8.33%
Emerging Markets 8.33%Real Estate
8.33%Natural Resources 8.33%
Commodities 8.33%
US Bonds 8.33%
International Bonds 8.33%
TIPS 8.33%
Cash 8.33%
7TwelveAll 12 funds are equally weighted in the “core” model
Old vs. New
8.3%
8.3%
8.3%
8.3%
8.3%
8.3%8.3%
8.3%
8.3%
8.3%
8.3%
8.3%
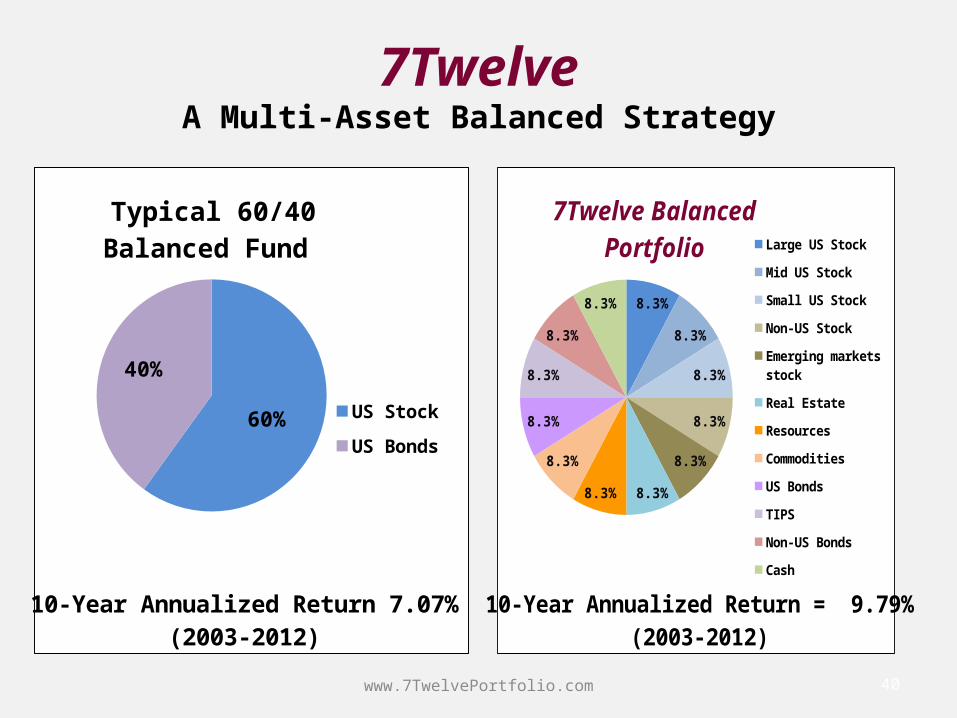
7Twelve Balanced PortfolioLarge US Stock
Mid US Stock
Small US Stock
Non-US Stock
Emerging markets stock
Real Estate
Resources
Commodities
US Bonds
TIPS
Non-US Bonds
Cash
10-Year Annualized Return = 9.79%(2003-2012)
www.7TwelvePortfolio.com
60%
40%
Typical 60/40 Balanced Fund
US Stock
US Bonds
10-Year Annualized Return 7.07%(2003-2012)
7TwelveA Multi-Asset Balanced Strategy
40
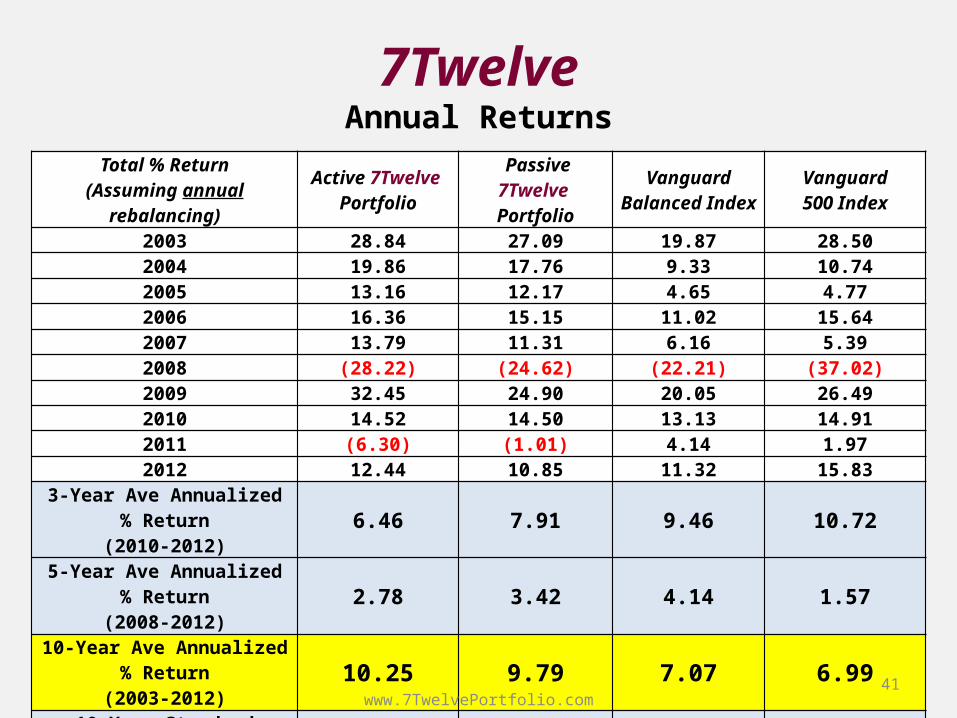
Total % Return(Assuming annual rebalancing)
Active 7Twelve Portfolio
Passive 7Twelve Portfolio
VanguardBalanced Index
Vanguard500 Index
2003 28.84 27.09 19.87 28.502004 19.86 17.76 9.33 10.742005 13.16 12.17 4.65 4.772006 16.36 15.15 11.02 15.642007 13.79 11.31 6.16 5.392008 (28.22) (24.62) (22.21) (37.02)2009 32.45 24.90 20.05 26.492010 14.52 14.50 13.13 14.912011 (6.30) (1.01) 4.14 1.972012 12.44 10.85 11.32 15.83
3-Year Ave Annualized % Return(2010-2012) 6.46 7.91 9.46 10.72
5-Year Ave Annualized % Return(2008-2012) 2.78 3.42 4.14 1.57
10-Year Ave Annualized % Return(2003-2012) 10.25 9.79 7.07 6.99
10-Year Standard Deviation of Monthly Returns (2003-2012) 13.1 12.6 9.3 14.8
Annual % Expense Ratio 0.66 0.29 0.24 0.17
www.7TwelvePortfolio.com41
7TwelveAnnual Returns

7Twelve10-year Growth of $10,000
www.7TwelvePortfolio.com42
Vanguard 500 Index
$19,645
Vanguard Balanced In-dex $19,797
Passive 7Twelve$25,455
Active 7Twelve$26,539
January 1, 2003 to December 31, 2012
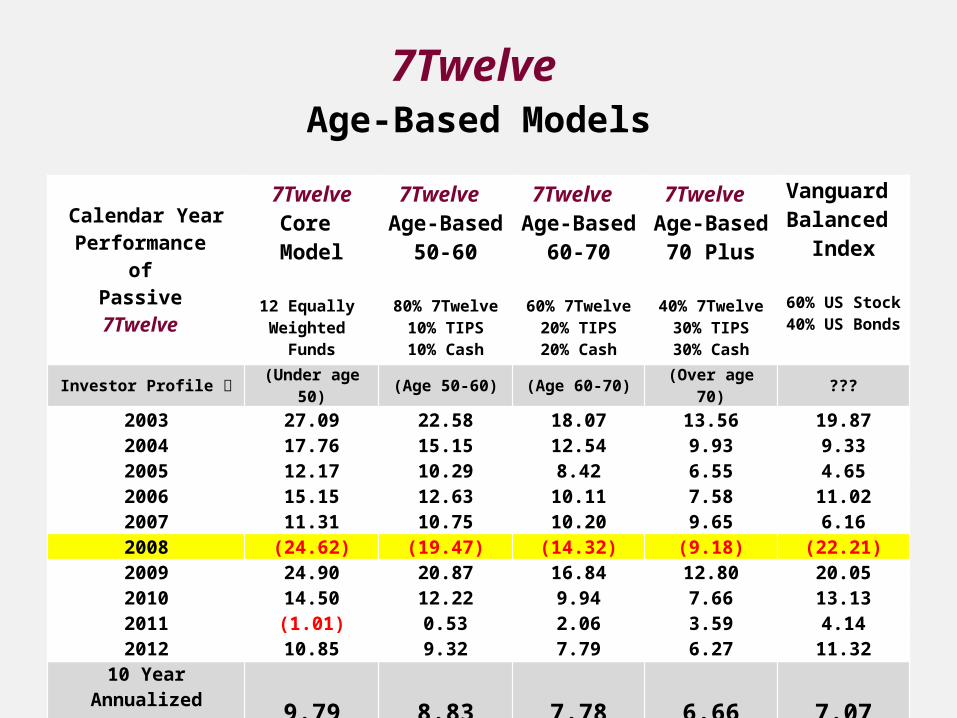
Calendar Year Performance
of Passive 7Twelve
7Twelve Core
Model
12 Equally Weighted
Funds
7Twelve Age-Based
50-60
80% 7Twelve10% TIPS10% Cash
7Twelve Age-Based
60-70
60% 7Twelve20% TIPS20% Cash
7Twelve Age-Based
70 Plus
40% 7Twelve30% TIPS30% Cash
Vanguard Balanced
Index
60% US Stock40% US Bonds
Investor Profile (Under age 50) (Age 50-60) (Age 60-70) (Over age 70) ???
2003 27.09 22.58 18.07 13.56 19.872004 17.76 15.15 12.54 9.93 9.332005 12.17 10.29 8.42 6.55 4.652006 15.15 12.63 10.11 7.58 11.022007 11.31 10.75 10.20 9.65 6.162008 (24.62) (19.47) (14.32) (9.18) (22.21)2009 24.90 20.87 16.84 12.80 20.052010 14.50 12.22 9.94 7.66 13.132011 (1.01) 0.53 2.06 3.59 4.142012 10.85 9.32 7.79 6.27 11.32
10 YearAnnualized Return
(2003-2012)9.79 8.83 7.78 6.66 7.07
7Twelve Age-Based Models
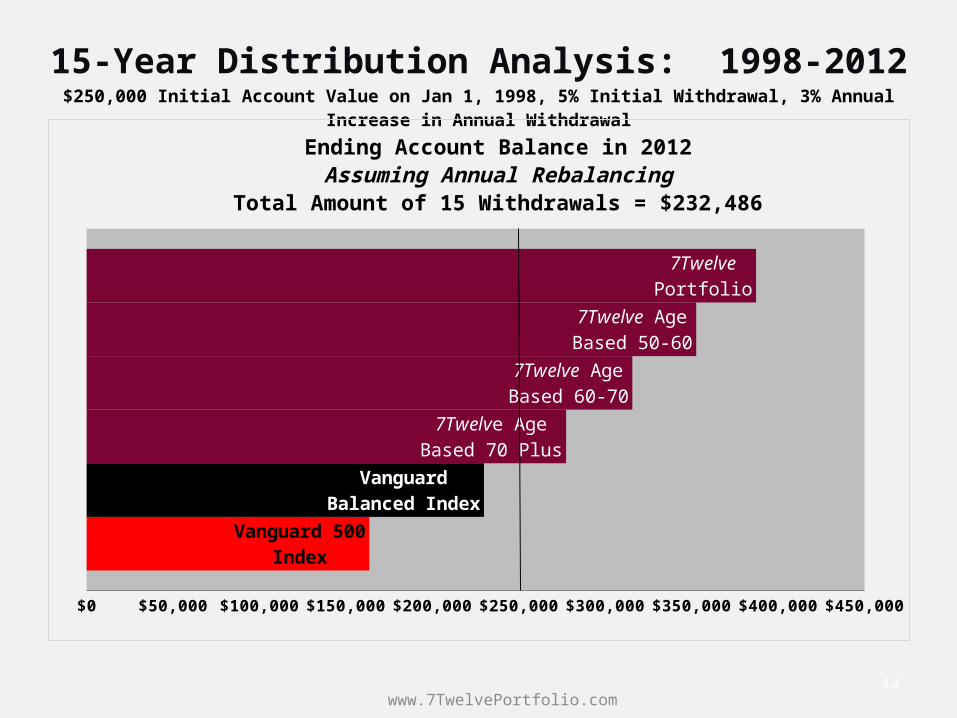
15-Year Distribution Analysis: 1998-2012$250,000 Initial Account Value on Jan 1, 1998, 5% Initial Withdrawal, 3% Annual Increase in Annual Withdrawal
www.7TwelvePortfolio.com44
$0 $50,000 $100,000 $150,000 $200,000 $250,000 $300,000 $350,000 $400,000 $450,000
Vanguard 500 Index
Vanguard Balanced Index
7Twelve Age Based 70 Plus
7Twelve Age Based 60-70
7Twelve Age Based 50-60
7Twelve Portfolio
Ending Account Balance in 2012Assuming Annual Rebalancing
Total Amount of 15 Withdrawals = $232,486
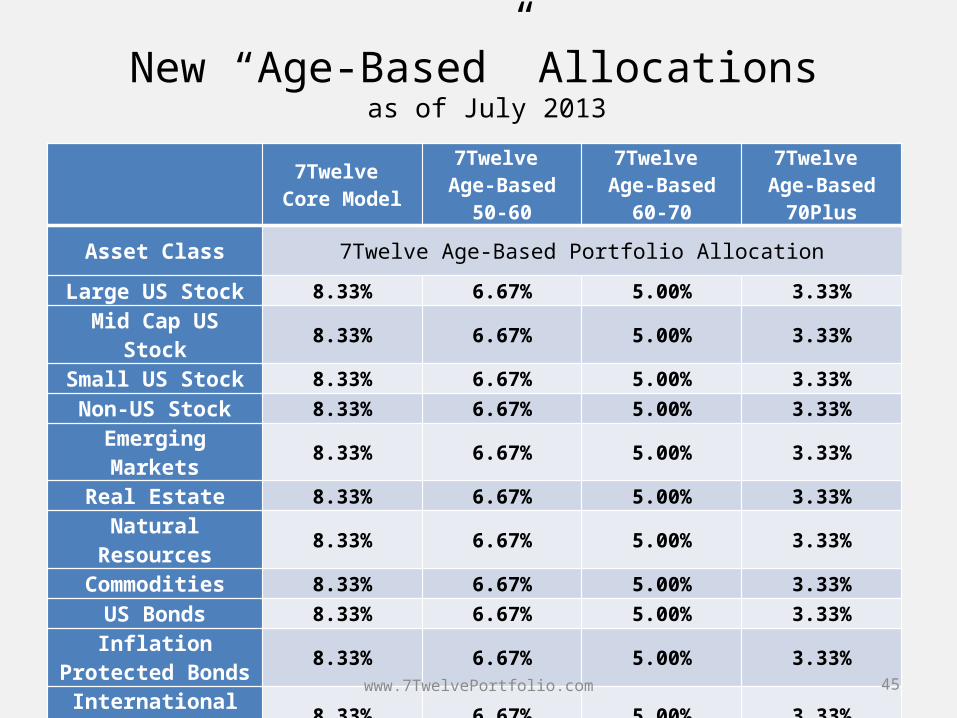
New “Age-Based” Allocations as of July 2013
7Twelve Core Model
7Twelve Age-Based 50-60
7Twelve Age-Based 60-70
7Twelve Age-Based 70Plus
Asset Class 7Twelve Age-Based Portfolio Allocation
Large US Stock 8.33% 6.67% 5.00% 3.33%Mid Cap US Stock 8.33% 6.67% 5.00% 3.33%
Small US Stock 8.33% 6.67% 5.00% 3.33%Non-US Stock 8.33% 6.67% 5.00% 3.33%
Emerging Markets 8.33% 6.67% 5.00% 3.33%Real Estate 8.33% 6.67% 5.00% 3.33%
Natural Resources 8.33% 6.67% 5.00% 3.33%Commodities 8.33% 6.67% 5.00% 3.33%
US Bonds 8.33% 6.67% 5.00% 3.33%Inflation Protected
Bonds 8.33% 6.67% 5.00% 3.33%
International Bonds 8.33% 6.67% 5.00% 3.33%Cash 8.33% 26.67% 45.00% 63.33%
www.7TwelvePortfolio.com 45
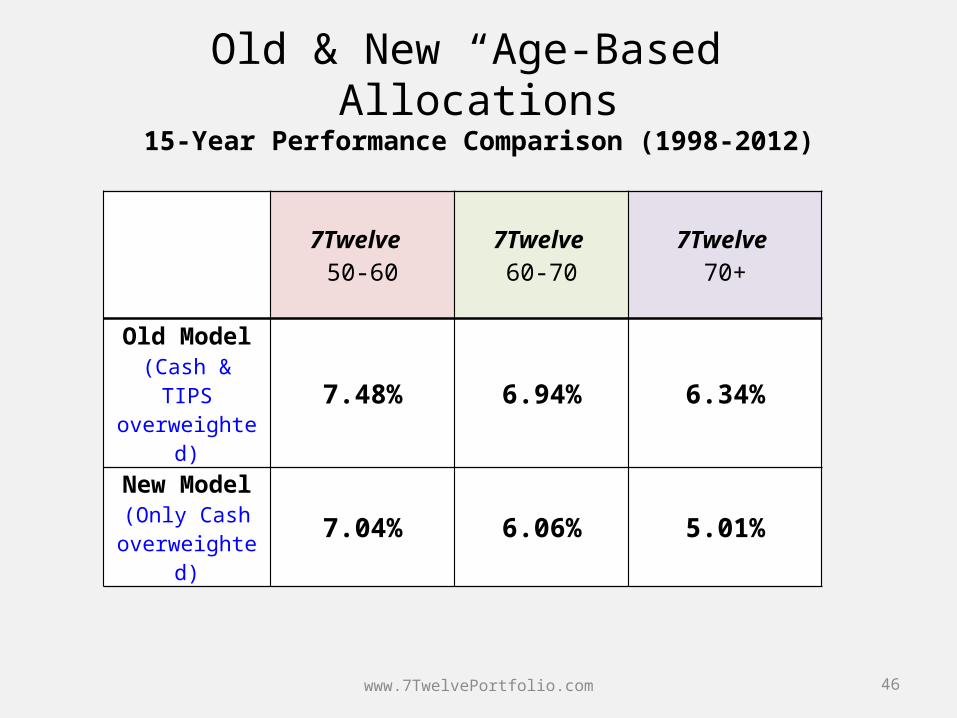
Old & New “Age-Based” Allocations15-Year Performance Comparison (1998-2012)
www.7TwelvePortfolio.com 46
7Twelve 50-60
7Twelve 60-70
7Twelve 70+
Old Model(Cash & TIPS
overweighted)7.48% 6.94% 6.34%
New Model(Only Cash
overweighted)7.04% 6.06% 5.01%
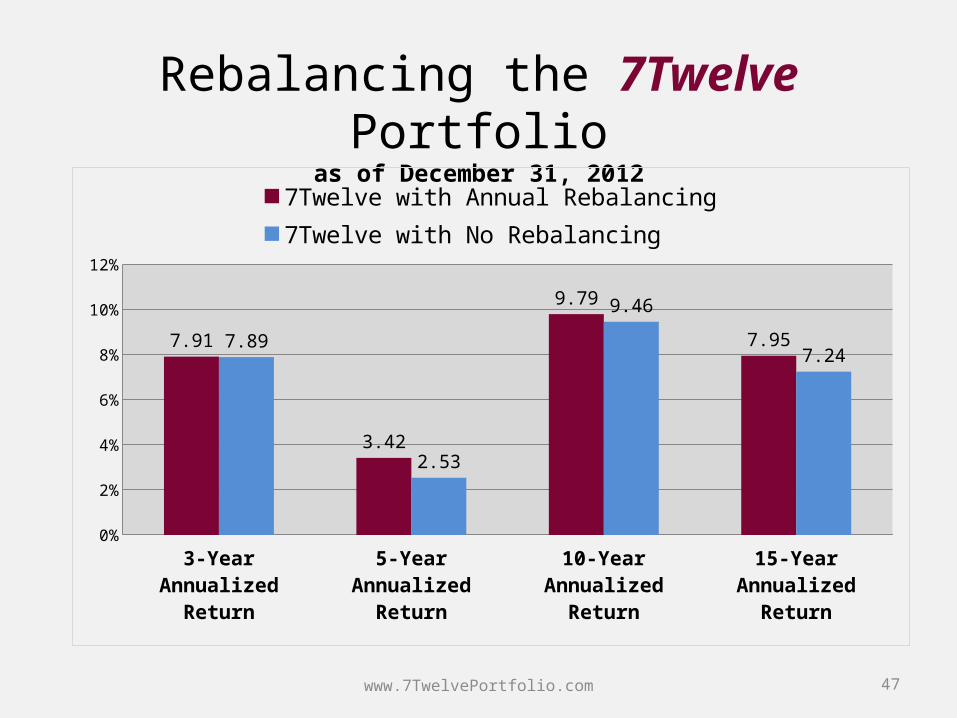
Rebalancing the 7Twelve Portfolioas of December 31, 2012
www.7TwelvePortfolio.com 47
3-Year Annualized Return
5-Year Annualized Return
10-Year Annualized Return
15-Year Annualized Return
0%
2%
4%
6%
8%
10%
12%
7.91
3.42
9.79
7.957.89
2.53
9.46
7.24
7Twelve with Annual Rebalancing 7Twelve with No Rebalancing
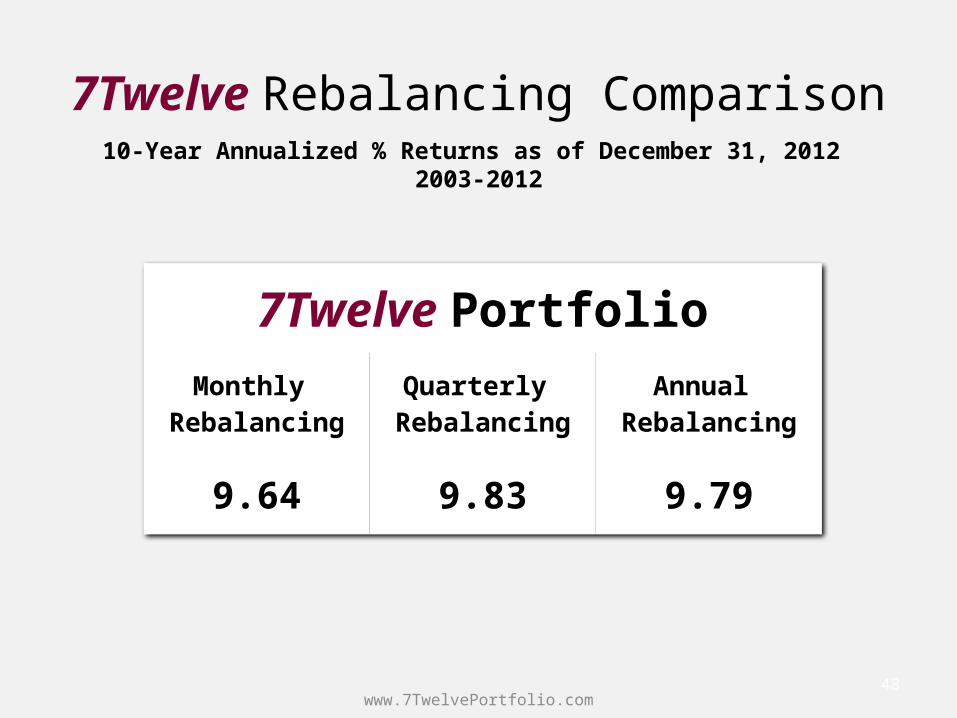
7Twelve Rebalancing Comparison10-Year Annualized % Returns as of December 31, 2012
2003-2012
7Twelve PortfolioMonthly
RebalancingQuarterly
RebalancingAnnual
Rebalancing
9.64 9.83 9.79
www.7TwelvePortfolio.com48
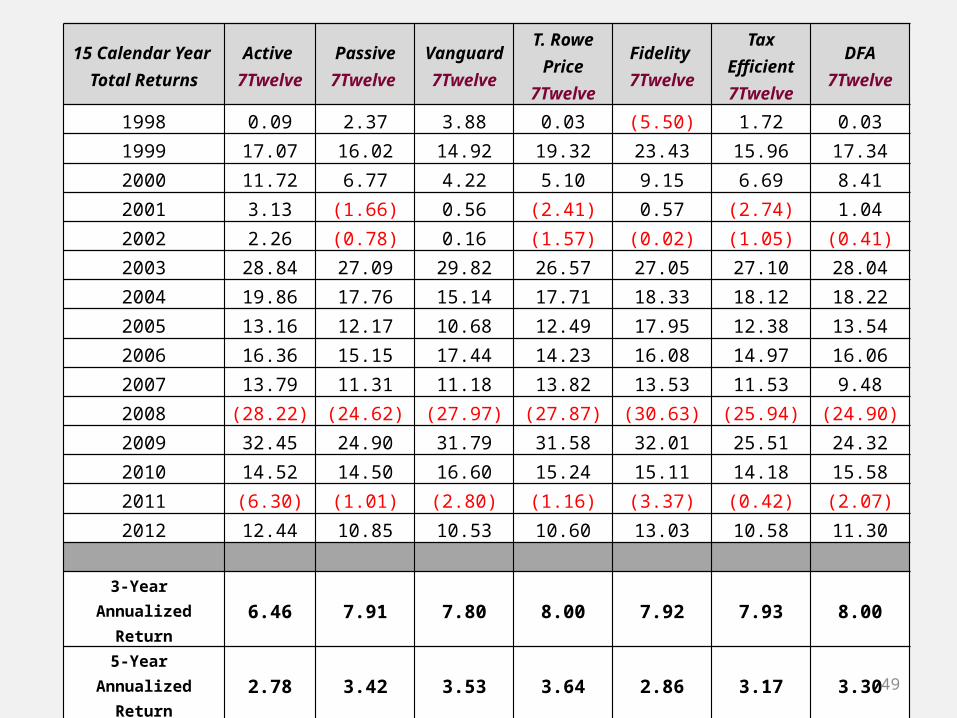
15 Calendar Year Total Returns
Active 7Twelve
Passive 7Twelve
Vanguard 7Twelve
T. Rowe Price
7Twelve
Fidelity 7Twelve
Tax Efficient 7Twelve
DFA 7Twelve
1998 0.09 2.37 3.88 0.03 (5.50) 1.72 0.031999 17.07 16.02 14.92 19.32 23.43 15.96 17.342000 11.72 6.77 4.22 5.10 9.15 6.69 8.412001 3.13 (1.66) 0.56 (2.41) 0.57 (2.74) 1.042002 2.26 (0.78) 0.16 (1.57) (0.02) (1.05) (0.41)2003 28.84 27.09 29.82 26.57 27.05 27.10 28.042004 19.86 17.76 15.14 17.71 18.33 18.12 18.222005 13.16 12.17 10.68 12.49 17.95 12.38 13.542006 16.36 15.15 17.44 14.23 16.08 14.97 16.062007 13.79 11.31 11.18 13.82 13.53 11.53 9.482008 (28.22) (24.62) (27.97) (27.87) (30.63) (25.94) (24.90)2009 32.45 24.90 31.79 31.58 32.01 25.51 24.322010 14.52 14.50 16.60 15.24 15.11 14.18 15.582011 (6.30) (1.01) (2.80) (1.16) (3.37) (0.42) (2.07)2012 12.44 10.85 10.53 10.60 13.03 10.58 11.30
3-Year
Annualized Return 6.46 7.91 7.80 8.00 7.92 7.93 8.00
5-Year Annualized Return 2.78 3.42 3.53 3.64 2.86 3.17 3.30
10-Year Annualized Return 10.25 9.79 9.89 10.05 10.40 9.72 9.89
15-Year Annualized Return 9.04 7.95 8.11 7.93 8.59 7.75 8.26 49
For more information about the 7Twelve portfolio please visit
www.7TwelvePortfolio.com
To purchase 7Twelve Portfolio Research Reports click below:
http://www.7twelveportfolio.com/Downloads/Web7TwelveReport.pdf
www.7TwelvePortfolio.com 51

Craig L. Israelsen, Ph.D.
Email: [email protected]
Web: www.7TwelvePortfolio.com
www.7TwelvePortfolio.com
The 7Twelve® Portfolio
52

Fixed Income: What to Do Going Forward?
www.7TwelvePortfolio.com 53
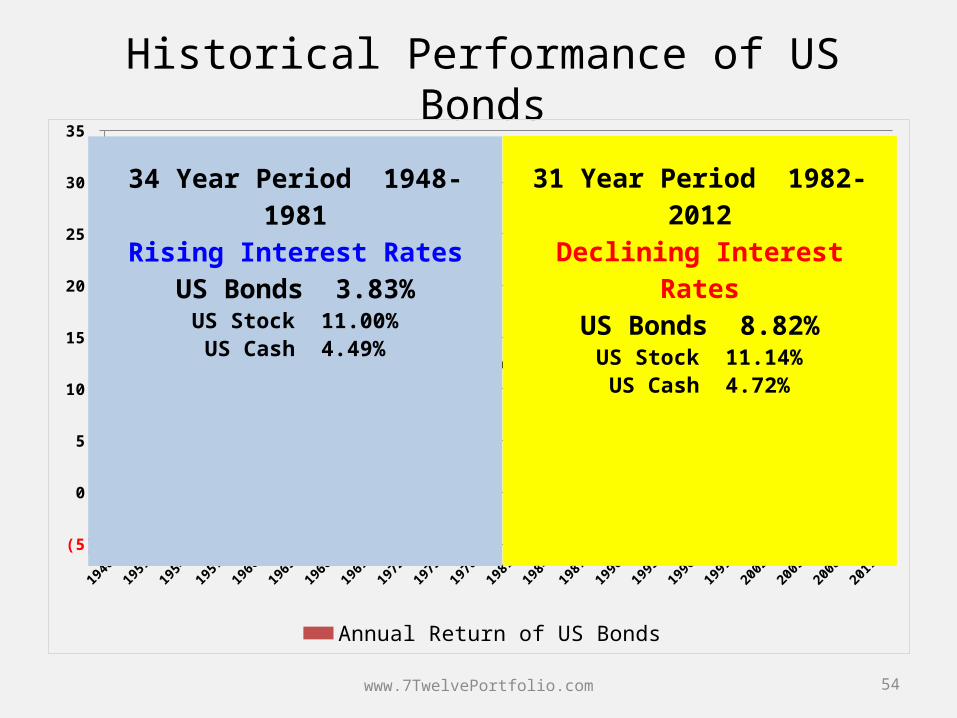
Historical Performance of US Bonds
www.7TwelvePortfolio.com 54
19481950
19521954
19561958
19601962
19641966
19681970
19721974
19761978
19801982
19841986
19881990
19921994
19961998
20002002
20042006
20082010
(5)
0
5
10
15
20
25
30
35
Annual Return of US Bonds Federal Discount Rate
34 Year Period 1948-1981Rising Interest Rates
US Bonds 3.83%US Stock 11.00%US Cash 4.49%
31 Year Period 1982-2012Declining Interest Rates
US Bonds 8.82%US Stock 11.14%US Cash 4.72%
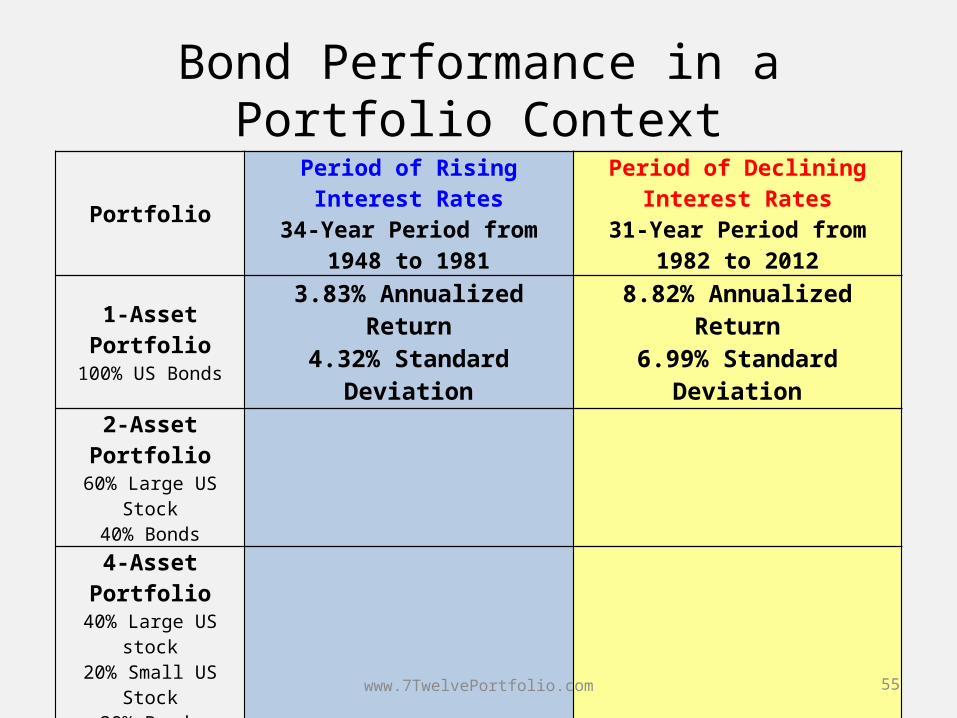
Bond Performance in a Portfolio Context
Portfolio Period of Rising Interest Rates34-Year Period from 1948 to 1981
Period of Declining Interest Rates31-Year Period from 1982 to 2012
1-Asset Portfolio100% US Bonds
3.83% Annualized Return4.32% Standard Deviation
8.82% Annualized Return6.99% Standard Deviation
2-Asset Portfolio60% Large US Stock
40% Bonds
4-Asset Portfolio40% Large US stock20% Small US Stock
30% Bonds10% Cash
www.7TwelvePortfolio.com 55
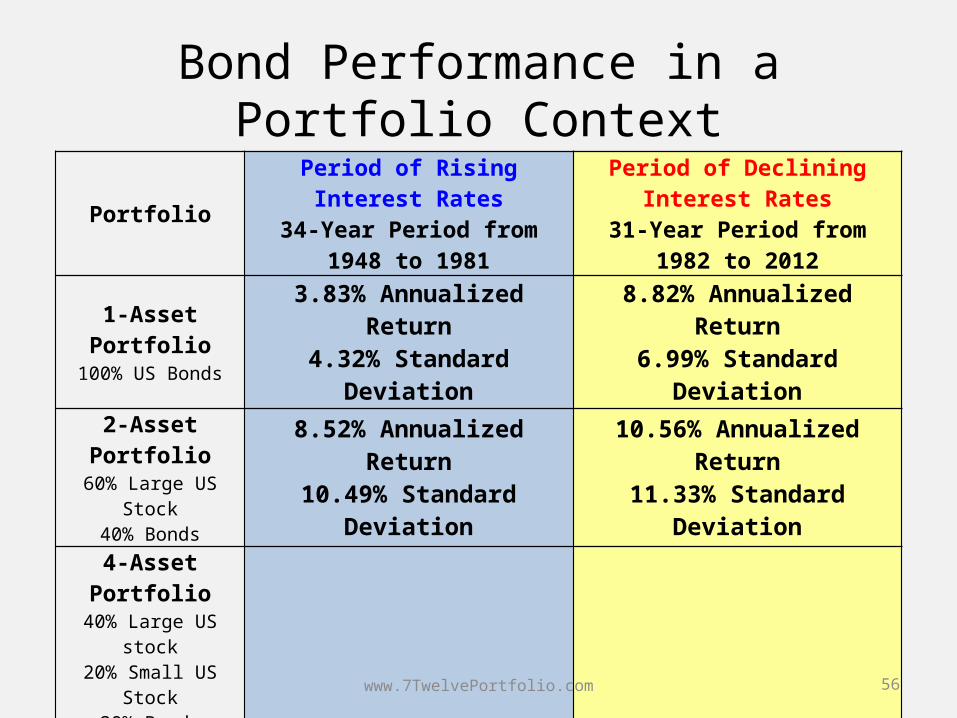
Bond Performance in a Portfolio Context
Portfolio Period of Rising Interest Rates34-Year Period from 1948 to 1981
Period of Declining Interest Rates31-Year Period from 1982 to 2012
1-Asset Portfolio100% US Bonds
3.83% Annualized Return4.32% Standard Deviation
8.82% Annualized Return6.99% Standard Deviation
2-Asset Portfolio60% Large US Stock
40% Bonds
8.52% Annualized Return10.49% Standard Deviation
10.56% Annualized Return11.33% Standard Deviation
4-Asset Portfolio40% Large US stock20% Small US Stock
30% Bonds10% Cash
www.7TwelvePortfolio.com 56
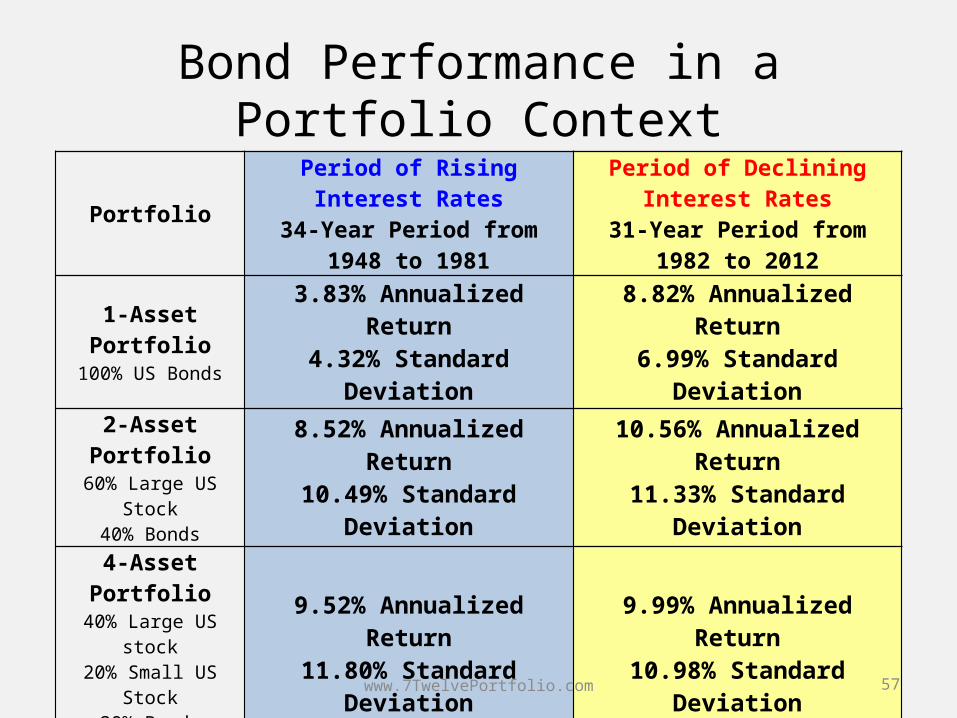
Bond Performance in a Portfolio Context
Portfolio Period of Rising Interest Rates34-Year Period from 1948 to 1981
Period of Declining Interest Rates31-Year Period from 1982 to 2012
1-Asset Portfolio100% US Bonds
3.83% Annualized Return4.32% Standard Deviation
8.82% Annualized Return6.99% Standard Deviation
2-Asset Portfolio60% Large US Stock
40% Bonds
8.52% Annualized Return10.49% Standard Deviation
10.56% Annualized Return11.33% Standard Deviation
4-Asset Portfolio40% Large US stock20% Small US Stock
30% Bonds10% Cash
9.52% Annualized Return11.80% Standard Deviation
9.99% Annualized Return10.98% Standard Deviation
www.7TwelvePortfolio.com 57
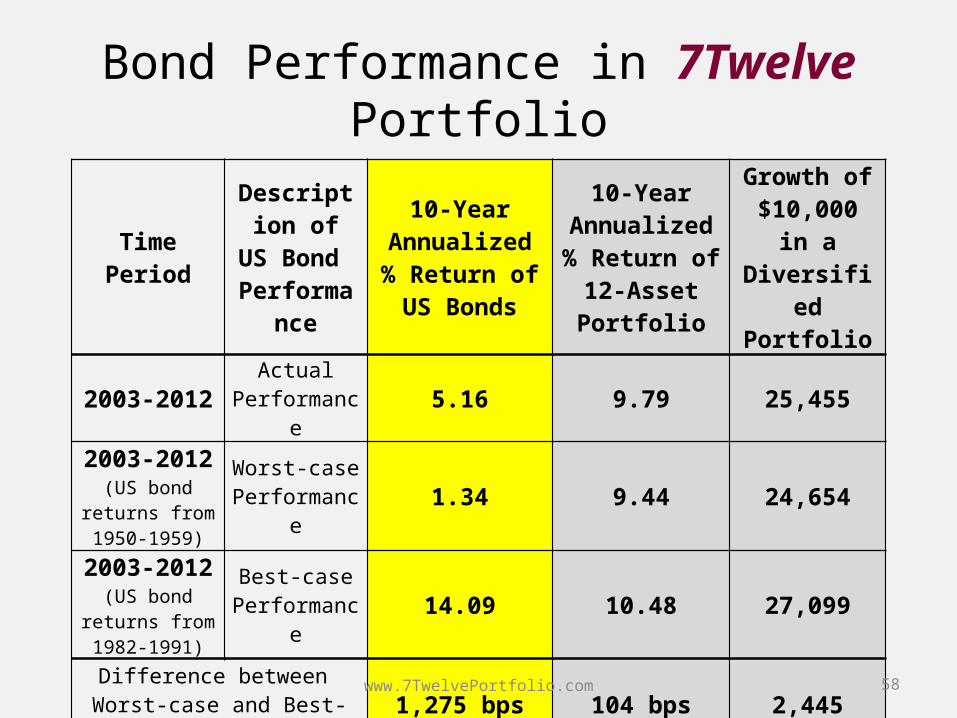
Bond Performance in 7Twelve Portfolio
Time PeriodDescription of US Bond
Performance
10-Year Annualized %
Return of US Bonds
10-Year Annualized %
Return of 12-Asset Portfolio
Growth of $10,000 in a Diversified Portfolio
2003-2012 Actual Performance 5.16 9.79 25,455
2003-2012(US bond returns from 1950-1959)
Worst-casePerformance 1.34 9.44 24,654
2003-2012(US bond returns from 1982-1991)
Best-case Performance 14.09 10.48 27,099
Difference between Worst-case and Best-case Bond
Performance1,275 bps 104 bps 2,445
www.7TwelvePortfolio.com 58


