Page 1
Policy Research Working Paper 7413
The ABCs of Financial Education
Experimental Evidence on Attitudes, Behavior, and Cognitive Biases
Fenella CarpenaShawn Cole
Jeremy ShapiroBilal Zia
Development Research GroupFinance and Private Sector Development TeamSeptember 2015
WPS7413P
ublic
Dis
clos
ure
Aut
horiz
edP
ublic
Dis
clos
ure
Aut
horiz
edP
ublic
Dis
clos
ure
Aut
horiz
edP
ublic
Dis
clos
ure
Aut
horiz
ed
Page 2
Produced by the Research Support Team
Abstract
The Policy Research Working Paper Series disseminates the findings of work in progress to encourage the exchange of ideas about development issues. An objective of the series is to get the findings out quickly, even if the presentations are less than fully polished. The papers carry the names of the authors and should be cited accordingly. The findings, interpretations, and conclusions expressed in this paper are entirely those of the authors. They do not necessarily represent the views of the International Bank for Reconstruction and Development/World Bank and its affiliated organizations, or those of the Executive Directors of the World Bank or the governments they represent.
Policy Research Working Paper 7413
This paper is a product of the Finance and Private Sector Development Team, Development Research Group. It is part of a larger effort by the World Bank to provide open access to its research and make a contribution to development policy discussions around the world. Policy Research Working Papers are also posted on the Web at http://econ.worldbank.org. The corresponding author may be contacted at [email protected] .
This paper uses a large scale field experiment in India to study attitudinal, behavioral, and cognitive constraints that stymie the link between financial education and financial outcomes. The study complements financial education with (i) participant classroom motivation with pay for performance on a knowledge test, (ii) intensity of treatment with personalized financial counseling, and
(iii) behavioral nudges with financial goal setting. The analysis finds no impact of pay for performance but sig-nificant effects of both counseling and goal setting on real financial outcomes. These results identify important com-plements to financial education that can bridge the gap between financial knowledge and financial behavior change.
Page 3
The ABCs of Financial Education: Experimental Evidence on Attitudes, Behavior, and
Cognitive Biases
Fenella Carpena, Shawn Cole, Jeremy Shapiro, and Bilal Zia1
JEL Codes: C93, D14, G21, O12
1 University of California at Berkeley ([email protected] ), Harvard Business School ([email protected] ),
Princeton University ([email protected] ), and the World Bank ([email protected] ), respectively. We are
very grateful to Saath Microfinance for their constant support. We thank Stuti Tripathi, Bhakti Shah, and the Center
for Microfinance at the Institute for Financial Management and Research (IFMR) for excellent field work and research
assistance. We also thank Anamaria Lusardi, David McKenzie, Xavier Gine, Arie Kapteyn, and seminar participants
at the World Bank, Harvard, and the AEA meetings for comments, and the World Bank Development Impact blog
and the World Bank All About Finance blog for coverage.
Page 4
2
1. Introduction
In the wake of the recent global financial crisis, many policy makers have argued that lack of
financial education was a contributing factor to the market turmoil (Lusardi and Mitchell, 2013).
As a result, financial education programs are currently at the forefront of the post-crisis reform
agenda.2 Other macroeconomic and technological trends are also prompting such demand. With
the explosive growth of microfinance and the emergence of mobile money in many parts of the
world, policymakers and NGOs are urging more widespread financial awareness and knowledge
to enable the poor to better understand and utilize the new financial products at their disposal.3
Thus, a consensus has emerged around the need to expand financial education in the developed
and developing world. Such policies may be critical not only to improving household welfare, but
also to ensuring a stable financial system. Despite the theoretical benefits of greater financial
education, however, the empirical evidence supporting such benefits is limited and offers mixed
results.
While an abundance of survey data indicates a positive correlation between financial education
and better financial decisions, causal analysis remains scarce. Moreover, what causal evidence
exists does not provide a clear picture of the impact of financial education on ultimate financial
outcomes. The results vary from positive, such as the improved business practices of micro-
entrepreneurs in response to “rule of thumb” financial education (Drexler et al., 2013), to zero,
shown by the lack of impact on savings from financial education in Indonesia (Cole et al., 2011),
to outright failure, such as a video and radio based financial education course that was discontinued
2 The United States adopted a President’s Advisory Council on Financial Literacy in 2008 to help promote financial
education at all levels of the economy; the UK government mandated compulsory financial education in schools from
2012 onwards; the Indonesian government declared 2008 as the year of financial education; the Reserve Bank of India
launched a series of financial literacy and counseling centers across the country in 2007; Brazil and many other
developing countries have incorporated national strategies for improving financial education; and private and
multilateral agencies such as Citibank and the World Bank have multi-million dollar programs on financial education
throughout the developed and developing world.
3 See for example, “Financial Literacy: A Step for Clients towards Financial Inclusion,” Global Microcredit Summit
Commissioned Workshop Paper, November 14-17, 2011.
Page 5
3
due to logistical challenges and low take-up (Chong et al., 2010). One leading explanation for the
disparate effects is the heterogeneous collection of financial education programs studied. Programs
available in the literature consist of wide variation in topics covered, training emphasis, and
medium of instruction, among other dimensions (see Fernandes et al. 2013; Xu and Zia, 2013; and
Miller et al. 2014 for literature reviews). A limitation of the existing literature is that it generally
does not identify nor isolate the specific components that contribute to particular program’s
effectiveness. Thus, policy-makers face the sub-optimal choice of supporting potentially
ineffective programs or throwing the baby out with the bathwater.
In this paper, we strive to fill this gap in the literature by exploring which aspects of financial
education interventions facilitate informed economic decision-making, and where the link between
financial education and financial outcomes might break down in unsuccessful programs.
Specifically, we consider three frictions that may prevent financial education from benefitting
recipients if not specifically addressed in the program. First, we consider the role of participant
motivation to determine whether limited desire for financial education can be a source of program
failure. Second, we consider program intensity and personalization to ascertain whether
unsuccessful programs simply do not provide enough information and reinforcement. Third, we
assess whether behavioral factors play a role in translating financial knowledge into action, as
individuals may fail to act on their knowledge due to cognitive or behavioral limitations.
To investigate these issues, we conduct a randomized evaluation with a large study sample of over
1,300 individuals in an urban city in India. Two-thirds of this sample was randomly selected to
receive a five-week, high quality, video-based financial education program on budgeting, savings,
credit, and insurance. The remaining one-third of the sample received health training, with similar
video-based and logistical format, to control for Hawthorne effects.
Since the main thrust of our study is to examine factors that channel financial education
interventions to improved financial outcomes, we combine financial education with three separate
treatments, all randomly assigned at the individual level. First we test the importance of participant
motivation on the efficacy of financial education. Drawing inspiration from the education literature
that has found significant improvements in exam scores due to monetary incentives (Angrist and
Page 6
4
Lavy, 2009), we experimentally vary motivation by offering half of the sample participants cash
incentives for correct answers on a financial knowledge test (i.e., “pay for performance”). If
individuals’ existing financial habits are deeply ingrained or “sticky,” they may not be interested
in learning from financial training or may need external incentives to do so. Indeed, existing
financial education studies have found low interest among adults in joining a financial education
workshop, as well as relatively low attendance rates during the course of the program (Bruhn et
al., 2013).
Second, we investigate the hypothesis that, although individuals may be motivated to learn,
traditional financial education courses may be insufficient to foster the skills necessary to improve
financial decisions because they do not address an individual’s unique needs. Specifically, we
induce experimental variation in the intensity and personalization of financial education by
delivering additional financial counseling services to half of the financial education treatment
group. The effectiveness of such individual counseling has been well-proven in the medical and
mental health fields, where interactions with counselors helps to adapt generic advice into
actionable items that individuals can readily implement (e.g., Lerman et al., 1995; Marcus et al.,
1998; Proper et al., 2003; Rimer and Kreuter, 2006). In our setting, this financial counseling
treatment provides individuals with both intensive instruction and individualized advice, given that
people in different situations need correspondingly different approaches. For example, participants
can have a one-on-one tutorial with the counselor about the general steps in writing a budget. They
may also ask for assistance in drafting a budget for their particular household, or seek advice on
ways to minimize their own family’s expenses.
Finally, our third treatment explores behavior change barriers interrupting the link between
financial knowledge and financial outcomes. That is, individuals may have the motivation to learn
and may have adequate tools to make informed financial choices, but they may face behavioral
constraints in converting their financial knowledge into concrete action (Mullainathan and Shafir,
2009 and 2013). We experimentally relax such behavioral impediments by encouraging half of the
participants in the financial education treatment group to set short-term, visible, and achievable
financial goals. By prompting respondents to designate target dates for completing financial
planning goals (e.g., start putting money aside as saving each week), this intervention may provide
Page 7
5
direction, invoke energy, and affect persistence among participants (Locke and Latham, 2002).
This approach is similarly employed in a variety of fields, including household energy
consumption conservation (Abrahamse et al., 2007) and organizational behavior (Gist, 1987),
where concrete goal-setting techniques have been widely studied. Concrete goal setting has also
been shown to affect financial decisions on savings, spending, and debt repayments (e.g. Agarwal
et al. 2014; Bartels and Sussman 2015; Salisbury 2014; Soman and Zhao 2011; and Ülkümen and
Cheema 2011).
Our findings corroborate results in the existing literature that financial education alone generally
fails to achieve positive impact on financial outcomes. While the classroom-based financial
education program we delivered to all treatment groups significantly improved participants’
financial attitudes and awareness about the details and benefits of financial products, the training
on its own did not bring about changes in financial behavior. Importantly, we also find that the pay
for performance treatment had no substantial impact on the multiple dimensions of financial
knowledge we measured on follow-up tests. This result implies that lack of motivation was likely
not a key hindrance to learning financial concepts, and is consistent with the fact that attendance
at our five-week financial education course was close to 100%. Furthermore, this finding indicates
that individuals in our study face barriers other than motivation to learn, which impede the link
between financial education training and financial outcomes.
Our results on the goal setting treatment indicate that behavioral factors are at work in preventing
the knowledge gained in financial literacy training from influencing future actions. Specifically,
we find that combining goal setting with financial education fostered relatively simple follow-up
actions, such as attempting to write a budget, starting informal savings, and avoiding borrowing
for unforeseen expenses. Thus combining simple strategies to overcome behavioral barriers such
as procrastination and forgetfulness can result in increased impact. These strategies, however,
appear limited in catalyzing more difficult behavioral changes. For example, we do not find that
those who received the goal setting treatment were more likely to regularly write a budget or open
a formal bank savings account.
Page 8
6
Encouragingly, we find that the intensity and personalization of financial education support can
enable individuals to undertake these more costly or difficult actions to better manage their
finances. We find that individualized counseling led to significant and economically meaningful
improvements in ongoing budgeting and holding a formal bank account. Furthermore, we find that
the sample population receiving all three treatments in financial education, counseling and goal-
setting (that is, a very high intensity treatment) exhibited larger positive changes on all outcomes
we examined, relative to those who received financial education alone.
Taken together, our results confirm the hypothesis that individuals often face multiple constraints
in improving financial behavior. While financial education alone may be relatively ineffective in
improving outcomes, bundling such training with inexpensive but personalized add-ons, such as
counseling and goal-setting, results in a potent combination, leading to meaningful impacts on
both financial knowledge and behavior.
More generally, our findings suggest that traditional financial education programs, especially those
implemented in a group setting with a one-size-fits-all approach, may be inadequate in equipping
individuals with the appropriate tools to bridge the gap between financial knowledge and financial
behavior. Nevertheless, we do not view this as evidence to warrant broad pessimism about
financial education programs. Rather, this evidence builds on prior research and expands our
understanding of the factors that enable financial knowledge to become financial actions –
providing personally relevant support, adequate intensity of information, and overcoming
behavioral limitations to change. This can enable policy makers and NGOs to design and
implement more effective financial education support for development impact.
The rest of this paper proceeds as follows. Section 2 describes the sample and study design. Section
3 presents the empirical strategy, summary statistics, and randomization checks, and Section 4
discusses the results. Section 5 concludes with the implications of the study. Appendices 1 and 2
provide the content of our financial education and health videos and present the financial
knowledge survey questions, respectively.
Page 9
7
2. Sample and Study Design
Our study sample consists of over 1,300 urban poor households in Ahmedabad, a metropolitan city
in the state of Gujarat, India. To manage the large sample size, we conducted the study in four
waves. The sample size in each wave is reported in Table 1, Panel A. Respondents came from
different chalis (neighborhoods) which were mutually exclusive across waves. Furthermore, all
respondents were associated with Saath, our non-government partner organization. About half
were clients of Saath’s microfinance services, while the other half were participants of Saath’s
other urban development programs such as livelihood training.
The study design consists of two main components. First, two-thirds of the study sample was
randomly selected to take part in a comprehensive classroom-based financial education program.
The remaining one-thirds of the sample was invited to attend a similar classroom-based health
education program. Second, the design includes three additional treatments: pay for performance,
financial counseling, and goal setting, which are described in detail below.
The pay for performance treatment was randomly assigned within the classroom treatment arms,
wherein half the financial education group and half the health education group were offered
financial incentives for correct answers on a follow-up knowledge test. The goal setting and
financial counseling treatments were randomly assigned among the financial education treatment
group.
Table 1, Panels B and C indicate the percentage of our sample that received these treatments. We
also note that treatments were stratified in each wave based on the respondent’s gender, whether
the respondent was currently a client of Saath microfinance, and their chali (neighborhood).
Data collection included a comprehensive baseline survey followed by program implementation,
a post-intervention knowledge survey administered in the respondents’ households three weeks
after the final training session, and a final endline survey implemented ten months later.
Page 10
8
2.1 Classroom-Based Financial Education
First we discuss the overarching financial education intervention comprising the research study
design. Prior to delivering experimental “add-on” treatments, a comprehensive classroom-based
financial education program was delivered to the main treatment group. Two-thirds of all sample
participants were invited on a randomized basis to attend a video-based financial education training
program. The remaining one-third of sample participants formed the control group and was invited
to video-based training on health.
Both financial education and health training programs consisted of five consecutive weekly
sessions, each lasting two to three hours. To control for Hawthorne-type effects, the control group
was provided with health training instead of no training at all to ensure that both treatment and
control experienced similar levels of “disruption” in their everyday activities due to the weekly
sessions.
All respondents were assigned to attend a particular treatment or control class of about 20
participants. For each wave of the study there were about 15 classes (10 treatment and 5 control),
which met at the same time every week for the duration of the program. Classes were held at a
nearby training center equipped with computers, where the respondents watched their respective
training videos. All respondents received a Rs. 50 (US$ 1) show-up fee for each session they
attended, and were provided free transportation to and from their homes to the training center for
each visit.
The financial education videos included the following five topics: budgeting, savings, loans,
insurance, and a final summary video. The health training videos covered topics unrelated to
financial knowledge, specifically: cleanliness and hygiene, midwifery, maternal and child health,
condoms, AIDS and syphilis, and night-blindness. The financial education videos were produced
by a professional company with significant feedback from us and used popular local actors. The
starting scripts were provided by us and included standard materials previously used in the
literature. Through continuous interactions between researchers and the production company, we
aligned the scripts to the local context and piloted several rounds on local audiences before
Page 11
9
finalizing the videos. The study team did not produce the health videos; rather, we utilized videos
previously used in Gujarat by the United Nations for health education promotion.
Each financial and health session was followed by a group discussion led by a trained instructor
who summarized the main points of each video and answered outstanding questions. Appendix I
explains the content of both the financial education and health modules further.
2.2 Additional Treatments
In the following sub-sections, we describe three different treatment interventions – pay for
performance, individualized financial counseling, and goal setting – that were delivered on a
randomized basis at the individual level to test cognitive and behavioral constraints to acquisition
and application of financial education. For each treatment, we present the literature supporting
these strategies, followed by a discussion of our operationalization of the treatments.
2.2.1 Pay for Performance
The objective of the pay for performance treatment was to test whether financial learning is
constrained by motivational factors in addition to the knowledge barriers examined with
classroom-based financial education training. By offering payments for correct responses on a
knowledge-based exam, the treatment assessed whether concrete monetary incentives can more
effectively induce individuals to lean, retain, and apply financial knowledge.
Monetary incentives have been shown in the literature to advance general education outcomes. In
a notable study conducted by Angrist and Lavy (2010) in Israel, a significant increase in high
school certification rates was observed for low-performing female students who received
experimental cash incentives. In North America, Angrist and Lang (2009) found similar effects
produced by a combination of academic support services and financial payments, which led to
higher grades for female college freshmen.
In our study, monetary incentives were provided to participants based on their scores in a survey
measuring financial or health knowledge acquired in the trainings. Half the participants – selected
individually at random and independent of their financial education treatment status – were paid
Page 12
10
for correct answers to questions related to the videos they watched (i.e. health training participants
received compensation for health test questions, and financial education training participants
received compensation for financial test questions). The other half were paid for correct answers
to questions that were not covered in their video training (i.e. financial education training
participants got paid for health test questions, and vice versa). Participants were informed at the
beginning of the training program whether the content of their video training program determined
their compensation in the follow up survey. Moreover, respondents were reminded individually
about their pay for performance treatment status before each of the five training sessions.
Respondents received Rs. 10 for each question that they answered correctly.
The post-intervention knowledge tests, administered three weeks after classes ended, consisted of
three sets of financial literacy questions that were aimed at measuring the impact of financial
education on various dimension of financial knowledge (see Appendix 2 for the exact wording of
these questions). The first set of questions tested financial numeracy. Respondents were asked
questions that involved numerical calculations, such as comparing monthly versus weekly interest
rates and adding household income/expenses. The second set of questions measured respondents’
financial awareness. These focused not on computation but instead on general concepts related to
financial products and financial planning. For example, respondents were asked about the purpose
of a household budget, minimum bank account opening requirements, and whether bank savings
accounts had deposit insurance. Finally, the third set of questions assessed financial attitudes and
perceptions, measured by asking respondents what financial advice they would give to their
friends. For instance, respondents were asked whether they would suggest buying insurance or
increasing savings to a friend who had a risky job.
2.2.2 Individualized Counseling
An important research question we address in this study is whether the intensity of financial
education and the medium in which it is delivered affects knowledge acquisition and application.
Our hypothesis is that traditional classroom-based financial education trainings may be
insufficiently suited to individuals’ specific learning needs. We test the role of the education
medium by supplementing the financial education trainings with individualized counseling. This
treatment consisted of one-on-one, in-person counseling at home, where the counselors aided in
Page 13
11
tasks such as preparing a budget, opening a bank account, paying a loan, or buying insurance. Such
counseling may be more effective in changing behavior as it provides guidance specific to the
needs of the participant.
Medical and public health studies have found individualized or segmented counseling to be
effective in promoting better health behaviors. For example, individualized risk counseling for
women with a family history of breast cancer has been shown to improve understanding of their
personal risk (Lerman et al. 1995). Similarly, Proper et al. (2003) find positive and significant
effects of individual counseling on physical fitness. In the financial context, Dalal and Morduch
(2010) find that having an insurance representative present after trainings significantly improves
take-up rates. Similarly, Bertrand et al. (2006) find that allowing banking workshop participants
the opportunity to complete account opening paperwork as part of the learning workshop and
having a bank representative present on-site significantly improves take-up and adoption of
complementary banking products such as ATM cards, direct deposit, and electronic fund transfers.
Finally, psychologists have long advocated the benefits of human interaction in individualized
counseling over inanimate information sources such as pamphlets, text messages, or computer
messages (King, 2007).
The counseling treatment in our study was randomly assigned among financial education
participants. Half were randomly selected to receive an offer of financial counseling, independent
of their goal setting treatment status. Specifically, within one month of the classroom sessions,
financial counselors visited the counseling treatment group in their homes to provide
individualized financial counseling services. The financial counselors assisted participants on
several issues – including, but not limited to, preparing a budget, opening a bank account, paying
off or re-financing loans, and purchasing an insurance policy – depending on their individual
needs. Financial counselors were trained rigorously by our partner research organization in India,
the Center for Microfinance, prior to visiting respondents.4
4 See Appendix 2 for more details on the services provided by the financial counselor.
Page 14
12
2.2.3 Concrete Goal Setting
The final treatment in our study was designed to test the behavioral effect of procrastination on
financial outcomes. We theorize that procrastination may be an impediment to the conversion of
financial knowledge into positive financial outcomes. To examine this behavioral constraint, we
implemented a treatment that encouraged sample participants to set concrete financial goals with
designated completion dates.
Concrete goal-setting is a technique studied in a variety of fields, from conserving household
energy consumption (Abrahamse et al. 2007) to organizational behavior (Gist 1987). The literature
identifies three main mechanisms by which goals can affect performance outcomes. Specific goals
can provide direction, invoke energy, and affect persistence (Locke and Latham, 2002). Goals
provide direction by focusing the participant’s attention and effort towards activities related to the
goal. Rothkopf and Billington (1979) had high school students study a passage with goal-relevant
and non-relevant text. Recording students’ eye movements revealed that students fixated on goal-
relevant sentences over twice as long as non-relevant sentences due to the direction provided by
the goals. Goals also serve as an energizing function. Bandura and Cervone (1983) evaluated the
effort of subjects performing a strenuous task and found that the subjects with goals and
performance feedback exerted significantly more physical effort. Finally, goals affect persistence.
LaPorte and Nath (1976) found that subjects presented with a difficult goal for answering questions
correctly about a reading passage studied longer with greater persistence, and produced more
correct answers when tested.
Goal setting has also been shown to be important in financial decision-making. Existing research
has looked at the effect of goal setting among consumers on payment, spending, and saving
behavior. Confronted with different credit card payment options, consumers’ individual financial
goals often determine the payment amount selected (Bartels and Sussman 2015; Salisbury 2014;
and Agarwal et al. 2014). Thaler (1999) and Soman and Cheema (2011) further explore goal setting
as a form of “mental accounting” and find that people are more disposed to honor spending targets
that are earmarked for certain product categories. Moreover, financial goals have been widely
shown to influence consumer savings (Shefrin and Thaler 1988; Soman and Cheema 2004), with
potentially disparate outcomes depending on the type of savings goal. Soman and Zhao (2011)
Page 15
13
find that a single savings goal is more likely to be attained, whereas setting multiple goals may
dilute the importance of each goal. Ülkümen and Cheema (2011) observe that for more ambitious
savings targets, having concrete goals as opposed to general goals can increase the perceived
importance of and commitment to the target.
In our study, the goal setting treatment was administered to respondents who received the financial
education treatment. Among this pool, half the sample was randomly selected to receive a goal
setting treatment, while the remaining half formed the control group. The goal setting assignment
was orthogonal to the financial counseling assignment. Treated individuals received a household
visit and were first asked about whether they currently used, or planned to use, financial services
and financial planning tools. Next, they were asked to set a target date for several concrete financial
planning goals (i.e. opening a savings account, increasing savings, reducing expenditure,
purchasing insurance). These target dates were then marked on a calendar provided to respondents
at no cost.
Further, to isolate the effect of goal setting versus the effect of the household visit, the goal setting
control group was visited by surveyors as well and was asked about their use of financial services.
However, they were not asked to set a target date for financial goals or provided with free
calendars. Both goal setting treatment and control household visits happened within four weeks of
the follow up survey on financial knowledge.
3. Empirical Methodology and Summary Statistics
3.1. Empirical Methodology
The main analysis of this paper estimates causal impacts on financial knowledge and behavior.
First, we analyze impacts on three distinct components of financial knowledge, namely financial
numeracy, awareness, and attitudes. We study pay for performance impacts using both data from
the short-term survey and long-term persistence using endline data.
Since financial education and pay for performance were orthogonal treatments both randomized
at the individual level, we estimate causal effects on financial knowledge with the following OLS
model:
Page 16
14
𝑌𝑖 = 𝛼 + 𝛽1𝐹𝑖𝑛𝐸𝑑𝑖 + 𝛽2𝑃𝑎𝑦 𝑓𝑜𝑟 𝑃𝑒𝑟𝑓𝑖 + 𝛽3𝐹𝑖𝑛𝐸𝑑 𝑎𝑛𝑑 𝑃𝑎𝑦 𝑓𝑜𝑟 𝑃𝑒𝑟𝑓𝑖 +
∑ 𝑆𝑡𝑟𝑎𝑡𝑎 𝐷𝑢𝑚𝑚𝑦𝑖𝑘 + 𝜖𝑖𝑘 (1)
Where outcomes Y represent financial knowledge measures from the survey; FinEd is a dummy
equal to 1 for an individual i who was assigned the financial education treatment; Pay for Perf is
a dummy equal to 1 for the an individual i who was offered pay for performance on financial
knowledge questions; and FinEd and Pay for Perf is the interaction term.
Next, we estimate treatment impacts on financial behavior using endline data. Since we have three
treatments (financial education alone, financial education with counseling, and financial education
with goal setting), we analyze results with a saturated model to simplify interpretation:
𝑌𝑖 = 𝛼 + 𝛽1𝐹𝑖𝑛𝐸𝑑𝑖 + 𝛽2𝐹𝑖𝑛𝐸𝑑 𝑎𝑛𝑑 𝐺𝑜𝑎𝑙𝑖 + 𝛽3𝐹𝑖𝑛𝐸𝑑 𝑎𝑛𝑑 𝐶𝑜𝑢𝑛𝑠𝑖
+ 𝛽4𝐹𝑖𝑛𝐸𝑑 𝑎𝑛𝑑 𝐶𝑜𝑢𝑛𝑠 𝑎𝑛𝑑 𝐺𝑜𝑎𝑙𝑖
+ ∑ 𝑆𝑡𝑟𝑎𝑡𝑎 𝐷𝑢𝑚𝑚𝑦𝑖𝑘 + 𝜖𝑖
𝑘
(2)
Here, the outcomes Y represent responses to financial behavior questions from the endline survey.
FinEd is a dummy equal to 1 for an individual who received the financial education treatment, but
not the financial counseling or the goal setting treatments. FinEd and Goal is a dummy equal to 1
for an individual who received both the financial education and goal setting treatments, but not the
financial counseling treatment. Similarly, Fin Ed and Couns is a dummy equal to 1 for an
individual who received both financial education and counseling treatments, but not goal setting.
And finally, FinEd and Couns and Goal is a dummy equal to 1 for an individual who received all
three treatments. The omitted category is group that did not receive any financial education, the
control group.
For both equations (1) and (2), we include strata dummies for precision, since in each wave of the
study we stratified the randomization. Strata are defined by gender, whether the respondent is
currently a client of Saath microfinance, and neighborhood. We also note that since neighborhoods
were mutually exclusive across waves, we do not add wave fixed effects. Furthermore, in each
Page 17
15
study wave, participants were assigned to attend a particular class that met at the same time every
week for the duration of the training program. Classes consisted solely of either financial education
training participants or health training participants. In estimating equations (1) and (2), we cluster
standard errors at the wave-class level.
3.2 Summary Statistics and Randomization Checks
Baseline characteristics for our sample are presented in Table 2. Households in our sample
comprised 6 members on average, with a mean monthly income of Rs. 7017 (US$ 120). A little
more than half (58 percent) of our respondents were female, and a vast majority was married.
Respondents in our sample also had limited schooling, with 47 percent having completed
elementary school, but only 4 percent having completed secondary school.
In addition to standard data on household demographics and respondent characteristics, our
baseline survey measured financial knowledge, attitudes, and preferences. First, we note that
almost everyone in our sample (94 percent) reported having difficulty saving. Next, we measured
discount rates in the standard manner, by asking respondents to provide the minimum amount they
would be willing to hypothetically accept in one month in lieu of a hypothetical payment of Rs.
350 today. Respondents in our sample reported relatively high monthly discount rates: the median
was 0.14, while the average was 1.52. We also measured risk aversion by allowing respondents to
choose between a payment of Rs. 10 with certainty, or playing a lottery that pays out Rs. 25 or Rs.
0 with equal probability. 18 percent of our sample chose the safe payment, and these respondents
were coded as risk averse.
We also measured basic computational skills through a series of eight mathematics questions. The
mean score for these mathematics questions was 4.73 out of 8. We find similar computational skill
levels as in Cole, Sampson, and Zia (2011) in Indonesia. Specifically, almost all respondents could
answer a simple addition question (“How much is 4+3?”), but only about 50 percent was able to
answer a multiplication question correctly (“What is 3 multiplied by 6?”). Even fewer respondents
were able to make percentage calculations correctly (“What is 8 percent of 100?”), with close to
half responding “do not know” to this question.
Page 18
16
Finally, we measure baseline levels of financial knowledge based on the following three questions,
which are a standard set provided by Lusardi and Mitchell (2009): 1) “If you borrowed Rs. 5,500
and were charged 12 percent interest per month, how much interest would you pay in the first
month?”; 2) “Suppose you had Rs. 100 in a savings account and the same amount saved at home,
which of the two will yield returns at the end of the year?”; and 3) “Suppose your friend inherits
Rs. 10,000 today and his brother inherits Rs. 10,000 three years from now. Who is richer because
of the inheritance?” Measured financial literacy was low in our sample, with an average score of
1.6. Similar to the mathematics questions, few respondents (less than 10 percent) were able to
calculate interest rates correctly in question 1, and over 60 percent responded “do not know” to
this question. In contrast, almost all respondents were aware that a savings account yields positive
returns (question 2), but only 58 percent of our sample was able to correctly identify the time value
of money (question 3), lower than what Lusardi and Mitchell (2009) find among respondents in
the US.
Table 2 provides a test of the randomization. The p-values in column 4 report the statistical
significance of a joint test for the difference between the means across all treatments including the
control group. As the table shows, the p-values are fairly large suggesting no significant difference
across the treatments in baseline measures.
Finally, attrition in our sample was very low, at less than 6 percent of the entire sample over the
four waves from baseline to final follow-up. Classroom attendance likewise was not an issue, with
nearly full attendance across all sessions.
4. Results
In this section, we present and discuss results related to both short-term impacts on financial
knowledge, as well as longer-term impacts of the interventions on both financial knowledge and
Page 19
17
behavior.5 The specific behaviors we report are the ones targeted by the financial education
treatments: budgeting, savings, borrowing, and insurance adoption.
4.1. Financial Knowledge and Pay for Performance
Short-term effects of traditional financial education are varied, with no impact on participants’
financial numeracy scores but strong positive effects on aggregate measures of financial awareness
and attitudes. Table 3 presents results on aggregate measures of financial knowledge, while
Appendix Tables 1-3 present regression results on individual questions for each category of
numeracy, awareness, and attitudes. The longer term effects are likewise reported in Table 4
(aggregate measures) and Appendix Table 4 (individual questions).
We consider a variety of different outcome variables as proxies for financial numeracy, including
questions on selecting financial products and budgeting capabilities. The short-term results
presented in Table 3 and Appendix Table 1 indicate no impact on financial numeracy. Moreover,
even the addition of pay per performance did not yield a positive effect in the short-run on financial
numeracy skills. Table 4 and Appendix Table 4 validate these findings for the long-term as well.
Financial education failed to help individuals choose the loan option that minimizes expenses, to
select the most appropriate savings or insurance product, or to write a budget effectively.
Incentivizing individuals with payments on correct answers led to no significant improvement in
financial numeracy scores.
In contrast financial education does appear to create better overall financial awareness and improve
attitudes towards financial products. The results presented in Table 3 show that individuals who
received financial education alone improved financial awareness and financial attitudes by 7
percentage points and 8 percentage points, respectively compared to the control group. Analyzing
the individual questions in Appendix Table 2, those who received financial education were 15
percentage points more likely to know minimum bank account opening requirements, 12
5 A companion paper discusses measurement issues related to financial knowledge and how our measures of financial
knowledge allow for the disaggregation of impacts into the categories of numeracy, awareness, and attitudes. See
Carpena, et al. (2014).
Page 20
18
percentage points more likely to distinguish bank processing fees, and 20 percentage points more
likely to understand unproductive loans relative to the control group. Appendix Table 3 shows
similar positive impacts on short-term financial attitudes – when hypothetically asked to give
financial advice, treated individuals were 10 percentage points more likely to suggest insurance
cover for a dangerous work environment and 20 percentage points more likely to suggest making
a budget to track household income and expenditure relative to the control group. Table 4 and
Appendix Table 4 shows these results hold in the long run as well.
Notably though, the pay for performance treatment did not lead to any significant marginal
improvements over the standard curriculum on either of the aggregate measures of awareness or
attitudes. The results in Table 3 and 4 hence suggest that participant motivation was not a critical
barrier in improving financial knowledge in our sample.
4.2. Financial Behavior
Our analysis on financial behavior comes from the endline survey. Data from this survey also helps
distinguish impacts of additional treatments of individualized counseling and goal setting over
traditional financial education.
Budgeting
We first consider changes in household budgeting, the theme of one of the five financial education
video sessions, in Table 5. In columns (1), (3), and (5) we report impacts of being invited to any
financial education treatment on beliefs that budgeting is helpful (column 1), attempts to make a
budget in the last six months (column 3), and making a regular monthly budget (column 5).
Without distinguishing between treatments, we see a strong positive treatment effect on all these
dimensions, though the effects weaken as we move from beliefs to actions and outcomes.
Specifically, while those individuals invited to any financial education treatment were 22
percentage points more likely than the control group to understand the benefits of making a budget
and 28 percentage points more likely to have attempted to make a budget, they are only 3
percentage points more likely to actually make a regular budget every month.
Page 21
19
Next, we delve into mechanisms by analyzing the treatments separately in columns (2), (4), and
(6). Our results show that the medium of delivery makes a substantial difference in long-run
budgeting behavior. Providing classroom-based financial education alone generally yields smaller
results than when it is complemented with higher-intensity, personalized treatments. We find that
those who received the single financial education treatment were 17 percentage points more likely
than the control group to think that budgeting is helpful, while combining financial education with
the other two treatments yielded a 26.5 percentage points improvement. Importantly the p-value
on the F-test comparing all three treatments against financial education alone is 0.02, suggesting
significant marginal improvements over financial education alone due to the add-on treatments.
Similar results are reported when either goal setting or counseling alone are part of the financial
education package.
The table also shows interesting distinctions across treatments when moving from beliefs about
budgeting to action. Notably, the effect of financial education classes and goal setting is limited to
raising awareness about budgeting, but stops short of regular behavior change. For instance, in
column (4), those who were invited to financial education alone are 14 percentage points more
likely than the control group to have attempted to make a budget in the last six months, but this
effect disappears when it comes to making a regular monthly budget (column 6). Adding goal
setting improves the attempt to make a budget slightly to 17 percentage points (not statistically
distinguishable from financial education alone) but again the effect does not persist for regular
monthly budgets.
The significant effect on sustained behavior change comes from adding counseling to the mix.
Individuals invited to financial education with personal counseling are 38 percentage points more
likely to have attempted a budget and 4 percentage points more likely than the control group to
make a regular monthly budget. These effect sizes are even larger for the highest intensity
treatment (financial education with goal setting and counseling) at 43 percentage points and 5
percentage points, respectively.
The fact that financial counseling is key to sustained budgeting behavior is important. While
financial education classes and goal setting can highlight the importance of budgeting, individuals
Page 22
20
may still lack the necessary skills to actually maintain a regular budget given their unique
individual circumstances. Our results suggest that personalized counseling acts as a critical bridge
that enables individuals to apply their acquired financial knowledge to improve behavior.
Savings
We next turn to long-term impacts on household savings behavior in Table 6. In columns (1), (3),
and (5) we report impacts of being invited to any financial education treatment on holdings of
informal savings (column 1), holdings of formal savings (column 2), and investments in fixed or
recurring deposits (column 5).Without distinguishing between treatments, we find that participants
who received any form of financial education intervention were 2.8 percentage points more likely
to hold informal savings and 7.5 percentage points more likely to hold formal savings in a bank
account.
As with budgeting, the medium of instruction appears to matter for motivating sustained behavior
change. Interestingly, financial education alone produced no effect on any of the savings outcomes
we measured -- participants who received only the financial education treatment were no more
likely to hold savings, formally or informally. These findings suggest that it may be more difficult
to influence households’ savings compared to altering budgeting behavior by using a traditional
program of financial education. Classroom-based models may not be adequate to address cognitive
barriers or resource constraints that are likely to inhibit households from changing their current
savings practices.
The results on add-on treatments indicate that the type and intensity of the intervention has a
significant influence on savings. Incorporating goal setting and/or counseling did produce changes
in savings behavior and our results offer insights into the mechanism of impact. Specifically,
participants who received goal setting in addition to financial education were 4.7 percentage points
more likely than the control group to save informally (in a neighborhood fund or at home) and 6.3
percentage points more likely to save formally at a bank. Both these results are significant at the
10 percent level. Interestingly the results for counseling are different – we find no significant effect
of adding counseling on informal savings but a 13.8 percentage points improvement in the
likelihood of opening a formal bank account over the control group, a result that is statistically
Page 23
21
significant at the 1 percent level. The p-value on the F-test comparing the combined financial
education and counseling treatments against financial education alone is 0.007, suggesting
significant marginal improvements over financial education alone due to the add-on counseling
treatment.
These results suggest that while financial education classes and goal setting can inform and
encourage people to save, respectively, they still may lack the skills needed to open and maintain
a bank account. While goal setting did appear to lead to increase in the likelihood of savings, the
effects of counseling are honed in on formal savings, with an effect size more than double that of
goal setting. Counseling thus appears to enable participation in the formal financial sector and, as
with budgeting, serves as a bridge that enables individuals to convert their acquired financial
knowledge into financial actions.
Sustained behavior change in household savings – considered as investments in fixed or recurring
deposits (column 6) – appears more difficult to achieve. Combining financial education with both
goal setting and counseling led to a modest 3.9 percentage points increase in the likelihood of
repeated deposits; however, this result is only significant at the 10 percent level. Neither financial
education alone nor financial education combined with personalized counseling yields an effect
on fixed or recurring deposits.
Borrowing
The results for borrowing are presented in Table 7. In columns (1), (3), (5), (7), (9), and (11), we
report impacts of being invited to any financial education treatment on outstanding loans (column
1); planned borrowing in the next year (column 3); positive borrowing, e.g. for business, education,
or durable goods (column 5); negative borrowing for unforeseen circumstances (column 7);
borrowing to repay other debt (column 9); and general knowledge of loan terms (column 11).
Findings suggest that financial education yields only modest effects on household borrowing. We
observe no significant difference in outstanding loans, planned borrowing, and use of loans for
productive purposes among any of the treatment groups compared to the control group.
Page 24
22
As with budgeting and savings, the medium of instruction does appear important for influencing
certain household borrowing behaviors. Financial education alone had no impact on participants’
understanding of loan terms nor on their propensity to increase borrowing for productive purposes
and decrease borrowing for unproductive purposes. However, we observe a more positive impact
on borrowing practices when goal setting and financial counseling treatments are combined with
the classroom approach. When participants set performance goals, we observe a 2.5 percentage
points decrease in the likelihood of borrowing for unforeseen expenses, compared to no effect on
this type of borrowing when participants received just financial education (Table 6, column 8).
Participants exposed to a combination of all three treatments were also 15.1 percentage points
more likely to know the interest rate details of their loan, suggesting general awareness of
borrowing best practices is best enhanced through a combination of high-intensity interventions.
Insurance
The results for insurance as the outcome of interest are presented in Table 8. In columns (1), (3),
and (5) we report impacts of being invited to any financial education treatment on purchases of
life insurance (column 1), debt insurance (column 3), and health insurance (column 5) within the
last six months. Financial education generally had the poorest impact on insurance outcomes, with
very little adoption of insurance products in the six-to-ten months following the program.
While traditional financial education provided alone caused no significant changes in the take-up
of insurance products compared to the control group, there is some modest evidence that a
combination of high-intensity interventions can yield effects on adoption of certain types of
insurance. In particular, those who received all three treatments were 5.4 percentage points more
likely to purchase life insurance. However, these effects do not hold for other types of insurance,
such as debt or health insurance. No combination of financial education, goal setting, or counseling
enticed participants to purchase these products.
These results indicate that participants face additional cognitive and behavioral constraints to the
take-up of insurance. One reason is that participants may view insurance products as a luxury that
will not add value in the short run. Financial education will thus have a limited impact on insurance
adoption relative to budgeting and savings, which are cognitively and financially easier for
Page 25
23
participants to implement. Insurance products are also relatively new in India, and the absence of
peer effects and knowledge of long-term returns may partly explain participants’ reluctance to
purchase insurance. Due to these constraints, decisions regarding insurance may be more difficult
to influence through financial education compared to decisions regarding savings and budgeting.
5. Conclusion
This paper studies a large-scale field experiment among urban households in India to highlight the
limitations of financial education and identify important complements that can enable financial
education to successfully lead to financial behavior change. Specifically, we find that financial
education alone improves financial awareness and attitudes but falls short of improving longer
term behavioral outcomes on savings and borrowing. In comparison, the addition of individually
tailored interventions in the form of financial goal setting and particularly financial counseling are
more successful in helping individuals circumvent behavioral and cognitive constraints.
Taken together, our findings suggest that financial education can yield significant improvements
in financial knowledge and behavior when sufficient attention is paid to the delivery model.
Moreover, our results suggest that traditional classroom-based financial education alone has
limited ability to affect long-term financial behavior, whereas adding more personalized and
motivational complements can lead to sustainable behavior change in saving and borrowing
outcomes.
Page 26
24
References
Abrahamse, Wokje, Linda Steg, Charles Vlek, and Talib Rothengatter. "The effect of tailored
information, goal setting, and tailored feedback on household energy use, energy-related
behaviors, and behavioral antecedents." Journal of Environmental Psychology 27, no. 4
(2007): 265-276.
Agarwal, Sumit, Souphala Chomsisengphet, Neale Mahoney, and Johannes Stroebel. Regulating
consumer financial products: Evidence from credit cards. No. w19484. National Bureau
of Economic Research, 2013.
Angrist, Joshua, and Victor Lavy. "The effects of high stakes high school achievement awards:
Evidence from a randomized trial." The American Economic Review (2009): 1384-1414.
Angrist, Joshua, Victor Lavy, and Analia Schlosser. "Multiple experiments for the causal link
between the quantity and quality of children." Journal of Labor Economics 28, no. 4
(2010): 773-824.
Bandura, Albert, and Daniel Cervone. "Self-evaluative and self-efficacy mechanisms governing
the motivational effects of goal systems." Journal of personality and social psychology
45, no. 5 (1983): 1017.
Bartels, Daniel, and Sussman, Abigail. “The influence of goal-setting on credit card payment
decisions: A first look.” Yale Conference (2015).
Bertrand, Marianne, Sendhil Mullainathan, and Eldar Shafir. "Behavioral economics and
marketing in aid of decision making among the poor." Journal of Public Policy &
Marketing 25, no. 1 (2006): 8-23.
Bruhn, Miriam, Luciana de Souza Leão, Arianna Legovini, Rogelio Marchetti, and Bilal Zia.
"Financial education and behavior formation: large-scale experimental evidence from
Brazil." Presentation, World Bank, Washington, DC (2013).
Bryan, Judith F., and Edwin A. Locke. "Goal setting as a means of increasing motivation."
Journal of applied psychology 51, no. 3 (1967): 274.
Campbell, Marci Kramish, Brenda M. DeVellis, Victor J. Strecher, Alics S. Ammerman, Robert
F. DeVellis, and Robert S. Sandler. "Improving dietary behavior: the effectiveness of
tailored messages in primary care settings." American journal of public health 84, no. 5
(1994): 783-787.
Chong, Alberto, Dean Karlan, and Martin Valdivia. “Using radio and video as a means for
financial education in Peru.” Innovations for Poverty Action. Accessed: 17 May 2015.
http://www.povertyactionlab.org/evaluation/using-radio-and-video-means-financial-
education-peru.
Cole, Shawn, Thomas Sampson, and Bilal Zia. "Prices or knowledge? What drives demand for
financial services in emerging markets?." The Journal of Finance 66, no. 6 (2011): 1933-
1967.
Page 27
25
Dalal, Aparna, and Jonathan Morduch. The psychology of microinsurance: Small changes can
make a surprising difference. ILO, 2010.
Drexler, Alejandro, Greg Fischer, and Antoinette Schoar. "Keeping it simple: Financial literacy
and rules of thumb." American Economic Journal: Applied Economics 6, no. 2 (2014): 1-
31.
Fernandes, D., J. Lynch, and J. Netemeyer. "The effect of financial literacy and financial
education on downstream financial behaviours." National Endowment for Financial
Education (2013).
Gist, Marilyn E. "Self-efficacy: Implications for organizational behavior and human resource
management." Academy of management review 12, no. 3 (1987): 472-485.
Fry, Tim RL, Sandra Mihajilo, Roslyn Russell, and Robert Brooks. "The factors influencing saving
in a matched savings program: Goals, knowledge of payment instruments, and other
behavior." Journal of Family and Economic Issues 29, no. 2 (2008): 234-250.
Kurt, Lewin. "Field theory in social science." New York: Harper & Row, 1951.
King, Abby C., Robert Friedman, Bess Marcus, Cynthia Castro, Melissa Napolitano, David Ahn,
and Lawrence Baker. “Ongoing physical activity advice by humans versus computers:
The Community Health Advice by Telephone (CHAT) Trial.” Health Psychology 26, no.
6 (2007): 718.
Krishna, Santosh, Suzanne Austin Boren, and E. Andrew Balas. “Healthcare via cell phones: a
systematic review.” Telemedicine and e-Health 15, no. 3 (2009): 231-240.
Lancaster, Tim, and Lindsay F. Stead. “Individual behavioural counselling for smoking
cessation.” Cochrane Database Syst Rev 2 (2005).
LaPorte, Ronald E., and Raghu Nath. “Role of performance goals in prose learning.” Journal of
Educational Psychology 68, no. 3 (1976): 260.
Lerman, Caryn, Edward Lustbader, Barbara Rimer, Mary Daly, Suzanne Miller, Colleen Sands,
and Andrew Balshem. "Effects of individualized breast cancer risk counseling: a
randomized trial." Journal of the National Cancer Institute 87, no. 4 (1995): 286-292.
Lewin, Kurt, Tamara Dembo, Leon Festinger, and Pauline S. Sears. “Level of Aspiration.”
Personality and the behavior disorders (Vol. 1). New York: Ronald Press (1944).
Locke, Edwin A. and Gary P. Latham. “Building a practically useful theory of goal setting and
task motivation: A 35-year odyssey.” American psychologist 57, no. 9 (2002): 705.
Lusardi, Annamaria, and Olivia S. Mitchell. The economic importance of financial literacy:
Theory and evidence. No. w18952. National Bureau of Economic Research, 2013.
Page 28
26
Marcus, Bess H., Beth C. Bock, Bernardine M. Pinto, Leigh Ann H. Forsyth, Mary B. Roberts,
and Regina M. Traficante. "Efficacy of an individualized, motivationally-tailored
physical activity intervention." Annals of behavioral medicine 20, no. 3 (1998): 174-180.
McClelland, David C., John W. Atkinson, Russell A. Clark, and Edgar L. Lowell. “The
Achievement Motive.” New York: Appleton Century Crofts (1953).
Mento, Anthony J., Robert P. Steel, and Ronald J. Karren. "A meta-analytic study of the effects of
goal setting on task performance: 1966–1984." Organizational Behavior and Human
Decision Processes 39, no. 1 (1987): 52-83.
Miller, Margaret, Julia Reichelstein, Christian Salas, and Bilal Zia. "Can you help someone
become financially capable? a meta-analysis of the literature." A Meta-Analysis of the
Literature (January 1, 2014). World Bank Policy Research Working Paper 6745 (2014).
Mullainathan, Sendhil and Eldar Shafir “Savings Policy and Decision-making in Low-income
Households” in Michael Barr and Rebecca Blank (Eds.), Insufficient Funds: Savings,
Assets, Credit and Banking among Low-income Households. Russel Sage Foundation Press
(2009), pp. 121-145.
Mullainathan, Sendhil, and Eldar Shafir. Scarcity: Why having too little means so much.
Macmillan, 2013.
Noar, Seth M., Christina N. Benac, and Melissa S. Harris. “Does tailoring matter? Meta-analytic
review of tailored print health behavior change interventions.” Psychological bulletin
133, no. 4 (2007): 673.
Orleans, C. Tracy, Neal R. Boyd, Ruth Bingler, Charyn Sutton, Diane Fairclough, Debra Heller,
Maureen McClatchey et al. “A self-help intervention for African American smokers:
tailoring cancer information service counseling for a special population.” Preventive
medicine 27, no. 5 (1998): S61-S70.
Prochaska, James O., and Wayne F. Velicer. "The transtheoretical model of health behavior
change." American journal of health promotion 12, no. 1 (1997): 38-48.
Proper, Karin I., Vincent H. Hildebrandt, Allard J. Van der Beek, Jos WR Twisk, and Willem
Van Mechelen. "Effect of individual counseling on physical activity fitness and health: a
randomized controlled trial in a workplace setting." American journal of preventive
medicine 24, no. 3 (2003): 218-226.
Rimer, Barbara K., and Matthew W. Kreuter. "Advancing tailored health communication: A
persuasion and message effects perspective." Journal of Communication 56, no. s1
(2006): S184-S201.
Rothkopf, Ernst Z., and M. J. Billington. "Goal-guided learning from text: inferring a descriptive
processing model from inspection times and eye movements." Journal of educational
psychology 71, no. 3 (1979): 310.
Page 29
27
Ryan, Thomas A. “Intentional Behavior: An Approach to Human Motivation”. Ronald Press,
New York, 1970.
Salisbury, Linda Court. "Minimum Payment Warnings and Information Disclosure Effects on
Consumer Debt Repayment Decisions." Journal of Public Policy & Marketing 33, no. 1
(2014): 49-64.
Shefrin, Hersh M., and Richard H. Thaler. "The behavioral life‐cycle hypothesis." Economic
inquiry 26, no. 4 (1988): 609-643.
Soman, Dilip, and Amar Cheema. "When goals are counterproductive: the effects of violation of
a behavioral goal on subsequent performance." Journal of Consumer Research 31, no. 1
(2004): 52-62.
Cheema, Amar, and Dilip Soman. "The effect of partitions on controlling consumption." Journal
of Marketing Research 45, no. 6 (2008): 665-675.
Soman, Dilip, and Amar Cheema. "Earmarking and partitioning: increasing saving by low-
income households." Journal of Marketing Research 48, no. SPL (2011): S14-S22.
Soman, Dilip, and Min Zhao. "The fewer the better: Number of goals and savings behavior."
Journal of Marketing Research 48, no. 6 (2011): 944-957.
Steers, Richard M., and Lyman W. Porter. “The role of task-goal attributes in employee
performance.” Psychological bulletin 81, no. 7 (1974): 434.
Sussman, Abigail B., and Rourke L. O’Brien. "Saving for a Purpose: Financial Consequences of
Earmarking to Encourage Savings." Working Paper (2015).
Xu, Lisa, and Bilal Zia. "Financial literacy in the developing world." Available at SSRN 2248863
(2013).
Thaler, Richard H. “Mental accounting matters.” Journal of behavioral decision making 12, no.
3 (1999): 183-206.
Thaler, Richard H., and Shlomo Benartzi. “Save more tomorrow™: Using behavioral economics
to increase employee saving.” Journal of political Economy 112, no. S1 (2001): S164-
S187.
Ülkümen, Gülden, and Amar Cheema. “Framing goals to influence personal savings: The role of
specificity and construal level.” Journal of marketing research 48, no. 6 (2011): 958-969.
Vansteenkiste, Maarten, Joke Simons, Willy Lens, Kennon M. Sheldon, and Edward L. Deci.
“Motivating learning, performance, and persistence: the synergistic effects of intrinsic
goal contents and autonomy-supportive contexts.” Journal of personality and social
psychology 87, no. 2 (2004): 246.
Page 30
28
Wokje Abrahamse, Linda Steg, Charles Vlek, and Talib Rothengatter. “The effect of tailored
information, goal setting, and tailored feedback on household energy use, energy-related
behaviors, and behavioral antecedents.” Journal of environmental psychology 27, no. 4
(2007): 265-276.
Page 31
(1) (2) (3) (4) (5)
Panel A. Sample Size per Wave
Wave Sample Size
1 279
2 422
3 243
4 384
Total 1328
Panel B. Experimental Design: Financial Education and Pay for Performance
Financial
Education
Videos
Pay for
PerformanceN % of Sample
No No 218 16
No Yes 224 17
Yes No 445 34
Yes Yes 441 33
Panel C. Experimental Design: Financial Education and Additional Treatments
Financial
Education
Videos
Counseling Goal Setting N % of Sample
No No No 442 33
Yes No No 232 17
Yes No Yes 209 16
Yes Yes No 215 16
Yes Yes Yes 230 17
Table 1: Sample Size and Experimental Design
This table describes the sample size and experimental design. The study was conducted in
four waves and Panel A describes the number of respondents in each wave of the study.
Panel B and Panel C describe the experiment design and randomization across the various
treatments.
Page 32
(1) (2) (3)
Median MeanStandard
Deviation
Household characteristics
Household size 6.00 5.85 2.47 0.711
Household monthly income (Rs.) 5900.00 7017.48 5635.51 0.164
Household monthly income per capita (Rs.) 1050.00 1272.96 922.26 0.121
Household has phone 0.84 0.361
Household has non-farm enterprise 0.26 0.517
Household has water connection 0.77 0.813
Respondent characteristics
Female 0.58
Age 38.00 38.56 9.07 0.368
Married 0.98 0.503
Hindu 0.82 0.866
Completed elementary school 0.47 0.339
Completed secondary school 0.04 0.830
Saath MFI client 0.48
Cognitive ability score (out of 3) 2.00 1.61 0.62 0.215
Has hard time saving (self-report) 0.94 0.551
Interested in financial matters (self-report) 0.87 0.460
Monthly discount rate 0.14 1.52 4.72 0.087 *
Inconsistent time preferences 0.48 0.809
Risk averse 0.18 0.934
Test of Joint
Equality of Means
Across All
Treatments
(F-test p-value)
Table 2: Baseline Summary Statistics
This table provides baseline summary statistics for our sample which consists of urban poor households in Ahmedabad, India. Column
(4) reports the p-value of the F-test of joint significance across all treatment coefficients in regressions of the baseline characteristics
on treatment dummies. The four treatments are i) financial education video only, ii) financial education video and goal setting, iii)
financial education video and counseling, and iv) financial education video, goal setting and counseling. Column (4) regressions control
for strata dummies where a strata is defined by gender, location and whether the household was an MFI client. Standard errors are
clustered at the wave-class level. * indicates statistical significance at the 10% level.
(4)
Page 33
(1) (2) (3)
Aggregate Measure of
Financial Numeracy
Aggregate Measure of
Financial Awareness
Aggregate Measure of
Financial Attitudes
Financial Education -0.010 0.069*** 0.083**
(0.017) (0.016) (0.033)
Pay for Performance 0.001 0.001 -0.016
(0.018) (0.022) (0.050)
Interaction of Financial Education and Pay for Performance 0.005 0.014 0.002
(0.024) (0.025) (0.051)
R-squared 0.186 0.177 0.209
Number of Observations 1273 1004 599
Mean of Dependent Variable in Control Group 0.647 0.695 0.798
F-test p-value: Financial Education + Interaction = 0 0.792 0.000 0.009
Table 3: Short Term Impact on Financial Knowledge
This table presents regression results on short-term impacts from a survey conducted three weeks after the conclusion of the financial education program. The
dependent variables are aggregate measures of financial knowledge in three dimensions -- numeracy, awareness, and attitudes. Regression results for
individual questions are presented in Appendix Tables 1-3. "Financial Education" is a dummy equal to 1 for an individual who was invited to the financial
education treatment. "Pay for Performance" is an orthogonal treatment and is a dummy equal to 1 for an individual who was offered a monetary incentive for
correct answers to financial knowledge questions. Results are reported with robust standard errors clustered at the wave-class level. All regressions include
strata dummies, where strata are defined by gender, chali (neighborhood), and microfinance borrower status. *** indicates statistical significance at the 1%
level, ** at the 5% level, * at the 10% level.
Page 34
(1) (2) (3)
Aggregate Measure of
Financial Numeracy
Aggregate Measure of
Financial Awareness
Aggregate Measure of
Financial Attitudes
Financial Education -0.006 0.107*** 0.080***
(0.030) (0.018) (0.020)
Pay for Performance -0.019 -0.023 -0.017
(0.044) (0.014) (0.018)
Interaction of Financial Education and Pay for Performance 0.020 0.048 0.017
(0.051) (0.040) (0.024)
R-squared 0.151 0.217 0.283
Number of Observations 983 983 1224
Mean of Dependent Variable in Control Group 0.708 0.681 0.776
F-test p-value: Financial Education + Interaction = 0 0.695 0.000 0.000
Table 4: Longer Term Impact on Financial Knowledge
This table presents regression results on longer-term impacts from an endline survey conducted ten months after the conclusion of the financial education
program. The dependent variables are aggregate measures of financial knowledge in three dimensions -- numeracy, awareness, and attitudes. Regression
results for individual questions are presented in Appendix Tables 1-3. "Financial Education" is a dummy equal to 1 for an individual who was invited to the
financial education treatment. "Pay for Performance" is an orthogonal treatment and is a dummy equal to 1 for an individual who was offered a monetary
incentive for correct answers to financial knowledge questions. Results are reported with robust standard errors clustered at the wave-class level. All
regressions include strata dummies, where strata are defined by gender, chali (neighborhood), and microfinance borrower status. *** indicates statistical
significance at the 1% level, ** at the 5% level, * at the 10% level.
Page 35
(1) (2) (3) (4) (5) (6)
Any Treatment 0.223*** 0.279*** 0.030**
(0.029) (0.027) (0.013)
Financial Education Only 0.170*** 0.137*** 0.028
(0.040) (0.038) (0.020)
Financial Education and Goal Setting 0.243*** 0.166*** 0.006
(0.037) (0.041) (0.023)
Financial Education and Financial Counseling 0.218*** 0.384*** 0.038*
(0.037) (0.040) (0.020)
All Three Treatments 0.265*** 0.434*** 0.048*
(0.038) (0.040) (0.026)
R-squared 0.250 0.254 0.242 0.288 0.254 0.256
Number of Observations 1253 1253 1253 1253 1253 1253
Mean of Dependent Variable in Control Group 0.600 0.600 0.193 0.193 0.064 0.064
F-test p-value: Financial Education & Goal Setting =
Financial Education 0.097 0.536 0.382
F-test p-value: Financial Education & Financial Counseling
= Financial Education 0.219 0.000 0.708
F-test p-value: All Three Treatments = Financial Education 0.021 0.000 0.484
Table 5: Household Budgeting
This table presents regression results on household budgeting from an endline survey conducted ten months after the conclusion of the financial education program. The sample consists of
respondents from all four waves of the study. "Any Treatment" is a dummy equal to 1 for an indivdual who received any financial education treatment. "Financial Education Only" is a
dummy equal to 1 for an individual who was invited to the financial education classes, but did not receive either financial counseling or goal setting. "Financial Education and Goal Setting" is
a dummy equal to 1 for an individual who received the financial education and goal setting treatments, but not the financial counseling treatment. "Financial Education and Financial
Counseling" is a dummy equal to 1 for an individual who received the financial education and counseling treatments, but not the goal setting treatments. "All Three Treatments" is a dummy
equal to 1 for an individual who received all three financial education, financial counseling, and goal setting treatments. Results are reported with robust standard errors clustered at the
wave-class level. All regressions include strata dummies, where strata are defined by gender, chali (neighborhood), and microfinance borrower status. *** indicates statistical significance
at the 1% level, ** at the 5% level, * at the 10% level.
Believes Budgeting is HelpfulHas Tried Making a Budget in Last 6
MonthsMakes a Regular Monthly Budget
Page 36
(1) (2) (3) (4) (5) (6)
Any Treatment 0.028** 0.075*** 0.021
(0.012) (0.020) (0.014)
Financial Education Only -0.003 0.013 0.002
(0.017) (0.028) (0.021)
Financial Education & Goal Setting 0.047* 0.063* 0.018
(0.023) (0.032) (0.021)
Financial Education & Financial Counseling 0.005 0.138*** 0.026
(0.022) (0.039) (0.022)
All Three Treatments 0.064*** 0.090** 0.039*
(0.020) (0.039) (0.023)
R-squared 0.294 0.299 0.329 0.334 0.131 0.133
Number of Observations 1253 1253 1253 1253 1253 1253
Mean of Dependent Variable in Control Group 0.080 0.080 0.296 0.296 0.045 0.045
F-test p-value: Financial Education & Goal Setting =
Financial Education 0.087 0.200 0.540
F-test p-value: Financial Education & Financial Counseling
= Financial Education 0.753 0.007 0.429
F-test p-value: All Three Treatments = Financial Education 0.006 0.100 0.207
Table 6: Household Savings
This table presents regression results on household savings from an endline survey conducted ten months after the conclusion of the financial education program. The sample
consists of respondents from all four waves of the study. "Any Treatment" is a dummy equal to 1 for an indivdual who received any financial education treatment. "Financial
Education Only" is a dummy equal to 1 for an individual who was invited to the financial education classes, but did not receive either financial counseling or goal setting. "Financial
Education and Goal Setting" is a dummy equal to 1 for an individual who received the financial education and goal setting treatments, but not the financial counseling treatment.
"Financial Education and Financial Counseling" is a dummy equal to 1 for an individual who received the financial education and counseling treatments, but not the goal setting
treatments. "All Three Treatments" is a dummy equal to 1 for an individual who received all three financial education, financial counseling, and goal setting treatments. Results are
reported with robust standard errors clustered at the wave-class level. All regressions include strata dummies, where strata are defined by gender, chali (neighborhood), and
microfinance borrower status. *** indicates statistical significance at the 1% level, ** at the 5% level, * at the 10% level.
Informal Savings Formal Bank Savings AccountInvestments in Fixed or Recurring
Deposits
Page 37
(1) (2) (3) (4) (5) (6) (7) (8) (9) (10) (11) (12)
Any Treatment 0.024 -0.038 0.042 -0.015 -0.019 0.095**
(0.030) (0.028) (0.047) (0.010) (0.029) (0.044)
Financial Education Only 0.034 -0.030 0.086 0.000 -0.069 0.085
(0.037) (0.038) (0.071) (0.019) (0.048) (0.063)
Financial Education & Goal Setting -0.002 -0.063* -0.031 -0.025* -0.008 0.049
(0.042) (0.033) (0.071) (0.013) (0.042) (0.068)
Financial Education & Financial Counseling 0.035 -0.029 0.098 -0.020* -0.027 0.094
(0.044) (0.037) (0.063) (0.012) (0.041) (0.060)
All Three Treatments 0.026 -0.031 0.007 -0.017 0.032 0.151**
(0.043) (0.044) (0.063) (0.010) (0.040) (0.061)
R-squared 0.280 0.280 0.132 0.132 0.285 0.292 0.273 0.277 0.295 0.303 0.269 0.281
Number of Observations 1253 1253 1253 1253 540 540 540 540 540 540 540 540
Mean of Dependent Variable in Control Group 0.621 0.621 0.294 0.294 0.328 0.328 0.023 0.023 0.109 0.109 0.688 0.688
F-test p-value: Financial Education & Goal Setting =
Financial Education 0.393 0.442 0.194 0.199 0.244 0.913
F-test p-value: Financial Education & Financial Counseling
= Financial Education 0.992 0.978 0.887 0.293 0.374 0.108
F-test p-value: All Three Treatments = Financial Education 0.851 0.981 0.325 0.345 0.113 0.875
This table presents regression results on household borrowing from an endline survey conducted ten months after the conclusion of the financial education program. The sample consists of respondents from all four waves of the study. "Any Treatment" is a dummy equal to 1 for an indivdual
who received any financial education treatment. "Financial Education Only" is a dummy equal to 1 for an individual who was invited to the financial education classes, but did not receive either financial counseling or goal setting. "Financial Education and Goal Setting" is a dummy equal to 1
for an individual who received the financial education and goal setting treatments, but not the financial counseling treatment. "Financial Education and Financial Counseling" is a dummy equal to 1 for an individual who received the financial education and counseling treatments, but not the
goal setting treatments. "All Three Treatments" is a dummy equal to 1 for an individual who received all three financial education, financial counseling, and goal setting treatments. Results are reported with robust standard errors clustered at the wave-class level. All regressions include strata
dummies, where strata are defined by gender, chali (neighborhood), and microfinance borrower status. *** indicates statistical significance at the 1% level, ** at the 5% level, * at the 10% level.
Table 7: Household Borrowing
Plans on taking a loan in next yearHas Outstanding Loan Knows Details of Loan Terms
Loan Purpose:
Business, Education, or Purchase
of Durable Goods
Loan Purpose:
Unforeseen Expenses
Loan Purpose:
Repay Other Debt
Page 38
(1) (2) (3) (4) (5) (6)
Any Treatment 0.018 0.002 0.001
(0.011) (0.003) (0.009)
Financial Education Only -0.004 0.009 -0.003
(0.014) (0.007) (0.011)
Financial Education & Goal Setting -0.011 0.002 0.002
(0.015) (0.006) (0.011)
Financial Education & Financial Counseling 0.033 -0.003 0.008
(0.021) (0.003) (0.011)
All Three Treatments 0.054** -0.002 -0.002
(0.021) (0.003) (0.014)
R-squared 0.141 0.151 0.064 0.068 0.126 0.127
Number of Observations 1253 1253 1253 1253 1253 1253
Mean of Dependent Variable in Control Group 0.033 0.033 0.002 0.002 0.014 0.014
F-test p-value: Financial Education & Goal Setting =
Financial Education 0.648 0.498 0.686
F-test p-value: Financial Education & Financial Counseling
= Financial Education 0.106 0.116 0.409
F-test p-value: All Three Treatments = Financial Education 0.011 0.144 0.955
Table 8: Household Insurance
This table presents regression results on household insurance from an endline survey conducted ten months after the conclusion of the financial education program. The sample
consists of respondents from all four waves of the study. "Any Treatment" is a dummy equal to 1 for an indivdual who received any financial education treatment. "Financial
Education Only" is a dummy equal to 1 for an individual who was invited to the financial education classes, but did not receive either financial counseling or goal setting. "Financial
Education and Goal Setting" is a dummy equal to 1 for an individual who received the financial education and goal setting treatments, but not the financial counseling treatment.
"Financial Education and Financial Counseling" is a dummy equal to 1 for an individual who received the financial education and counseling treatments, but not the goal setting
treatments. "All Three Treatments" is a dummy equal to 1 for an individual who received all three financial education, financial counseling, and goal setting treatments. Results are
reported with robust standard errors clustered at the wave-class level. All regressions include strata dummies, where strata are defined by gender, chali (neighborhood), and
microfinance borrower status. *** indicates statistical significance at the 1% level, ** at the 5% level, * at the 10% level.
Bought Life Insurance in Last 6
Months
Bought Debt Insurance in Last 6
Months
Bought Health Insurance in Last 6
Months
Page 39
(1) (2) (3) (4) (5)
Rs 3000 cover -
Rs 950 premium
vs. Rs 2000
cover - Rs 900
premium
Rs 70 10 mos.
from now vs. Rs
50 at 5% per
month for 10
mos.
14% per month
vs. 2% per week
Rs. 3000 cover -
Rs 950 premium
vs. Rs. 2800
cover - Rs 800
premium
Wrote budget
correctly
Financial Education -0.042 -0.017 0.044 -0.047 0.013
(0.035) (0.036) (0.038) (0.036) (0.031)
Pay for Performance -0.023 0.084* -0.031 -0.010 -0.014
(0.039) (0.043) (0.031) (0.046) (0.031)
Interaction of Financial Education and Pay for Performance 0.069 -0.043 -0.026 0.009 0.015
(0.053) (0.054) (0.051) (0.057) (0.039)
R-squared 0.129 0.147 0.132 0.134 0.236
Number of Observations 1273 1273 1273 1273 1273
Mean of Dependent Variable in Control Group 0.425 0.691 0.700 0.686 0.734
F-test p-value: Financial Education + Interaction = 0 0.501 0.122 0.684 0.443 0.367
Appendix Table 1: Short Term Impact on Financial Numeracy -- Individual Questions
This table presents regression results on indivudal questions on financial numeracy from a survey conducted three weeks after the conclusion of the financial education
program. "Financial Education" is a dummy equal to 1 for an individual who was invited to the financial education treatment. "Pay for Performance" is an orthogonal
treatment and is a dummy equal to 1 for an individual who was offered a monetary incentive for correct answers to financial knowledge questions. Results are reported
with robust standard errors clustered at the wave-class level. All regressions include strata dummies, where strata are defined by gender, chali (neighborhood), and
microfinance borrower status. *** indicates statistical significance at the 1% level, ** at the 5% level, * at the 10% level.
Page 40
(1) (2) (3) (4) (5) (6) (7) (8)
Knows to
include both
income and
expenses in HH
budget
Knows can open
an account with
as low as Rs. 50
Knows about
bank processing
fees
Agrees that
budgeting can
help decrease
unnecessary
expenditure
Knows will get
money back if
bank closes
Knows
insurance cover
Knows older
person pays
higher life
insurance
premium
Knows
borrowing
money for
Diwali is
unproductive
loan
Financial Education 0.030 0.150*** 0.124*** 0.008 0.010 -0.020 0.054 0.198***
(0.030) (0.039) (0.038) (0.018) (0.047) (0.037) (0.047) (0.036)
Pay for Performance -0.012 -0.028 0.079 -0.031 0.004 0.018 -0.034 0.011
(0.045) (0.038) (0.063) (0.025) (0.044) (0.053) (0.064) (0.048)
Interaction of Financial Education and Pay for Performance 0.039 0.031 -0.084 0.053* 0.007 0.077 -0.003 -0.009
(0.050) (0.046) (0.066) (0.029) (0.054) (0.068) (0.073) (0.061)
R-squared 0.137 0.136 0.156 0.092 0.119 0.113 0.123 0.199
Number of Observations 1004 1004 1004 1004 1004 1004 1004 1004
Mean of Dependent Variable in Control Group 0.846 0.675 0.621 0.959 0.704 0.556 0.574 0.621
F-test p-value: Financial Education + Interaction = 0 0.044 0.000 0.378 0.003 0.646 0.280 0.417 0.001
Appendix Table 2: Short Term Impact on Financial Awareness -- Individual Questions
This table presents regression results on indivudal questions on financial awareness from a survey conducted three weeks after the conclusion of the financial education program. "Financial Education" is a dummy equal to 1
for an individual who was invited to the financial education treatment. "Pay for Performance" is an orthogonal treatment and is a dummy equal to 1 for an individual who was offered a monetary incentive for correct
answers to financial knowledge questions. Results are reported with robust standard errors clustered at the wave-class level. All regressions include strata dummies, where strata are defined by gender, chali (neighborhood),
and microfinance borrower status. *** indicates statistical significance at the 1% level, ** at the 5% level, * at the 10% level.
Page 41
(1) (2) (3) (4) (5)
Would suggest
purchasing
insurance to
construction
worker friend
Would suggest
opening bank
account to friend
w/ bright child
Would suggest
making HH
budget
Would suggest
taking out a loan
to friend who
rents an auto
Would suggest
taking out 1 loan
and buy smaller
TV
Financial Education 0.101** 0.040 0.201*** 0.057 0.016
(0.044) (0.038) (0.069) (0.044) (0.029)
Pay for Performance -0.028 0.042 -0.074 -0.016 -0.005
(0.062) (0.070) (0.073) (0.058) (0.042)
Interaction of Financial Education and Pay for Performance -0.009 -0.018 0.045 -0.007 -0.001
(0.069) (0.075) (0.086) (0.058) (0.045)
R-squared 0.190 0.126 0.201 0.134 0.122
Number of Observations 599 599 599 599 599
Mean of Dependent Variable in Control Group 0.767 0.845 0.505 0.922 0.951
F-test p-value: Financial Education + Interaction = 0 0.073 0.698 0.001 0.137 0.620
Appendix Table 3: Short Term Impact on Financial Attitudes -- Individual Questions
This table presents regression results on indivudal questions on financial attitudes from a survey conducted three weeks after the conclusion of the financial education
program. "Financial Education" is a dummy equal to 1 for an individual who was invited to the financial education treatment. "Pay for Performance" is an orthogonal
treatment and is a dummy equal to 1 for an individual who was offered a monetary incentive for correct answers to financial knowledge questions. Results are reported with
robust standard errors clustered at the wave-class level. All regressions include strata dummies, where strata are defined by gender, chali (neighborhood), and microfinance
borrower status. *** indicates statistical significance at the 1% level, ** at the 5% level, * at the 10% level.
Page 42
(1) (2) (3) (4) (5) (6) (7) (8) (9)
Financial Return
Comparison
Interest Rate
Calculation
Knows to
include both
income and
expenses in HH
budget
Knows can open
an account with
as low as Rs.50
Knows will get
money back if
bank closes
Knows
borrowing
money for
Diwali is
unproductive
Would suggest
purchasing
insurance to
construction
worker friend
Would suggest
opening bank
account to
friend w/ bright
child
Would suggest
making HH
budget
Financial Education -0.013 0.002 0.078*** 0.157*** 0.053 0.142*** 0.063** -0.015 0.201***
(0.041) (0.035) (0.022) (0.036) (0.036) (0.046) (0.024) (0.036) (0.042)
Pay for Performance -0.076 0.038 -0.027 -0.006 -0.013 -0.046 0.066* -0.088** -0.034
(0.056) (0.042) (0.031) (0.044) (0.036) (0.061) (0.035) (0.035) (0.037)
Interaction of Financial Education and Pay for Performance 0.086 -0.047 0.043 0.02 0.041 0.088 -0.083** 0.105** 0.033
(0.068) (0.051) (0.036) (0.054) (0.049) (0.075) (0.041) (0.045) (0.048)
R-squared 0.142 0.130 0.157 0.211 0.150 0.161 0.117 0.174 0.282
Number of Observations 983 983 983 983 983 983 983 983 1224
Mean of Dependent Variable in Control Group 0.643 0.772 0.848 0.632 0.696 0.550 0.813 0.825 0.632
F-test p-value: Financial Education + Interaction = 0 0.137 0.233 0.000 0.000 0.030 0.000 0.547 0.011 0.000
Appendix Table 4: Longer Term Impact on Financial Knowledge -- Individual Questions
This table presents regression results on indivudal questions on financial numeracy, awareness, and attitudes from an endline survey conducted ten months after the conclusion of the financial education program. "Financial Education" is a dummy
equal to 1 for an individual who was invited to the financial education treatment. "Pay for Performance" is an orthogonal treatment and is a dummy equal to 1 for an individual who was offered a monetary incentive for correct answers to financial
knowledge questions. Results are reported with robust standard errors clustered at the wave-class level. All regressions include strata dummies, where strata are defined by gender, chali (neighborhood), and microfinance borrower status. ***
indicates statistical significance at the 1% level, ** at the 5% level, * at the 10% level.
Financial Awareness Financial AttitudesFinancial Numeracy


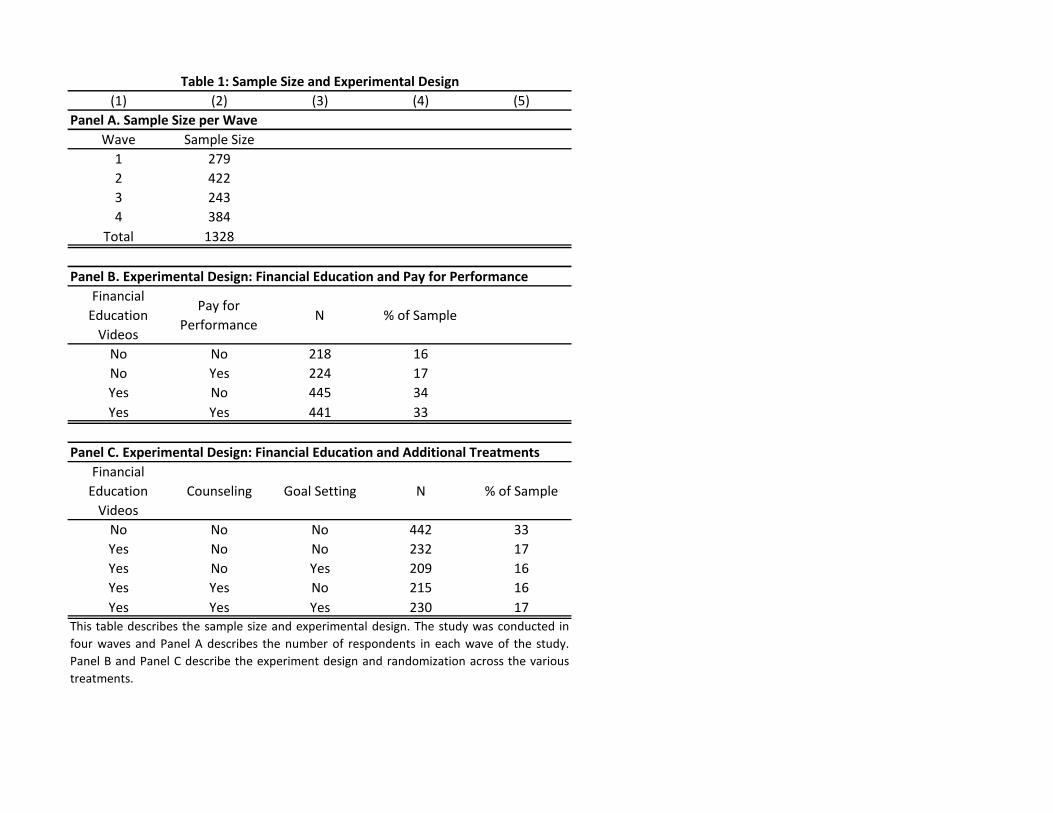


![Logistical Performance Measurement [Autosaved]](https://static.documents.pub/doc/80x56/577d2ece1a28ab4e1eb006f9/logistical-performance-measurement-autosaved.jpg)


