The acceptability of the New Nordic Diet by participants in a controlled six-month dietary intervention Arun Micheelsen a , Louis Havn a , Sanne K. Poulsen b , Thomas M. Larsen b , Lotte Holm a,⇑ a Copenhagen University, Department of Food and Resource, Economics, Section for Consumption, Bioethics and Governance, Rolighedsvej 25, 1958 Frederiksberg C., Denmark b Copenhagen University, Faculty of Science, Department of Nutrition, Exercise and Sports, Unit for Obesity Research, Rolighedsvej 30, 1958 Frederiksberg C., Denmark article info Article history: Received 20 February 2013 Received in revised form 7 February 2014 Accepted 8 February 2014 Available online 20 February 2014 Keywords: New Nordic Diet Eating acceptance index Practical acceptance index Controlled dietary intervention Survey study abstract A healthy and palatable ‘New Nordic Diet’ (NND) has been designed with the aim to improve public health in Denmark. In order to explore barriers and possibilities for acceptance of the NND by the wider population this study analyzes acceptance of the NND and a control diet labeled the ‘Average Danish Diet’ (ADD) among participants in a randomized controlled intervention study of the two diets’ health effects. Based on questionnaires presented before (N = 197) and after (N = 147) the intervention, an eating accep- tance index expressing eating qualities and a practical acceptance index expressing practical implications of the diet in everyday life were developed. Variations in practical and eating acceptance in relation to key background variables were explored. The NND had high eating acceptance and low practical acceptance when measured after the interven- tion. The ADD had low eating acceptance but high practical acceptance. NND participants already exhib- iting healthy eating habits before the intervention showed the highest eating acceptance of the NND. The ADD had the highest eating acceptance among ADD participants exhibiting less healthy eating habits before the intervention. In spite of high eating acceptance, low practical acceptance may hinder broader public acceptance of the New Nordic Diet. Ó 2014 Elsevier Ltd. All rights reserved. 1. Introduction During the last decades policies aiming at revitalizing or con- structing local food cultures have emerged (Philippe, Fatiha, & Lucie, 2005). In Denmark and other Nordic countries, for example, Nordic Cuisine has become a prominent topic on the gastronomic agenda. Currently, attempts are made to include this cuisine in endeavors to promote dietary change in the wider population in order to improve public health and sustainability of national food consumption (Nordic Council of Ministers, 2013). In the Research Center OPUS 1 (2008–13) nutrition scientists and gastronomic ex- perts from the ‘New Nordic Cuisine’ movement have developed a New Nordic Diet (NND) (OPUS, 2009) which is meant to be a desir- able, healthy and culturally acceptable diet for all Danes (Mithril et al., 2012). We investigated acceptance of the NND among partic- ipants in a clinical controlled trial, testing the health impacts of the NND by comparing it to a controlled diet labeled an ‘Average Danish Diet’ (ADD) (Pedersen et al., 2010). The aim was, on this basis, to understand barriers and possibilities for the acceptance of this new diet in a wider population. In Denmark, as in other countries, consumers’ dietary habits fail to conform with national dietary recommendations (Ball, Mishra, Thane, & Hodge, 2004; Groth & Fagt, 2003; Lau et al., 2004). In gen- eral, women and individuals with higher levels of education and income are more inclined to follow advice on healthy eating such as promoted by the Danish authorities than the rest of the popula- tion (Biltoft-Jensen et al., 2009; Groth & Fagt, 2003; O’Doherty Jensen & Holm, 1999). Furthermore, people with lower levels of education tend to have a higher prevalence of overweight and obesity (Groth, Fagt, Stockmarr, Matthiessen, & Biltoft-Jensen, 2009). Thus, national dietary recommendations have not appealed to all segments of the population (Biltoft-Jensen et al., 2009). To counter this, NND has been developed as a new and healthier everyday diet, which is hoped to be desirable for all Danes (Bere & Brug, 2009; Mithril et al., 2012) including ‘‘those segments of the population who suffer most from nutritionally related lifestyle diseases’’ (OPUS, 2009). The New Nordic Cuisine, which is the inspiration for the NND, tends to be associated in people’s minds with expensive, high-end restaurants (cf. Mithril et al., 2012). It is thus an important question whether NND will reach a broader http://dx.doi.org/10.1016/j.foodqual.2014.02.003 0950-3293/Ó 2014 Elsevier Ltd. All rights reserved. ⇑ Corresponding author. Tel.: +45 353 32496. E-mail address: [email protected](L. Holm). 1 OPUS is an acronym of the project ‘Optimal wellbeing, development and health for Danish children through a healthy New Nordic Diet’ and is supported by a grant from the Nordea Foundation. Food Quality and Preference 36 (2014) 20–26 Contents lists available at ScienceDirect Food Quality and Preference journal homepage: www.elsevier.com/locate/foodqual
1 OPUS is an acronym of the project ‘Optimal wellbeing, development and healthfor Danish children through a healthy New Nordic Diet’ and is supported by a grantfrom the Nordea Foundation.
Arun Micheelsen a, Louis Havn a, Sanne K. Poulsen b, Thomas M. Larsen b, Lotte Holm a,⇑a Copenhagen University, Department of Food and Resource, Economics, Section for Consumption, Bioethics and Governance, Rolighedsvej 25, 1958 Frederiksberg C., Denmarkb Copenhagen University, Faculty of Science, Department of Nutrition, Exercise and Sports, Unit for Obesity Research, Rolighedsvej 30, 1958 Frederiksberg C., Denmark
a r t i c l e i n f o a b s t r a c t
Article history:Received 20 February 2013Received in revised form 7 February 2014Accepted 8 February 2014Available online 20 February 2014
Keywords:New Nordic DietEating acceptance indexPractical acceptance indexControlled dietary interventionSurvey study
A healthy and palatable ‘New Nordic Diet’ (NND) has been designed with the aim to improve publichealth in Denmark. In order to explore barriers and possibilities for acceptance of the NND by the widerpopulation this study analyzes acceptance of the NND and a control diet labeled the ‘Average Danish Diet’(ADD) among participants in a randomized controlled intervention study of the two diets’ health effects.Based on questionnaires presented before (N = 197) and after (N = 147) the intervention, an eating accep-tance index expressing eating qualities and a practical acceptance index expressing practical implicationsof the diet in everyday life were developed. Variations in practical and eating acceptance in relation tokey background variables were explored.
The NND had high eating acceptance and low practical acceptance when measured after the interven-tion. The ADD had low eating acceptance but high practical acceptance. NND participants already exhib-iting healthy eating habits before the intervention showed the highest eating acceptance of the NND. TheADD had the highest eating acceptance among ADD participants exhibiting less healthy eating habitsbefore the intervention. In spite of high eating acceptance, low practical acceptance may hinder broaderpublic acceptance of the New Nordic Diet.
� 2014 Elsevier Ltd. All rights reserved.
1. Introduction
During the last decades policies aiming at revitalizing or con-structing local food cultures have emerged (Philippe, Fatiha, &Lucie, 2005). In Denmark and other Nordic countries, for example,Nordic Cuisine has become a prominent topic on the gastronomicagenda. Currently, attempts are made to include this cuisine inendeavors to promote dietary change in the wider population inorder to improve public health and sustainability of national foodconsumption (Nordic Council of Ministers, 2013). In the ResearchCenter OPUS1 (2008–13) nutrition scientists and gastronomic ex-perts from the ‘New Nordic Cuisine’ movement have developed aNew Nordic Diet (NND) (OPUS, 2009) which is meant to be a desir-able, healthy and culturally acceptable diet for all Danes (Mithrilet al., 2012). We investigated acceptance of the NND among partic-ipants in a clinical controlled trial, testing the health impacts of theNND by comparing it to a controlled diet labeled an ‘Average Danish
Diet’ (ADD) (Pedersen et al., 2010). The aim was, on this basis, tounderstand barriers and possibilities for the acceptance of this newdiet in a wider population.
In Denmark, as in other countries, consumers’ dietary habits failto conform with national dietary recommendations (Ball, Mishra,Thane, & Hodge, 2004; Groth & Fagt, 2003; Lau et al., 2004). In gen-eral, women and individuals with higher levels of education andincome are more inclined to follow advice on healthy eating suchas promoted by the Danish authorities than the rest of the popula-tion (Biltoft-Jensen et al., 2009; Groth & Fagt, 2003; O’DohertyJensen & Holm, 1999). Furthermore, people with lower levels ofeducation tend to have a higher prevalence of overweight andobesity (Groth, Fagt, Stockmarr, Matthiessen, & Biltoft-Jensen,2009). Thus, national dietary recommendations have not appealedto all segments of the population (Biltoft-Jensen et al., 2009). Tocounter this, NND has been developed as a new and healthiereveryday diet, which is hoped to be desirable for all Danes (Bere& Brug, 2009; Mithril et al., 2012) including ‘‘those segments ofthe population who suffer most from nutritionally related lifestylediseases’’ (OPUS, 2009). The New Nordic Cuisine, which is theinspiration for the NND, tends to be associated in people’s mindswith expensive, high-end restaurants (cf. Mithril et al., 2012). Itis thus an important question whether NND will reach a broader
A. Micheelsen et al. / Food Quality and Preference 36 (2014) 20–26 21
audience, including people who are accustomed to spending lessmoney on food. Earlier studies about Danish consumers’ eatinghabits suggest that NND would comply more readily with the eat-ing habits of women, individuals with higher levels of educationand higher incomes, and with persons living in multi-personhouseholds as these are the groups who tend to have the mosthealthy eating habits (Biltoft-Jensen et al., 2009; Dynesen,Haraldsdóttir, Holm, & Astrup, 2003; Groth & Fagt, 2003). Further,studies have shown that women have a less strong preference formeat (Kubberød, Ueland, Risvik, & Henjesand, 2006; Resanoet al., 2011), a higher preference for fish and vegetables (O’DohertyJensen & Holm, 1999), and are over-represented among organicfood consumers (Hughner et al., 2007; Squires, Juric, & Cornwell,2001), features which are characteristic for the NND (Mithrilet al., 2012). Accordingly, this study addresses differences in accep-tance of the NND according to social and demographic backgroundfactors, to attitudes known to affect the consumption of healthyand organic foods, to cooking and to eating fish and vegetables.
Following the work of Pilgrim (Meiselman, 2003), who definesthe criterion of food acceptance as ‘‘consumption with pleasure’’(Pilgrim, 1957, p. 171), a common approach to food acceptanceemphasizes affective responses to the experience of eating (Cardel-lo, Schutz, Snow, & Lesher, 2000; Pilgrim, 1957). In this approach,acceptance is a subjective construct, and ‘‘the measurement of foodacceptance relies on the use of psychometric, psychophysical, and/orbehavioral methods’’ (Meiselman & MacFie, 1996, p. 2). In thisperspective, the hedonic eating qualities of the food are the primaryaspect of food acceptance (McEwan & Thomson, 1988; Meiselman& MacFie, 1996).
However, in some contrast, sociological studies of food havehighlighted that food acceptance is also a practical matter, negoti-ated in social settings in everyday life (Holm, 1993; Nielsen,Korzen, & Holm, 2008; Sijtsema, Linnemann, Van Gaasbeek,Dagevos, & Jongen, 2002) and influenced by practices involved inprocuring, preparing, consuming food, and thereafter disposing offood waste (Beardsworth & Keil, 1997; Mennell, Murcott, & VanOtterloo, 1994). In studies of dietary acceptance in prolonged, con-trolled intervention trials, sociological studies have found thatintervention diets can be in conflict with important social rulesof interaction and cultural norms governing meal structures, aswell as practical concerns around the procurement, preparationand consumption of the diet (Holm et al., 2008; Nielsen et al.,2008). Thus, the practical implications of adhering to diets in every-day life are important determinants of dietary acceptance (Holm,1993).
In order to determine the acceptability of the NND, this study:(1) compared NND participants’ evaluation of their diet after6 months consumption to that of the ADD participants’; and (2)investigated variations in eating and practical acceptance amongparticipants according to gender, level of education, householdcomposition, money spent on food per month, attitudes to buyingfood and food habits. Based on these results, this article will iden-tify central drivers and barriers for adopting NND and tentativelysuggest which segments of Danish consumers are more likely toadopt NND.
2. Study design and methods
2.1. Research setting
The acceptance study was conducted in the setting of a random-ized controlled six-month dietary intervention which was con-ducted as part of the OPUS project (Poulsen et al., 2013). Thisintervention investigated the NND’s health potential by comparing
it with a control diet labeled the ‘Average Danish Diet’ (ADD). TheNND was designed as a coherent dietary system based on NordicNutrition Recommendations 2004 (Becker et al., 2004) and com-posed of organic (50% intake goal) foodstuffs indigenous to theNordic region (90% intake goal). The NND included mostly freshfoodstuffs such as game meat, fish, and whole grain products, aswell as seasonal fruits and vegetables such as berries, cabbage, rootcrops, leguminous crops and fresh herbs. The ADD was constructedso as to accord with the average diet of adult Danes as establishedin national dietary surveys (Pedersen et al., 2010). A maximum of50% of foodstuffs in the ADD were of Nordic origin and a maximumof 10% were organic. Furthermore, the ADD was defined to includemore meat, added sugar and total fat, and less whole grain, fruitand vegetables, than the NND.
The dietary system used in the NND was based on a predefinedseasonal dinner menu plan, set out in a cookbook containing therecipes of 180 NND dishes. Meals were to be cooked from scratchon the basis of fresh products and prepared and eaten at home.NND dinners comprised two courses on weekdays (one of whichwas usually leftovers from the day before) and three courses atweekends. An ADD cookbook was also given to the ADD partici-pants, but they were not asked to follow any predefined seasonalmeal system. The ADD also incorporated a larger number of pro-cessed food products and ready-made meals, which participantswere allowed to consume. The trial showed that the NND wasmore beneficial to health than the ADD in that it produced largerweight loss and greater reduction in systolic and diastolic bloodpressure (Poulsen et al., 2013).
Participants were randomly assigned to one of the diets and col-lected food ad libitum and free of charge in a controlled supermar-ket setting (Skov, Toubro, Raben, & Astrup, 1997) established at thedepartment of Human Nutrition at Copenhagen University. Partic-ipants’ adherence to their dietary guidelines were ensured byintervention personnel in the supermarket monitoring and guidingfood procurement, through individual consultations with dieti-cians during the intervention and through free cooking lessonswhere participants learned basic cooking skills tailored to theirspecific diet (Poulsen et al., 2013).
Participants were self-recruited via online advertisement inmedia and websites and inclusion criteria required participantsto be 18–65 years old, overweight (waist circumference ofP80 cm for women and P94 cm for men) and to be able to pre-pare and eat food at home for the duration of the intervention.After screening, each participant was randomized to one of thetwo diets. In order to provide more detailed information aboutthe NND diet, more participants were assigned to NND than tothe ADD. All participants lived in, or close to, the capital city ofDenmark. Initially 220 participants were included in the interven-tion. Of these, 147 participants completed the trial (91 NND and 56ADD).
2.2. Data
A questionnaire was presented to participants before (N = 197)and after (N = 147) the intervention. The first questionnaire drewon previous food sociological studies (Andersen, 2009; Holm,1993; Korzen, Sandøe, & Lassen, 2011; Nielsen et al., 2008) andstudies on food choice (Steptoe, Pollard, & Wardle, 1995), andinvestigated the participants’ everyday food habits prior to theintervention and their attitudes to buying organic, healthy and sea-sonal food. Questions had either the form of statements which par-ticipants were asked to agree or disagree with on five-point Likertscales, or, they were dichotomized statements which participantswere asked to choose which one they agreed with the most.
22 A. Micheelsen et al. / Food Quality and Preference 36 (2014) 20–26
Participants could agree with either one or the other dichotomizedstatement on the following scale Agree, Mostly agree, Neitheragree nor disagree.
The second questionnaire administered at the end of the inter-vention added new questions which were developed on the basisof a qualitative study among intervention participants whichexplored their experiences of living with the intervention diets(Micheelsen, O’Doherty Jensen, & Holm, in press). Participantswere invited to evaluate their intervention diet on five dimensions:(1) ‘preparation of diet’, covering practical aspects of cooking theintervention diet; (2) ‘consumption of diet’, which included thehedonic qualities of the diet; (3) ‘everyday life and diet’, depictinghow adhering to the diet worked in daily life; (4) ‘wellbeing anddiet’, covering how the diet influenced bodily wellbeing; and (5)‘continuation with the diet after the intervention’, which con-cerned participants expectations about continuing adhering totheir intervention diet after the study. In each dimension five toseven questions were posed in the form of statements about theintervention diets asking participants to agree or disagree on afive-point Likert scale. Socio-demographic information wasobtained from the intervention database.
2.3. Data analysis
The analysis of participants’ evaluation of their diet is based onthe 147 participants who completed the study (see Section 3.1).Due to errors in registrations and non-responses, the investigationof variations in eating and practical acceptance is based on asub-sample of 119 (81%) participants (73 NND and 46 ADD) (seeSection 3.3). All data analysis was done using SAS version 9.2.
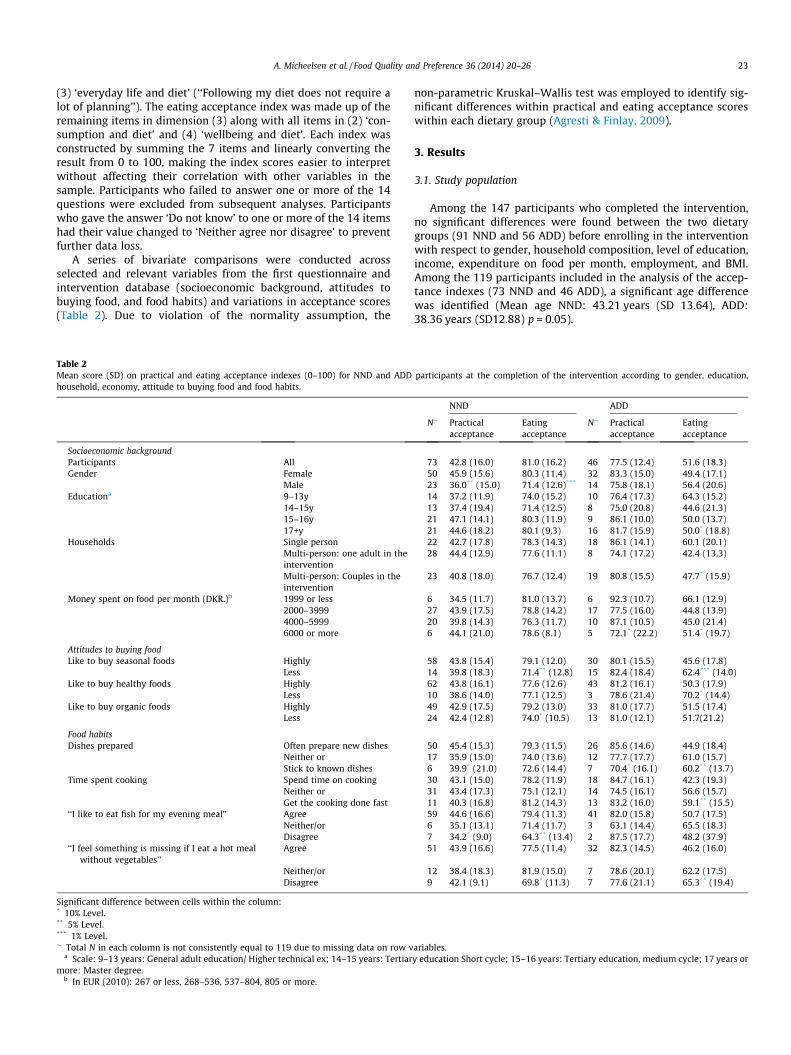
Table 1Evaluations of NND and ADD diets and factors analysis of items about acceptance. (Percendiets and factor loadings of items).
Perce
NND(N = 7
I. Preparation of dietMy diet is easy to cook* 67My diet is not very time consuming to cookb,* 21Cooking my diet does not require too many kitchen tools (e.g. bowls, pots, a
food processor, etc.)b,*34
Cooking my diet does not results in too much washing-upb,* 21
II. Consumption of dietMy diet is tasty* 100My diet is filling* 96My diet is not monotonousb,* 45
III. Everyday life and dietFollowing my diet does not require a lot of planningb,* 20My diet fits nicely with my everyday life 88I have generally not missed eating the food I ate before the interventionb,* 52
IV. Wellbeing and dietEating my diet has given me energy* 64My diet has not made me physically uncomfortableb,* 85
V. Continuation with the diet after the interventionIt will not be too expensive to stay on my diet after the interventionb,* 15The foodstuffs I have eaten during the intervention are not difficult to find at
my local supermarketb,*15
Eigenvalues% Of varianceConbach’s Alpha
a Full scale: Totally agree, partially agree, neither agree nor disagree, partially disagreb Rating of question is reversed in order to produce consistent scale.c Factor loadings over .40 appear in bold.
* Significant at a 1% level between the two dietary groups’ evaluation (v2).
2.4. Dietary acceptance index
The initial idea was to identify a single dietary acceptance indexbased on all five dimensions mentioned above. This would relate toparticipants’ evaluation of their respective diet and correspond to19 items selected in the second questionnaire. A principal compo-nent analysis (Paul Kline, 1993) using a Varimax rotation (PaulKline, 1999) was performed on the 19 items to investigate latentfactors. On most of these 19 questions a positive (i.e. agreeing) an-swer expressed a high acceptance, and a negative (i.e. disagreeing)answer expressed a low acceptance. With regard to the questionswhere, on the contrary, a negative (i.e. disagreeing) answer ex-pressed high acceptance, the values in the data set were numeri-cally inverted. This was done to insure only positive loadings inthe factor analysis and thus make the table easier to interpret. Fiveitems were excluded: they did not yield an interpretable factorstructure and failed to meet the requirement of having a primaryfactor loading of 0.4 or above and no cross-loading of 0.4 or above.An examination of the Kaiser-Meyer Olkin measure of the sam-pling adequacy suggested that the remaining group of 14 itemswas factorable (overall KMO = 0.8615). On the basis of this analy-sis, two strong factors emerged (Table 1). These were interpretedas a practical acceptance index consisting of 7 items depictingthe diet’s practical implementation in everyday life and an eatingacceptance index also consisting of 7 items representing the eatingqualities of the diet. Thereafter, v2 tests on items two-by-twowithin each index confirmed the one-dimensionality of theindexes.
The practical acceptance index consisted of all items in dimen-sions (1) ‘preparation of diet’ and (5) ‘continuation with the dietafter the intervention’, together with one item from dimension
tage of NND and ADD participants agreeing to positive evaluations of their respective
ntage of participants agreeinga Factor loadingsc (N = 119)
participants3–91)
ADD participants(N = 46–56)
I: Practicalacceptance
II: Eatingacceptance
98 0.73 0.1479 0.83 �0.2283 0.79 �0.15
76 0.76 �0.22
65 �0.20 0.7665 �0.13 0.8413 �0.24 0.48
65 0.74 �0.1770 0.18 0.7415 �0.17 0.68
22 �0.20 0.7248 �0.20 0.72
63 0.70 �0.2187 0.70 �0.32
5.63 2.4640.2 17.6
0.8848 0.8473
e, totally disagree, do not know.
A. Micheelsen et al. / Food Quality and Preference 36 (2014) 20–26 23
(3) ‘everyday life and diet’ (‘‘Following my diet does not require alot of planning’’). The eating acceptance index was made up of theremaining items in dimension (3) along with all items in (2) ‘con-sumption and diet’ and (4) ‘wellbeing and diet’. Each index wasconstructed by summing the 7 items and linearly converting theresult from 0 to 100, making the index scores easier to interpretwithout affecting their correlation with other variables in thesample. Participants who failed to answer one or more of the 14questions were excluded from subsequent analyses. Participantswho gave the answer ‘Do not know’ to one or more of the 14 itemshad their value changed to ‘Neither agree nor disagree’ to preventfurther data loss.
A series of bivariate comparisons were conducted acrossselected and relevant variables from the first questionnaire andintervention database (socioeconomic background, attitudes tobuying food, and food habits) and variations in acceptance scores(Table 2). Due to violation of the normality assumption, the
Table 2Mean score (SD) on practical and eating acceptance indexes (0–100) for NND and ADDhousehold, economy, attitude to buying food and food habits.
Households Single personMulti-person: one adult in theinterventionMulti-person: Couples in theintervention
Money spent on food per month (DKR.)b 1999 or less2000–39994000–59996000 or more
Attitudes to buying foodLike to buy seasonal foods Highly
LessLike to buy healthy foods Highly
LessLike to buy organic foods Highly
Less
Food habitsDishes prepared Often prepare new dishes
Neither orStick to known dishes
Time spent cooking Spend time on cookingNeither orGet the cooking done fast
‘‘I like to eat fish for my evening meal’’ AgreeNeither/orDisagree
‘‘I feel something is missing if I eat a hot mealwithout vegetables’’
Agree
Neither/orDisagree
Significant difference between cells within the column:* 10% Level.** 5% Level.*** 1% Level.� Total N in each column is not consistently equal to 119 due to missing data on row v
a Scale: 9–13 years: General adult education/ Higher technical ex; 14–15 years: Tertiarmore: Master degree.
b In EUR (2010): 267 or less, 268–536, 537–804, 805 or more.
non-parametric Kruskal–Wallis test was employed to identify sig-nificant differences within practical and eating acceptance scoreswithin each dietary group (Agresti & Finlay, 2009).
3. Results
3.1. Study population
Among the 147 participants who completed the intervention,no significant differences were found between the two dietarygroups (91 NND and 56 ADD) before enrolling in the interventionwith respect to gender, household composition, level of education,income, expenditure on food per month, employment, and BMI.Among the 119 participants included in the analysis of the accep-tance indexes (73 NND and 46 ADD), a significant age differencewas identified (Mean age NND: 43.21 years (SD 13.64), ADD:38.36 years (SD12.88) p = 0.05).
participants at the completion of the intervention according to gender, education,
ariables.y education Short cycle; 15–16 years: Tertiary education, medium cycle; 17 years or
24 A. Micheelsen et al. / Food Quality and Preference 36 (2014) 20–26
3.2. Participants’ evaluation of NND and ADD
Table 1 compares NND and ADD participants’ evaluation of theirintervention diets after 6 months consumption. The results showedthat overall the experience of eating NND was evaluated as morepleasant than that of eating ADD, as NND participants to a largerextent found their diet tasty, filling, energizing, and only a littlemore than half of NND participants found their diet monotonousafter 6 months. By contrast ADD participants were less positiveabout their diet and only very few did not find the ADD monoto-nous after 6 months. However, the experience of preparing NND,and expectations about continuing with it after the interventionstudy, were less positively evaluated than was the case withADD. Even though many found that their diet was easy to cook, amajority of NND participants found cooking time-consuming, toresult in too much washing-up, and the required amount of kitch-en tools disagreeable. Even more strikingly, only 15% of NND par-ticipants expected this diet to be affordable to adhere to after thecompletion of the intervention study and not difficult to shop forin their local supermarket. By contrast, almost all ADD participantsfound their diet easy to cook, and the great majority did not findthat the diet was time-consuming to prepare, required too manykitchen tools, or resulted in too much washing-up. Likewise, par-ticipants expected ADD foodstuffs to be easy to obtain and didnot expect it to be too expensive to adhere to ADD after theintervention.
The majority of participants in both groups found that their spe-cific diet could be accommodated readily, in general, with theireveryday life. However, more ADD (65%) than NND (20%) partici-pants did not find that their diet required a lot of planning. After6 months of intervention 52% of NND participants had not missedeating the food they ate before the intervention, while only 15% ofthe ADD participants had not done so.
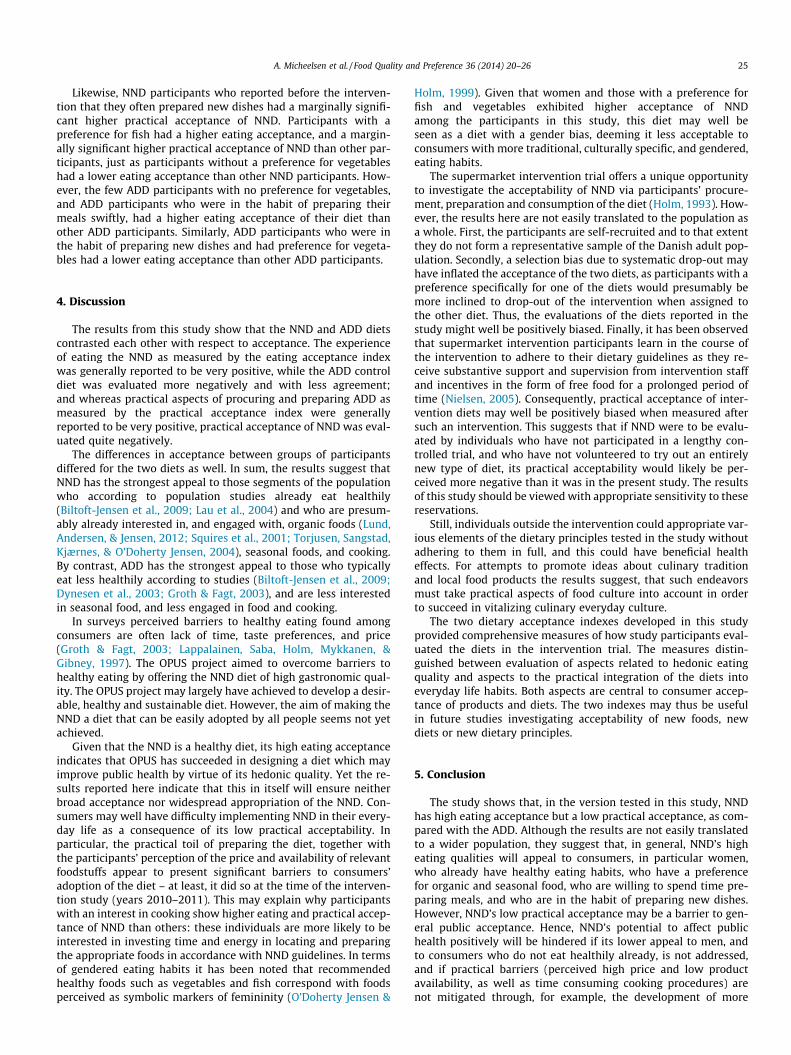
3.3. Eating acceptance and practical acceptance
Fig. 1 shows how the eating and the practical acceptance scoresof the two diets are distributed among the participants. Overall, theimpression given is that the two diets contrast. The mean eatingacceptance score of NND is very high (81.0) while its mean practi-cal acceptance score is quite low (42.9). The mean eating accep-tance score for ADD is considerably lower than for the NND
Fig. 1. Scatterplot of participants’ eating acceptance and practical acceptance. Eating acpractical acceptance lower for NND (Mean 42.8, SD 16.0) than for ADD (Mean 77.5, SD 1Overlapping plots are presented in black.
(51.6) while its mean practical acceptance score is quite high(77.5) and much higher than for the NDD.
For NND participants the standard deviations for the values ofthe two acceptance scales are nearly the same (16.2 and 16.0, foreating and acceptance scores, respectively). In contrast, for ADDparticipants the eating acceptance index has much higher standarddeviation (18.3) than the practical acceptance index (12.4). AmongNND participants, a small, yet nearly significant, positive correla-tion exists between scores on the two indexes (Pearson = 0.30,p < .10). Thus, positive experience of eating NND appears to beassociated with positive practical acceptance of the diet, and lesspositive eating acceptance with negative practical acceptance.Here, no correlation was found for ADD.
3.4. Acceptance index scores for NND and ADD according to socio-economic background, attitude to buying food and food habits
In Table 2 differences in the acceptance scores for the two dietsrelating to the participants’ socioeconomic background, food habitsand attitudes are shown. As anticipated, women had a higher prac-tical and eating acceptance of NND than did men. Likewise, NNDparticipants with higher levels of education tended to have highereating and practical acceptance, but the differences here were notsignificant. Among ADD participants, those living in single-personhouseholds and those with lower levels of education had highereating acceptance, while those who spent less money on food permonth had higher practical and eating acceptance than otherADD participants. Differences among ADD participants were onlymarginally significant, however.
As expected, those NND participants whose consumption pref-erences prior to the intervention already agreed with the dietarycomposition of the NND in that they self-reported a preferencefor buying seasonal foods or organic produce had higher eatingacceptance of their diet than other NND participants, althoughthe differences in eating acceptance in relation to buying organicfood were small and only marginally significant. By contrast,ADD participants who were less concerned about buying seasonalfood had higher eating acceptance than those who were eager todo so. Also, the very few ADD participants who reported being lessconcerned about health had a marginally significant higher eatingacceptance of ADD than the remaining majority of ADD partici-pants who reported to be concerned to eat healthily.
ceptance higher for NND (Mean 81.0, SD 16.2) than for ADD (Mean 51.6, SD 18.3),2.4). Note: Due to overlapping values within each group only 100 plots are visible.
A. Micheelsen et al. / Food Quality and Preference 36 (2014) 20–26 25
Likewise, NND participants who reported before the interven-tion that they often prepared new dishes had a marginally signifi-cant higher practical acceptance of NND. Participants with apreference for fish had a higher eating acceptance, and a margin-ally significant higher practical acceptance of NND than other par-ticipants, just as participants without a preference for vegetableshad a lower eating acceptance than other NND participants. How-ever, the few ADD participants with no preference for vegetables,and ADD participants who were in the habit of preparing theirmeals swiftly, had a higher eating acceptance of their diet thanother ADD participants. Similarly, ADD participants who were inthe habit of preparing new dishes and had preference for vegeta-bles had a lower eating acceptance than other ADD participants.
4. Discussion
The results from this study show that the NND and ADD dietscontrasted each other with respect to acceptance. The experienceof eating the NND as measured by the eating acceptance indexwas generally reported to be very positive, while the ADD controldiet was evaluated more negatively and with less agreement;and whereas practical aspects of procuring and preparing ADD asmeasured by the practical acceptance index were generallyreported to be very positive, practical acceptance of NND was eval-uated quite negatively.
The differences in acceptance between groups of participantsdiffered for the two diets as well. In sum, the results suggest thatNND has the strongest appeal to those segments of the populationwho according to population studies already eat healthily(Biltoft-Jensen et al., 2009; Lau et al., 2004) and who are presum-ably already interested in, and engaged with, organic foods (Lund,Andersen, & Jensen, 2012; Squires et al., 2001; Torjusen, Sangstad,Kjærnes, & O’Doherty Jensen, 2004), seasonal foods, and cooking.By contrast, ADD has the strongest appeal to those who typicallyeat less healthily according to studies (Biltoft-Jensen et al., 2009;Dynesen et al., 2003; Groth & Fagt, 2003), and are less interestedin seasonal food, and less engaged in food and cooking.
In surveys perceived barriers to healthy eating found amongconsumers are often lack of time, taste preferences, and price(Groth & Fagt, 2003; Lappalainen, Saba, Holm, Mykkanen, &Gibney, 1997). The OPUS project aimed to overcome barriers tohealthy eating by offering the NND diet of high gastronomic qual-ity. The OPUS project may largely have achieved to develop a desir-able, healthy and sustainable diet. However, the aim of making theNND a diet that can be easily adopted by all people seems not yetachieved.
Given that the NND is a healthy diet, its high eating acceptanceindicates that OPUS has succeeded in designing a diet which mayimprove public health by virtue of its hedonic quality. Yet the re-sults reported here indicate that this in itself will ensure neitherbroad acceptance nor widespread appropriation of the NND. Con-sumers may well have difficulty implementing NND in their every-day life as a consequence of its low practical acceptability. Inparticular, the practical toil of preparing the diet, together withthe participants’ perception of the price and availability of relevantfoodstuffs appear to present significant barriers to consumers’adoption of the diet – at least, it did so at the time of the interven-tion study (years 2010–2011). This may explain why participantswith an interest in cooking show higher eating and practical accep-tance of NND than others: these individuals are more likely to beinterested in investing time and energy in locating and preparingthe appropriate foods in accordance with NND guidelines. In termsof gendered eating habits it has been noted that recommendedhealthy foods such as vegetables and fish correspond with foodsperceived as symbolic markers of femininity (O’Doherty Jensen &
Holm, 1999). Given that women and those with a preference forfish and vegetables exhibited higher acceptance of NNDamong the participants in this study, this diet may well beseen as a diet with a gender bias, deeming it less acceptable toconsumers with more traditional, culturally specific, and gendered,eating habits.
The supermarket intervention trial offers a unique opportunityto investigate the acceptability of NND via participants’ procure-ment, preparation and consumption of the diet (Holm, 1993). How-ever, the results here are not easily translated to the population asa whole. First, the participants are self-recruited and to that extentthey do not form a representative sample of the Danish adult pop-ulation. Secondly, a selection bias due to systematic drop-out mayhave inflated the acceptance of the two diets, as participants with apreference specifically for one of the diets would presumably bemore inclined to drop-out of the intervention when assigned tothe other diet. Thus, the evaluations of the diets reported in thestudy might well be positively biased. Finally, it has been observedthat supermarket intervention participants learn in the course ofthe intervention to adhere to their dietary guidelines as they re-ceive substantive support and supervision from intervention staffand incentives in the form of free food for a prolonged period oftime (Nielsen, 2005). Consequently, practical acceptance of inter-vention diets may well be positively biased when measured aftersuch an intervention. This suggests that if NND were to be evalu-ated by individuals who have not participated in a lengthy con-trolled trial, and who have not volunteered to try out an entirelynew type of diet, its practical acceptability would likely be per-ceived more negative than it was in the present study. The resultsof this study should be viewed with appropriate sensitivity to thesereservations.
Still, individuals outside the intervention could appropriate var-ious elements of the dietary principles tested in the study withoutadhering to them in full, and this could have beneficial healtheffects. For attempts to promote ideas about culinary traditionand local food products the results suggest, that such endeavorsmust take practical aspects of food culture into account in orderto succeed in vitalizing culinary everyday culture.
The two dietary acceptance indexes developed in this studyprovided comprehensive measures of how study participants eval-uated the diets in the intervention trial. The measures distin-guished between evaluation of aspects related to hedonic eatingquality and aspects to the practical integration of the diets intoeveryday life habits. Both aspects are central to consumer accep-tance of products and diets. The two indexes may thus be usefulin future studies investigating acceptability of new foods, newdiets or new dietary principles.
5. Conclusion
The study shows that, in the version tested in this study, NNDhas high eating acceptance but a low practical acceptance, as com-pared with the ADD. Although the results are not easily translatedto a wider population, they suggest that, in general, NND’s higheating qualities will appeal to consumers, in particular women,who already have healthy eating habits, who have a preferencefor organic and seasonal food, who are willing to spend time pre-paring meals, and who are in the habit of preparing new dishes.However, NND’s low practical acceptance may be a barrier to gen-eral public acceptance. Hence, NND’s potential to affect publichealth positively will be hindered if its lower appeal to men, andto consumers who do not eat healthily already, is not addressed,and if practical barriers (perceived high price and low productavailability, as well as time consuming cooking procedures) arenot mitigated through, for example, the development of more
26 A. Micheelsen et al. / Food Quality and Preference 36 (2014) 20–26
convenient and cheaper versions of NND for households or in thefood service industry.
6. Role of the funding source
The OPUS research project is funded by the Nordea Foundation.
Acknowledgment
The authors would like to thank those who participated in thisstudy.
References
Agresti, A., & Finlay, B. (2009). Statistical methods for the social sciences (4th ed.). NewJersey: Prentice Hall.
Andersen, L. M. (2009). Documentation of CONCEPT questionnaires. Available fromhttp://orgprints.org/15741/.
Ball, K., Mishra, G. D., Thane, C. W., & Hodge, A. (2004). How well do Australianwomen comply with dietary guidelines? Public Health Nutrition, 7(3), 443–452.http://dx.doi.org/10.1079/PHN2003538.
Beardsworth, A., & Keil, T. (1997). Sociology on the menu: An invitation to the study offood and society. Routledge.
Becker, W., Lyhne, N., Pedersen, A., Aro, A., Fogelholm, M., Þhórsdottir, I., et al.(2004). Nordic nutrition recommendations 2004 – Integrating nutrition andphysical activity. Scandinavian Journal of Nutrition, 48(4), 178–187. http://dx.doi.org/10.1080/1102680410003794.
Bere, E., & Brug, J. (2009). Towards health-promoting and environmentally friendlyregional diets – A Nordic example. Public Health Nutrition, 12(1), 91–96. http://dx.doi.org/10.1017/S1368980008001985.
Biltoft-Jensen, A., Groth, M. V., Matthiessen, J., Wachmann, H., Christensen, T., &Fagt, S. (2009). Diet quality: Associations with health messages included in theDanish Dietary Guidelines 2005, personal attitudes and social factors. PublicHealth Nutrition, 12(8), 1165–1173. http://dx.doi.org/10.1017/S1368980008003662.
Cardello, A. V., Schutz, H., Snow, C., & Lesher, L. (2000). Predictors of foodacceptance, consumption and satisfaction in specific eating situations. FoodQuality and Preference, 11(3), 201–216. http://dx.doi.org/10.1016/S0950-3293(99)00055-5.
Dynesen, A. W., Haraldsdóttir, J., Holm, L., & Astrup, A. (2003). Sociodemographicdifferences in dietary habits described by food frequency questions–resultsfrom Denmark. European Journal of Clinical Nutrition, 57(12), 1586–1597. http://dx.doi.org/10.1038/sj.ejcn.1601728.
Groth, M. V., & Fagt, S. (2003). Danskernes kostvaner. Måltidsvaner, holdninger, socialeforskelle og sammenhæng med anden livsstil [The Danish diet. Meal habits,attitudes, social differences and relationship with other forms of lifestyle] (pp.2–156). Søborg: Fødevaredirektoratet [Danish Veterinary and FoodAdministration].
Groth, M. V., Fagt, S., Stockmarr, A., Matthiessen, J., & Biltoft-Jensen, A. (2009).Dimensions of socioeconomic position related to body mass index and obesityamong Danish women and men. Scandinavian Journal of Public Health, 37(4),418–426. http://dx.doi.org/10.1177/1403494809105284.
Holm, L. (1993). Cultural and social acceptability of a healthy diet. European Journalof Clinical Nutrition, 47(8), 592–599 [Available from http://www.ncbi.nlm.nih.gov/pubmed/8404795].
Holm, L., Hoff, A., Erichsen, L., Møhl, M., Toubro, S., & Astrup, A. (2008). Social andcultural acceptability of fat reduced diets among Danish overweight subjects:High-protein versus high-carbohydrate diets. Food Quality and Preference, 19(1),43–50. http://dx.doi.org/10.1016/j.foodqual.2007.06.001.
Hughner, R. S., McDonagh, P., Prothero, A., Shultz, C. J., Stanton, J., Hughner, S., et al.(2007). Who are organic food consumers? A compilation and review of whypeople purchase organic food. Journal of Consumer Behaviour, 6(2–3), 94–110.http://dx.doi.org/10.1002/cb.210.
Korzen, S., Sandøe, P., & Lassen, J. (2011). Don’t wash my meat: Public perceptions ofdecontamination in meat production. British Food Journal, 113(5), 598–612.http://dx.doi.org/10.1108/00070701111131719.
Kubberød, E., Ueland, Ø., Risvik, E., & Henjesand, I. J. (2006). A study on themediating role of disgust with meat in the prediction of red meat consumptionamong young females. Journal of Consumer Behaviour. http://dx.doi.org/10.1002/cb.180.
Lappalainen, R., Saba, A., Holm, L., Mykkanen, H., & Gibney, M. (1997). Difficulties intrying to eat healthier: Descriptive analysis of perceived barriers for healthyeating. European Journal of Clinical Nutrition, 51, s36–s40. http://dx.doi.org/10.1016/S0950-3293(98)00018-4.
Lau, C., Faerch, K., Glümer, C., Toft, U., Tetens, I., Borch-Johnsen, K., et al. (2004).Evaluation of dietary intake in a Danish population: The Inter99 study.Scandinavian Journal of Food & Nutrition, 48(3), 136–143. http://dx.doi.org/10.1080/11026480410000931.
Lund, T. B., Andersen, L. M., & Jensen, K. O. (2012). The emergence of diverseorganic consumers: Who are they and how do they shape demand? Copenhagen.Available from http://okonomi.foi.dk/workingpapers/WPpdf/WP2012/W...rganic_consumers. pdf.
McEwan, J. A., & Thomson, D. M. H. (1988). A behavioural interpretation of foodacceptability. Food Quality and Preference, 1(1), 3–9. http://dx.doi.org/10.1016/0950-3293(88)90002-X.
Meiselman, H. (2003). History of food acceptance research in the US Army. Appetite,40(3), 199–216. http://dx.doi.org/10.1016/S0195-6663(03)00007-2.
Meiselman Herbert, L., & MacFie, H. J. H. (1996). Food choice, acceptance andconsumption [p. 397]. Chapman and Hall.
Mennell, S., Murcott, A., & Van Otterloo, A. H. (1994). The sociology of food: Eating,diet, and culture. London: Sage.
Micheelsen, A., O’Doherty Jensen, K., & Holm, L. (n.d.). Living with the New NordicDiet. British Food Journal [in press].
Mithril, C., Dragsted, L. O., Meyer, C., Blauert, E., Holt, M. K., & Astrup, A. (2012).Guidelines for the New Nordic Diet. Public Health Nutrition, 1–7. http://dx.doi.org/10.1017/S136898001100351X.
Nielsen, A., Korzen, S., & Holm, L. (2008). Inverting the food pyramid? Social andcultural acceptability of Walter Willett’s dietary recommendations amongpeople with weight concerns. Appetite, 51(1), 178–186. http://dx.doi.org/10.1016/j.appet.2008.02.011.
Nielsen, A. (2005). Exercising freedom and control in the supermarket from anoverweight perspective. In T.-A. Wilska & L. Haanpää (Eds.), Lifestyles and socialchange: Essays in economic sociology (pp. 79–95). Turku: The Turku School ofEconomics and Business Administration.
Nordic Council of Ministers, (2013). New Nordic food II programme. Available fromhttp://newnordicfood.org/about-nnf-ii/ [January 05, 2013].
O’Doherty Jensen, K., & Holm, L. (1999). Preferences, quantities and concerns: Socio-cultural perspectives on the gendered consumption of foods. European Journal ofClinical Nutrition, 53(5), 351–359 [Available from http://www.ncbi.nlm.nih.gov/pubmed/10369489].
OPUS, (2009). Low hedonic value of the recommended diet as a barrier to consumeracceptance. foodoflife.dk. LIFE. Available from http://www.foodoflife.dk/Opus/English/background/bg6.aspx. [July 12, 2012]
Paul Kline (1993). An Easy Guide to Factor Analysis (Paperback) [p. 208]. Routledge.Paul Kline (1999). Handbook of psychological testing [p. 752] (2nd ed.). Routledge.Pedersen, A. N., Fagt, S., Groth, M. V., Christensen, T., Biltoft-Jensen, A., Matthiessen,
J., Trolle, E. (2010). Danskernes kostvaner 2003 – 2008 – Hovedresultater [Dietaryhabits in Denmark 2003-2008. Main results ]. Fødevareinstituttet, DanmarksTekniske Universitet. Available from http://www.foedevarestyrelsen.dk/SiteCollectionDocuments/25_PDF_word_filer til download/07kontor/Dansker-nesKostvaner2010.pdf.
Philippe, Aurier, Fatiha, Fort, & Lucie, Sirieix (2005). Exploring terroir productmeanings for the consumer. Anthropology of Food [Online, 4|, Online since 01May 2005, Available from http://aof.revues.org/187].
Pilgrim, F. J. (1957). The components of food acceptance and their measurement.The American Journal of Clinical Nutrition, 5(2), 171–175 [Available from http://www.ncbi.nlm.nih.gov/pubmed/13410821].
Poulsen, S. K., Due, A., Jordy, A. B., Kiens, B., Stark, K. D., Stender, S., et al. (2013).Health effect of the New Nordic Diet in adults with increased waistcircumference. A 6-mo randomized controlled trial. The American Journal ofClinical Nutrition. http://dx.doi.org/10.3945/ajcn.113.069393.
Resano, H., Pérez-Cueto, F. J. A., Sanjuán, A. I., De Barcellos, M. D., Grunert, K. G., &Verbeke, W. (2011). Consumer satisfaction with dry-cured ham in five Europeancountries. Meat Science, 87(4), 336–343. http://dx.doi.org/10.1016/j.meatsci.2010.11.008.
Sijtsema, S., Linnemann, A., Van Gaasbeek, T., Dagevos, H., & Jongen, W. (2002).Variables influencing food perception reviewed for consumer-oriented productdevelopment. Critical Reviews in Food Science and Nutrition, 42(6), 565–581.http://dx.doi.org/10.1080/20024091054256.
Skov, A. R., Toubro, S., Raben, A., & Astrup, A. (1997). A method to achieve control ofdietary macronutrient composition in ad libitum diets consumed by free-livingsubjects. European Journal of Clinical Nutrition, 51(10), 667–672 [Available fromhttp://www.ncbi.nlm.nih.gov/pubmed/9347286].
Squires, L., Juric, B., & Cornwell, T. B. (2001). Level of market development andintensity of organic food consumption: Cross-cultural study of Danish and NewZealand consumers. Journal of Consumer Marketing, 18(5), 392–409. http://dx.doi.org/10.1108/07363760110398754.
Steptoe, A., Pollard, T. M., & Wardle, J. (1995). Development of a measure of themotives underlying the selection of food: The food choice questionnaire.Appetite, 25(3), 267–284. http://dx.doi.org/10.1006/appe.1995.0061.
Torjusen, H., Sangstad, L., Kjærnes, U., & O’Doherty Jensen, K. (2004). Europeanconsumers’ conceptions of organic food: A review of available research. Reviewliterature and arts of the Americas (Vol. 4). Olso, Norway: National Institute forConsumer Research [Available from http://orgprints.org/00002490].