52
THE ACTION PLAN 2 0 2 1 CONTACT cabq.gov/visionzero Albuquerque’s Vision Zero Action Plan
THE ACTIONPLAN 2
021
CONTACTcabq.gov/visionzero
Albuquerque’s Vision Zero Action Plan
MESSAGE FROM MAYOR KELLER
ACKNOWLEDGMENTS
KEY TERMS
ACRONYMS + ABBREVIATIONS
WHAT IS VISION ZERO?
VISION ZERO COMMITMENT
ENGAGEMENT
DATA-INFORMED DECISIONS
IMPLEMENTATION PLAN
ENGINEERING + DESIGN
SAFE SPEEDS
POLICY, REGULATION + PRACTICE
EDUCATION + ENCOURAGEMENT
WALKING + ROLLING
DATA + TRANSPARENCY
IMPLEMENTATION + ACCOUNTABILITY
12468
1220222830343641434548
TABLE OF
CONTENTS
2020-2021
1
MESSAGE FROM MAYOR KELLER
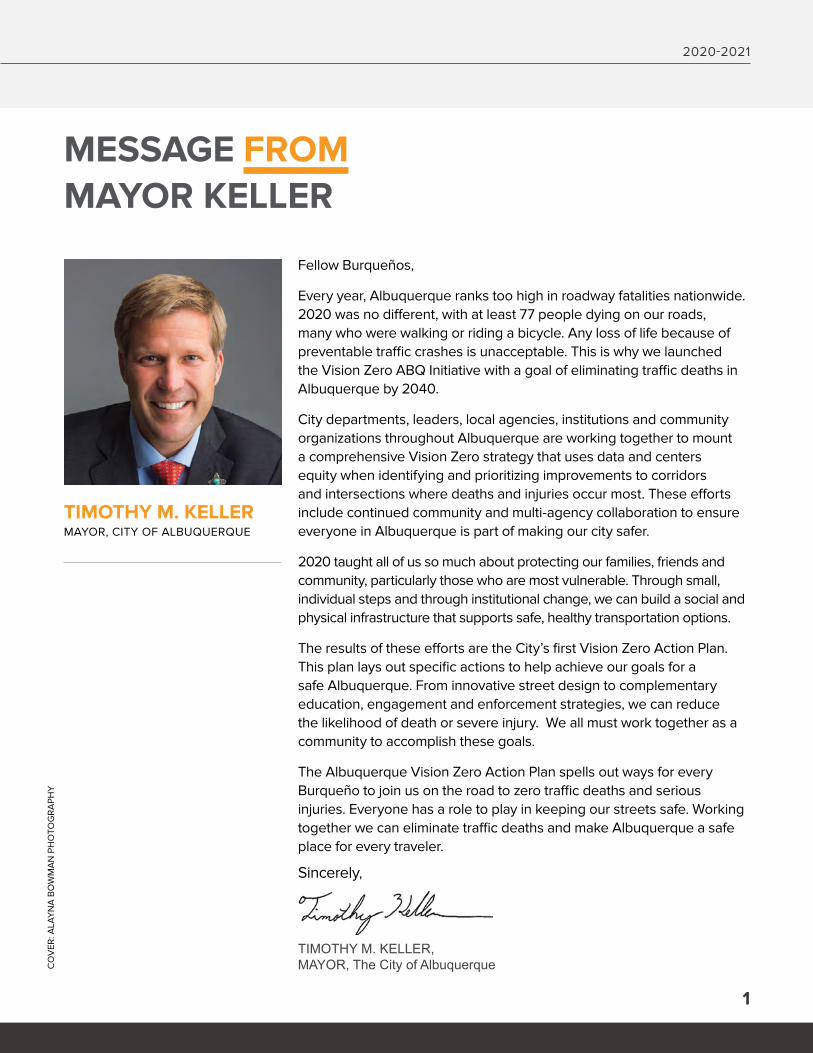
Fellow Burqueños,
Every year, Albuquerque ranks too high in roadway fatalities nationwide. 2020 was no different, with at least 77 people dying on our roads, many who were walking or riding a bicycle. Any loss of life because of preventable traffic crashes is unacceptable. This is why we launched the Vision Zero ABQ Initiative with a goal of eliminating traffic deaths in Albuquerque by 2040.
City departments, leaders, local agencies, institutions and community organizations throughout Albuquerque are working together to mount a comprehensive Vision Zero strategy that uses data and centers equity when identifying and prioritizing improvements to corridors and intersections where deaths and injuries occur most. These efforts include continued community and multi-agency collaboration to ensure everyone in Albuquerque is part of making our city safer.
2020 taught all of us so much about protecting our families, friends and community, particularly those who are most vulnerable. Through small, individual steps and through institutional change, we can build a social and physical infrastructure that supports safe, healthy transportation options.
The results of these efforts are the City’s first Vision Zero Action Plan. This plan lays out specific actions to help achieve our goals for a safe Albuquerque. From innovative street design to complementary education, engagement and enforcement strategies, we can reduce the likelihood of death or severe injury. We all must work together as a community to accomplish these goals.
The Albuquerque Vision Zero Action Plan spells out ways for every Burqueño to join us on the road to zero traffic deaths and serious injuries. Everyone has a role to play in keeping our streets safe. Working together we can eliminate traffic deaths and make Albuquerque a safe place for every traveler.
TIMOTHY M. KELLERMAYOR, CITY OF ALBUQUERQUE
TIMOTHY M. KELLER, MAYOR, The City of Albuquerque
Sincerely,
CO
VER
: ALA
YN
A B
OW
MA
N P
HO
TOG
RA
PHY
VISION ZERO ACTION PLAN
2
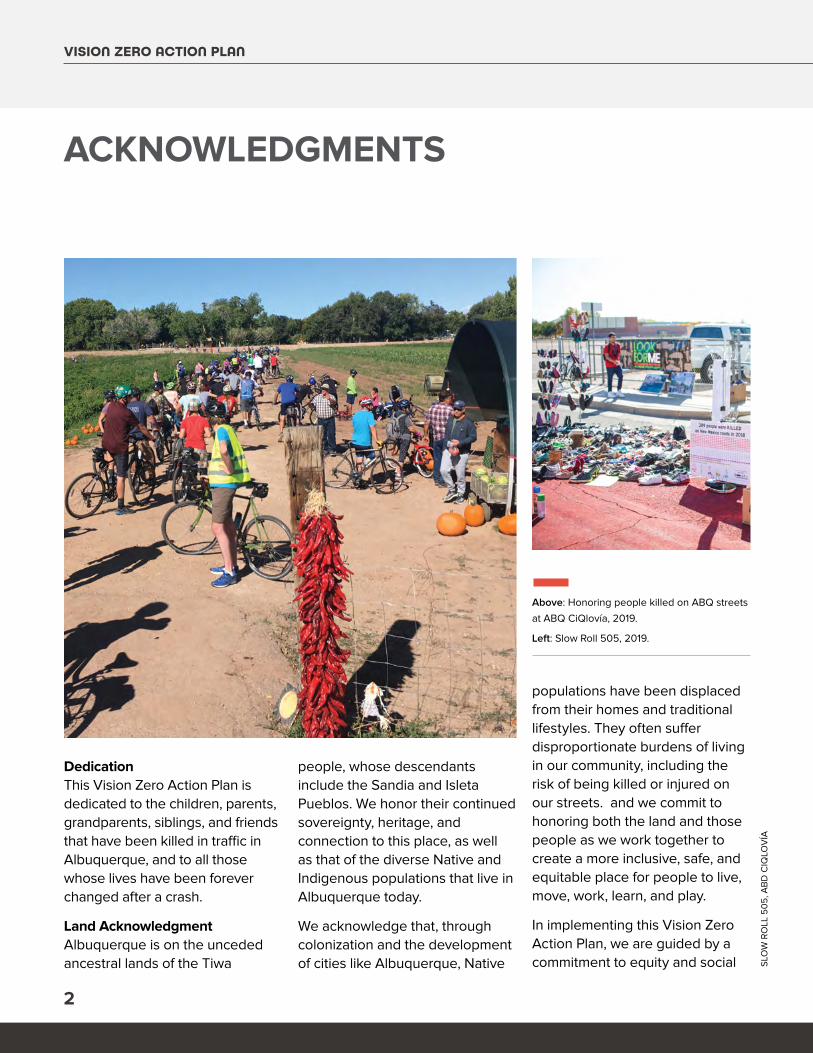
DedicationThis Vision Zero Action Plan is dedicated to the children, parents, grandparents, siblings, and friends that have been killed in traffic in Albuquerque, and to all those whose lives have been forever changed after a crash.
Land AcknowledgmentAlbuquerque is on the unceded ancestral lands of the Tiwa
ACKNOWLEDGMENTS
people, whose descendants include the Sandia and Isleta Pueblos. We honor their continued sovereignty, heritage, and connection to this place, as well as that of the diverse Native and Indigenous populations that live in Albuquerque today.
We acknowledge that, through colonization and the development of cities like Albuquerque, Native
populations have been displaced from their homes and traditional lifestyles. They often suffer disproportionate burdens of living in our community, including the risk of being killed or injured on our streets. and we commit to honoring both the land and those people as we work together to create a more inclusive, safe, and equitable place for people to live, move, work, learn, and play.
In implementing this Vision Zero Action Plan, we are guided by a commitment to equity and social
Above: Honoring people killed on ABQ streets
at ABQ CiQlovía, 2019.
Left: Slow Roll 505, 2019.
SLO
W R
OLL
50
5, A
BD
CIQ
LOV
ÍA
2020-2021
3
justice. Our goal is to make our streets safer for all residents of and visitors to Albuquerque, with a particular focus on those who are most vulnerable on our roads because they walk, bike, take transit, or are experiencing or at risk of homelessness. We are committed to working with Native people and organizations to identify context- and people-sensitive solutions to traffic safety concerns as part of building a culture of care, safety, and accountability for all people using our roads.
AcknowledgmentsThis Vision Zero Action Plan exists because of the work of stakeholders dedicated to making their community safer and promoting equitable, healthy, and accessible transportation options in Albuquerque.
We want to thank all of the City and agency staff, community organizations, and advocates who have dedicated time and resources to developing this Vision Zero Action Plan. This commitment to supporting the shift to a culture of safety is critical to the success of Vision Zero in Albuquerque.
The following City departments, local agencies, and community partners have engaged in Vision Zero as direct participants in
*Made possible, in part, by funding from the Centers for Disease Control and Prevention through the Racial and Ethnic Approaches to Community Health (REACH) initiative.
the Task Force or through other partnerships:
City Departments• Mayor’s Office• City Council• Department of Municipal Development (DMD)• Albuquerque Police Department (APD)• Transit• Parks + Recreation• Planning• Environmental Health• Risk Management• Equity + Inclusion• Civil Rights / Americans with Disabilities Act (ADA)• Economic Development• Technology + Innovation
Local Agencies• Albuquerque Public Schools (APS) – Capital Master Plan• Bernalillo County Public Works• Mid-Region Council of Governments (MRCOG)/ Mid-Region Metropolitan Planning Organization (MRMPO)• New Mexico Department of Transportation (NMDOT)• Look For Me – UNM Health
Sciences Center / Center for Injury Prevention Research and Education
Community PartnersVision Zero community partners include individuals and community organizations that support Vision Zero efforts. The following organizations have been represented in the Vision Zero Task Force or other Vision Zero initiatives, in addition to individuals that participate as advocates.
• ABQ CiQlovía• American Traffic Safety Services Association• Barelas Community Coalition• Bernalillo County Health Council/Healthy Here Initiative*• BikeABQ• International District Healthy Communities Coalition• Presbyterian Community Health*• Southwest Bike Initiative• The Wilderness Society• Together for Brothers• UNM School of Engineering• Urban ABQ• Vision Zero ABQ
VISION ZERO ACTION PLAN
4
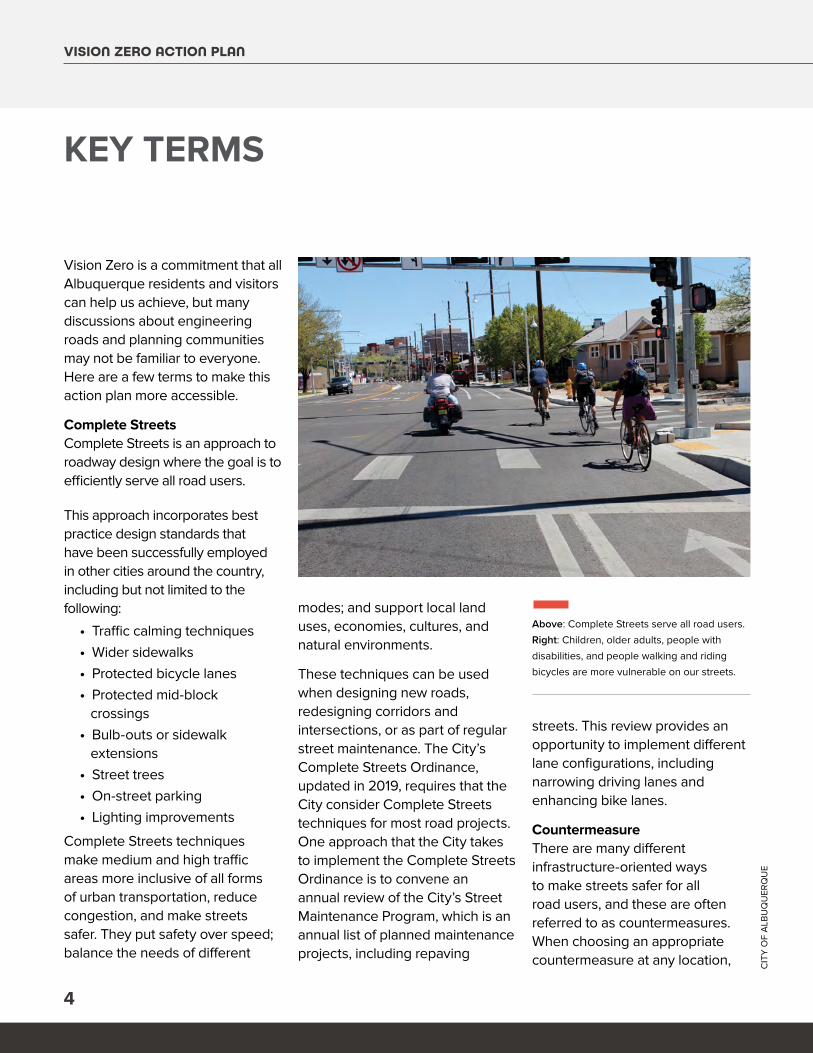
Above: Complete Streets serve all road users.
Right: Children, older adults, people with
disabilities, and people walking and riding
bicycles are more vulnerable on our streets.
Vision Zero is a commitment that all Albuquerque residents and visitors can help us achieve, but many discussions about engineering roads and planning communities may not be familiar to everyone. Here are a few terms to make this action plan more accessible.
Complete StreetsComplete Streets is an approach to roadway design where the goal is to efficiently serve all road users.
This approach incorporates best practice design standards that have been successfully employed in other cities around the country, including but not limited to the following:
• Traffic calming techniques• Wider sidewalks• Protected bicycle lanes• Protected mid-block crossings• Bulb-outs or sidewalk extensions • Street trees• On-street parking• Lighting improvements
Complete Streets techniques make medium and high traffic areas more inclusive of all forms of urban transportation, reduce congestion, and make streets safer. They put safety over speed; balance the needs of different
modes; and support local land uses, economies, cultures, and natural environments.
These techniques can be used when designing new roads, redesigning corridors and intersections, or as part of regular street maintenance. The City’s Complete Streets Ordinance, updated in 2019, requires that the City consider Complete Streets techniques for most road projects. One approach that the City takes to implement the Complete Streets Ordinance is to convene an annual review of the City’s Street Maintenance Program, which is an annual list of planned maintenance projects, including repaving
KEY TERMS
streets. This review provides an opportunity to implement different lane configurations, including narrowing driving lanes and enhancing bike lanes.
CountermeasureThere are many different infrastructure-oriented ways to make streets safer for all road users, and these are often referred to as countermeasures. When choosing an appropriate countermeasure at any location, C
ITY
OF
ALB
UQ
UER
QU
E
2020-2021
5
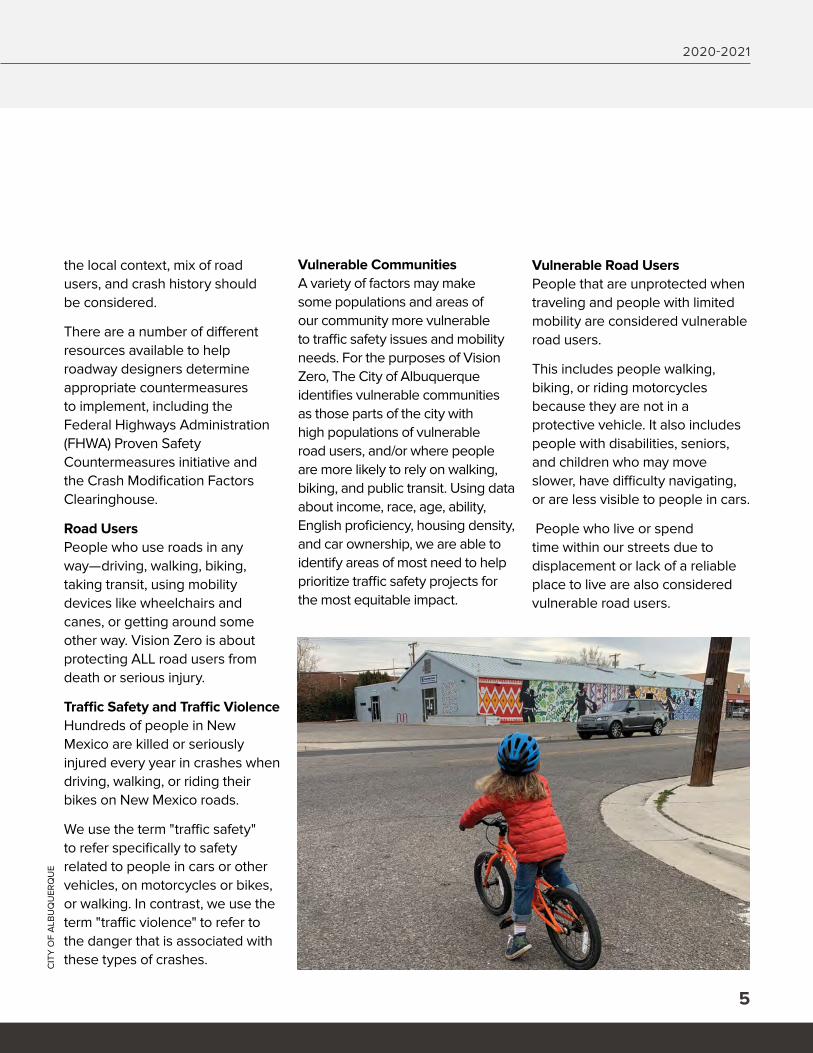
Vulnerable Road UsersPeople that are unprotected when traveling and people with limited mobility are considered vulnerable road users.
This includes people walking, biking, or riding motorcycles because they are not in a protective vehicle. It also includes people with disabilities, seniors, and children who may move slower, have difficulty navigating, or are less visible to people in cars.
People who live or spend time within our streets due to displacement or lack of a reliable place to live are also considered vulnerable road users.
the local context, mix of road users, and crash history should be considered.
There are a number of different resources available to help roadway designers determine appropriate countermeasures to implement, including the Federal Highways Administration (FHWA) Proven Safety Countermeasures initiative and the Crash Modification Factors Clearinghouse.
Road UsersPeople who use roads in any way—driving, walking, biking, taking transit, using mobility devices like wheelchairs and canes, or getting around some other way. Vision Zero is about protecting ALL road users from death or serious injury.
Traffic Safety and Traffic ViolenceHundreds of people in New Mexico are killed or seriously injured every year in crashes when driving, walking, or riding their bikes on New Mexico roads.
We use the term "traffic safety" to refer specifically to safety related to people in cars or other vehicles, on motorcycles or bikes, or walking. In contrast, we use the term "traffic violence" to refer to the danger that is associated with these types of crashes.
Vulnerable CommunitiesA variety of factors may make some populations and areas of our community more vulnerable to traffic safety issues and mobility needs. For the purposes of Vision Zero, The City of Albuquerque identifies vulnerable communities as those parts of the city with high populations of vulnerable road users, and/or where people are more likely to rely on walking, biking, and public transit. Using data about income, race, age, ability, English proficiency, housing density, and car ownership, we are able to identify areas of most need to help prioritize traffic safety projects for the most equitable impact.
CIT
Y O
F A
LBU
QU
ERQ
UE
VISION ZERO ACTION PLAN
6
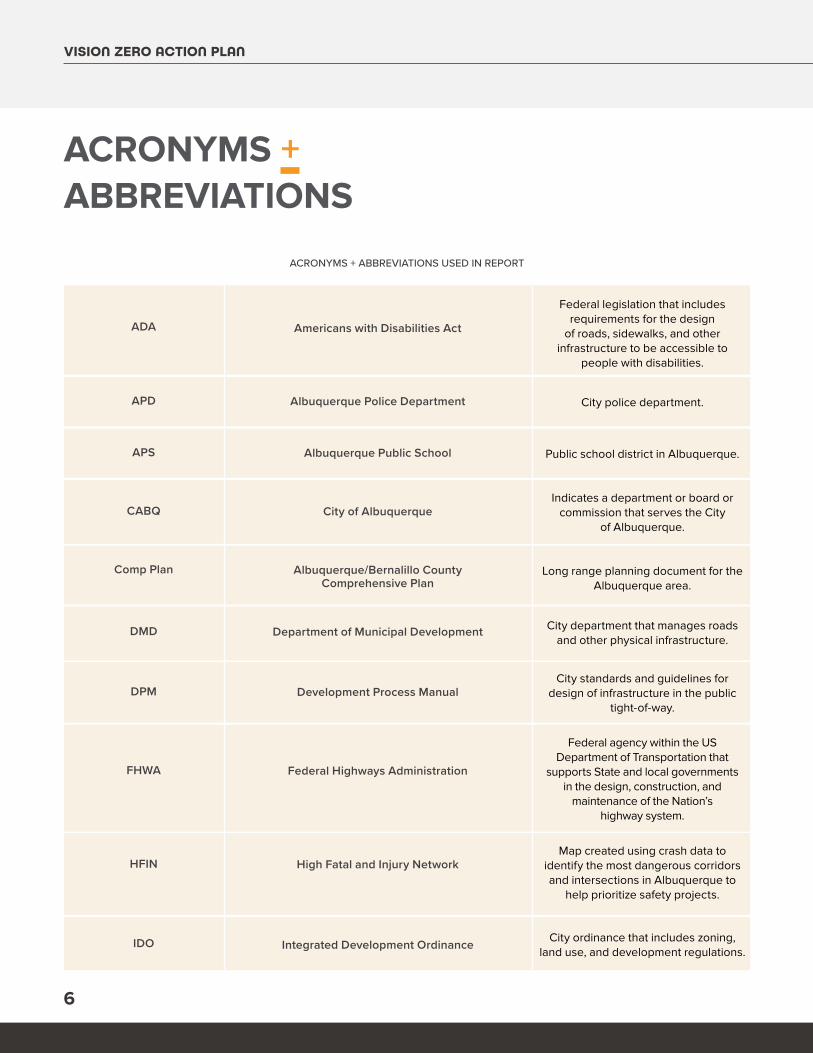
ADA
APD
APS
DPM
FHWA
DMD
Comp Plan
IDO
CABQ
HFIN
Americans with Disabilities Act
Albuquerque Police Department
Albuquerque Public School
Development Process Manual
Federal Highways Administration
Department of Municipal Development
Albuquerque/Bernalillo County Comprehensive Plan
Integrated Development Ordinance
City of Albuquerque
High Fatal and Injury Network
Federal legislation that includes requirements for the design
of roads, sidewalks, and other infrastructure to be accessible to
people with disabilities.
City police department.
Public school district in Albuquerque.
City standards and guidelines for design of infrastructure in the public
tight-of-way.
Federal agency within the US Department of Transportation that
supports State and local governments in the design, construction, and
maintenance of the Nation’s highway system.
City department that manages roads and other physical infrastructure.
Long range planning document for the Albuquerque area.
City ordinance that includes zoning, land use, and development regulations.
Indicates a department or board or commission that serves the City
of Albuquerque.
Map created using crash data to identify the most dangerous corridors and intersections in Albuquerque to
help prioritize safety projects.
ACRONYMS + ABBREVIATIONS USED IN REPORT
ACRONYMS + ABBREVIATIONS
2020-2021
7
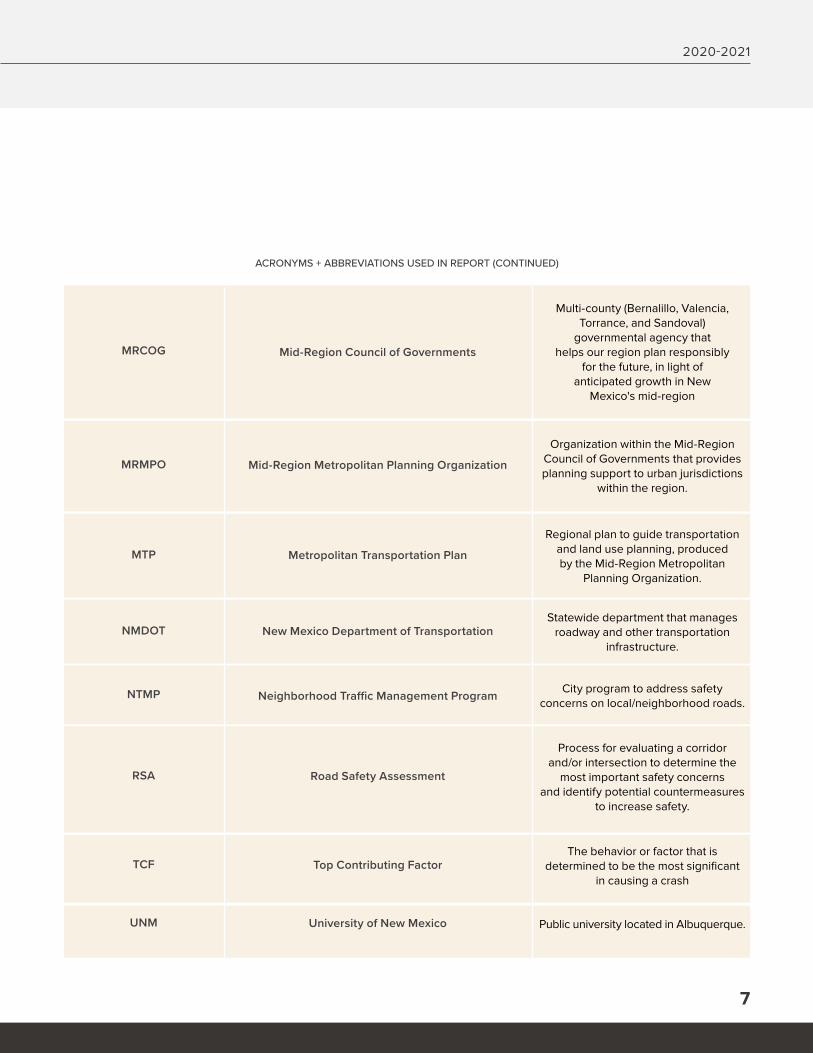
MRCOG
MRMPO
MTP
TCF
UNM
RSA
NTMP
NMDOT
Mid-Region Council of Governments
Mid-Region Metropolitan Planning Organization
Metropolitan Transportation Plan
Top Contributing Factor
University of New Mexico
Road Safety Assessment
Neighborhood Traffic Management Program
New Mexico Department of Transportation
Multi-county (Bernalillo, Valencia, Torrance, and Sandoval)
governmental agency that helps our region plan responsibly
for the future, in light of anticipated growth in New
Mexico's mid-region
Organization within the Mid-Region Council of Governments that provides planning support to urban jurisdictions
within the region.
Regional plan to guide transportation and land use planning, produced by the Mid-Region Metropolitan
Planning Organization.
The behavior or factor that is determined to be the most significant
in causing a crash
Public university located in Albuquerque.
Process for evaluating a corridor and/or intersection to determine the
most important safety concerns and identify potential countermeasures
to increase safety.
City program to address safety concerns on local/neighborhood roads.
Statewide department that manages roadway and other transportation
infrastructure.
ACRONYMS + ABBREVIATIONS USED IN REPORT (CONTINUED)
VISION ZERO ACTION PLAN
8
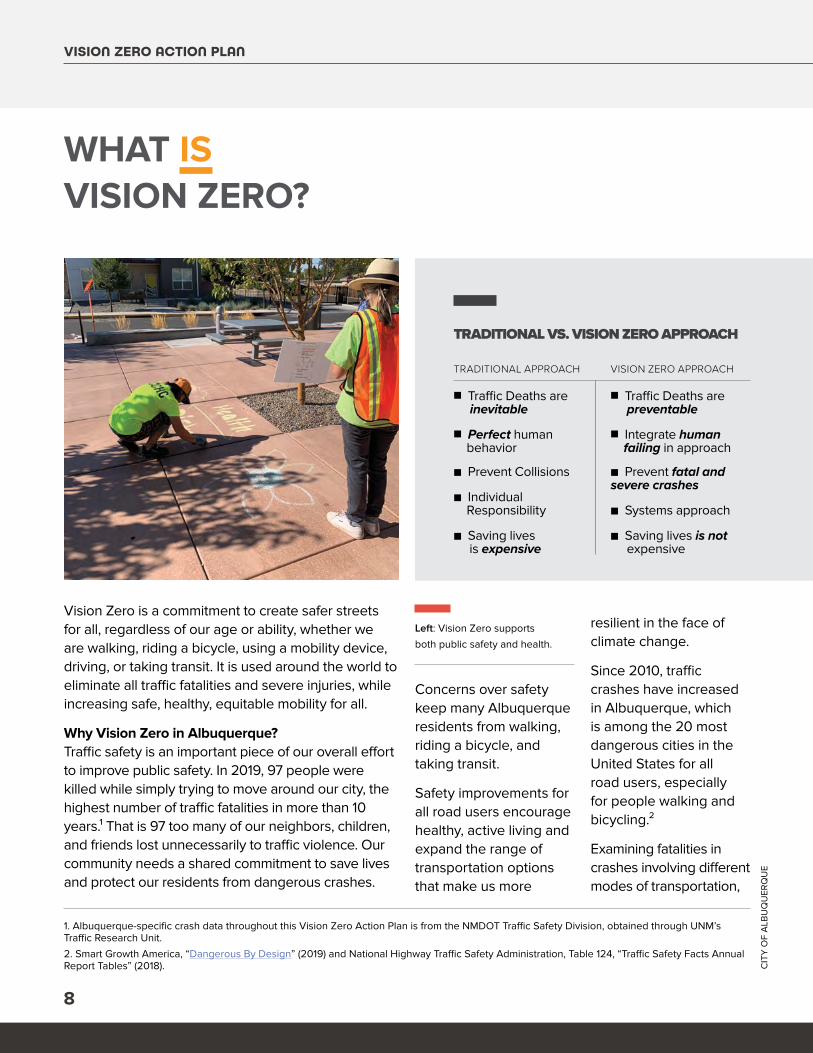
WHAT IS VISION ZERO?
Vision Zero is a commitment to create safer streets for all, regardless of our age or ability, whether we are walking, riding a bicycle, using a mobility device, driving, or taking transit. It is used around the world to eliminate all traffic fatalities and severe injuries, while increasing safe, healthy, equitable mobility for all.
Why Vision Zero in Albuquerque?Traffic safety is an important piece of our overall effort to improve public safety. In 2019, 97 people were killed while simply trying to move around our city, the highest number of traffic fatalities in more than 10 years.¹ That is 97 too many of our neighbors, children, and friends lost unnecessarily to traffic violence. Our community needs a shared commitment to save lives and protect our residents from dangerous crashes.
Concerns over safety keep many Albuquerque residents from walking, riding a bicycle, and taking transit.
Safety improvements for all road users encourage healthy, active living and expand the range of transportation options that make us more
1. Albuquerque-specific crash data throughout this Vision Zero Action Plan is from the NMDOT Traffic Safety Division, obtained through UNM’s Traffic Research Unit.
2. Smart Growth America, “Dangerous By Design” (2019) and National Highway Traffic Safety Administration, Table 124, “Traffic Safety Facts Annual Report Tables” (2018).
resilient in the face of climate change.
Since 2010, traffic crashes have increased in Albuquerque, which is among the 20 most dangerous cities in the United States for all road users, especially for people walking and bicycling.²
Examining fatalities in crashes involving different modes of transportation,
TRADITIONAL VS. VISION ZERO APPROACH
TRADITIONAL APPROACH VISION ZERO APPROACH
■ Traffic Deaths are inevitable
■ Perfect human behavior
■ Prevent Collisions
■ Individual Responsibility
■ Saving lives is expensive
■ Traffic Deaths are preventable
■ Integrate human failing in approach
■ Prevent fatal and severe crashes
■ Systems approach
■ Saving lives is not expensive
CIT
Y O
F A
LBU
QU
ERQ
UE
Left: Vision Zero supports
both public safety and health.
2020-2021
9
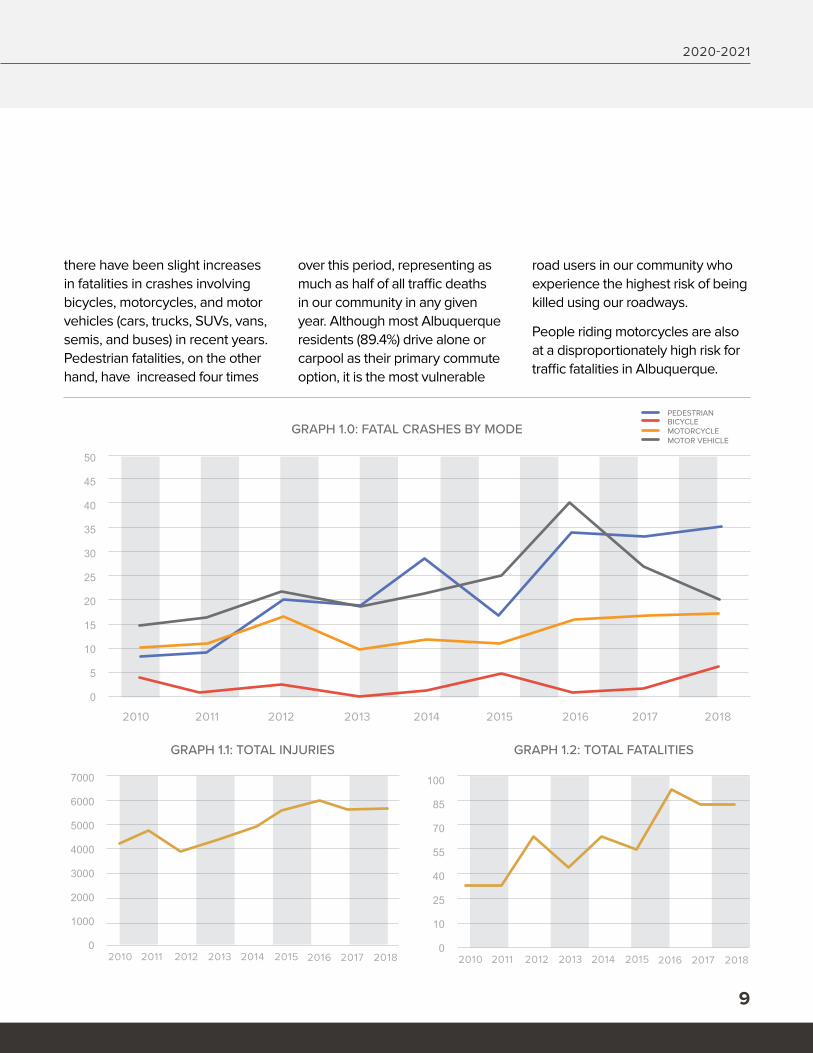
GRAPH 1.1: TOTAL INJURIES GRAPH 1.2: TOTAL FATALITIES
2010 20102013 20132012 20122015 20152017 2018 2017 20182011 20112014 20142016 2016
7000
6000
5000
4000
3000
2000
1000
0
100
85
70
55
40
25
10
0
GRAPH 1.0: FATAL CRASHES BY MODE
2010 2012 2013 20162014 20172015 20182011
50
45
40
35
30
25
20
15
10
5
0
PEDESTRIANBICYCLEMOTORCYCLEMOTOR VEHICLE
there have been slight increases in fatalities in crashes involving bicycles, motorcycles, and motor vehicles (cars, trucks, SUVs, vans, semis, and buses) in recent years. Pedestrian fatalities, on the other hand, have increased four times
over this period, representing as much as half of all traffic deaths in our community in any given year. Although most Albuquerque residents (89.4%) drive alone or carpool as their primary commute option, it is the most vulnerable
road users in our community who experience the highest risk of being killed using our roadways.
People riding motorcycles are also at a disproportionately high risk for traffic fatalities in Albuquerque.
VISION ZERO ACTION PLAN
10
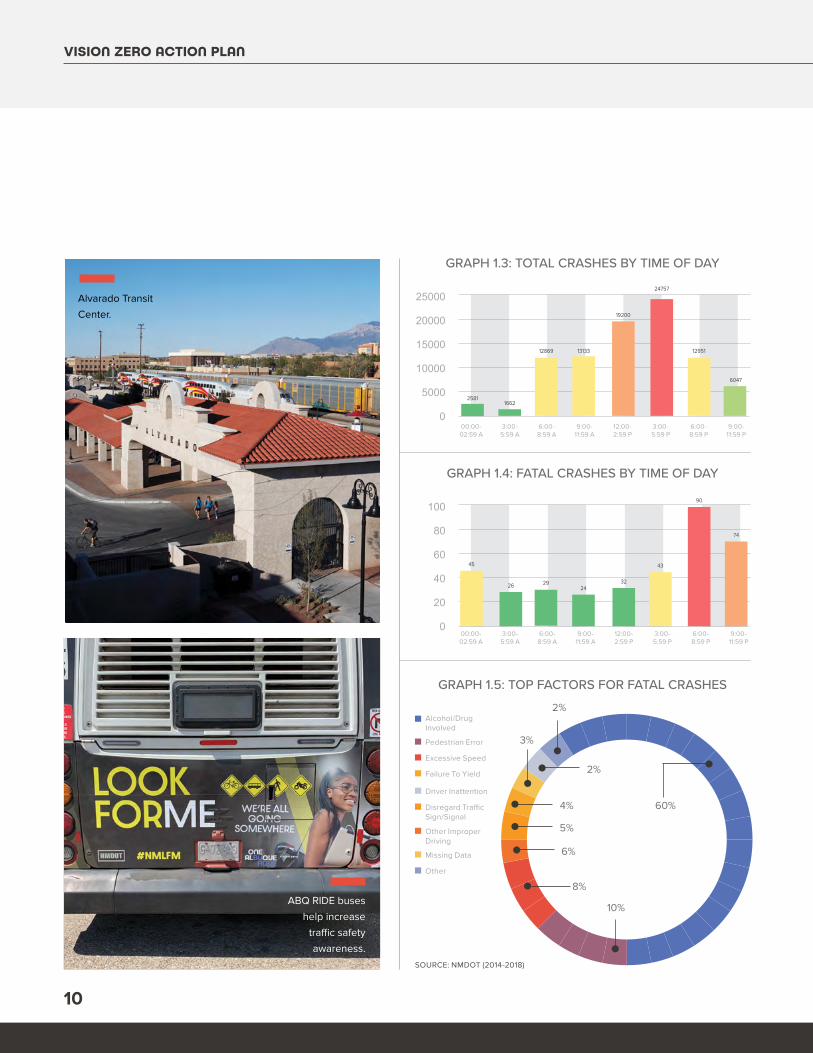
GRAPH 1.4: FATAL CRASHES BY TIME OF DAY
100
80
60
40
20
000:00-02:59 A
9:00-11:59 A
6:00-8:59 A
3:00-5:59 P
9:00-11:59 P
3:00-5:59 A
12:00-2:59 P
6:00-8:59 P
45 43
90
74
26 243229
GRAPH 1.3: TOTAL CRASHES BY TIME OF DAY
00:00-02:59 A
9:00-11:59 A
6:00-8:59 A
3:00-5:59 P
9:00-11:59 P
3:00-5:59 A
12:00-2:59 P
6:00-8:59 P
25000
20000
15000
10000
5000
0
25811662
13133
19200
24757
12869 12951
6047
GRAPH 1.5: TOP FACTORS FOR FATAL CRASHES
Alcohol/Drug Involved
Excessive Speed
Driver Inattention
Pedestrian Error
Missing Data
Other Improper Driving
Disregard Traffic Sign/Signal
Other
60%
3%
10%
8%
6%
5%
4%
2%
2%
Failure To Yield
Alvarado Transit
Center.
ABQ RIDE buses
help increase
traffic safety
awareness.SOURCE: NMDOT (2014-2018)
2020-2021
11
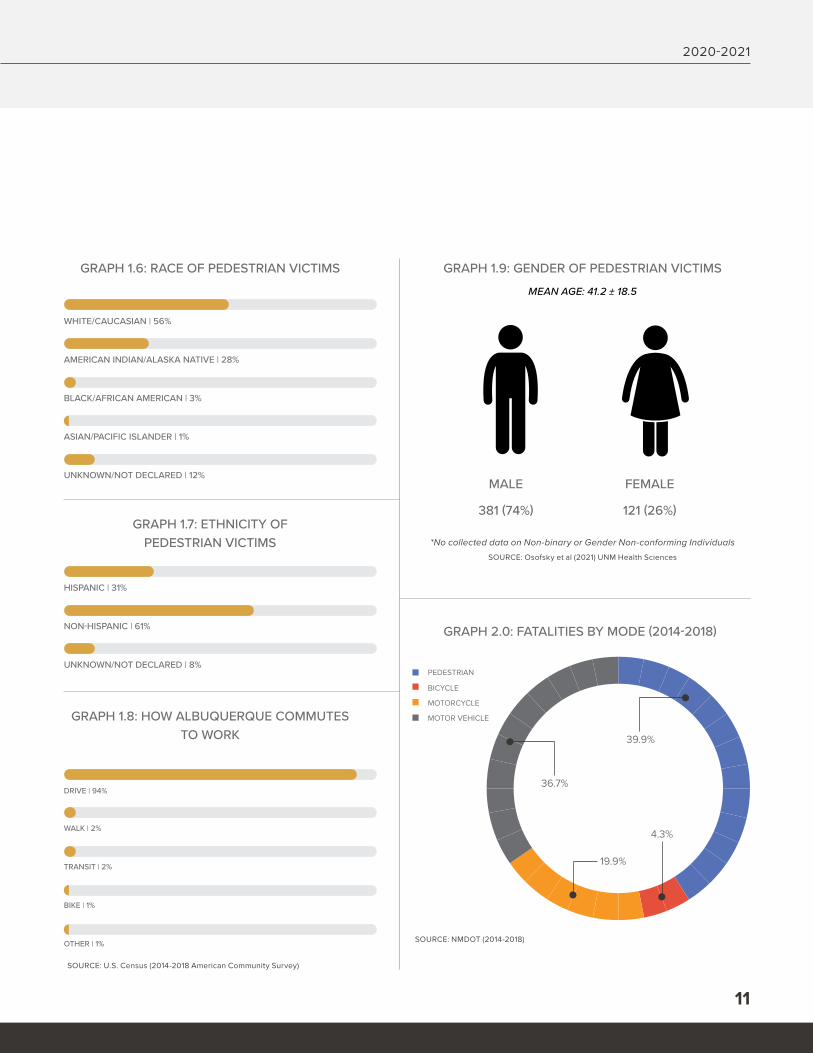
MALE FEMALE
381 (74%) 121 (26%)
GRAPH 1.9: GENDER OF PEDESTRIAN VICTIMS
MEAN AGE: 41.2 ± 18.5
*No collected data on Non-binary or Gender Non-conforming IndividualsSOURCE: Osofsky et al (2021) UNM Health Sciences
GRAPH 1.7: ETHNICITY OF PEDESTRIAN VICTIMS
HISPANIC | 31%
UNKNOWN/NOT DECLARED | 8%
NON-HISPANIC | 61%
GRAPH 1.6: RACE OF PEDESTRIAN VICTIMS
WHITE/CAUCASIAN | 56%
UNKNOWN/NOT DECLARED | 12%
BLACK/AFRICAN AMERICAN | 3%
AMERICAN INDIAN/ALASKA NATIVE | 28%
ASIAN/PACIFIC ISLANDER | 1%
GRAPH 2.0: FATALITIES BY MODE (2014-2018)
39.9%
36.7%
19.9%
4.3%
PEDESTRIAN
BICYCLE
MOTORCYCLE
MOTOR VEHICLE
SOURCE: NMDOT (2014-2018)
SOURCE: U.S. Census (2014-2018 American Community Survey)
GRAPH 1.8: HOW ALBUQUERQUE COMMUTES TO WORK
DRIVE | 94%
OTHER | 1%
TRANSIT | 2%
WALK | 2%
BIKE | 1%
VISION ZERO ACTION PLAN
12
VISION ZERO COMMITMENT
This Vision Zero Action Plan establishes a road map for Albuquerque to improve traffic safety today and eliminate traffic deaths and serious injuries by 2040. Through this Action Plan, we are committed to safety and equity.
Prioritizing safety improvements for the most dangerous roads and intersections and protecting the most vulnerable road users are key to achieving Vision Zero goals.
In 2019, Mayor Keller made a commitment to Vision Zero, joining over 40 other U.S. communities in a commitment to eliminating traffic deaths and serious injuries. As
part of this commitment, the City acknowledges that streets are for everyone and that Albuquerque residents and visitors should be able to get where they need and want to go safely, regardless of how they travel.
This Vision Zero Action Plan provides background information about traffic safety issues and initiatives in Albuquerque, and describes planned actions to make our streets safer and eliminate traffic fatalities. The following 6 thematic goals describe different approaches to traffic safety that Vision Zero in Albuquerque will take:
Engineering + Design Prioritize the safety of all road users and use Complete Streets design principles when designing, building, and reconstructing roads.
Safe Speeds Implement speed management.
Policy, Regulation + Practice Establish and advocate for proactive and equitable policies, regulations, and practices that center safety for all roadway users.
Education + Encouragement Promote a culture of safety and care among all road users.
Walking + Rolling Increase opportunities for people throughout the city, particularly in vulnerable communities, to safely walk, ride a bicycle, use mobility devices, and take transit.
Data + Transparency Use data to make decisions, prioritize funding, and evaluate traffic safety projects to ensure that Vision Zero initiatives are equitable and A
LAY
NA
BO
WM
AN
PH
OTO
GR
APH
Y; P
REV
IOU
S PA
GES
: FR
EE A
BQ
IMA
GES
(2)
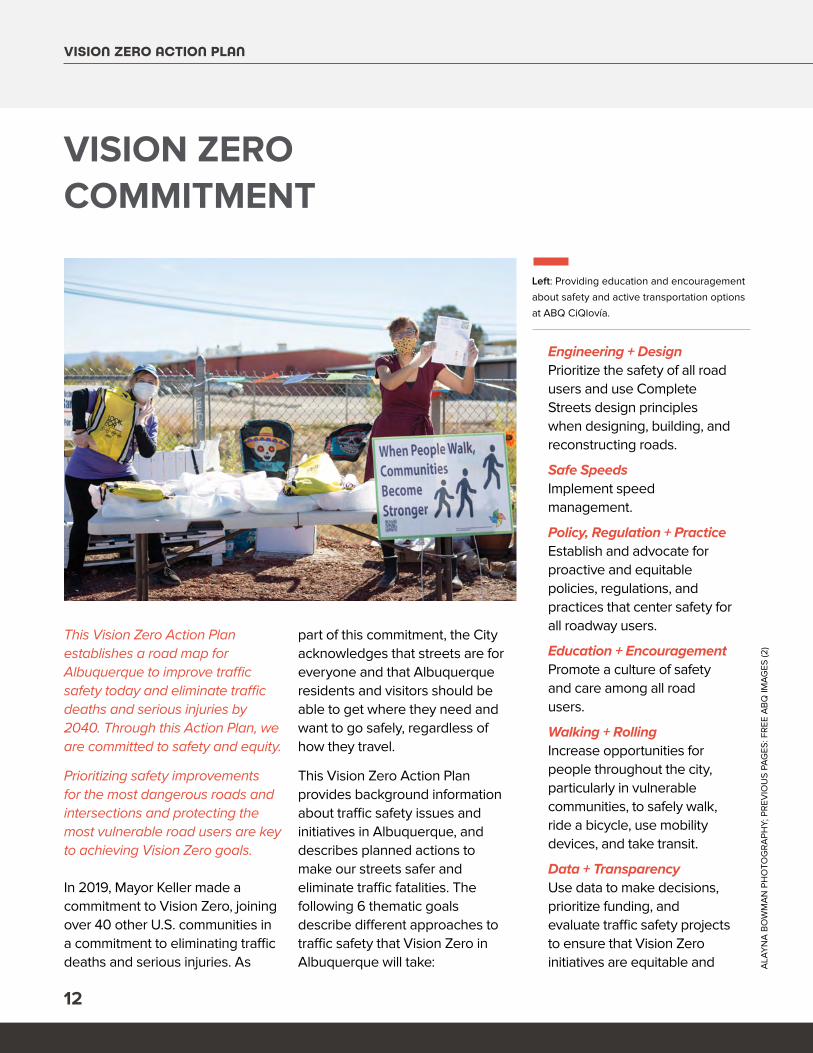
Left: Providing education and encouragement
about safety and active transportation options
at ABQ CiQlovía.
2020-2021
13
transparent. Document and incorporate people’s lived experiences as data to ensure that community perspectives are considered.
Action items to implement these thematic goals were identified by the Vision Zero Task Force, Vision Zero community partners, and through community input in the 2020 Vision Zero Prioritization Survey.
Best practices from other Vision Zero communities were also considered in developing this Action Plan.
In order to center safety and equity in Vision Zero, the following two datasets will be used to help prioritize Vision Zero efforts in Albuquerque, while also considering context and where people need to go:
• High Fatal and Injury Network (HFIN): Identifies roadway segments and intersections where fatal and injury crashes are most common. Includes analysis of pedestrian- and bicyclist-involved crashes.
• Vulnerable Communities: Identifies Census tracts where residents are more likely to rely on walking, riding a bicycle, and taking public transit, and therefore to be more vulnerable to traffic violence.
Creating a Culture of Care: A Call to ActionGetting to zero traffic deaths and serious injuries requires a commitment from all of us to help create a culture of care on the streets of Albuquerque. We can
all make safe choices, watch out for one another on the road, and follow traffic laws:
Respect all other road users We are all going somewhere, and we all have the right to get there safely.
Slow down Lower speeds save lives!
Eliminate distractions Focus on the road and look for other people.
Stop at lights and stop signs Make a complete stop and look for other people walking, riding a bicycle, and driving before proceeding.
Yield to others Particularly those walking and riding a bicycle; be extra cautious near crossings.
Consider walking or biking for short trips It’s good for your health and the environment, reduces congestion, and may help raise the visibility of people walking and riding bicycles.
Drive sober Never drive when under the influence of drugs or alcohol.C
ITY
OF
ALB
UQ
UER
QU
E
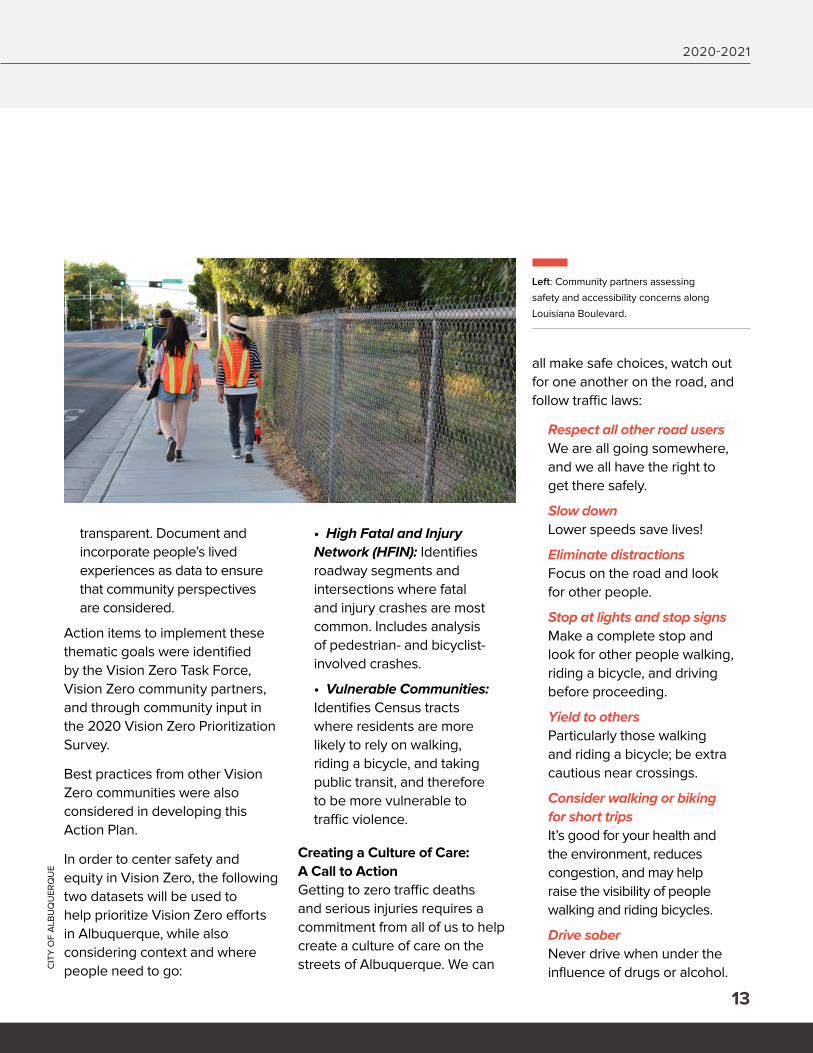
Left: Community partners assessing
safety and accessibility concerns along
Louisiana Boulevard.
VISION ZERO ACTION PLAN
14
With these action steps in mind, the Albuquerque Safe Streets Pledge, launched in summer 2020, is an ongoing opportunity for all Albuquerque residents to make their own commitment to help Albuquerque get to zero traffic deaths and serious injuries.
Centering Equity in Vision ZeroSafe, convenient, and comfortable transportation options and rates of traffic violence are not equitably distributed throughout the city.
Communities with higher populations of people with
disabilities, children, older adults, people of color, and people who rely on riding a bicycle, walking, and public transit often have a higher incidence of traffic crashes than other communities.
These communities also tend to experience far less investment in infrastructure improvements that create safe travel options. Compounded in vulnerable communities, these factors detract from quality of life, health, and the ability of residents to overcome transportation challenges and get where they need to go. Given all
of these factors, it is important to prioritize traffic safety projects in the areas where people are most vulnerable.
In addressing traffic safety, Vision Zero efforts must also consider different transportation needs and safety issues in different parts of the city. Context-sensitive solutions may include installing more frequent pedestrian crossings where pedestrian-involved crashes are most common and in areas where more people walk for transportation, or prioritizing accessibility improvements in areas with higher populations of people with disabilities or with facilities that serve people with disabilities.
Nationally and locally, people of color are at higher risk of being killed while walking, and crashes, particularly those involving people walking, are more common in vulnerable communities. Indigenous people carry a particularly disproportionate burden of the risk of being killed while walking. These trends exacerbate the impacts of systemic racism and inequity in vulnerable communities. Vision Zero projects must be prioritized in these areas, particularly where fatal and injury crashes are disproportionately common.
CIT
Y O
F A
LBU
QU
ERQ
UE
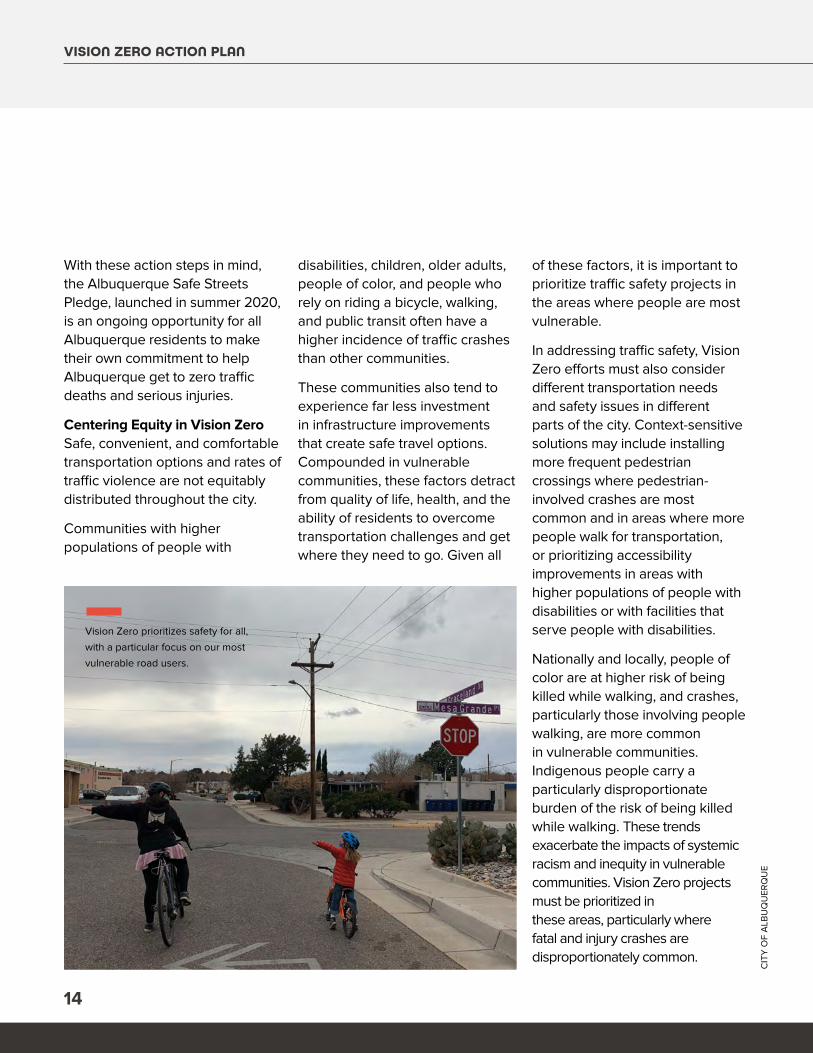
Vision Zero prioritizes safety for all,
with a particular focus on our most
vulnerable road users.
2020-2021
15
In addition to prioritizing projects along the HFIN and in vulnerable communities, Vision Zero acknowledges that communities of color and low-income communities often experience over-policing, gentrification, and lack of trust in government.
To build trust, Vision Zero should prioritize traffic safety initiatives in vulnerable communities that center community agency and promote collaboration with local individuals and organizations. Any enforcement efforts in these communities should prioritize top contributing factors, and should include community engagement and equity components.
Policing and Vision ZeroIn 2020, as we drafted this Action Plan, social movements raised awareness about police brutality and systemic racism within law enforcement, including myriad traffic stops that escalate to the killing of people of color by police.
In response, Vision Zero communities around the country are working to address the impacts of policing, particularly in communities of color, where people are also more vulnerable to traffic violence.
In addition to racial bias in policing, citations for people
walking and riding a bicycle often overburden already vulnerable people, particularly where laws for pedestrians and bicyclists are unclear and written to prioritize the movement of vehicles over the movement of people.
In the 2020 Vision Zero Prioritization Survey, many respondents identified enforcement as an important way to improve safety. These results may not adequately reflect the entire community’s concerns over enforcement strategies, considering the small sample of the survey and the fact that BIPOC and young respondents were underrepresented.
Over-policing and its impacts were identified as an area of concern in work with some Vision Zero partner organizations.
In New Mexico, traffic citations can only be issued by sworn police officers, so there is a role for law enforcement in Vision Zero, but that work must be deliberate about eliminating disproportionate negative impacts on our most vulnerable communities and focusing on the most dangerous behaviors. Automated enforcement is one way to reduce (although not eliminate) racially biased enforcement; in addition, police officers should have anti-racism and anti-bias training and tools to educate and encourage road users to practice safe behaviors. The need for enforcement may also be reduced C
ITY
OF
ALB
UQ
UER
QU
E
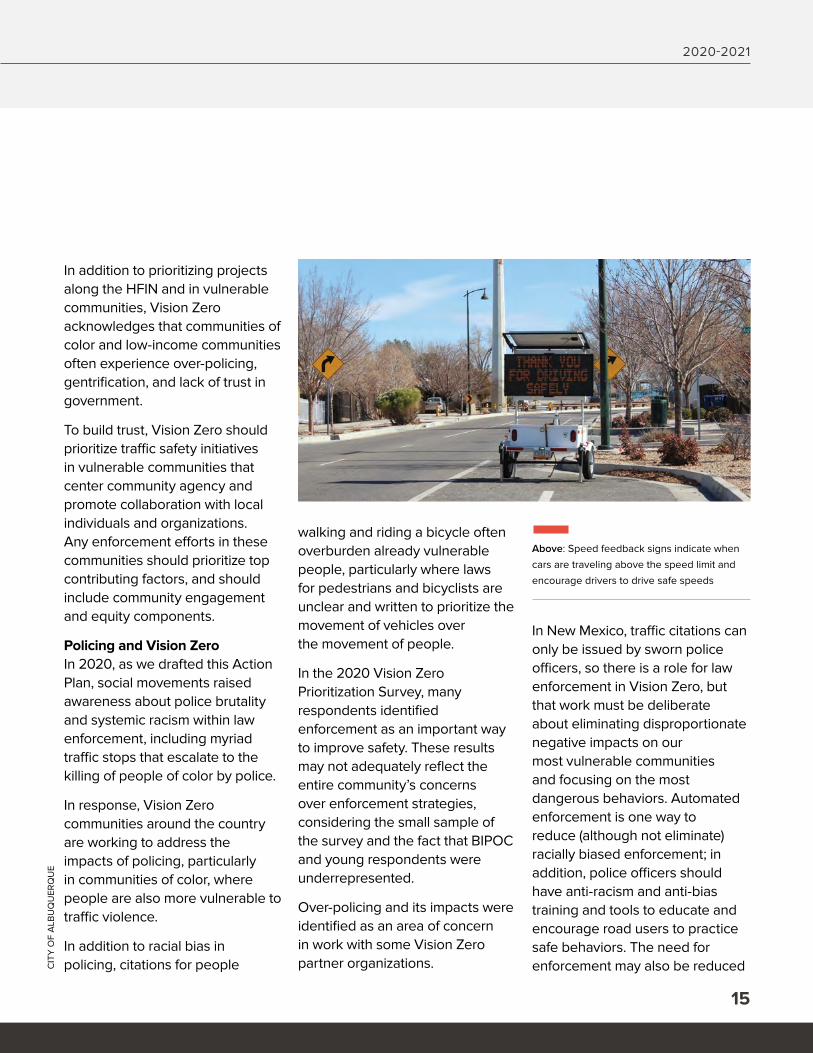
Above: Speed feedback signs indicate when
cars are traveling above the speed limit and
encourage drivers to drive safe speeds
VISION ZERO ACTION PLAN
16
as we build safer roads and create more of a culture of safety in our community.
Law enforcement officers also respond to, analyze, and report on traffic crashes. Most of the crash data that we use to understand and prevent traffic crashes comes from the Uniform Crash Reporting form, which is used by law enforcement statewide.
The information gathered through this form is often limited, inconsistent, and incomplete depending on the responding
officer and the information available at the scene of the crash, particularly in the case of pedestrian- and bicyclist-involved crashes.
As a partner in implementing Vision Zero, it is important that the Albuquerque Police Department (APD) work to ensure that traffic enforcement is unbiased and that crash response contributes to a better understanding of traffic violence which will require identifying and advocating for improvements to the Uniform Crash Report itself.
Designing Streets for People and SafetyThe way that roads are designed and built impacts how people use them and what they can do safely. Many of our streets are designed to move people in cars quickly through our city, prioritizing those road users over others, particularly more vulnerable road users.
The speed of traffic, in particular, makes streets less safe for all road users. At high speeds, drivers see much less of what is happening around them, including people walking and riding bicycles and
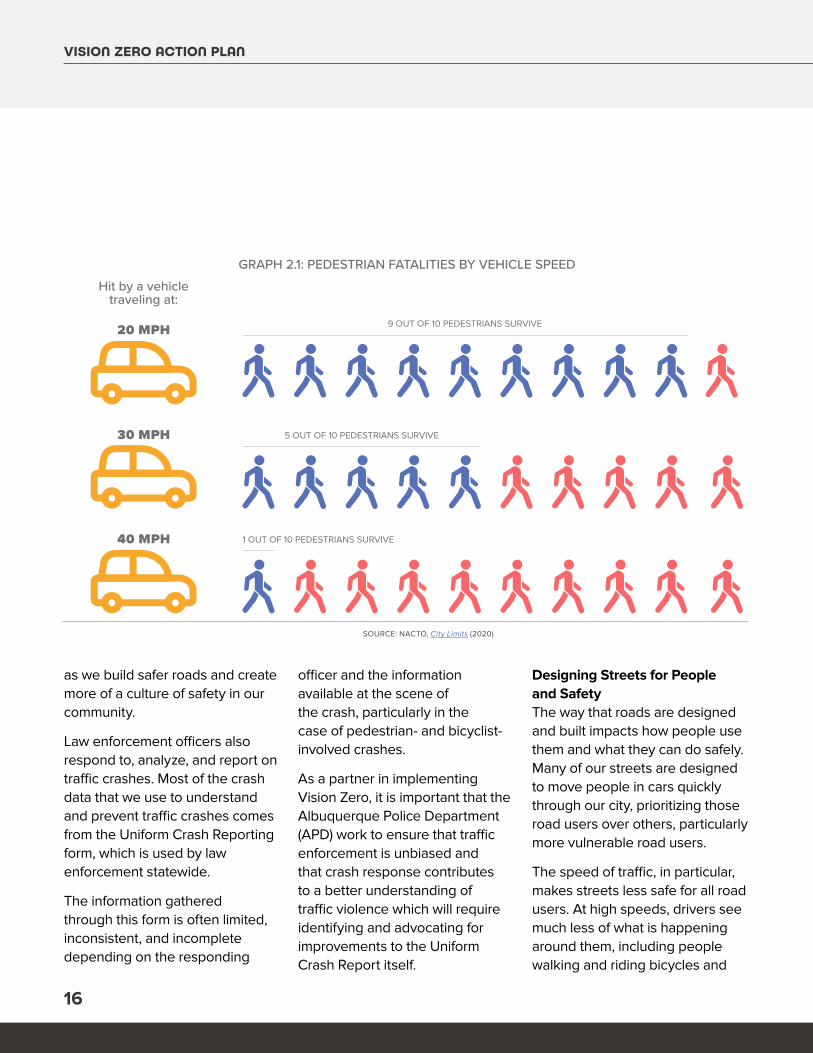
GRAPH 2.1: PEDESTRIAN FATALITIES BY VEHICLE SPEEDHit by a vehicle
traveling at:
9 OUT OF 10 PEDESTRIANS SURVIVE
5 OUT OF 10 PEDESTRIANS SURVIVE
1 OUT OF 10 PEDESTRIANS SURVIVE
20 MPH
30 MPH
40 MPH
SOURCE: NACTO, City Limits (2020)
2020-2021
17
other vehicles, which can lead to a crash.
Higher speed crashes are also more dangerous for all involved because of the increased force of the crash. Pedestrians in particular are at much higher risk when hit by a vehicle moving at higher speed.
Wide streets with many wide lanes invite people to drive fast, making it more difficult for them to see and respond to other road users. Multiple lanes also reduce a driver’s ability to see other road users, especially if they are walking or riding a bicycle, and makes it more difficult for people
to be able to tell if they can cross the street safely and be seen.
When there are few crossings, people in cars are encouraged to drive quickly through without looking for other road users, and people walking, riding a bicycle, or using mobility devices are unable to travel safely from one side of the street to the other; those users may need to travel long distances to access a safe crossing.
On the other hand, there are many Complete Streets design techniques that can be implemented to calm traffic and make streets safer.
Narrow streets and lanes invite drivers to travel at slower speeds that allow them to see and respond to other road users.
Bulbouts or sidewalk extensions where people cross a street narrow the roadway and make the distance that a person walking needs to travel across the street.
In a similar way, medians and pedestrian refuges allow people crossing the street to safely stop halfway if there is oncoming traffic or if they can’t cross in the time allowed by a signal, while also providing a narrowing and calming effect. C
ITY
OF
ALB
UQ
UER
QU
E, F
REE
AB
Q IM
AG
ES
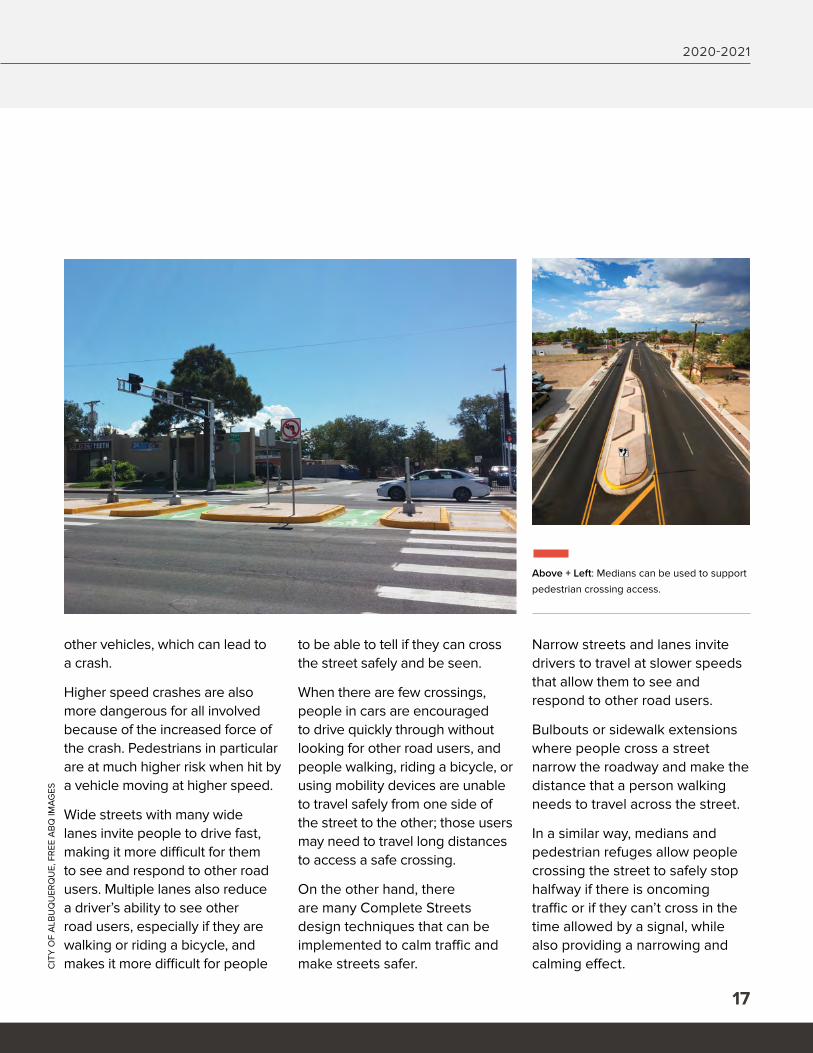
Above + Left: Medians can be used to support
pedestrian crossing access.
VISION ZERO ACTION PLAN
18
More frequent intersections and crossings, particularly those with pavement markings, signage, and signals, allow people to cross the street when they need to, while also indicating to drivers that they should drive slowly and watch for others, and stop when people need to cross the street.
How the space of a road is distributed among different road users also makes a difference in terms of safety. Wide sidewalks provide space for people to walk along a road. Bicycle lanes,
particularly if they have a painted buffer or physical barrier from vehicle traffic, allow people to ride bicycles safely. Crosswalks also provide a dedicated space for more vulnerable road users.
The City’s Development Process Manual (DPM) contains technical engineering standards for streets, including guidance about lane widths, speed limits, crosswalks and frequency of crossings, sidewalks, and bicycle infrastructure. The latest update, which became effective in 2020,
incorporates more current best practices that promote safety and active transportation and serves as an important tool for redesigning the transportation network around safety for all road users.
Land Use and TransportationIn addition to the design of roads, land use is closely tied to transportation options and safety. Some land uses, like schools, parks, community facilities, and commercial and activity centers, are more conducive to people walking and riding a C
ITY
OF
ALB
UQ
UER
QU
E, A
LAY
NA
BO
WM
AN
PH
OTO
GR
APH
Y
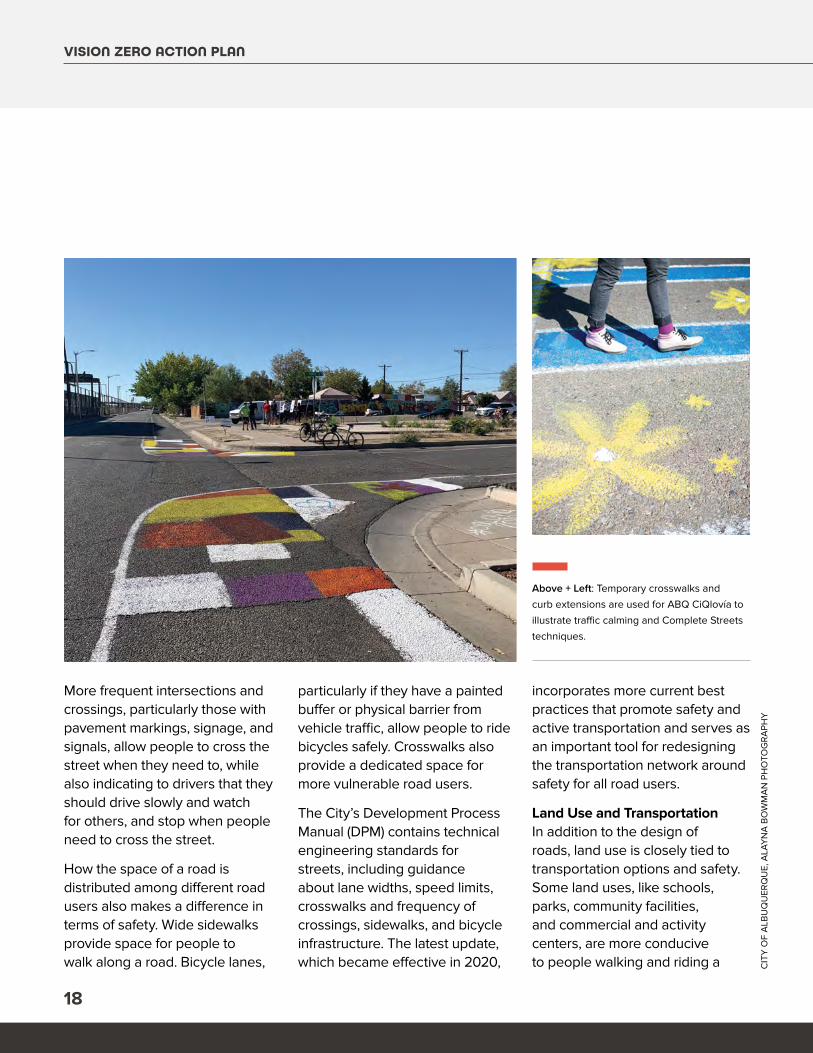
Above + Left: Temporary crosswalks and
curb extensions are used for ABQ CiQlovía to
illustrate traffic calming and Complete Streets
techniques.
2020-2021
19
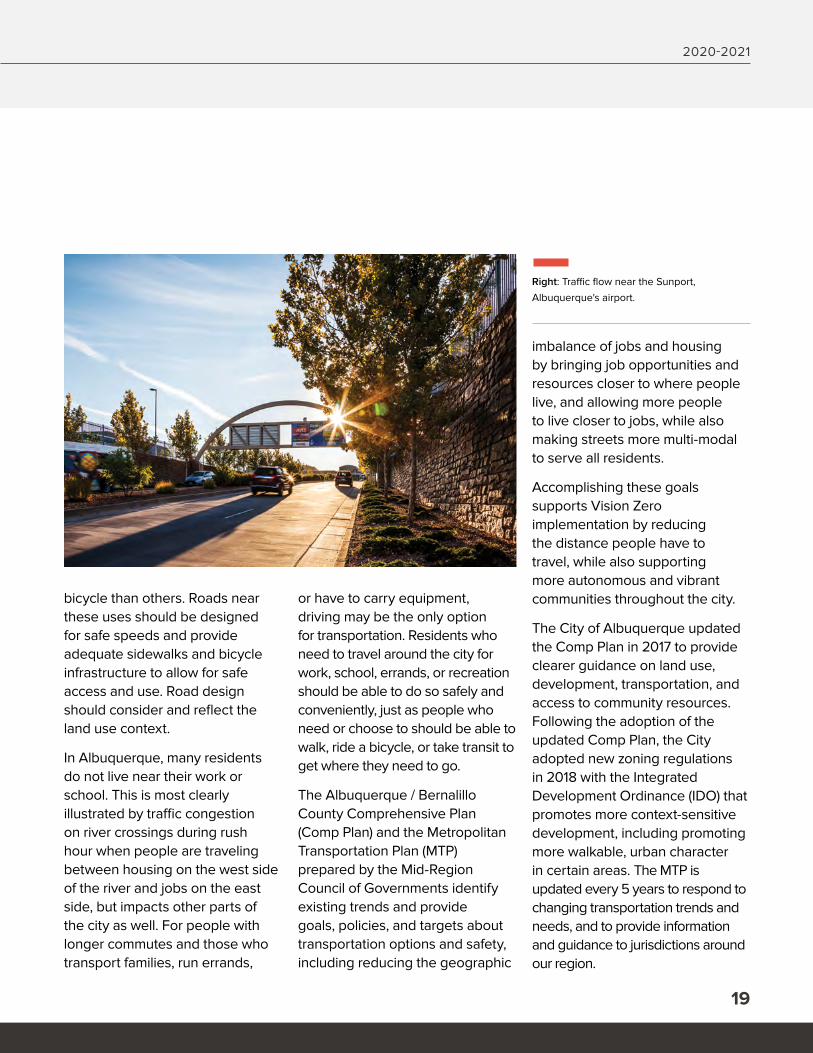
bicycle than others. Roads near these uses should be designed for safe speeds and provide adequate sidewalks and bicycle infrastructure to allow for safe access and use. Road design should consider and reflect the land use context.
In Albuquerque, many residents do not live near their work or school. This is most clearly illustrated by traffic congestion on river crossings during rush hour when people are traveling between housing on the west side of the river and jobs on the east side, but impacts other parts of the city as well. For people with longer commutes and those who transport families, run errands,
or have to carry equipment, driving may be the only option for transportation. Residents who need to travel around the city for work, school, errands, or recreation should be able to do so safely and conveniently, just as people who need or choose to should be able to walk, ride a bicycle, or take transit to get where they need to go.
The Albuquerque / Bernalillo County Comprehensive Plan (Comp Plan) and the Metropolitan Transportation Plan (MTP) prepared by the Mid-Region Council of Governments identify existing trends and provide goals, policies, and targets about transportation options and safety, including reducing the geographic
imbalance of jobs and housing by bringing job opportunities and resources closer to where people live, and allowing more people to live closer to jobs, while also making streets more multi-modal to serve all residents.
Accomplishing these goals supports Vision Zero implementation by reducing the distance people have to travel, while also supporting more autonomous and vibrant communities throughout the city.
The City of Albuquerque updated the Comp Plan in 2017 to provide clearer guidance on land use, development, transportation, and access to community resources. Following the adoption of the updated Comp Plan, the City adopted new zoning regulations in 2018 with the Integrated Development Ordinance (IDO) that promotes more context-sensitive development, including promoting more walkable, urban character in certain areas. The MTP is updated every 5 years to respond to changing transportation trends and needs, and to provide information and guidance to jurisdictions around our region.
Right: Traffic flow near the Sunport,
Albuquerque's airport.
VISION ZERO ACTION PLAN
20
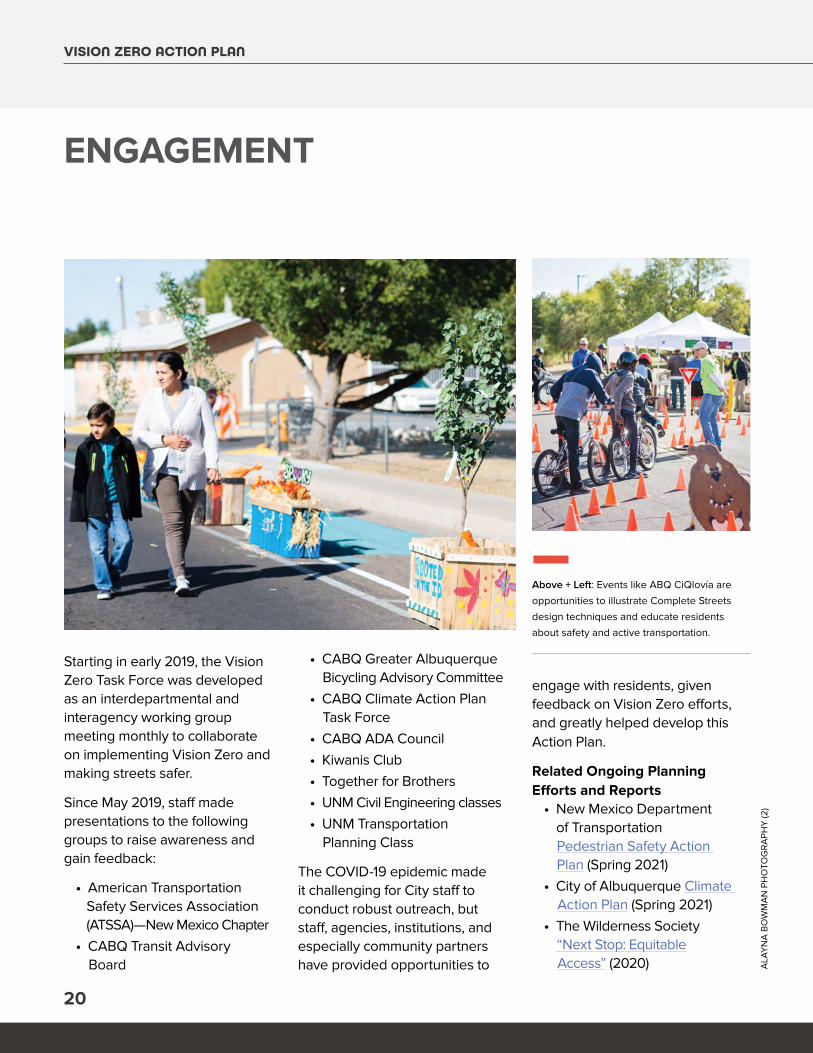
ENGAGEMENT
Starting in early 2019, the Vision Zero Task Force was developed as an interdepartmental and interagency working group meeting monthly to collaborate on implementing Vision Zero and making streets safer.
Since May 2019, staff made presentations to the following groups to raise awareness and gain feedback:
• American Transportation Safety Services Association (ATSSA)—New Mexico Chapter• CABQ Transit Advisory Board
• CABQ Greater Albuquerque Bicycling Advisory Committee• CABQ Climate Action Plan Task Force• CABQ ADA Council• Kiwanis Club• Together for Brothers• UNM Civil Engineering classes• UNM Transportation Planning Class
The COVID-19 epidemic made it challenging for City staff to conduct robust outreach, but staff, agencies, institutions, and especially community partners have provided opportunities to
engage with residents, given feedback on Vision Zero efforts, and greatly helped develop this Action Plan.
Related Ongoing Planning Efforts and Reports
• New Mexico Department of Transportation Pedestrian Safety Action Plan (Spring 2021)• City of Albuquerque Climate Action Plan (Spring 2021)• The Wilderness Society “Next Stop: Equitable Access” (2020) A
LAY
NA
BO
WM
AN
PH
OTO
GR
APH
Y (2
)
Above + Left: Events like ABQ CiQlovía are
opportunities to illustrate Complete Streets
design techniques and educate residents
about safety and active transportation.
2020-2021
21
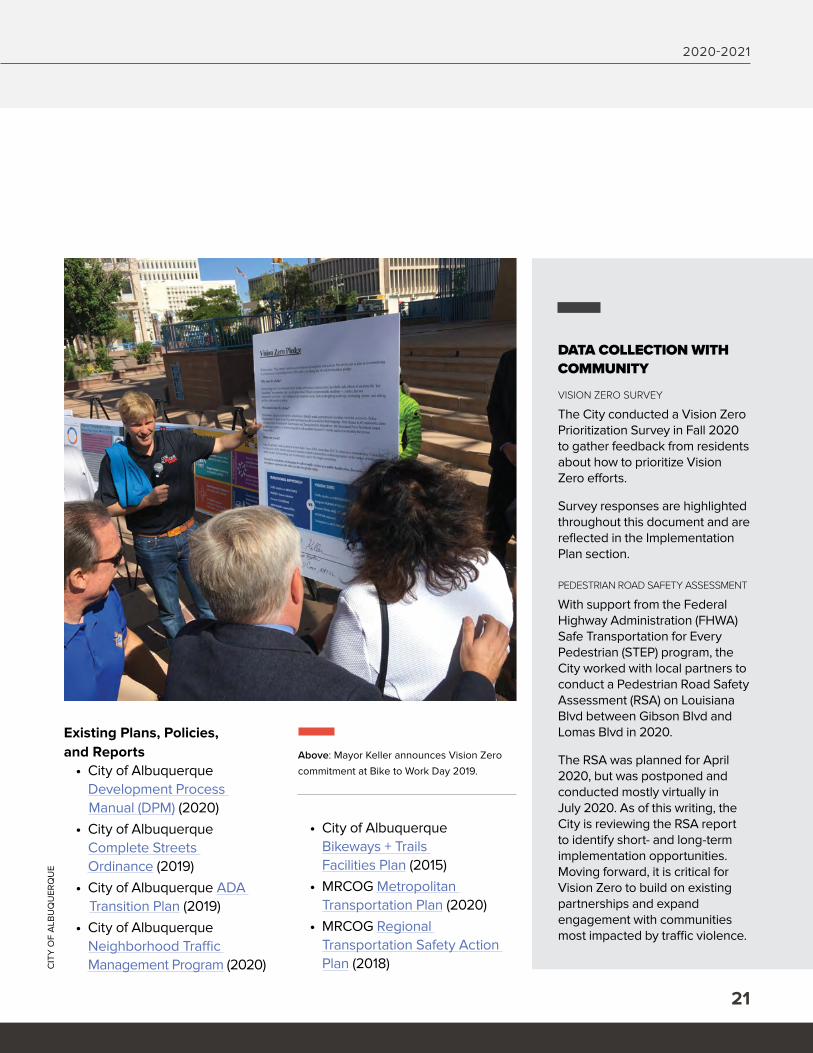
Existing Plans, Policies, and Reports
• City of Albuquerque Development Process Manual (DPM) (2020)• City of Albuquerque Complete Streets Ordinance (2019)• City of Albuquerque ADA Transition Plan (2019)• City of Albuquerque Neighborhood Traffic Management Program (2020)
DATA COLLECTION WITH COMMUNITY
VISION ZERO SURVEY
The City conducted a Vision Zero Prioritization Survey in Fall 2020 to gather feedback from residents about how to prioritize Vision Zero efforts.
Survey responses are highlighted throughout this document and are reflected in the Implementation Plan section.
PEDESTRIAN ROAD SAFETY ASSESSMENT
With support from the Federal Highway Administration (FHWA) Safe Transportation for Every Pedestrian (STEP) program, the City worked with local partners to conduct a Pedestrian Road Safety Assessment (RSA) on Louisiana Blvd between Gibson Blvd and Lomas Blvd in 2020.
The RSA was planned for April 2020, but was postponed and conducted mostly virtually in July 2020. As of this writing, the City is reviewing the RSA report to identify short- and long-term implementation opportunities. Moving forward, it is critical for Vision Zero to build on existing partnerships and expand engagement with communities most impacted by traffic violence.
• City of Albuquerque Bikeways + Trails Facilities Plan (2015)• MRCOG Metropolitan Transportation Plan (2020)• MRCOG Regional Transportation Safety Action Plan (2018)C
ITY
OF
ALB
UQ
UER
QU
E
Above: Mayor Keller announces Vision Zero
commitment at Bike to Work Day 2019.
VISION ZERO ACTION PLAN
22
DATA-INFORMED DECISIONS
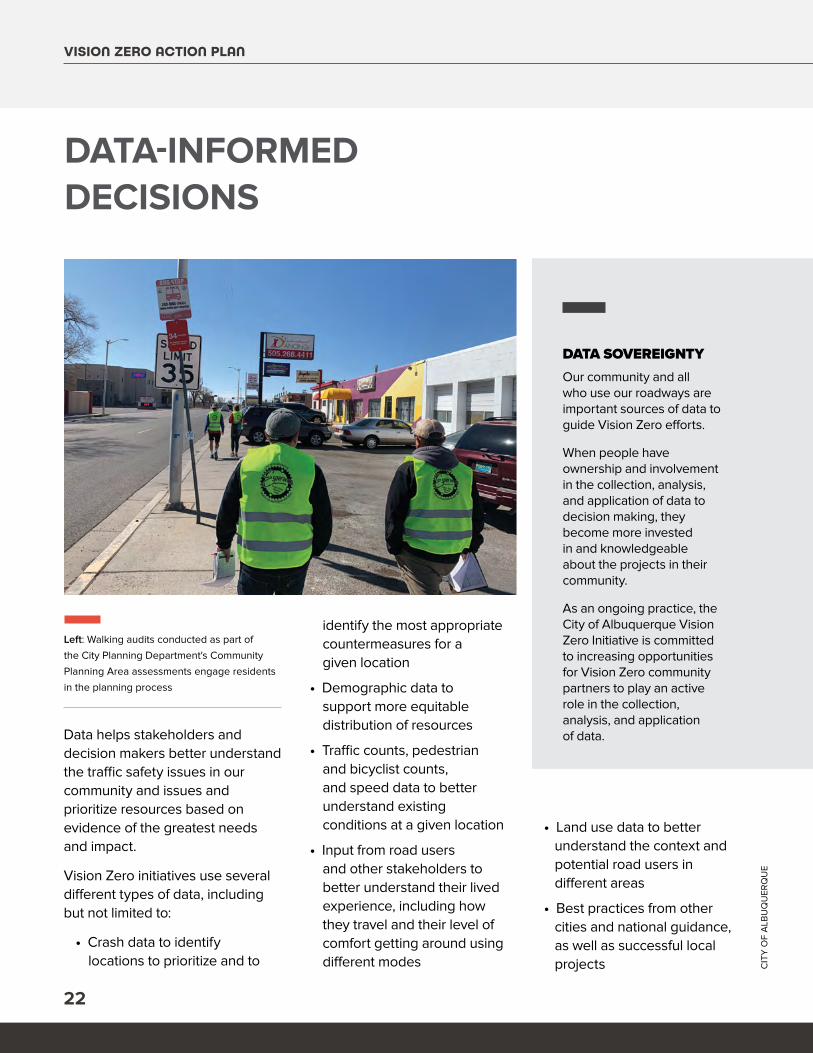
Data helps stakeholders and decision makers better understand the traffic safety issues in our community and issues and prioritize resources based on evidence of the greatest needs and impact.
Vision Zero initiatives use several different types of data, including but not limited to:
• Crash data to identify locations to prioritize and to
DATA SOVEREIGNTYOur community and all who use our roadways are important sources of data to guide Vision Zero efforts.
When people have ownership and involvement in the collection, analysis, and application of data to decision making, they become more invested in and knowledgeable about the projects in their community.
As an ongoing practice, the City of Albuquerque Vision Zero Initiative is committed to increasing opportunities for Vision Zero community partners to play an active role in the collection, analysis, and application of data.
identify the most appropriate countermeasures for a given location
• Demographic data to support more equitable distribution of resources
• Traffic counts, pedestrian and bicyclist counts, and speed data to better understand existing conditions at a given location
• Input from road users and other stakeholders to better understand their lived experience, including how they travel and their level of comfort getting around using different modes
• Land use data to better understand the context and potential road users in different areas
• Best practices from other cities and national guidance, as well as successful local projects C
ITY
OF
ALB
UQ
UER
QU
E
Left: Walking audits conducted as part of
the City Planning Department's Community
Planning Area assessments engage residents
in the planning process
2020-2021
23
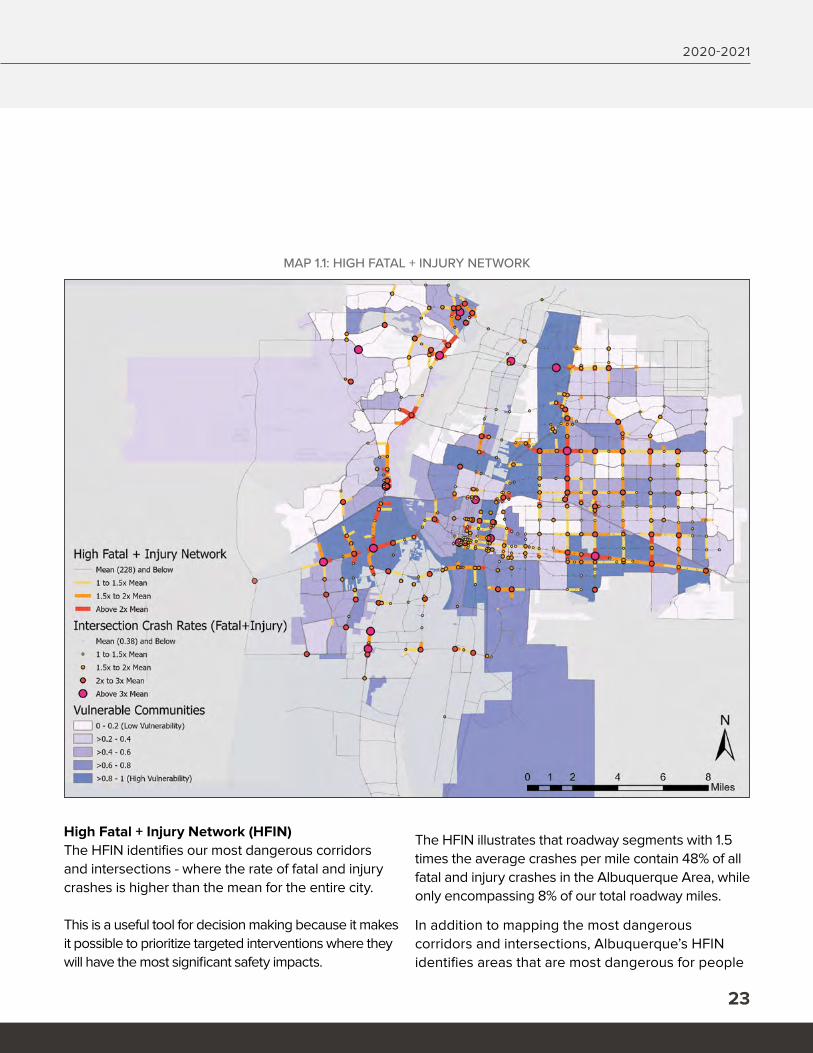
High Fatal + Injury Network (HFIN)The HFIN identifies our most dangerous corridors and intersections - where the rate of fatal and injury crashes is higher than the mean for the entire city. This is a useful tool for decision making because it makes it possible to prioritize targeted interventions where they will have the most significant safety impacts.
The HFIN illustrates that roadway segments with 1.5 times the average crashes per mile contain 48% of all fatal and injury crashes in the Albuquerque Area, while only encompassing 8% of our total roadway miles.
In addition to mapping the most dangerous corridors and intersections, Albuquerque’s HFIN identifies areas that are most dangerous for people
MAP 1.1: HIGH FATAL + INJURY NETWORK
VISION ZERO ACTION PLAN
24
walking and riding a bicycle. In order to better address equity, the HFIN can be combined with vulnerable community data, described in more detail below. The HFIN can also be used to identify locations where more detailed analysis is needed.
Vulnerable CommunitiesWorking with the City’s Office of Equity and Inclusion and the New Mexico Community Data Collaborative, we chose the following 8 indicators to identify and map vulnerable communities:3
• Per capita income• Population 65+• Population 17 and under• People with a disability
• Non-white population• Limited English proficiency• Multi-family (10+ units)• Households with no vehicle
Higher populations in these groups indicate a higher level of vulnerability to traffic violence and fewer transportation and mobility options. Combined with the HFIN, these indicators provide a way to prioritize Vision Zero efforts.
Causes of Death and Serious Injury: Top Contributing FactorsWhen a crash occurs, the responding law enforcement officers determine what factors contributed and assign a Top Contributing Factor (TCF) based on the behavior or decision
judged most significant in causing the crash. This assessment is limited by available information, but is useful in identifying potential countermeasures and engagement opportunities to prevent such crashes in the future.
Traffic enforcement, when used, should target specifically those behaviors most likely to result in death or injury and traffic engineers should target countermeasures to address deficiencies in infrastructure, design, pedestrian and bicycle facilities that contribute to the behaviors reflected in TCFs.
In Albuquerque, the most common and dangerous TCFs are:
• Alcohol/Drug involved: Crashes where one or more of the people involved in the crash are under the influence of alcohol or drugs make up a relatively small percentage of all crashes, but almost 60% of all fatal crashes. If there is alcohol or drug involvement in a crash, that is generally considered the TCF for the crash, but there are also generally one or multiple other factors contributing to the crash and crash severity.
• Failure to Yield: When a driver does not give
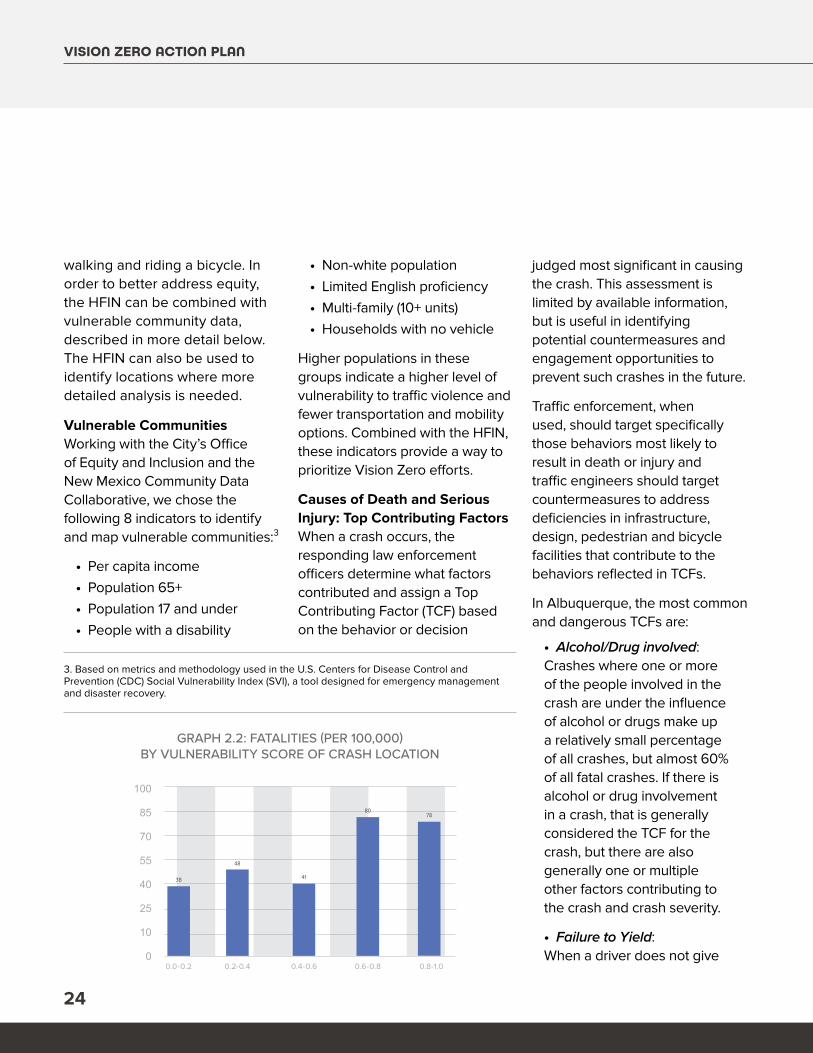
GRAPH 2.2: FATALITIES (PER 100,000) BY VULNERABILITY SCORE OF CRASH LOCATION
0.0-0.2 0.6-0.80.4-0.60.2-0.4 0.8-1.0
100
85
70
55
40
25
10
0
38 41
48
8078
3. Based on metrics and methodology used in the U.S. Centers for Disease Control and Prevention (CDC) Social Vulnerability Index (SVI), a tool designed for emergency management and disaster recovery.
2020-2021
25
the appropriate right-of-way to other road users, including not stopping for people in crosswalks or failing to yield to oncoming traffic when making a left turn.
This type of crash commonly results in injuries and is one of the most dangerous types of crashes because more than half of failure to yield crashes result in a fatality or injury.
• Driver Inattention: Distractions in a vehicle include cell phones, food, the radio, or other people. When a driver is paying attention to these distractions, they are less likely to see traffic signals, other people or vehicles, or hazards and are slower to react to their surroundings, which leads to more crashes.
• Excessive Speed: Vehicle speed increases both the likelihood of a crash and the severity of the crash. It is important to note that excessive speed is likely underreported as a TCF
because it is often considered a secondary factor that impacts the severity of a crash, but may not cause the crash itself. For example, if a driver runs a red light at high speed and hits another car, the TCF would be “disregarded traffic signal”, but the high speed crash is more likely to result in death or injury than a lower speed crash.
• Disregarded Traffic Signal/Passed Stop Sign: When a driver runs a stop sign or red light and hits another vehicle or a person walking or riding a bicycle, that crash is likely to result in injury or fatality. This category includes many crashes where one driver is trying to “beat the light,” meaning they have
sped up, which results in more severe crashes. This type of behavior may also be tied to distractions or otherwise disregarding other road conditions, which can make crashes more likely.
• Pedestrian Error: Pedestrian error is often listed as the TCF when a driver hits a pedestrian outside of a marked crosswalk or when they are crossing against a pedestrian signal. In many of these cases, the driver’s behavior, including speed, impacts their ability to react to the presence of a pedestrian, which is often not adequately considered in determining TCF. “Pedestrian error” crashes may indicate that there are inadequate pedestrian facilities in the area
CIT
Y O
F A
LBU
QU
ERQ
UE
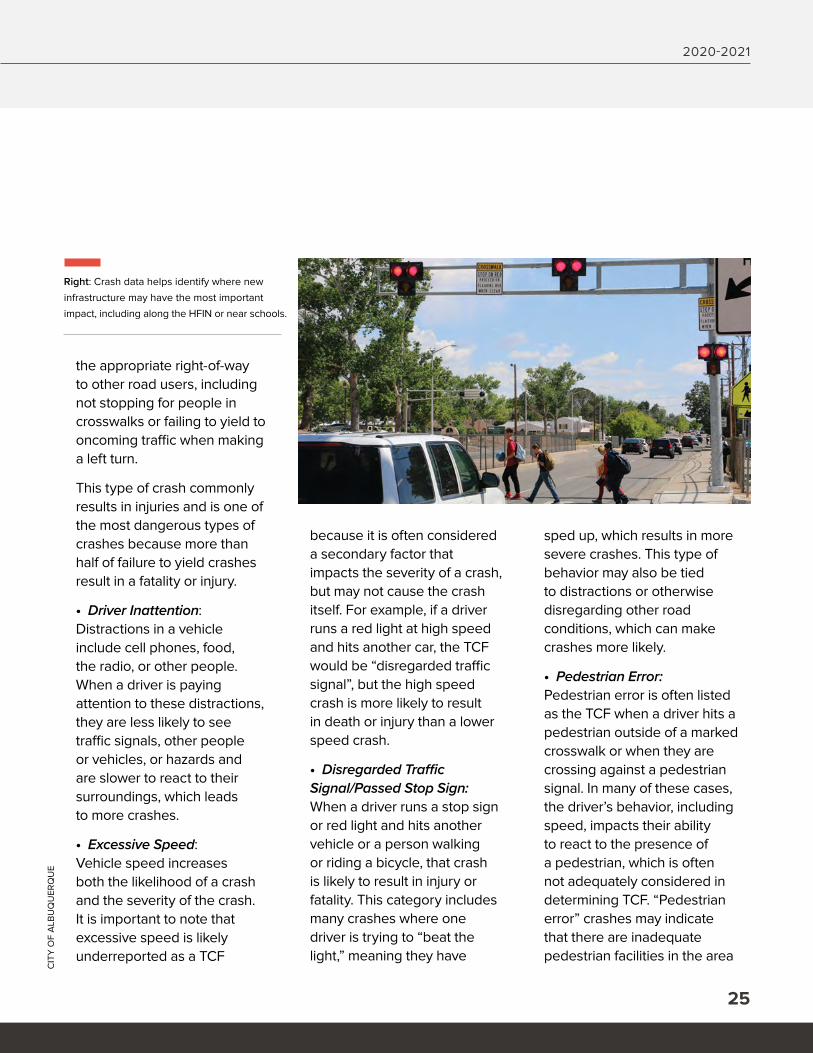
Right: Crash data helps identify where new
infrastructure may have the most important
impact, including along the HFIN or near schools.
VISION ZERO ACTION PLAN
26
where the crash occurred.
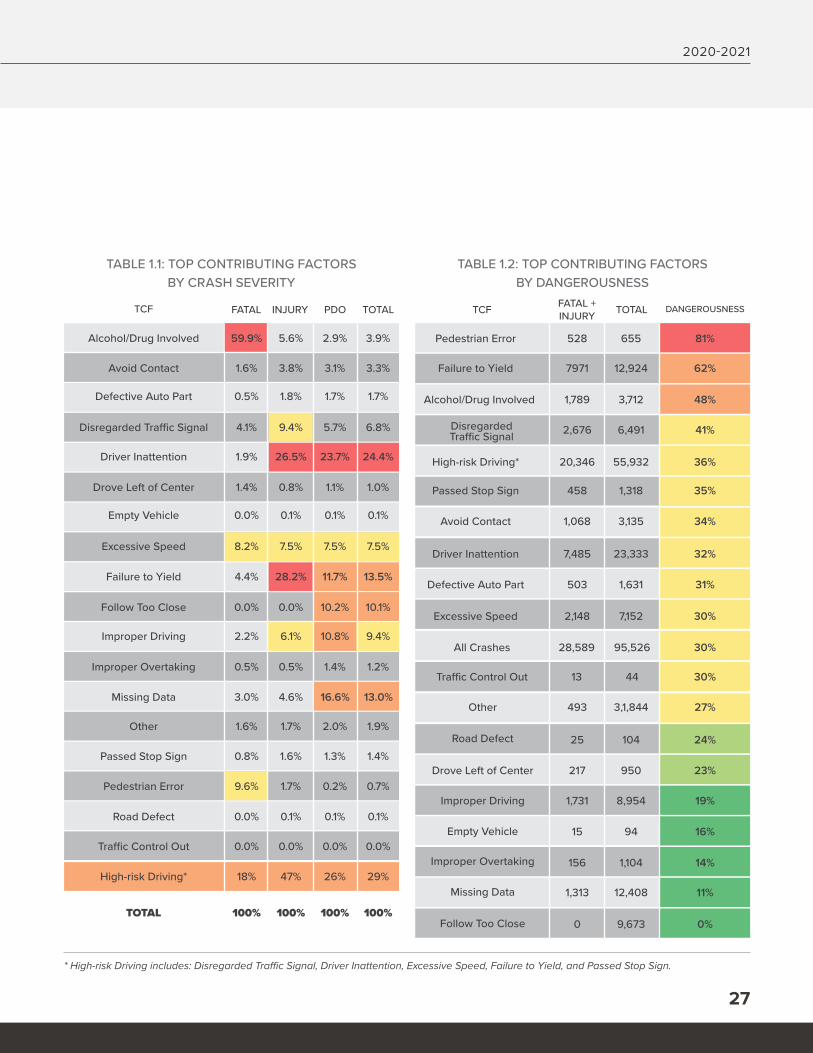
Table 1.1 shows all TCFs by the severity of crashes - what percent of fatal, injury, and property-damage only (PDO) crashes are associated with each TCF.Failure to yield, driver inattention, excessive speed, disregarded traffic signal, and passed stop sign are considered “high-risk driving” for the purposes of this Vision Zero Action Plan.
These five behaviors are likely to result in fatal or injury crashes and may be controlled using proven safety countermeasures through road design and engineering. Vision Zero education and awareness efforts, as well as traffic enforcement, should focus on these behaviors to have the most impact on traffic safety.
The “dangerousness” of a TCF is
determined by the percentage of crashes involving that TCF that result in a fatal or injury crash (see Table 1.2). While it is very dangerous, driving under the influence of alcohol or drugs is not included in this category of high-risk driving. Many of the countermeasures that would reduce high-risk driving behaviors may help reduce the severity of alcohol/drug involved crashes, which often involve one or more of the five high risk behaviors. The City will continue to conduct targeted DWI enforcement and awareness campaigns, in partnership with NMDOT.
Pedestrian error is also not included in the five high-risk driving behaviors. While this is a common TCF in fatal and injury crashes, it is inconsistently used in crash reporting and often
reflects inequitable expectations of people walking and people driving. The City will continue to evaluate these types of crashes to better understand how and when this TCF is applied and how and when to implement pedestrian safety countermeasures to reduce pedestrian-involved crashes.
Crash AnalysisAPD, DMD, and MRCOG staff meet monthly to review fatal crash reports to identify trends in crashes, as well as to better understand how reporting works and how it might be improved. This analysis helps staff better understand the kinds of crashes happening in our community, as well as countermeasures that we can implement to address different types of crashes. While these reviews are crash-specific, continued review helps to identify trends and systematic approaches that can be implemented in similar locations.
For example, if there are multiple fatal crashes at similar intersections, staff may identify a new standard for intersection design based on similar circumstances of those different crashes.
These monthly reviews will continue throughout the course of Vision Zero efforts in Albuquerque. C
ITY
OF
ALB
UQ
UER
QU
E
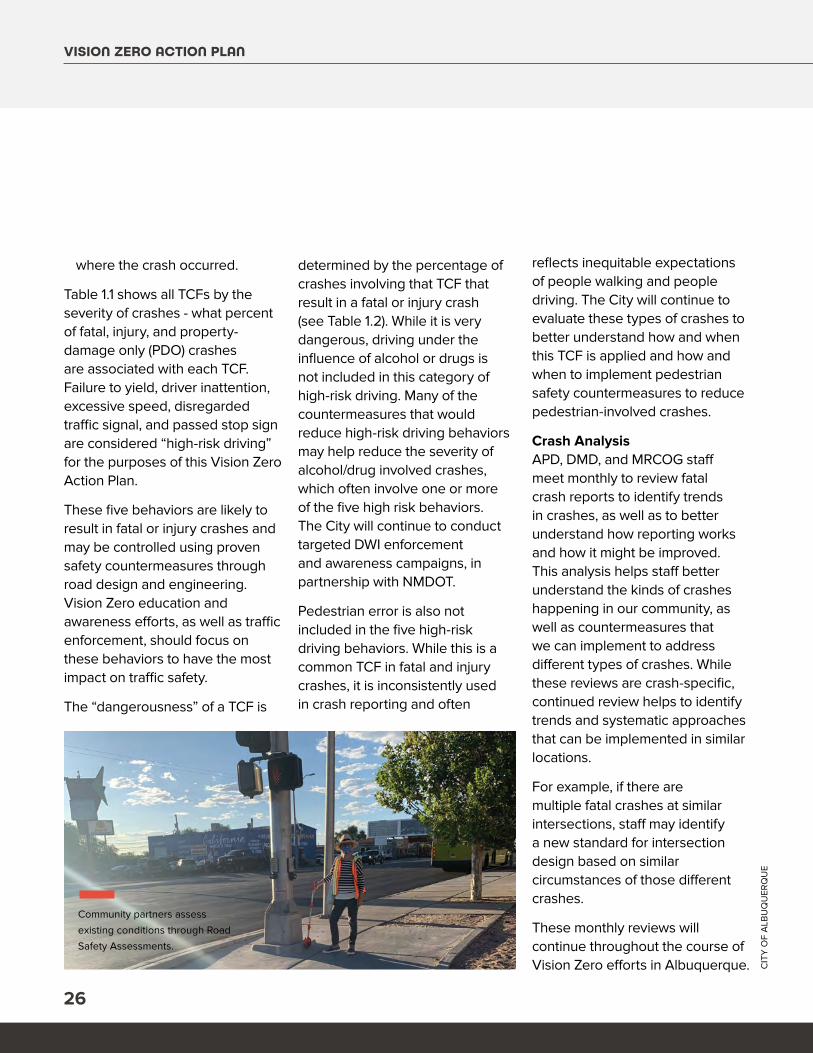
Community partners assess
existing conditions through Road
Safety Assessments.
2020-2021
27
TABLE 1.1: TOP CONTRIBUTING FACTORS BY CRASH SEVERITY
TABLE 1.2: TOP CONTRIBUTING FACTORS BY DANGEROUSNESS
Alcohol/Drug Involved
Avoid Contact
Defective Auto Part
Disregarded Traffic Signal
Driver Inattention
Drove Left of Center
Failure to Yield
Excessive Speed
Improper Driving
Missing Data
Passed Stop Sign
Road Defect
Empty Vehicle
Follow Too Close
Improper Overtaking
Other
Traffic Control Out
* High-risk Driving includes: Disregarded Traffic Signal, Driver Inattention, Excessive Speed, Failure to Yield, and Passed Stop Sign.
High-risk Driving*
528
7971
2,676
458
7,485
28,589
1,789
20,346
1,068
2,148
503
13
1.6%
0.5%
4.1%
1.9%
1.4%
4.4%
8.2%
2.2%
3.0%
0.8%
0.0%
0.0%
0.0%
0.5%
1.6%
9.6%
0.0%
18%
2.9% 81%
62%
41%
35%
32%
30%
48%
36%
34%
30%
31%
30%
3.1%
1.7%
5.7%
1.1%
7.5%
10.8%
1.3%
0.1%
0.1%
10.2%
1.4%
2.0%
0.2%
0.0%
26%
5.6% 655
12,924
6,491
1,318
23,333
95,526
3,712
55,932
3,135
7,152
1,631
44
3.8%
1.8%
9.4%
0.8%
7.5%
6.1%
4.6%
1.6%
0.1%
0.1%
0.0%
0.5%
1.7%
1.7%
0.0%
47%
3.9%
3.3%
1.7%
6.8%
1.0%
7.5%
9.4%
1.4%
0.1%
0.1%
10.1%
1.2%
1.9%
0.7%
0.0%
29%
TCF FATAL FATAL + INJURYPDO DANGEROUSNESSINJURY TOTALTOTAL TCF
Pedestrian Error
Pedestrian Error
Failure to Yield
Disregarded Traffic Signal
Passed Stop Sign
Driver Inattention
All Crashes
Alcohol/Drug Involved
High-risk Driving*
Avoid Contact
Excessive Speed
Defective Auto Part
Traffic Control Out
25
493
1,731
15
156
1,313
0
217
24%
27%
19%
16%
14%
11%
0%
23%
104
3,1,844
8,954
94
1,104
12,408
9,673
950
Road Defect
Improper Overtaking
Other
Empty Vehicle
Improper Driving
Follow Too Close
Drove Left of Center
Missing Data
59.9%
26.5% 23.7% 24.4%
28.2% 11.7% 13.5%
13.0%16.6%
TOTAL 100% 100%100% 100%
VISION ZERO ACTION PLAN
28
IMPLEMENTATION PLAN
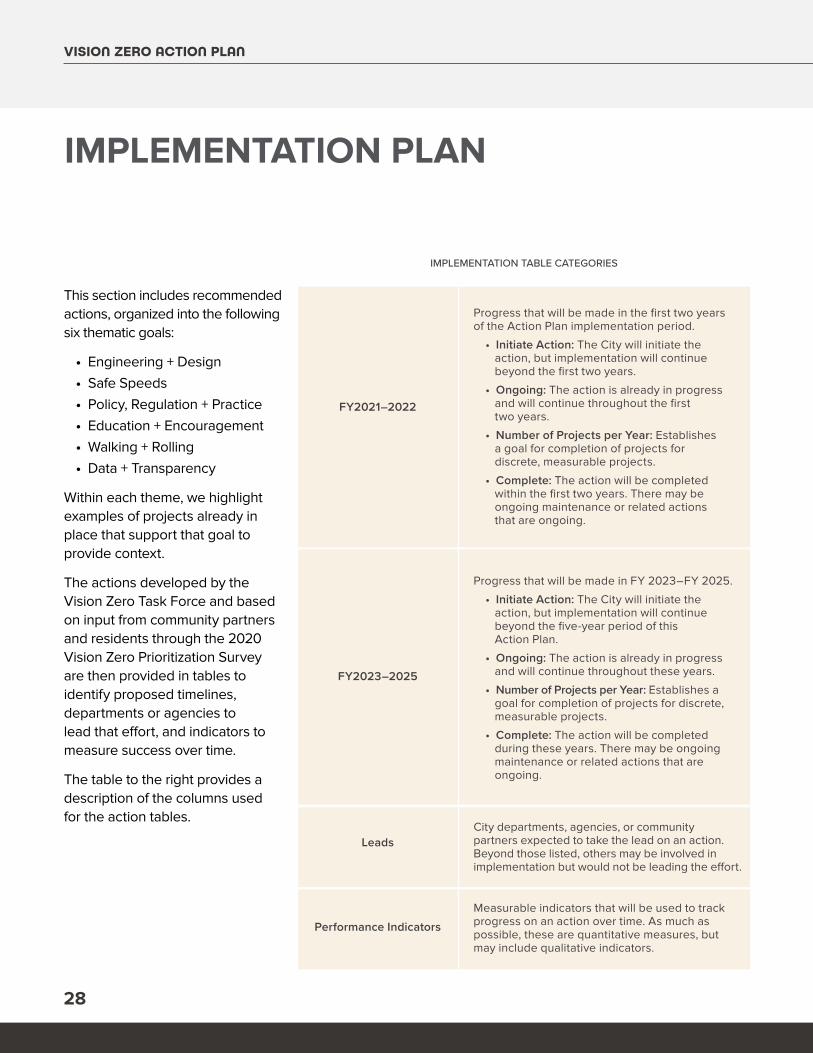
This section includes recommended actions, organized into the following six thematic goals:
• Engineering + Design• Safe Speeds• Policy, Regulation + Practice• Education + Encouragement• Walking + Rolling• Data + Transparency
Within each theme, we highlight examples of projects already in place that support that goal to provide context.
The actions developed by the Vision Zero Task Force and based on input from community partners and residents through the 2020 Vision Zero Prioritization Survey are then provided in tables to identify proposed timelines, departments or agencies to lead that effort, and indicators to measure success over time.
The table to the right provides a description of the columns used for the action tables.
FY2021–2022
FY2023–2025
Progress that will be made in the first two years of the Action Plan implementation period.
• Initiate Action: The City will initiate the action, but implementation will continue beyond the first two years.
• Ongoing: The action is already in progress and will continue throughout the first two years.
• Number of Projects per Year: Establishes a goal for completion of projects for discrete, measurable projects.
• Complete: The action will be completed within the first two years. There may be ongoing maintenance or related actions that are ongoing.
Progress that will be made in FY 2023–FY 2025.
• Initiate Action: The City will initiate the action, but implementation will continue beyond the five-year period of this Action Plan.
• Ongoing: The action is already in progress and will continue throughout these years.
• Number of Projects per Year: Establishes a goal for completion of projects for discrete, measurable projects.
• Complete: The action will be completed during these years. There may be ongoing maintenance or related actions that are ongoing.
City departments, agencies, or community partners expected to take the lead on an action. Beyond those listed, others may be involved in implementation but would not be leading the effort.
Measurable indicators that will be used to track progress on an action over time. As much as possible, these are quantitative measures, but may include qualitative indicators.
Leads
Performance Indicators
IMPLEMENTATION TABLE CATEGORIES
2020-2021
29
Public school district in Albuquerque.APS
Multi-county (Bernalillo, Valencia, Torrance, and Sandoval) governmental agency that helps our region plan responsibly for the future, in light of anticipated growth in New Mexico’s mid-region.
MRCOG
Statewide department that manages roadway and other transportation infrastructure.NMDOT
City department that manages transit and paratransit service. Transit
Traffic safety campaign managed by the New Mexico Department of Transportation and the Center for Injury Prevention Research and Education at the University of New Mexico.
LFM
City department that manages and enforces development and building requirements.Planning
City department that manages parks, open space areas, trails, and other recreation facilities.
Working group of City and agency staff, as well as community partners, who support Vision Zero projects and initiatives in Albuquerque.
City department that manages roads and other physical infrastructure.
City police department.
P+R
VZTF
DMD
APD
Division within the City Arts + Culture Department that is responsible for public art projects.
Public university located in Albuquerque.
The County that contains the City of Albuquerque.
Provider of transit service that serves Bernalillo, Valencia and Sandoval counties, as well as that runs the NM Rail Runner Express.
Local organizations and individuals that support Vision Zero and partner with the City of Albuquerque on traffic safety initiatives.
Legislative body of the City of Albuquerque, with the power to adopt ordinances, resp;unions, or other legislation.
Public Art
UNM
BC
Rio Metro
Comm. Partners
Council
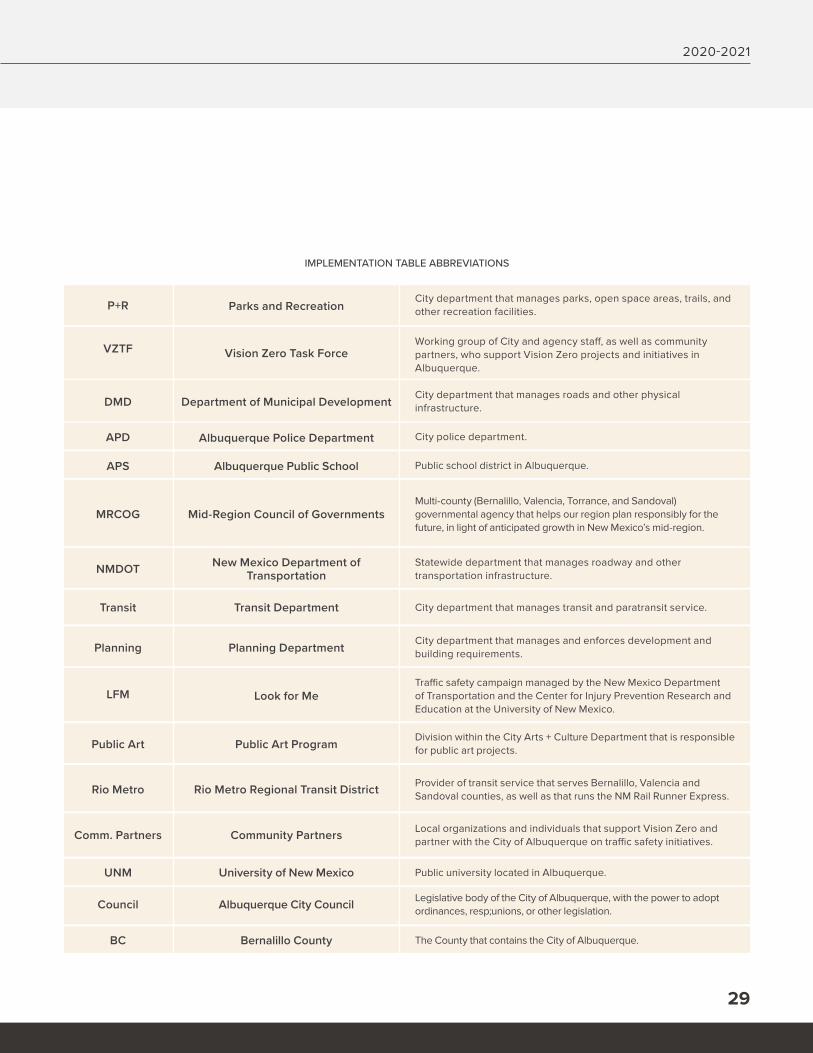
IMPLEMENTATION TABLE ABBREVIATIONS
Parks and Recreation
Albuquerque Public School
Planning Department
Community Partners
Department of Municipal Development
New Mexico Department of Transportation
Public Art Program
Albuquerque City Council
Vision Zero Task Force
Mid-Region Council of Governments
Look for Me
University of New Mexico
Albuquerque Police Department
Transit Department
Rio Metro Regional Transit District
Bernalillo County
VISION ZERO ACTION PLAN
30
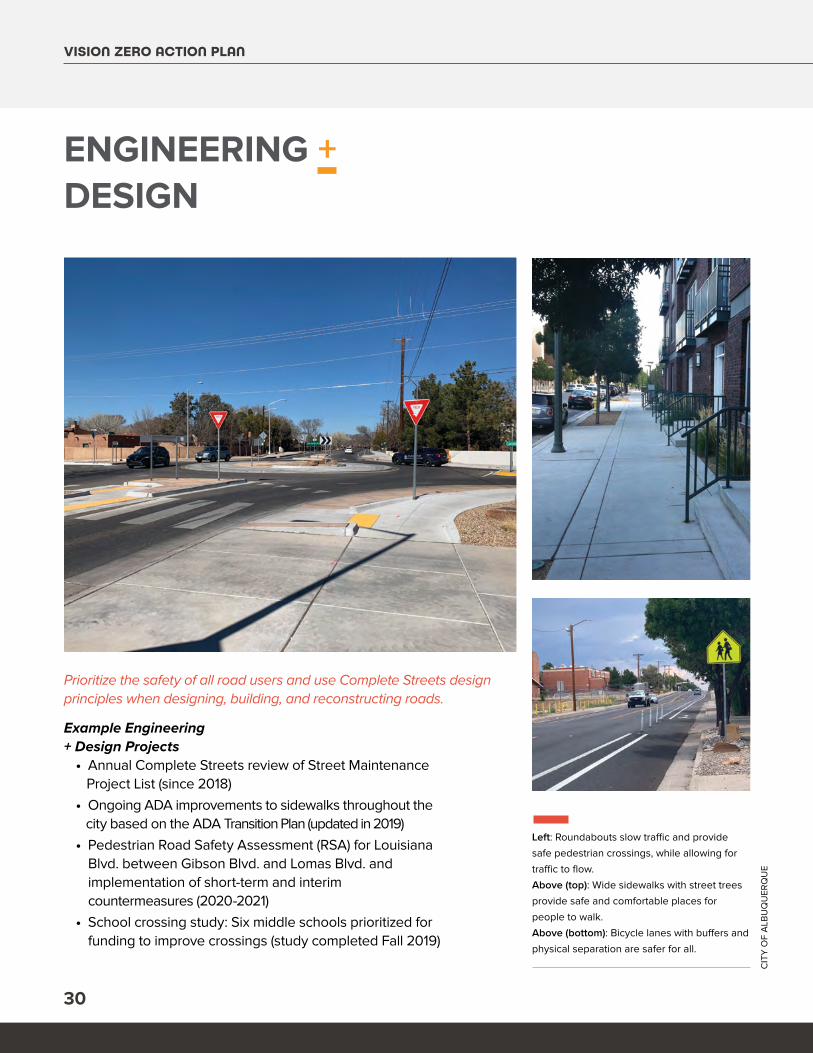
ENGINEERING + DESIGN
Prioritize the safety of all road users and use Complete Streets design principles when designing, building, and reconstructing roads.
Example Engineering + Design Projects
• Annual Complete Streets review of Street Maintenance Project List (since 2018)• Ongoing ADA improvements to sidewalks throughout the city based on the ADA Transition Plan (updated in 2019)• Pedestrian Road Safety Assessment (RSA) for Louisiana Blvd. between Gibson Blvd. and Lomas Blvd. and implementation of short-term and interim countermeasures (2020-2021)• School crossing study: Six middle schools prioritized for funding to improve crossings (study completed Fall 2019)
CIT
Y O
F A
LBU
QU
ERQ
UE
Left: Roundabouts slow traffic and provide
safe pedestrian crossings, while allowing for
traffic to flow.
Above (top): Wide sidewalks with street trees
provide safe and comfortable places for
people to walk.
Above (bottom): Bicycle lanes with buffers and
physical separation are safer for all.
2020-2021
31
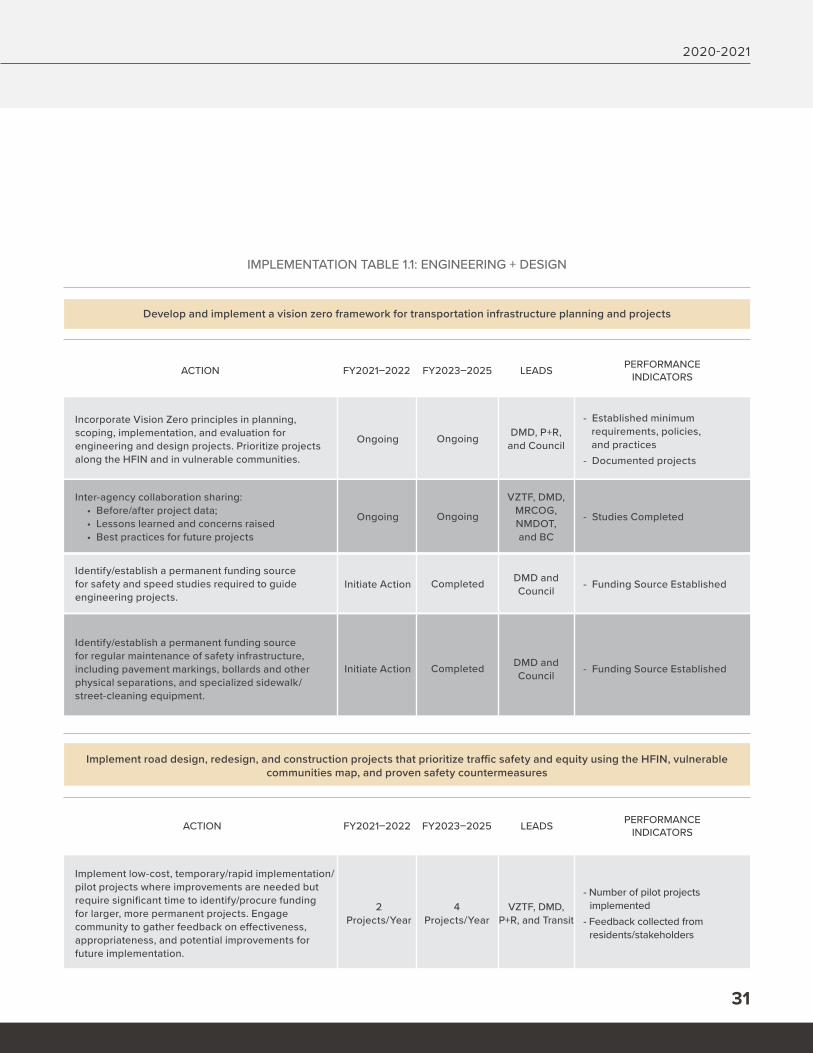
IMPLEMENTATION TABLE 1.1: ENGINEERING + DESIGN
Incorporate Vision Zero principles in planning, scoping, implementation, and evaluation for engineering and design projects. Prioritize projects along the HFIN and in vulnerable communities.
Inter-agency collaboration sharing:• Before/after project data;• Lessons learned and concerns raised• Best practices for future projects
Identify/establish a permanent funding source for safety and speed studies required to guide engineering projects.
Implement low-cost, temporary/rapid implementation/pilot projects where improvements are needed but require significant time to identify/procure funding for larger, more permanent projects. Engage community to gather feedback on effectiveness, appropriateness, and potential improvements for future implementation.
Ongoing
Ongoing
Initiate Action
2 Projects/Year
Ongoing
Ongoing
Completed
4 Projects/Year
DMD, P+R, and Council
VZTF, DMD,MRCOG, NMDOT, and BC
DMD and Council
VZTF, DMD, P+R, and Transit
- Established minimum requirements, policies, and practices- Documented projects
- Studies Completed
- Funding Source Established
Identify/establish a permanent funding source for regular maintenance of safety infrastructure, including pavement markings, bollards and other physical separations, and specialized sidewalk/street-cleaning equipment.
Initiate Action Completed DMD and Council - Funding Source Established
- Number of pilot projects implemented- Feedback collected from residents/stakeholders
ACTION
Develop and implement a vision zero framework for transportation infrastructure planning and projects
Implement road design, redesign, and construction projects that prioritize traffic safety and equity using the HFIN, vulnerable communities map, and proven safety countermeasures
FY2021–2022 FY2023–2025 LEADS PERFORMANCE INDICATORS
ACTION FY2021–2022 FY2023–2025 LEADS PERFORMANCE INDICATORS
VISION ZERO ACTION PLAN
32
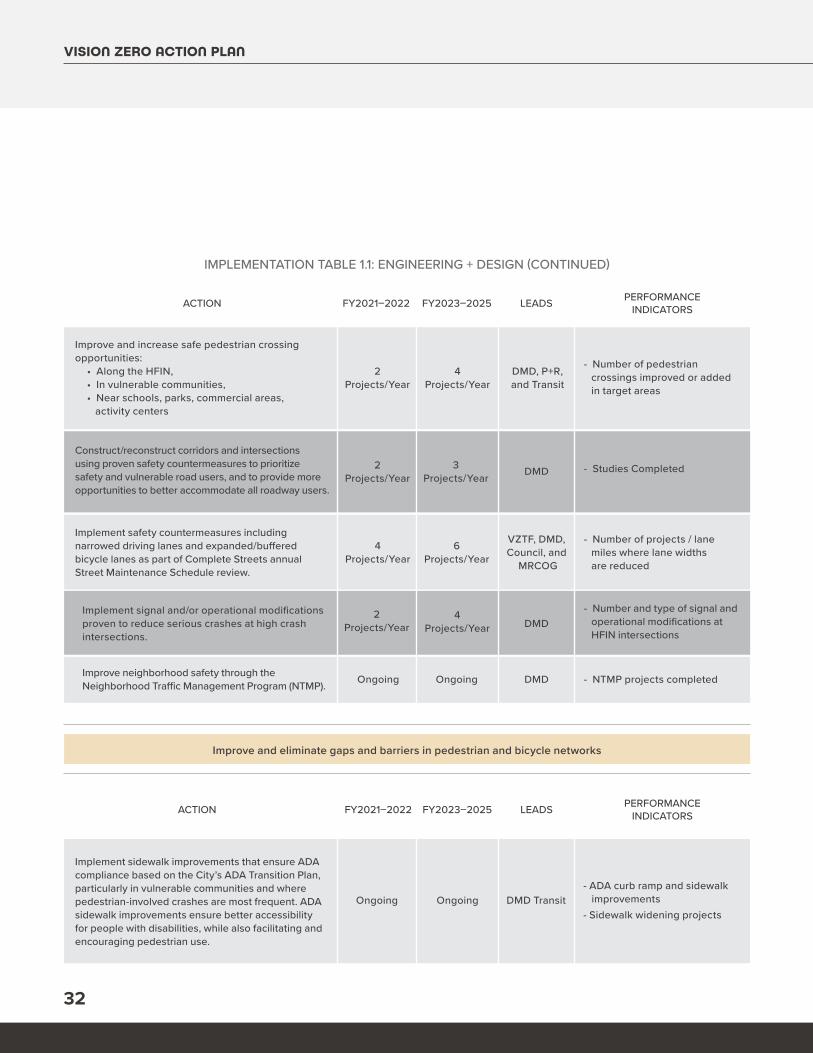
IMPLEMENTATION TABLE 1.1: ENGINEERING + DESIGN (CONTINUED)
Improve and increase safe pedestrian crossing opportunities:
• Along the HFIN,• In vulnerable communities,• Near schools, parks, commercial areas, activity centers
Construct/reconstruct corridors and intersections using proven safety countermeasures to prioritize safety and vulnerable road users, and to provide more opportunities to better accommodate all roadway users.
Implement safety countermeasures including narrowed driving lanes and expanded/buffered bicycle lanes as part of Complete Streets annual Street Maintenance Schedule review.
Implement signal and/or operational modifications proven to reduce serious crashes at high crash intersections.
2 Projects/Year
2 Projects/Year
4 Projects/Year
2 Projects/Year
Ongoing
Ongoing
4 Projects/Year
3 Projects/Year
6 Projects/Year
4 Projects/Year
Ongoing
Ongoing
DMD, P+R, and Transit
DMD
VZTF, DMD, Council, and
MRCOG
DMD
DMD
- Number of pedestrian crossings improved or added in target areas
- Studies Completed
- Number of projects / lane miles where lane widths are reduced
- Number and type of signal and operational modifications at HFIN intersections
- NTMP projects completed
ACTION FY2021–2022 FY2023–2025 LEADS PERFORMANCE INDICATORS
Improve neighborhood safety through the Neighborhood Traffic Management Program (NTMP).
Implement sidewalk improvements that ensure ADA compliance based on the City’s ADA Transition Plan, particularly in vulnerable communities and where pedestrian-involved crashes are most frequent. ADA sidewalk improvements ensure better accessibility for people with disabilities, while also facilitating and encouraging pedestrian use.
DMD Transit- ADA curb ramp and sidewalk improvements- Sidewalk widening projects
ACTION FY2021–2022 FY2023–2025 LEADS PERFORMANCE INDICATORS
Improve and eliminate gaps and barriers in pedestrian and bicycle networks
2020-2021
33
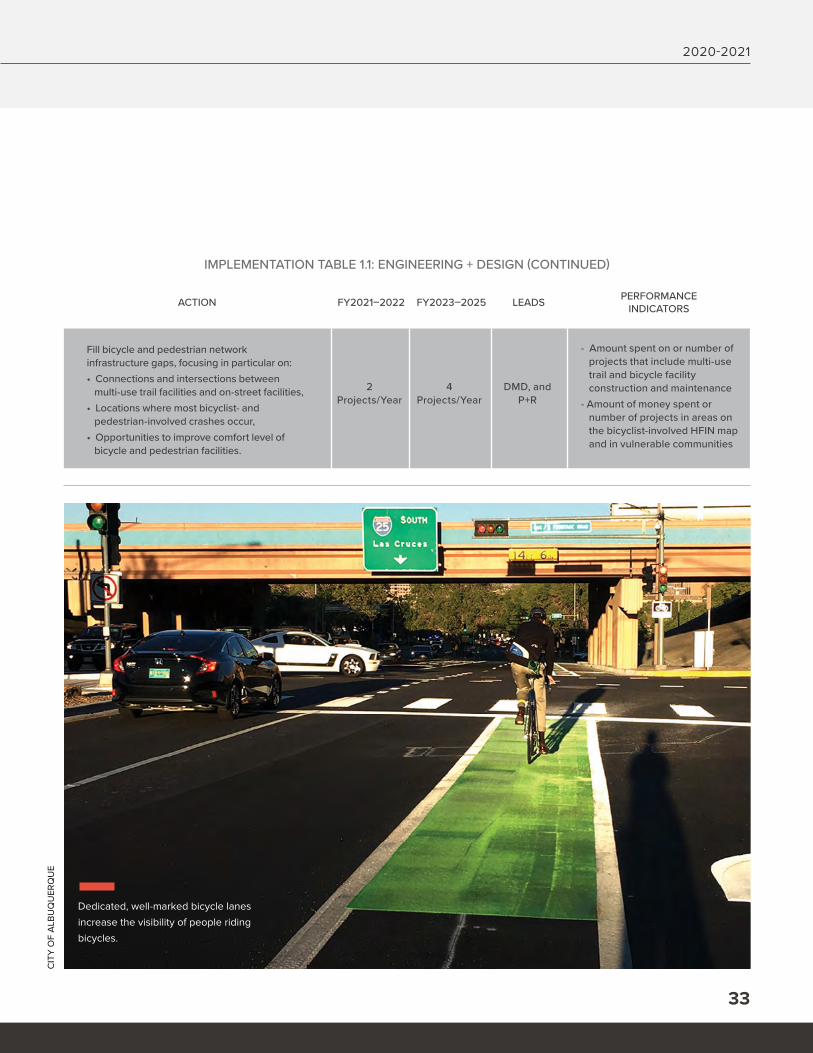
IMPLEMENTATION TABLE 1.1: ENGINEERING + DESIGN (CONTINUED)
Fill bicycle and pedestrian network infrastructure gaps, focusing in particular on:• Connections and intersections between multi-use trail facilities and on-street facilities, • Locations where most bicyclist- and pedestrian-involved crashes occur,• Opportunities to improve comfort level of bicycle and pedestrian facilities.
2 Projects/Year
4 Projects/Year
DMD, and P+R
- Amount spent on or number of projects that include multi-use trail and bicycle facility construction and maintenance- Amount of money spent or number of projects in areas on the bicyclist-involved HFIN map and in vulnerable communities
ACTION FY2021–2022 FY2023–2025 LEADS PERFORMANCE INDICATORS
CIT
Y O
F A
LBU
QU
ERQ
UE
Dedicated, well-marked bicycle lanes
increase the visibility of people riding
bicycles.
VISION ZERO ACTION PLAN
34
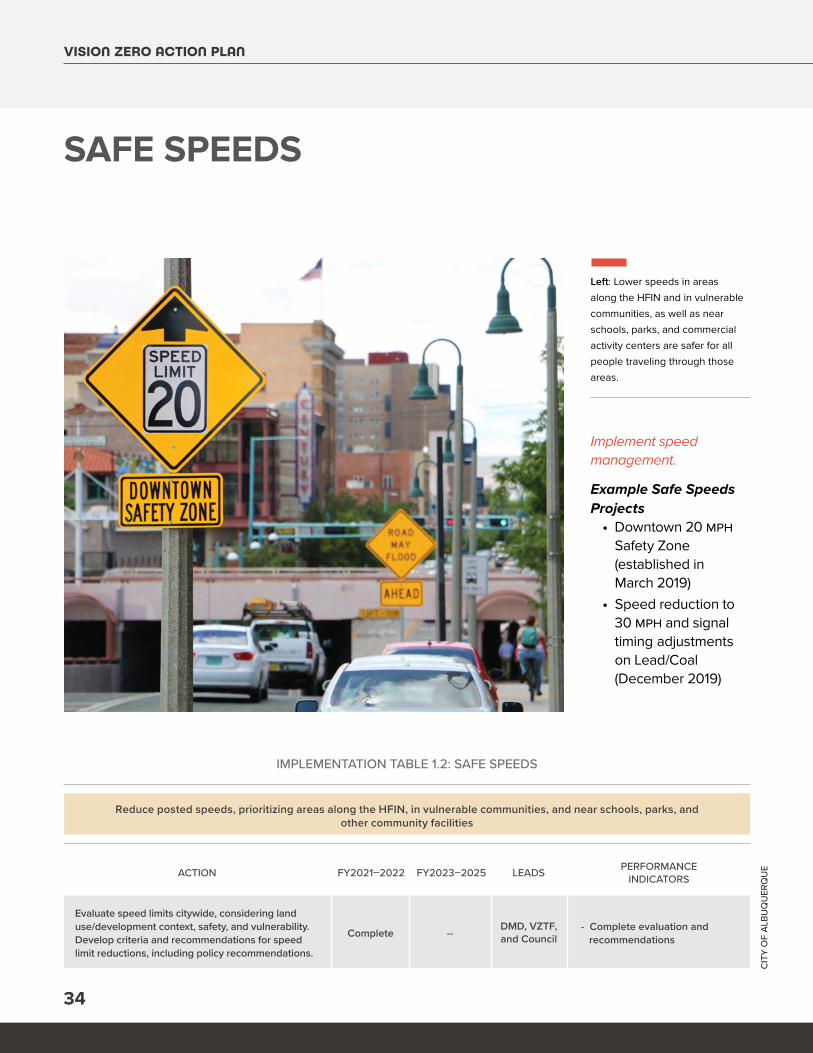
IMPLEMENTATION TABLE 1.2: SAFE SPEEDS
Evaluate speed limits citywide, considering land use/development context, safety, and vulnerability. Develop criteria and recommendations for speed limit reductions, including policy recommendations.
Complete -- DMD, VZTF,and Council
- Complete evaluation and recommendations
ACTION FY2021–2022 FY2023–2025 LEADS PERFORMANCE INDICATORS
Reduce posted speeds, prioritizing areas along the HFIN, in vulnerable communities, and near schools, parks, and other community facilities
SAFE SPEEDS
Implement speed management.
Example Safe Speeds Projects
• Downtown 20 MPH Safety Zone (established in March 2019)• Speed reduction to 30 MPH and signal timing adjustments on Lead/Coal (December 2019)
CIT
Y O
F A
LBU
QU
ERQ
UE
Left: Lower speeds in areas
along the HFIN and in vulnerable
communities, as well as near
schools, parks, and commercial
activity centers are safer for all
people traveling through those
areas.
2020-2021
35
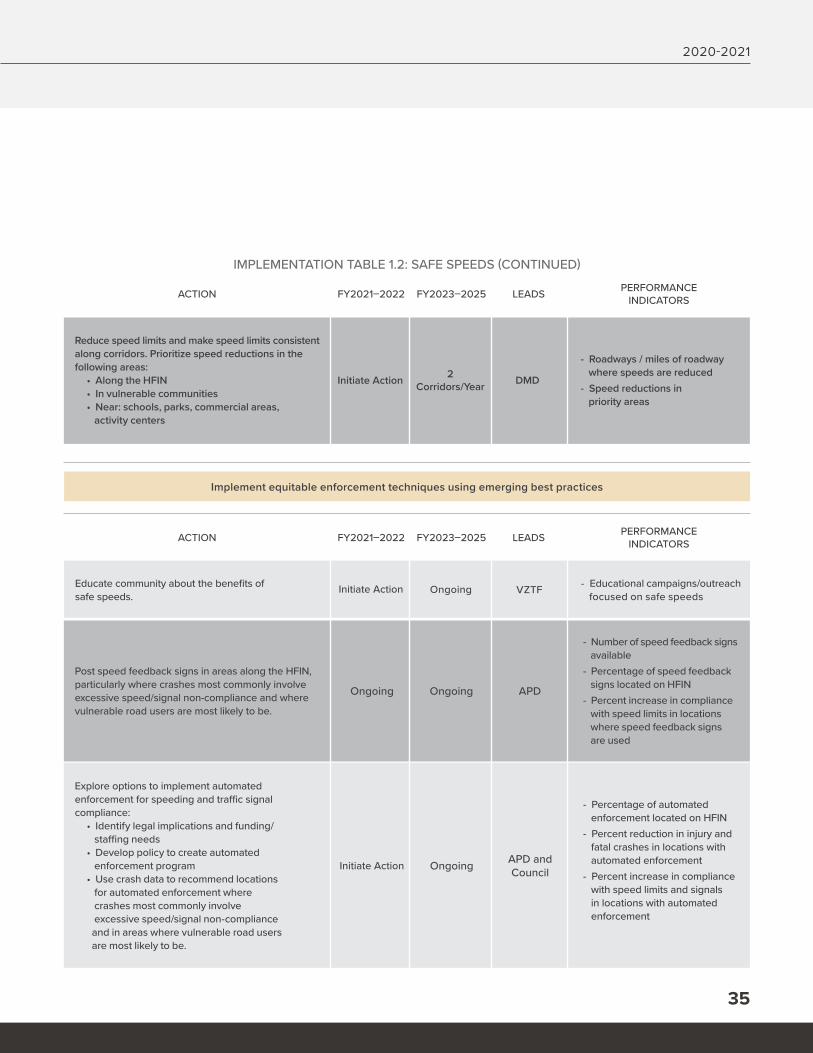
Post speed feedback signs in areas along the HFIN, particularly where crashes most commonly involve excessive speed/signal non-compliance and where vulnerable road users are most likely to be.
Explore options to implement automated enforcement for speeding and traffic signal compliance:
• Identify legal implications and funding/ staffing needs• Develop policy to create automated enforcement program• Use crash data to recommend locations for automated enforcement where crashes most commonly involve excessive speed/signal non-compliance and in areas where vulnerable road users are most likely to be.
Ongoing
Initiate Action
Ongoing
Ongoing
APD
APD and Council
- Number of speed feedback signs available- Percentage of speed feedback signs located on HFIN- Percent increase in compliance with speed limits in locations where speed feedback signs are used
- Percentage of automated enforcement located on HFIN- Percent reduction in injury and fatal crashes in locations with automated enforcement- Percent increase in compliance with speed limits and signals in locations with automated enforcement
Reduce speed limits and make speed limits consistent along corridors. Prioritize speed reductions in the following areas:
• Along the HFIN• In vulnerable communities• Near: schools, parks, commercial areas, activity centers
Initiate Action 2 Corridors/Year DMD
- Roadways / miles of roadway where speeds are reduced- Speed reductions in priority areas
ACTION FY2021–2022 FY2023–2025 LEADS PERFORMANCE INDICATORS
Educate community about the benefits of safe speeds.
Initiate Action Ongoing VZTF - Educational campaigns/outreach focused on safe speeds
ACTION FY2021–2022 FY2023–2025 LEADS PERFORMANCE INDICATORS
Implement equitable enforcement techniques using emerging best practices
IMPLEMENTATION TABLE 1.2: SAFE SPEEDS (CONTINUED)
VISION ZERO ACTION PLAN
36
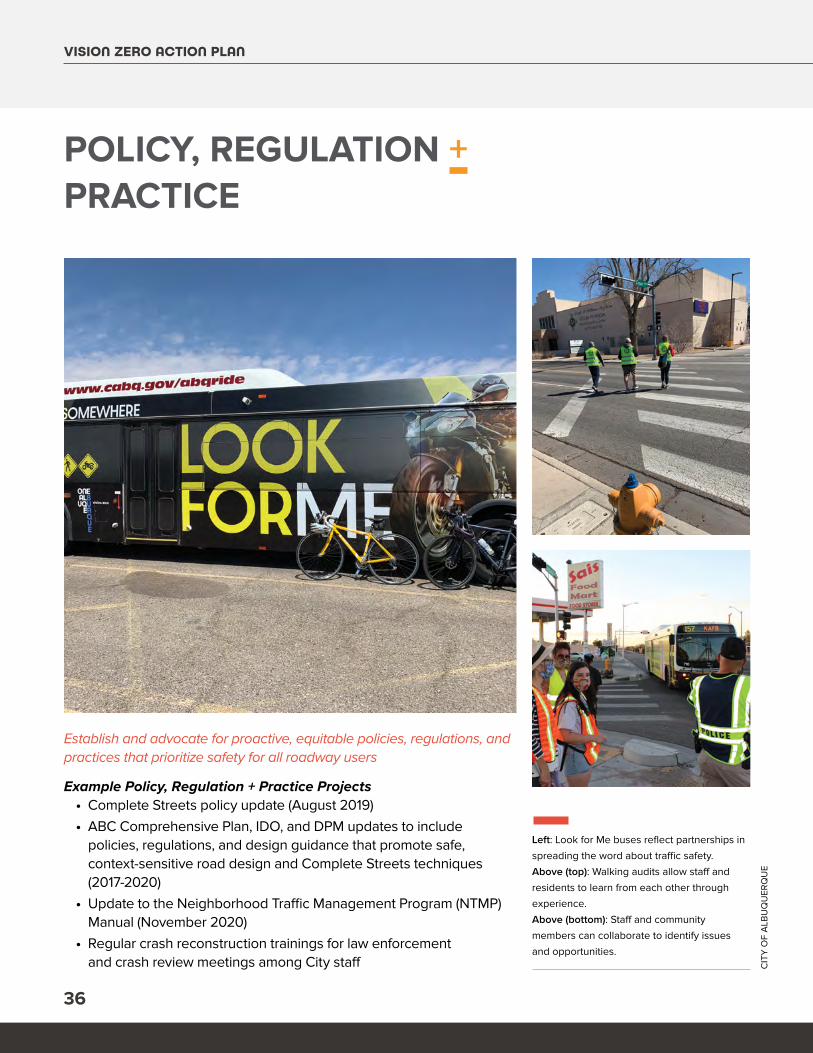
Establish and advocate for proactive, equitable policies, regulations, and practices that prioritize safety for all roadway users
Example Policy, Regulation + Practice Projects• Complete Streets policy update (August 2019)• ABC Comprehensive Plan, IDO, and DPM updates to include policies, regulations, and design guidance that promote safe, context-sensitive road design and Complete Streets techniques (2017-2020)• Update to the Neighborhood Traffic Management Program (NTMP) Manual (November 2020)• Regular crash reconstruction trainings for law enforcement and crash review meetings among City staff
POLICY, REGULATION + PRACTICE
CIT
Y O
F A
LBU
QU
ERQ
UE
Left: Look for Me buses reflect partnerships in
spreading the word about traffic safety.
Above (top): Walking audits allow staff and
residents to learn from each other through
experience.
Above (bottom): Staff and community
members can collaborate to identify issues
and opportunities.
2020-2021
37
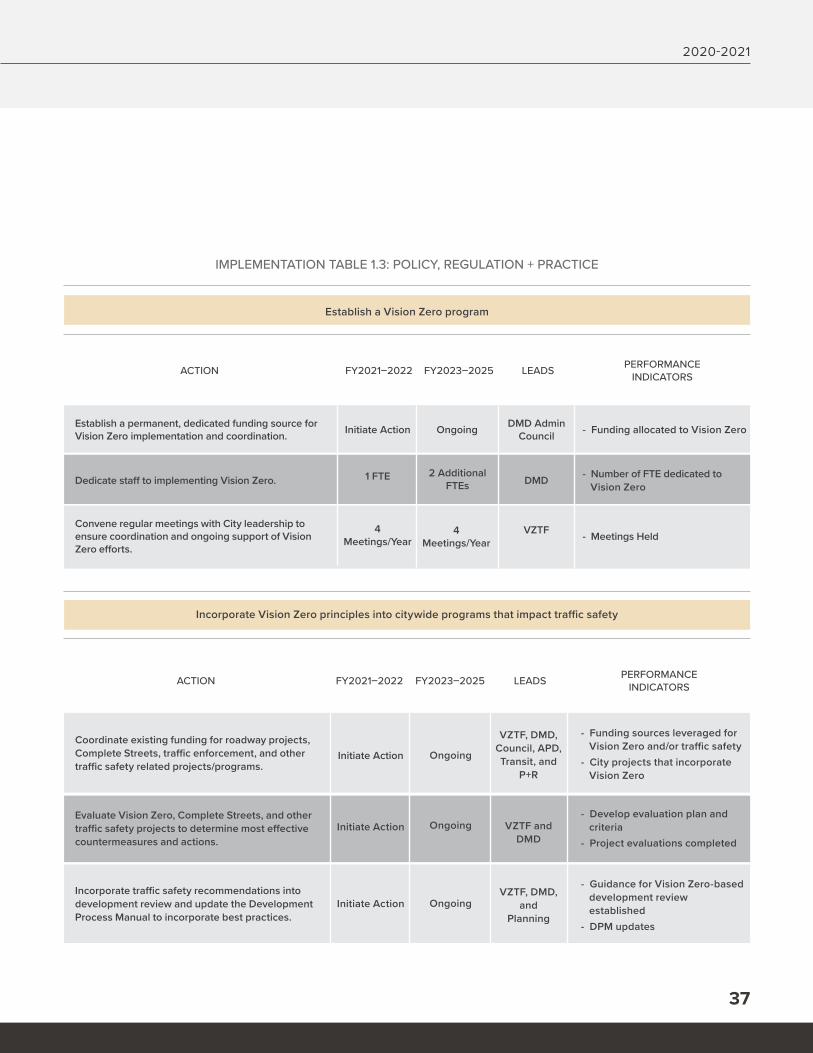
IMPLEMENTATION TABLE 1.3: POLICY, REGULATION + PRACTICE
Establish a permanent, dedicated funding source for Vision Zero implementation and coordination.
Dedicate staff to implementing Vision Zero.
Initiate Action
1 FTE
Ongoing
2 Additional FTEs
4 Meetings/Year
4 Meetings/Year
DMD Admin Council
DMD
VZTF
- Funding allocated to Vision Zero
- Number of FTE dedicated to Vision Zero
- Meetings Held
ACTION FY2021–2022 FY2023–2025 LEADS PERFORMANCE INDICATORS
Convene regular meetings with City leadership to ensure coordination and ongoing support of Vision Zero efforts.
Establish a Vision Zero program
Coordinate existing funding for roadway projects, Complete Streets, traffic enforcement, and other traffic safety related projects/programs.
Evaluate Vision Zero, Complete Streets, and other traffic safety projects to determine most effective countermeasures and actions.
Incorporate traffic safety recommendations into development review and update the Development Process Manual to incorporate best practices.
Initiate Action
Initiate Action
Initiate Action
Ongoing
Ongoing
Ongoing
VZTF, DMD, Council, APD, Transit, and
P+R
VZTF and DMD
VZTF, DMD, and
Planning
- Funding sources leveraged for Vision Zero and/or traffic safety- City projects that incorporate Vision Zero
- Develop evaluation plan and criteria- Project evaluations completed
- Guidance for Vision Zero-based development review established- DPM updates
ACTION FY2021–2022 FY2023–2025 LEADS PERFORMANCE INDICATORS
Incorporate Vision Zero principles into citywide programs that impact traffic safety
VISION ZERO ACTION PLAN
38
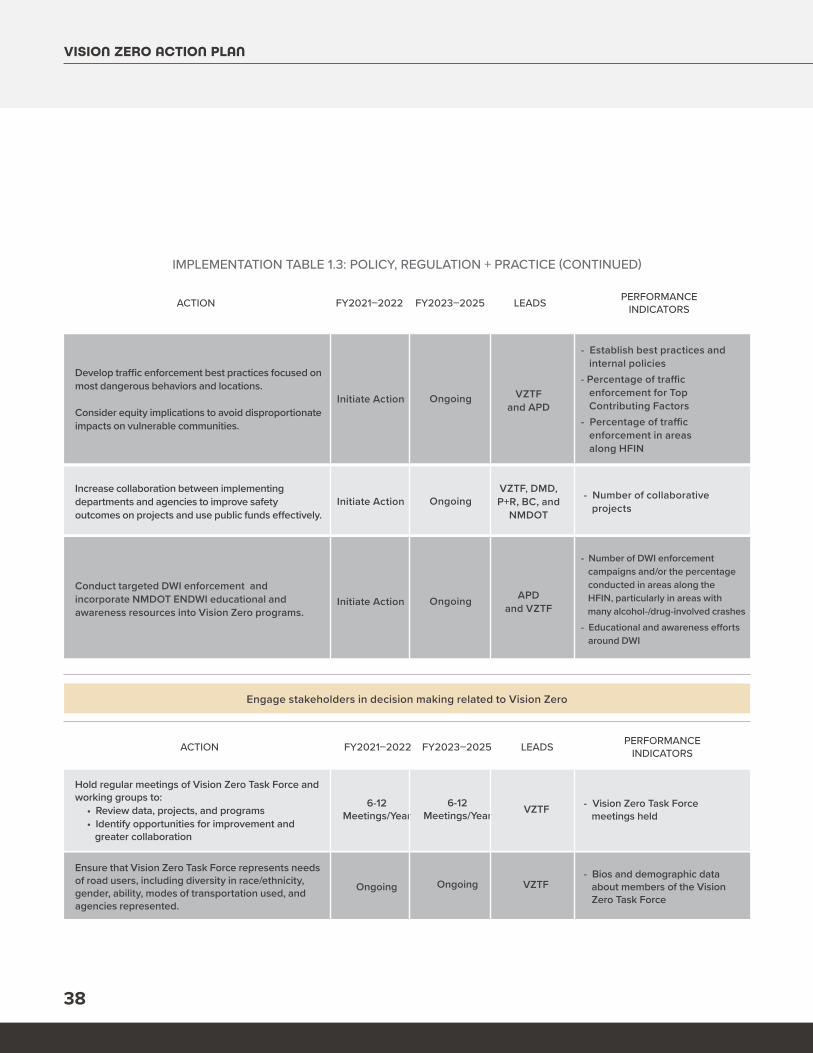
IMPLEMENTATION TABLE 1.3: POLICY, REGULATION + PRACTICE (CONTINUED)
Develop traffic enforcement best practices focused on most dangerous behaviors and locations.
Consider equity implications to avoid disproportionate impacts on vulnerable communities.
Increase collaboration between implementing departments and agencies to improve safety outcomes on projects and use public funds effectively.
Conduct targeted DWI enforcement and incorporate NMDOT ENDWI educational and awareness resources into Vision Zero programs.
Initiate Action
Initiate Action
Initiate Action
Ongoing
Ongoing
Ongoing
VZTF and APD
VZTF, DMD, P+R, BC, and
NMDOT
APD and VZTF
- Establish best practices and internal policies- Percentage of traffic enforcement for Top Contributing Factors- Percentage of traffic enforcement in areas along HFIN
- Number of DWI enforcement campaigns and/or the percentage conducted in areas along the HFIN, particularly in areas with many alcohol-/drug-involved crashes- Educational and awareness efforts around DWI
- Number of collaborative projects
ACTION FY2021–2022 FY2023–2025 LEADS PERFORMANCE INDICATORS
Hold regular meetings of Vision Zero Task Force and working groups to:
• Review data, projects, and programs• Identify opportunities for improvement and greater collaboration
Ensure that Vision Zero Task Force represents needs of road users, including diversity in race/ethnicity, gender, ability, modes of transportation used, and agencies represented.
6-12 Meetings/Year
Ongoing
6-12 Meetings/Year
Ongoing
VZTF
VZTF
- Vision Zero Task Force meetings held
- Bios and demographic data about members of the Vision Zero Task Force
ACTION FY2021–2022 FY2023–2025 LEADS PERFORMANCE INDICATORS
Engage stakeholders in decision making related to Vision Zero
2020-2021
39
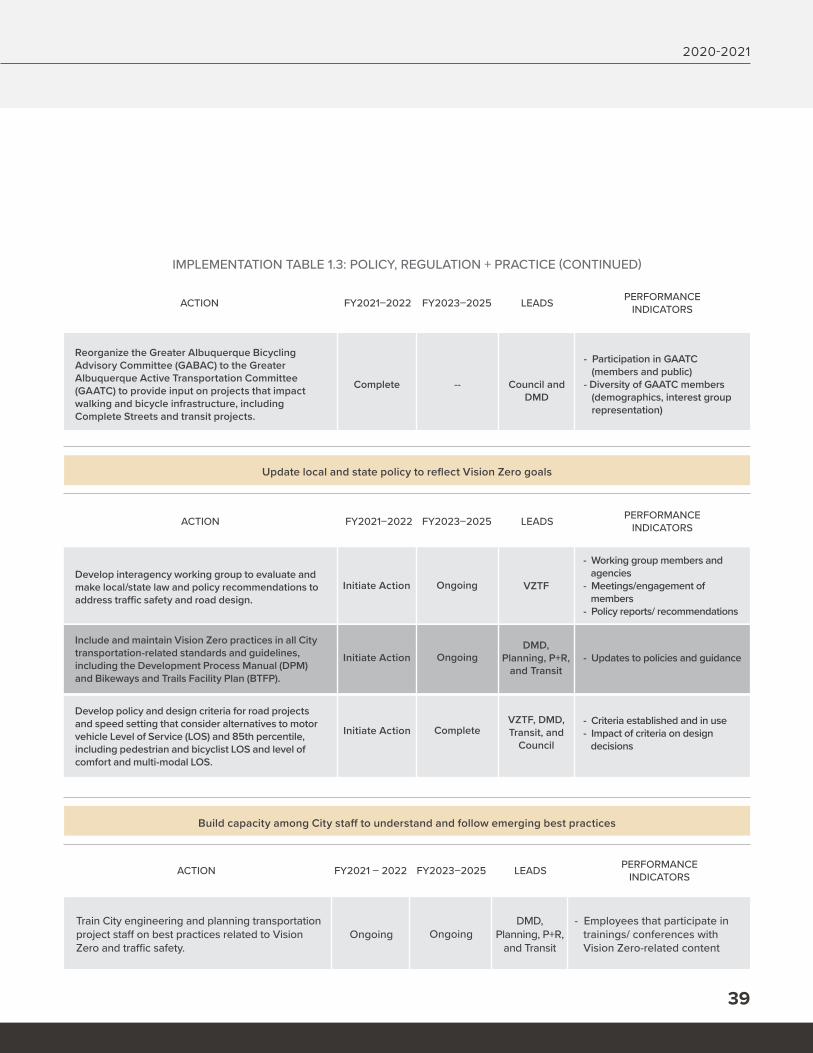
IMPLEMENTATION TABLE 1.3: POLICY, REGULATION + PRACTICE (CONTINUED)
Develop interagency working group to evaluate and make local/state law and policy recommendations to address traffic safety and road design.
Include and maintain Vision Zero practices in all City transportation-related standards and guidelines, including the Development Process Manual (DPM) and Bikeways and Trails Facility Plan (BTFP).
Develop policy and design criteria for road projects and speed setting that consider alternatives to motor vehicle Level of Service (LOS) and 85th percentile, including pedestrian and bicyclist LOS and level of comfort and multi-modal LOS.
Reorganize the Greater Albuquerque Bicycling Advisory Committee (GABAC) to the Greater Albuquerque Active Transportation Committee (GAATC) to provide input on projects that impact walking and bicycle infrastructure, including Complete Streets and transit projects.
Initiate Action
Initiate Action
Initiate Action
Complete
Ongoing
Ongoing
Complete
--
VZTF
DMD,Planning, P+R,
and Transit
VZTF, DMD, Transit, and
Council
Council and DMD
- Working group members and agencies- Meetings/engagement of members- Policy reports/ recommendations
- Updates to policies and guidance
- Criteria established and in use- Impact of criteria on design decisions
- Participation in GAATC (members and public)- Diversity of GAATC members (demographics, interest group representation)
ACTION FY2021–2022 FY2023–2025 LEADS PERFORMANCE INDICATORS
ACTION FY2021–2022 FY2023–2025 LEADS PERFORMANCE INDICATORS
Update local and state policy to reflect Vision Zero goals
Train City engineering and planning transportation project staff on best practices related to Vision Zero and traffic safety.
Ongoing OngoingDMD,
Planning, P+R, and Transit
- Employees that participate in trainings/ conferences with Vision Zero-related content
ACTION FY2021 – 2022 FY2023–2025 LEADS PERFORMANCE INDICATORS
Build capacity among City staff to understand and follow emerging best practices
VISION ZERO ACTION PLAN
40
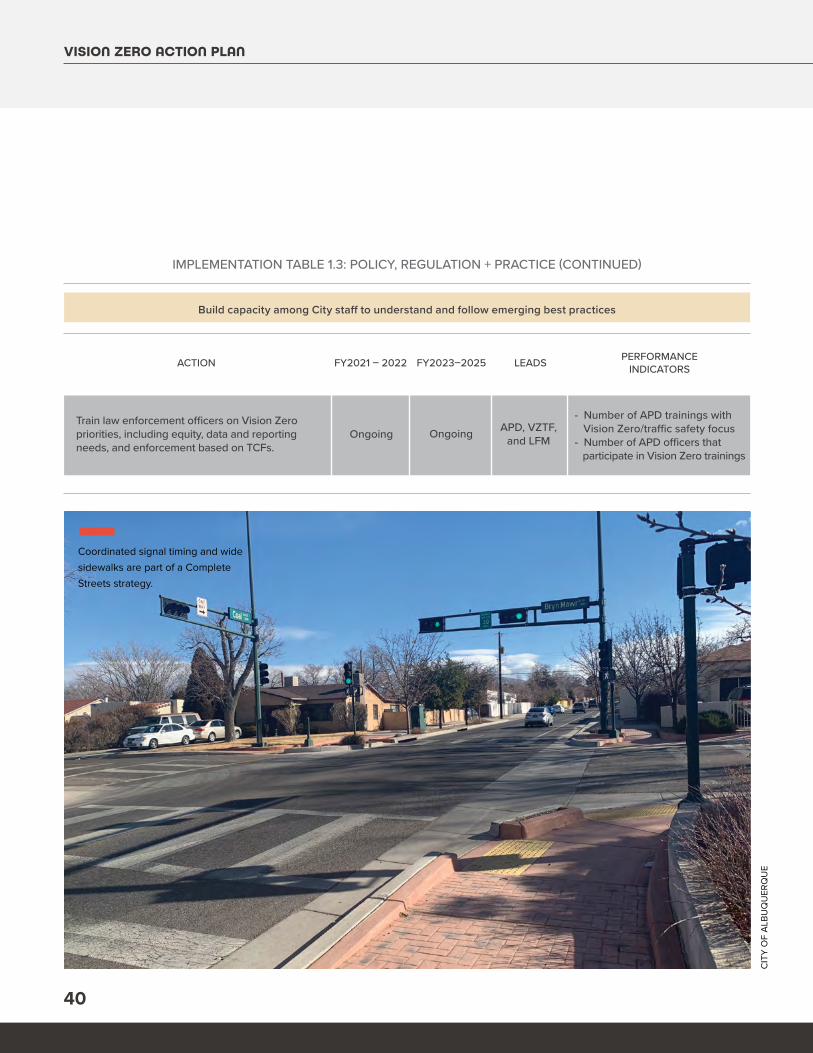
Train law enforcement officers on Vision Zero priorities, including equity, data and reporting needs, and enforcement based on TCFs.
Ongoing Ongoing APD, VZTF, and LFM
- Number of APD trainings with Vision Zero/traffic safety focus- Number of APD officers that participate in Vision Zero trainings
IMPLEMENTATION TABLE 1.3: POLICY, REGULATION + PRACTICE (CONTINUED)
ACTION FY2021 – 2022 FY2023–2025 LEADS PERFORMANCE INDICATORS
Build capacity among City staff to understand and follow emerging best practices
CIT
Y O
F A
LBU
QU
ERQ
UE
Coordinated signal timing and wide
sidewalks are part of a Complete
Streets strategy.
2020-2021
41
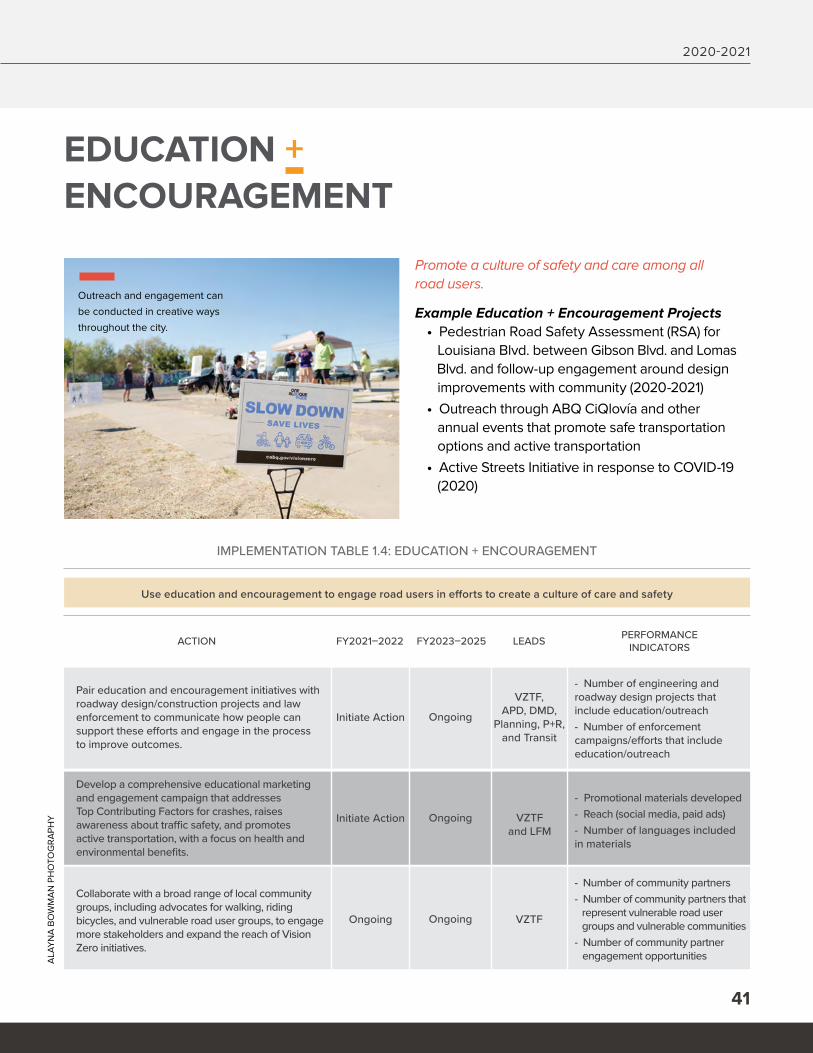
Pair education and encouragement initiatives with roadway design/construction projects and law enforcement to communicate how people can support these efforts and engage in the process to improve outcomes.
Collaborate with a broad range of local community groups, including advocates for walking, riding bicycles, and vulnerable road user groups, to engage more stakeholders and expand the reach of Vision Zero initiatives.
Develop a comprehensive educational marketing and engagement campaign that addresses Top Contributing Factors for crashes, raises awareness about traffic safety, and promotes active transportation, with a focus on health and environmental benefits.
Initiate Action
Ongoing
Initiate Action
Ongoing
Ongoing
Ongoing
VZTF, APD, DMD,
Planning, P+R, and Transit
VZTF and LFM
VZTF
- Number of engineering and roadway design projects that include education/outreach- Number of enforcement campaigns/efforts that include education/outreach
- Promotional materials developed- Reach (social media, paid ads)- Number of languages included in materials
- Number of community partners- Number of community partners that represent vulnerable road user groups and vulnerable communities- Number of community partner engagement opportunities
IMPLEMENTATION TABLE 1.4: EDUCATION + ENCOURAGEMENT
ACTION FY2021–2022 FY2023–2025 LEADS PERFORMANCE INDICATORS
Use education and encouragement to engage road users in efforts to create a culture of care and safety
EDUCATION + ENCOURAGEMENT
Promote a culture of safety and care among all road users.
Example Education + Encouragement Projects• Pedestrian Road Safety Assessment (RSA) for Louisiana Blvd. between Gibson Blvd. and Lomas Blvd. and follow-up engagement around design improvements with community (2020-2021)• Outreach through ABQ CiQlovía and other annual events that promote safe transportation options and active transportation• Active Streets Initiative in response to COVID-19 (2020)
ALA
YN
A B
OW
MA
N P
HO
TOG
RA
PHY
Outreach and engagement can
be conducted in creative ways
throughout the city.
VISION ZERO ACTION PLAN
42
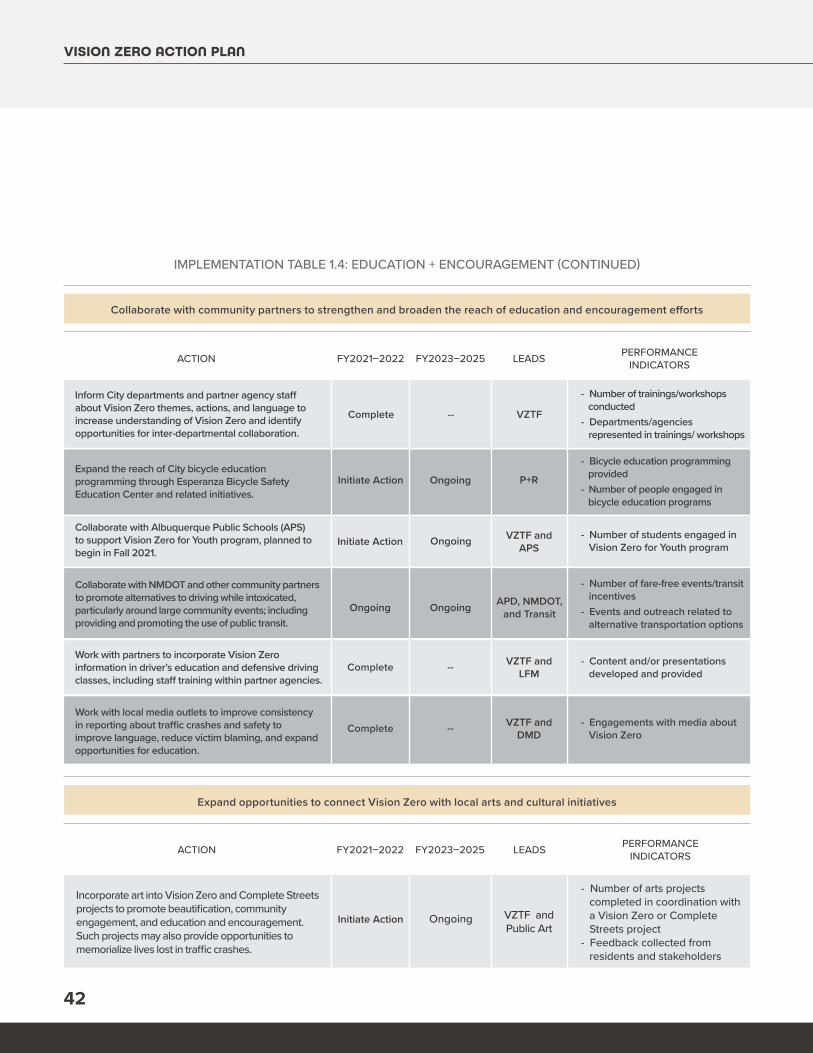
IMPLEMENTATION TABLE 1.4: EDUCATION + ENCOURAGEMENT (CONTINUED)
Inform City departments and partner agency staff about Vision Zero themes, actions, and language to increase understanding of Vision Zero and identify opportunities for inter-departmental collaboration.
Expand the reach of City bicycle education programming through Esperanza Bicycle Safety Education Center and related initiatives.
Collaborate with Albuquerque Public Schools (APS) to support Vision Zero for Youth program, planned to begin in Fall 2021.
Collaborate with NMDOT and other community partners to promote alternatives to driving while intoxicated, particularly around large community events; including providing and promoting the use of public transit.
Work with partners to incorporate Vision Zero information in driver’s education and defensive driving classes, including staff training within partner agencies.
Work with local media outlets to improve consistency in reporting about traffic crashes and safety to improve language, reduce victim blaming, and expand opportunities for education.
Complete
Initiate Action
Initiate Action
Ongoing
Complete
Complete
--
Ongoing
Ongoing
Ongoing
--
--
VZTF
P+R
VZTF andAPS
APD, NMDOT, and Transit
VZTF andLFM
VZTF andDMD
- Number of trainings/workshops conducted- Departments/agencies represented in trainings/ workshops
- Bicycle education programming provided- Number of people engaged in bicycle education programs
- Number of students engaged in Vision Zero for Youth program
- Number of fare-free events/transit incentives- Events and outreach related to alternative transportation options
- Content and/or presentations developed and provided
- Engagements with media about Vision Zero
ACTION FY2021–2022 FY2023–2025 LEADS PERFORMANCE INDICATORS
Incorporate art into Vision Zero and Complete Streets projects to promote beautification, community engagement, and education and encouragement. Such projects may also provide opportunities to memorialize lives lost in traffic crashes.
Initiate Action Ongoing VZTF and Public Art
- Number of arts projects completed in coordination with a Vision Zero or Complete Streets project- Feedback collected from residents and stakeholders
ACTION FY2021–2022 FY2023–2025 LEADS PERFORMANCE INDICATORS
Collaborate with community partners to strengthen and broaden the reach of education and encouragement efforts
Expand opportunities to connect Vision Zero with local arts and cultural initiatives
2020-2021
43
Develop a program to identify/create paths within and through neighborhoods to facilitate active transportation and recreation. Use existing sidewalks, multi-use trails, paths, and alleys where possible, with improvements and connections where needed. Provide wayfinding and community engagement to help residents take advantage of these paths.
Increase walking and bicycling infrastructure—in particular protected/buffered bicycle lanes and multi-use paths—that is accessible and comfortable. Prioritize infrastructure in locations that fill gaps in existing networks and connect to schools, parks, and commercial areas/activity centers.
Initiate Action
Ongoing
Ongoing
Ongoing
Ongoing
Ongoing
P+R, DMD, and Comm.
Partners
DMD, P+R, and Transit
- Number of paths identified or improved
- Number of bicycle lane miles added and/or improved- Number of multi-use trail miles added and/or improved
IMPLEMENTATION TABLE 1.5: WALKING + ROLLING
ACTION FY2021–2022 FY2023–2025 LEADS PERFORMANCE INDICATORS
Provide incentives for people to take transit to events, including free fares and park-n-ride. Transit - Number of fare-free events/
transit incentives
Increase transportation options and create safe, comfortable opportunities for people to walk, ride a bicycle, use mobility devices, and take transit
WALKING + ROLLING
Increase opportunities for people throughout the city to safely walk, ride a bicycle, use mobility devices, and take transit.
Example Walking + Rolling Projects• Active Streets Initiative in response to COVID-19 (2019)• City support for annual events like Bike to Work Day and ABQ CiQlovía• Transit fare elimination for youth and older adults announced on Transit Equity Day (February 4) 2021• Bicycle education and an earn-a-bike program through Esperanza Bicycle Safety Education Center • BetterHealth programs that encourage City employees to walk and ride bicycles as part of health challenges
CIT
Y O
F A
LBU
QU
ERQ
UE
Events like Transit
Equity Day promote
transit access for all.
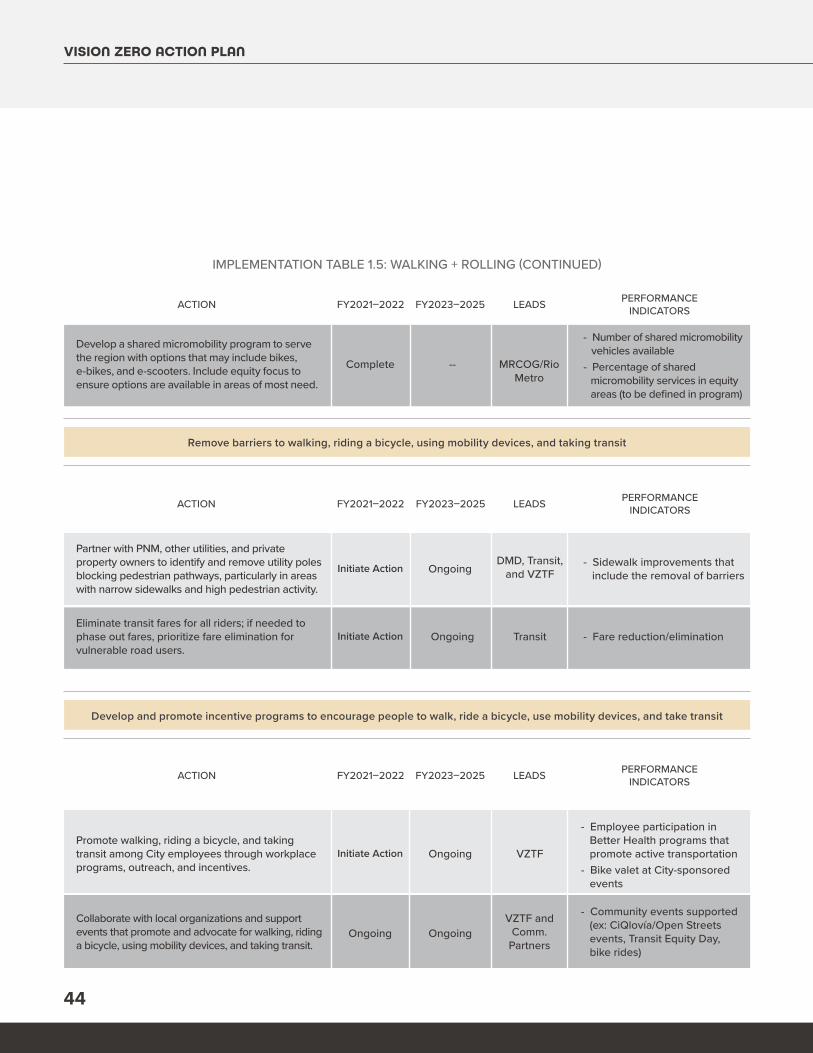
VISION ZERO ACTION PLAN
44
IMPLEMENTATION TABLE 1.5: WALKING + ROLLING (CONTINUED)
ACTION FY2021–2022 FY2023–2025 LEADS PERFORMANCE INDICATORS
Promote walking, riding a bicycle, and taking transit among City employees through workplace programs, outreach, and incentives.
Collaborate with local organizations and support events that promote and advocate for walking, riding a bicycle, using mobility devices, and taking transit.
Initiate Action
Ongoing
Ongoing
Ongoing
VZTF
VZTF and Comm.
Partners
- Employee participation in Better Health programs that promote active transportation- Bike valet at City-sponsored events
- Community events supported (ex: CiQlovía/Open Streets events, Transit Equity Day, bike rides)
ACTION FY2021–2022 FY2023–2025 LEADS PERFORMANCE INDICATORS
Develop and promote incentive programs to encourage people to walk, ride a bicycle, use mobility devices, and take transit
Complete --
Develop a shared micromobility program to serve the region with options that may include bikes, e-bikes, and e-scooters. Include equity focus to ensure options are available in areas of most need.
MRCOG/Rio Metro
- Number of shared micromobility vehicles available- Percentage of shared micromobility services in equity areas (to be defined in program)
Initiate Action
Initiate Action
Ongoing
Ongoing
Partner with PNM, other utilities, and private property owners to identify and remove utility poles blocking pedestrian pathways, particularly in areas with narrow sidewalks and high pedestrian activity.
Eliminate transit fares for all riders; if needed to phase out fares, prioritize fare elimination for vulnerable road users.
DMD, Transit, and VZTF
Transit
- Sidewalk improvements that include the removal of barriers
- Fare reduction/elimination
ACTION FY2021–2022 FY2023–2025 LEADS PERFORMANCE INDICATORS
Remove barriers to walking, riding a bicycle, using mobility devices, and taking transit
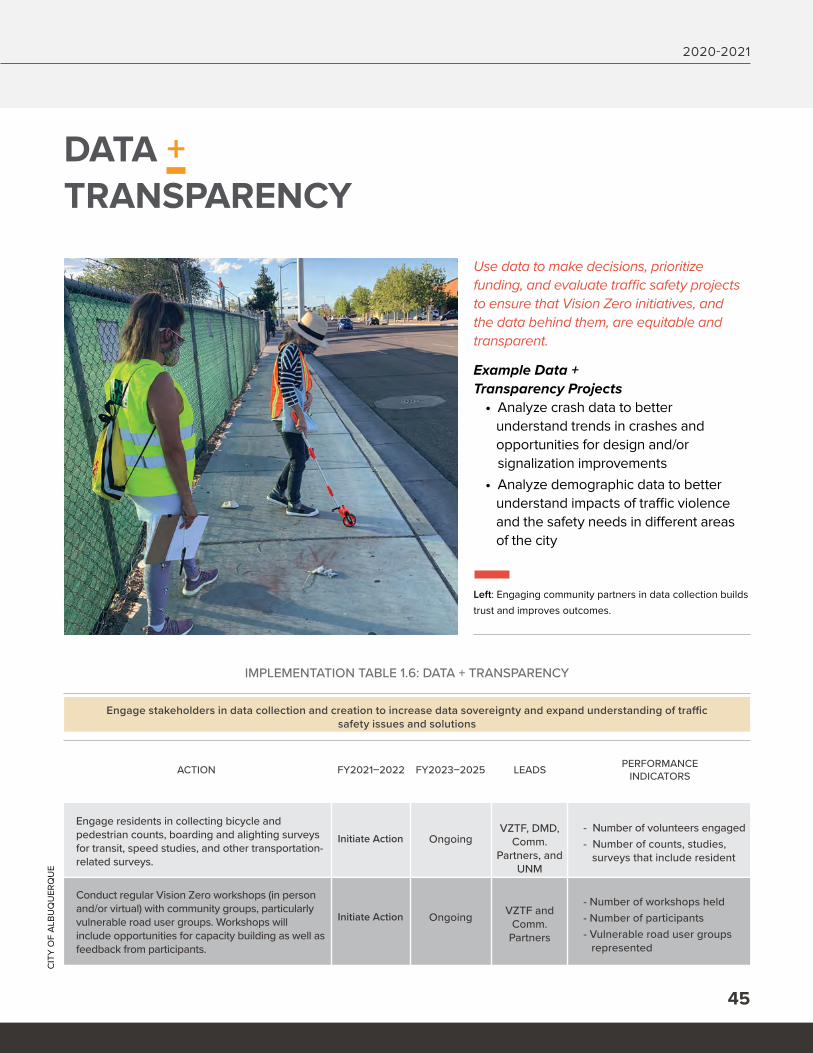
2020-2021
45
Engage residents in collecting bicycle and pedestrian counts, boarding and alighting surveys for transit, speed studies, and other transportation-related surveys.
Conduct regular Vision Zero workshops (in person and/or virtual) with community groups, particularly vulnerable road user groups. Workshops will include opportunities for capacity building as well as feedback from participants.
Initiate Action
Initiate Action
Ongoing
Ongoing
VZTF, DMD, Comm.
Partners, and UNM
VZTF and Comm.
Partners
- Number of volunteers engaged- Number of counts, studies, surveys that include resident
- Number of workshops held- Number of participants- Vulnerable road user groups represented
IMPLEMENTATION TABLE 1.6: DATA + TRANSPARENCY
ACTION FY2021–2022 FY2023–2025 LEADS PERFORMANCE INDICATORS
Engage stakeholders in data collection and creation to increase data sovereignty and expand understanding of traffic safety issues and solutions
Use data to make decisions, prioritize funding, and evaluate traffic safety projects to ensure that Vision Zero initiatives, and the data behind them, are equitable and transparent.
Example Data + Transparency Projects
• Analyze crash data to better understand trends in crashes and opportunities for design and/or signalization improvements• Analyze demographic data to better understand impacts of traffic violence and the safety needs in different areas of the city
DATA + TRANSPARENCY
CIT
Y O
F A
LBU
QU
ERQ
UE
Left: Engaging community partners in data collection builds
trust and improves outcomes.
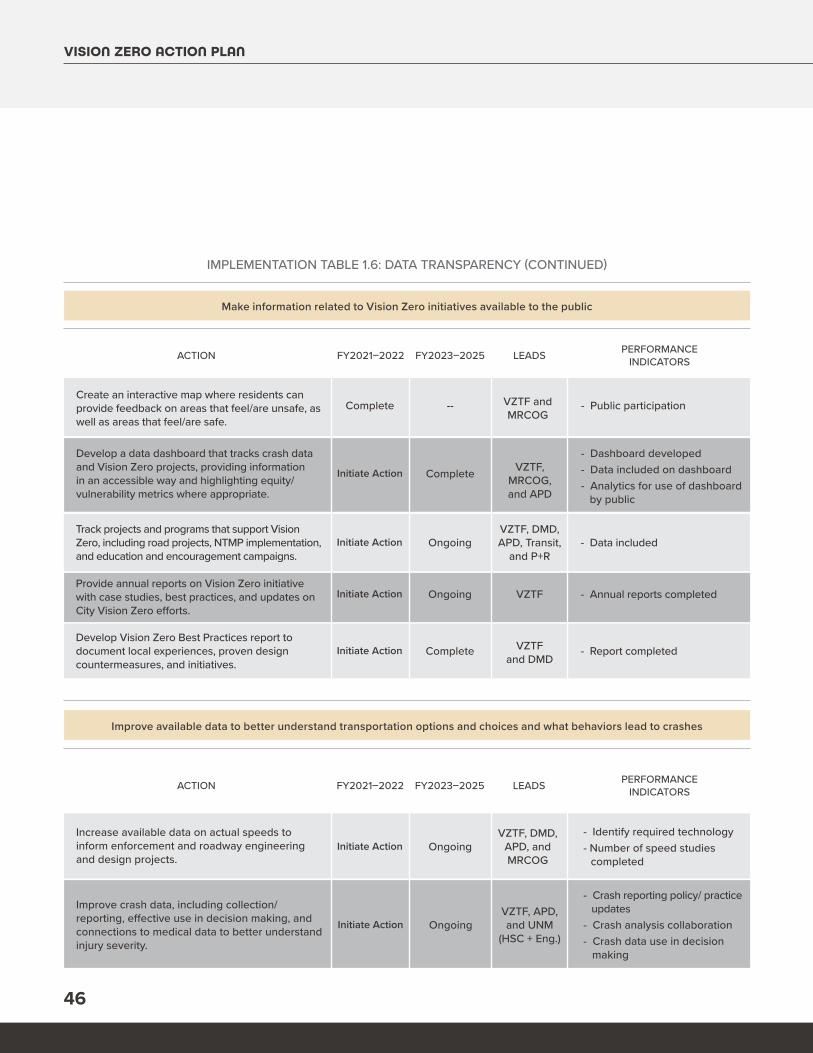
VISION ZERO ACTION PLAN
46
Initiate Action OngoingVZTF, APD, and UNM
(HSC + Eng.)
Increase available data on actual speeds to inform enforcement and roadway engineering and design projects.
Improve crash data, including collection/reporting, effective use in decision making, and connections to medical data to better understand injury severity.
Initiate Action OngoingVZTF, DMD,
APD, and MRCOG
- Identify required technology- Number of speed studies completed
- Crash reporting policy/ practice updates- Crash analysis collaboration- Crash data use in decision making
ACTION FY2021–2022 FY2023–2025 LEADS PERFORMANCE INDICATORS
Improve available data to better understand transportation options and choices and what behaviors lead to crashes
IMPLEMENTATION TABLE 1.6: DATA TRANSPARENCY (CONTINUED)
Create an interactive map where residents can provide feedback on areas that feel/are unsafe, as well as areas that feel/are safe.
Develop a data dashboard that tracks crash data and Vision Zero projects, providing information in an accessible way and highlighting equity/vulnerability metrics where appropriate.
Track projects and programs that support Vision Zero, including road projects, NTMP implementation, and education and encouragement campaigns.
Develop Vision Zero Best Practices report to document local experiences, proven design countermeasures, and initiatives.
Provide annual reports on Vision Zero initiative with case studies, best practices, and updates on City Vision Zero efforts.
Complete
Initiate Action
Initiate Action
Initiate Action
Initiate Action
--
Complete
Ongoing
Ongoing
Complete
VZTF and MRCOG
VZTF, MRCOG, and APD
VZTF, DMD, APD, Transit,
and P+R
VZTF
VZTF and DMD
- Public participation
- Dashboard developed- Data included on dashboard- Analytics for use of dashboard by public
- Data included
- Annual reports completed
- Report completed
ACTION FY2021–2022 FY2023–2025 LEADS PERFORMANCE INDICATORS
Make information related to Vision Zero initiatives available to the public
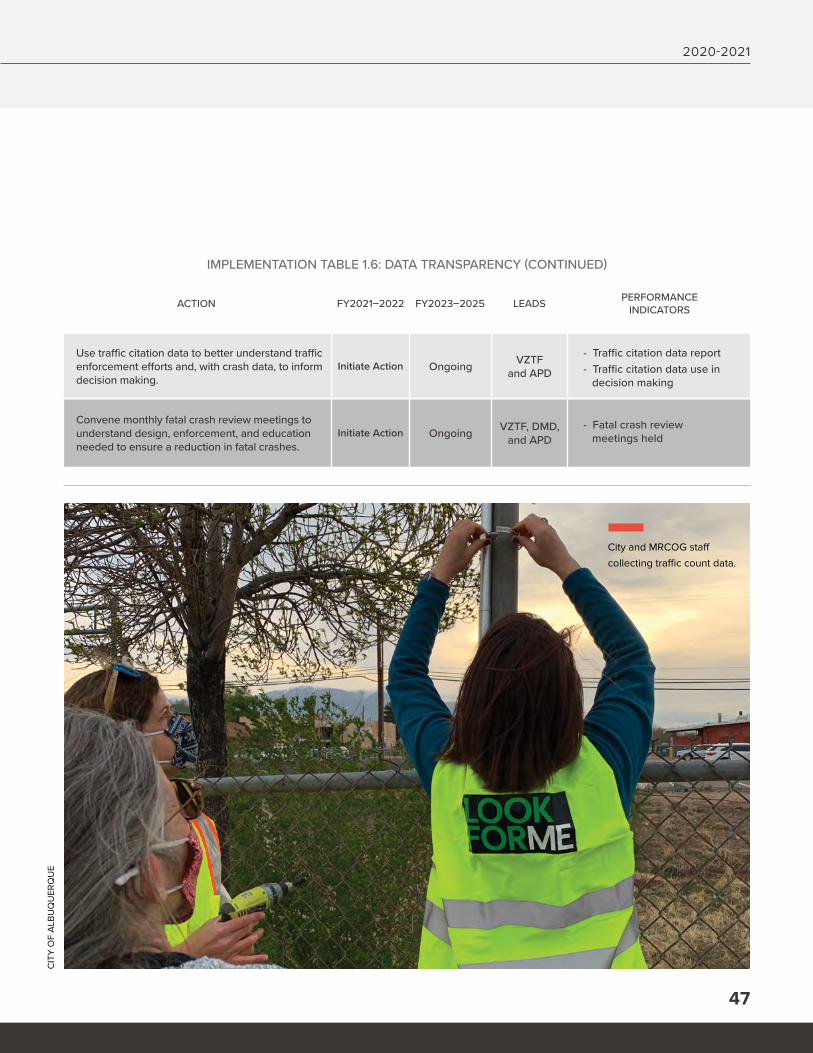
2020-2021
47
Initiate Action
Initiate Action
Ongoing
Ongoing
VZTF and APD
VZTF, DMD, and APD
Use traffic citation data to better understand traffic enforcement efforts and, with crash data, to inform decision making.
Convene monthly fatal crash review meetings to understand design, enforcement, and education needed to ensure a reduction in fatal crashes.
- Traffic citation data report- Traffic citation data use in decision making
- Fatal crash review meetings held
IMPLEMENTATION TABLE 1.6: DATA TRANSPARENCY (CONTINUED)
ACTION FY2021–2022 FY2023–2025 LEADS PERFORMANCE INDICATORS
CIT
Y O
F A
LBU
QU
ERQ
UE
City and MRCOG staff
collecting traffic count data.
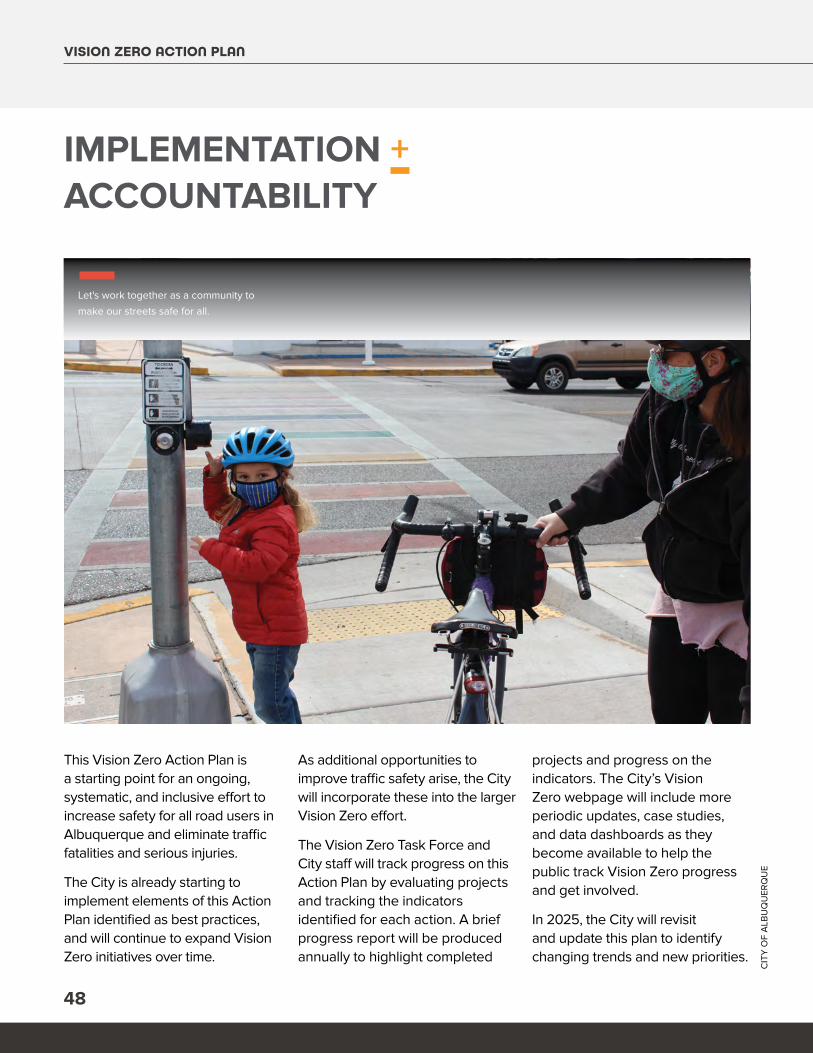
VISION ZERO ACTION PLAN
48
This Vision Zero Action Plan is a starting point for an ongoing, systematic, and inclusive effort to increase safety for all road users in Albuquerque and eliminate traffic fatalities and serious injuries.
The City is already starting to implement elements of this Action Plan identified as best practices, and will continue to expand Vision Zero initiatives over time.
IMPLEMENTATION + ACCOUNTABILITY
As additional opportunities to improve traffic safety arise, the City will incorporate these into the larger Vision Zero effort.
The Vision Zero Task Force and City staff will track progress on this Action Plan by evaluating projects and tracking the indicators identified for each action. A brief progress report will be produced annually to highlight completed
projects and progress on the indicators. The City’s Vision Zero webpage will include more periodic updates, case studies, and data dashboards as they become available to help the public track Vision Zero progress and get involved.
In 2025, the City will revisit and update this plan to identify changing trends and new priorities.
CIT
Y O
F A
LBU
QU
ERQ
UE
Let's work together as a community to
make our streets safe for all.
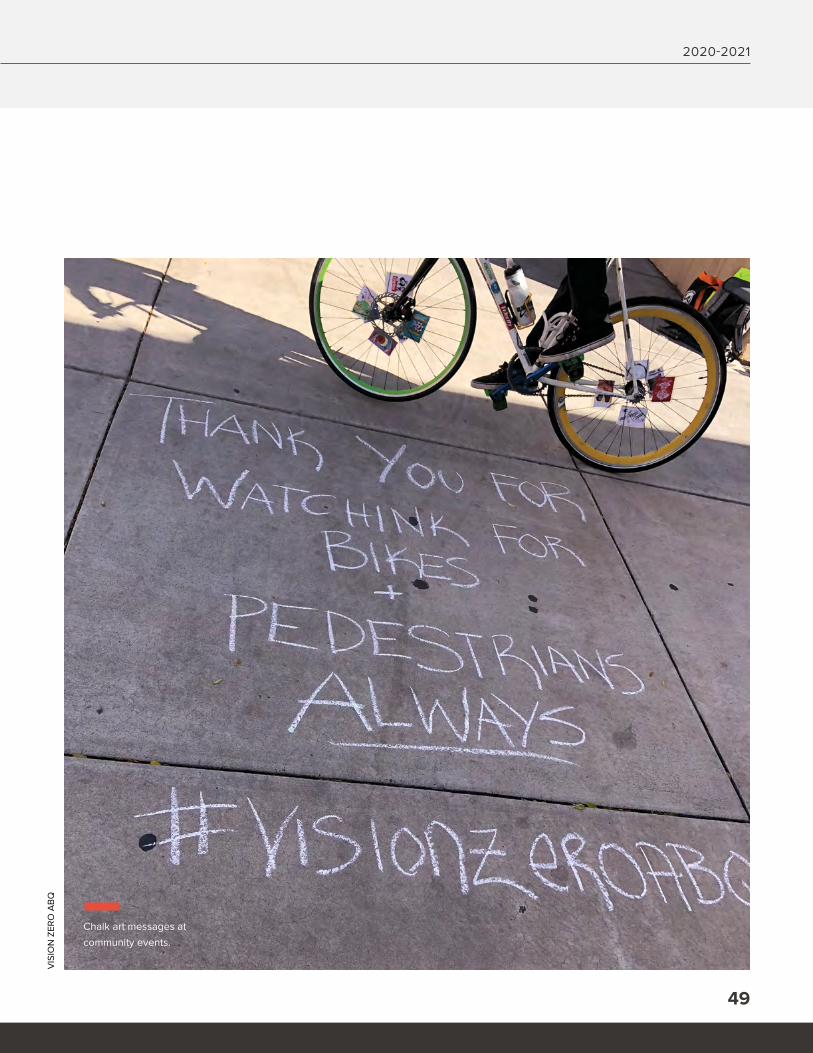
2020-2021
49
VIS
ION
ZER
O A
BQ
Chalk art messages at
community events.
TIMOTHY M. KELLERMayor, City Of Albuquerque
TERRA REEDVision Zero Coordinator
DESIG
NED
BY Jazmen Bradford, C
ABQ G
raphic Designer
VISION ZERO ACTION PLAN
P: (505) 924-3475E: [email protected]


