The adoption of automated phenotyping by plant breeders
Lana Awada . Peter W. B. Phillips . Stuart J. Smyth
Received: 28 February 2018 / Accepted: 26 July 2018 / Published online: 2 August 2018
� The Author(s) 2018
Abstract Phenomics or automated phenotyp-
ing (AP) is an emerging approach, identified as a
priority for future crop breeding research. This
approach promises to provide accurate, precise, fast,
large-scale, and accumulated phenotyping data which
when integrated with corresponding genomic and
environmental data is expected to trigger a great leap
forward in plant breeding. However, despite promis-
ing applications, AP adoption in plant breeding is still
in its infancy. It is unclear to many plant breeders how
or if much of the enormous volume, diversity, and
velocity of imaging and remote-sensing data gener-
ated by AP is going to be usefully integrated into
breeding programs. This paper develops an econom-
ical model of heterogeneous breeders’ decision-
making to examine adoption decisions regarding
whether to adopt AP or continue using conventional
phenotyping. The results of this model indicate that
many interlocking factors, including genetic gain/ex-
pected return, variable and sunk costs, subsequent rate
of technology improvement, and breeders’ level of
aversion to AP, are at work as breeders determine
whether to adopt AP. This study also provides a
numerical example to show the impact of breeders’
aversion toward the adoption of a new technology
(e.g., AP) on the expected return generated from
breeding a new wheat variety.
Keywords Plant breeding � Phenomics � Economics
of technology adoption �Decision-making �Genomics
Introduction
There is a widespread and long-standing agreement
that global improvement in crop productivity has
mainly been achieved through the development and
adoption of new agricultural technologies (Hurley
et al. 2016; Hurley et al. 2014; Alston et al. 2010;
Alston et al. 2000). Greater crop production is forecast
to be needed to ensure food security as competition for
scarce land and water resources intensifies in the face
of climate change, and population and income growth
(Hunter et al. 2017). Most of the increase in this
L. Awada (&) � P. W. B. Phillips
Johnson Shoyama Graduate School of Public Policy
(JSGS), University of Saskatchewan, 101 Diefenbaker
Place, Saskatoon S7N 5B8, Canada
e-mail: [email protected]
P. W. B. Phillips
e-mail: [email protected]
URL: http://www.schoolofpublicpolicy.sk.ca;
http://peterwbphillips.org
S. J. Smyth
Department of Agricultural and Resource Economics
(ARE), College of Agriculture and Bioresources,
University of Saskatchewan, 51 Campus Drive,
Saskatoon, SK S7N 5A8, Canada
e-mail: [email protected]
URL: http://www.saifood.ca
123
Euphytica (2018) 214:148
https://doi.org/10.1007/s10681-018-2226-z(0123456789().,-volV)(0123456789().,-volV)
production must come from lands already in cultiva-
tion—80% of the global growth in crop production
must come from intensification in the form of yield
gains, 10% from cropping intensities, and 10% from
arable land expansion (FAO 2012). Plant genomics
and phenomics represent the most promising tools for
accelerating yield gains, and plant breeding is at heart
of that mission. One place of particular focus for some
is the selection process, whereby breeders select
materials for further development based on phenomic
expression. While many breeders have adopted
genomics and various advanced genetic breeding or
selection processes, for the most part, plant breeders
have not exploited many of the opportunities for
mechanisation or intensive analysis now available due
to enhanced sensing, imaging and phenotype data
collection.
A phenotype is the composite of an observable
expression of a genome for traits in a given environ-
ment. Traits could be visible to the naked eye
(conventional phenotype, CP), or visible by using
technical procedures. Phenomics—the systematic
genome-wide study of an organism’s phenotype—is
an emerging approach that aims to automate and
standardize the phenotyping process to capture infor-
mation about the minutiae of plant growth, composi-
tion and performance by using a wide array of non-
invasive and non-destructive imaging and remote
sensing techniques, including high-throughput meth-
ods of data acquisition and analysis. This approach
promises to deliver accurate, precise, fast, large-scale,
and accumulated data in controlled and varying
environmental conditions and to provide the opportu-
nity to ‘datify’ or turn into data phenotyping activities
that were previously un-quantified (Kumar et al. 2015;
Singh and Singh 2015, Newell and Marabelli 2015).
Interdisciplinary collaboration of expertise including
biologists, engineers, and computer scientists is cru-
cial for the implementation of phenomics or auto-
mated phenotyping (AP) into practice (Cobb et al.
2013; Kumar et al. 2015).
In plant breeding, AP could be used to screen
germplasm collections for desirable traits (forward
phenomics) and to dissect traits shown to be of value to
reveal their mechanistic basis, including various
physiological, biochemical, and biophysical processes
and genes controlling these traits (reverse phenomics)
(Singh and Singh 2015; Kumar et al. 2015). The
greatest benefit of AP would be achieved if this
technology allows breeders to select superior plants
that would otherwise be rejected by using CPmethods.
With the deluge of cheap high-throughput genotype
data and the rapid developments in plant molecular-
based breeding technologies, there is an increased
interest in AP as an approach that will provide precise
and correspondingly high-throughput phenotypic data
to harness the potential of genomic investigations,
including mapping initiatives and training genomic
selection (GS) models. This is especially important
when breeding for quantitative traits (QT), such as
yield and drought tolerance, as these traits usually
show continuous phenotype variation due to their
polygenic inheritance and environmental influence
and, thus, need to be repeatedly measured during the
life cycle of a plant in multi-environmental conditions
(Bassi et al. 2016; Desta and Rodomiro 2014; Cobb
et al. 2013).1
Despite promising applications, the adoption of AP
in plant breeding is still in its infancy (Australian
Government, GRDC 2017; Kumar et al. 2015). It is
still not clear to many plant breeders if or howmuch of
the generated AP data could be usefully integrated into
breeding programs. The enormous volume, diversity,
and velocity of imaging and remote-sensing data
generated by AP makes it a ‘big data’ problem. An
essential factor for the application of AP will be the
ability to present related information as tools that
support decision-making in breeding programs. Much
work is needed to address issues of ease of access, ease
of use and data management before AP technologies
are likely to see widespread uptake in plant breeding.
The development of ontology-based big data
1 Traits can be grouped into two genetic categories: (1)
qualitative traits and (2) quantitative traits (QTs). Qualitative
traits are generally governed by one or a few major genes, called
oligogenes, where each of these genes produces a large effect on
the trait phenotype. Qualitative traits have Mendelian inheri-
tance (high heritability), provide discrete/discontinuous pheno-
typic variation, and the phenotypic expression of oligogenes is
generally minimally affected by the environment. Therefore, as
their phenotypes are good indicators of their concerned geno-
type loci, qualitative traits are easy to manipulate and evaluate in
a breeding program (Singh and Singh 2015). QTs are governed
by many genes, called polygenes. Each of these genes has a
small effect on trait phenotype; the effect of each gene is too
small to be individually identified; and the effects of all
polygenes affecting a trait are cumulative. QTs show continuous
phenotypic variation (non-discrete) because of the polygenic
inheritance and environmental influences, and thus, cannot be
grouped into distinct phenotyping classes.
123
148 Page 2 of 15 Euphytica (2018) 214:148
management is needed to facilitate the integration of
metadata to establish genotype, phenotype and envi-
ronmental-data-point relationships that create mean-
ingful insights and provide opportunities to enhance
the breeding process (Kumar et al. 2015; International
Plant Phenotyping Network 2016; Phenospex 2016).
This paper develops an economical model of
adoption decision to assess breeders’ attitude towards
the adoption of the AP approach; the assumption of
breeder homogeneity is relaxed. Breeders’ preferences
towards technology adoption are assumed linked to
the characteristics of the technology. Breeders,
according to their preferences, choose the technology
for which they obtain the highest return or profit. Thus,
heterogeneous breeders are assumed to differ in the
relative gain or profit they generate from breeding a
cultivar under AP and CP. The model focuses on the
evolving nature of technologies, assuming that breed-
ers may expect a future technology improvement in
AP which could affect their decisions to adopt AP at
the present time and in the future.
Among the parameters in the model, we analyze the
importance of breeder’s aversion toward the adoption
of a new technology. For that, we provide a numerical
example to describe how the rate of aversion may
affect the expected return perceived by heterogeneous
breeders from the adoption of a new technology,
which in turn may affect their decision to adopt the
technology.
Automated plant phenotyping
Several phenotyping facilities have been established
and some are currently underway to develop con-
trolled and field-based AP. A variety of wavelength-
range cameras are available to capture signals from the
visible and infrared spectrum of light (Fig. 1). The
image technology includes: (1) visible (VIS) camera
RGB (red, green, and blue) to quantify the phenotype
plant architecture, height, stem diameter, leaf number
and area, color classification, and growth rate; (2) near
infrared (NIR) imaging which provides detailed
information on the watering status of plant leaves
and their reaction to water availability (e.g., drought),
and combined with specially-designed NIR unit for
roots can monitor the relative water content of the soil
surface; (3) infrared (IR) imaging measures above
ground plant water content and sense levels of abiotic
stress; (4) fluorescence (FLU) imaging for stress
identification and quantification, photosynthesis and
chlorophyll contents; (5) and hyperspectral
(HYPERS) imaging for measuring abiotic and biotic
stresses, pigment composition, nitrogen (N) use effi-
ciency, and other biochemical features (Kumar et al.
2015; LemnaTec 2018).
Field-based phenotyping combines advances in
sensing technologies, aeronautics, robotics, automatic
image acquisition, and automated environmental data
collection (Araus and Cairns 2014).
Plant breeding and the need for automated
phenotyping
The most common techniques used in plant breeding
are presented in Table 1. These techniques may
involve the introduction of new genetic variation and
the identification and tracking of genes for key traits,
in order to achieve greater genetic gain (DG) from
selection and to accelerate the breeding cycle. Regard-
less of the technology used, the following general
steps are associated with plant breeding: (1) defining
the objective(s) of the breeding program, including
such factors as improved farmer and/or processor
productivity, new product attributes to satisfy con-
sumer preferences, and improved environmental
impacts; (2) developing population or germplasm
400 nm 750 nmVIS
FLU
800 nm450 nm 500 nm 550 nm 650 nm600 nm 700 nm 1000 nm900 nm 2000 nm 5000 nm 10000 nm 15000 nm
NIR IR
HYPERS
Wavelength (nm):
Source: LemnaTec, 2018
Fig. 1 Imaging technologies
123
Euphytica (2018) 214:148 Page 3 of 15 148
collections that include the genetic variations of
interest; and (3) identifying and selecting individuals
with superior characteristics. If successful, selection
produces a new population that is phenotypically and
genetically different from the base population. The
new population is then used to develop new varieties
that eventually, after evaluation and certification, find
their way to a farmer’s field.
The most common selection methods used in plant
breeding are presented in Table 2. Traditionally,
selection of superior plants involves visual assessment
for traits—otherwise known as conventional pheno-
type (CP) selection. In the field, breeders focus on a
plant’s appearance—they use the field to visually
study plant phenotypic expression in different envi-
ronmental conditions and to select the type of lines
they will use to identify traits that have the potential to
improve agronomic features, offer higher yields or
produce specific qualities. However, CP methods are
labour and time intensive, environmentally sensitive
and costly. The data collected are frequently subjec-
tively encoded and can vary significantly. In addition,
CP has a limited capacity for measuring traits in very
large genetic populations, particularly for low heri-
tability and dynamic traits that have phenotypes that
change with time and environment and, thus, require
to be repeatedly measured during the life cycle of a
plant in multi-environment trials.
Recently, advances in genomics technologies (i.e.,
next generation sequencing technologies) have pro-
vided a better understanding of the genetic basis of a
trait and improved the efficiency of selection through
the use of marker selection methods (Table 2). The
integration of molecular-marker and conventional
selection methods into the breeding programs can
improve the precision and accelerate the breeding
cycle, as markers can be screened before the plant is
grown rather than measured in seeds or at the seedling
stage. The ability of markers to predict the phenotype
of a trait allows breeders to select for multiple
generations each year in a greenhouse.2
The genomic selection (GS) or genome-wide selec-
tion (GWS) model is seen as a promising molecular-
based selection approach. GS generates marker effects,
called genomic estimated breeding values (GEBVs),
across the whole genome of a breeding population (BP)
based on a statistical model developed in a training
Table 1 Techniques used in plant breeding. Sources Lusser et al. (2011), Acquaah (2012), Benkeblia (2014) and Mahesh (2016)
Traditional techniques
Emasculation; hybridization; wide crossing; chromosome doubling; chromosome counting; male sterility; triploidy; linkage
analysis; and statistical tools
Random mutation techniques
Mutagenesis; tissue culture; haploidy; isozyme; markers; in situ hybridization; Molecular markers; DNA sequencing; plant
genomic analysis; bioinformatics; Microarray analysis; primer design; and plant transformation
New biotechnological techniques
Oligonucleotide-directed mutagenesis (ODM); Cisgenesis/intragenesis; genome editing (e.g., Zink finger nuclease (ZFN);
TALENS & CRISPRs; GM rootstock grafting; RNA-dependent DNA methylation (RdDM); Reverse breeding; and agro-
infiltration
Table 2 Selection methods in plant breeding. Sources: Benkeblia (2014) and Singh and Singh (2015)
Conventional selection methods/conventional phenotype (CP) selection Pedigree selection; mass selection; pure line selection;
bulk population selection; and single-seed descent selection
Molecular selection methods/marker selection methods marker-based selection (MBS); marker-assisted selection (MAS); marker-
assisted backcrossing (MABC); marker-assisted recurrent selection (MARS); genomic selection (GS) or genome-wide selection
(GWS)
2 Note that the new molecular methods supplement and extend,
but do not replace, conventional breeding. The ultimate test of
value of a genotype is its performance in the targeted
environment. For instance, although molecular selection based
on molecular markers can be used in early generations at F2,
population size at F2 is often very large, and thus, it is not
efficient to perform molecular selection at this stage. Breeders
usually use conventional breeding based on phenotypic selec-
tion up until generation F4, after which they use molecular
selection in order to increase the frequency of desirable alleles
(Bonnett et al. 2005; Richards et al. 2010).
123
148 Page 4 of 15 Euphytica (2018) 214:148
population (TP). The training population includes
related individuals that have been both genotyped and
phenotyped, while the breeding population includes the
descendants of a TP that are only genotyped but not
phenotyped. GS has the ability to consider the effects of
all markers spread across the genome, thus capturing
moreof the genetic varianceof additive effects/breeding
value. GS does not eliminate phenotypic selection but
rather replaces many of the selections with whole-
genome predictions. The greater the phenotypic simi-
larity between the true breeding value in the TP and the
expected GEBV in the BP, the greater the accuracy of
the prediction model. Therefore, precision phenotyping
is important for evaluating a trainingpopulationbecause
the resulting dataset serves as a foundation for GS to
build the accuracy of the statistical models (Desta and
Rodomiro 2014; Cobb et al. 2013).
However, like conventional selection methods, the
application of molecular methods has not measurably
improved the selection of QTs. As previously indi-
cated, QTs show continuous phenotypic variation due
to the low level of inheritance of polygenes and the
influence of environmental factors. These character-
istics usually result in a deviation from the genetic
variance of additive effects (breeding value) (r2A).3
This deviation could be due to the dominant effects
(r2D)), epistatic effects (r2P), and/or the variance (r
2GE)
arising from the interaction between the genotype and
environment (G� E).
Previous studies of quantitative trait loci (QTL), e.g.,
Crossa et al. 2014; Nakaya and Isobe 2012; Singh and
Singh2015; andThomas2010, suggest that toovercome
G� E it is important to accumulate and evaluate field
phenotypes of QT by planting the mapping popula-
tions in replicated trials conducted over different
environments and years. For overcoming dominant
and epistatic effects, Lu et al. (2011), Nakaya and
Isobe (2012) and Singh and Singh (2015) and
suggested the use of mapping causative loci such as
interval mapping, association mapping/linkage dise-
quilibrium (LD), and genome-wide association studies
(GWAS). Mapping causative loci includes pheno-
typic, genotypic and pedigree data.
The discussion so far suggests that the application of
genomic information may trigger a great leap forward
in plant breeding, but only if linked and integrated with
corresponding phenomic and environmental informa-
tion (Fig. 2). Figure 2 summarizes the processes that
have to be taken before the application of automated
phenotyping in plant breeding programs. In light of this
challenge, several phenomic facilities [e.g., Julich
Plant Phenotyping Centre, Australian Plant Phe-
nomics, and Canada Plant Phenotyping and Imaging
Research Centre (P2IRC)] and networks (e.g., Inter-
national Plant Phenotyping Network, and European
Plant PhenotypingNetwork) have been established and
are operating at the national and global level. Looking
forward, improvements in digital phenotyping tech-
nology, computing capacity, and statistical methodol-
ogy should pave theway to efficiently archive, retrieve,
analyze, integrate, and interpret phenomic data. The
compelling social science research question is where
will those innovationsmost likely be adopted and used.
Breeders’ decision to adopt automated plant
phenotyping
Model assumptions
The model builds on previous work by Fulton and
Giannakas (2004) and Awada and Yiannka (2012)
who study the decision-making and welfare of
heterogeneous consumers and producers in differenti-
ated markets. In this model, we assume a group of
heterogeneous breeders, each of whom is trying to
optimize their relative profit function and needs to
decidewhether to adopt AP or to keep usingCP.At time
t, a breeder with attribute A has the following profit
function:
pAPt ¼ RAP � CAP þ dA� �
� Kt
if a cultivar is produced usingAPð1Þ
pCPt ¼ RCP � CCP if a cultivar is produced usingCP
ð2Þ
where pAPt and pCPt are the per unit profits associated
with breeding a cultivar using AP and CP, respec-
tively. The RAP and RCP are the economic revenue, and
CAP and CCP are the costs of breeding a cultivar under
AP and CP, respectively. CAP and CCP include the cost
of breeder’s activities, input costs, cost of informa-
tion/data, and costs of quality testing, variety registra-
tion and release under each approach. Parameter A
3 Additive effects are also know as the breeding values as they
are predictably transmitted to progeny.
123
Euphytica (2018) 214:148 Page 5 of 15 148
captures heterogeneous breeders’ preferences and,
thus, differences in their willingness to adopt AP. The
sources of heterogeneity can reside in breeders’
experience, education, management skills, manage-
ment of large/small scale breeding program, and
information sources, among other attributes. A is
assumed to be uniformly distributed with a unit
density f Að Þ ¼ 1 in an interval A 2 0; 1½ �, such that
the greater is the differentiating A (i.e., A value is
closer to 1), the lower is the breeder preference for AP.
The parameter d is the cost enhancement factor that
captures the degree of aversion to AP and is assumed
to be a non-negative constant across all breeders.
Thus, dA denotes the additional cost that a breeder
with attribute A incurs when adopting AP.4 The term
Kt is the sunk cost at time t—an expense that typically
incurred at the time of adoption and cannot be
recovered once spent (e.g., training to operate the
new technology, R&D, and specialized asset costs).
Since AP is an emerging technology and many
breeders are still uncertain about its integration into
breeding programs, there is an option value to waiting
before expending (‘sinking’) the costs of adoption.
Thus, Kt can be seen as the loss that a breeder sustains
by not waiting until the next period to adopt the
technology and the delayed benefits from the subse-
quent higher rate of improvement.
In this study, the genetic gain (DG) is used to
determine the revenue, R, from breeding a cultivar.
Following Brennan (1989), the economic revenue
from breeding a new cultivar of crop i is given by:
Ri ¼ YES DGiyWiy þ 1þ DGiy
100
� �DGiqWiq
� �� �ð3Þ
High-Throughput Phenotype (HTP)• Data Storage &Management• Image processing & Extract
Phenotypic data
DataIntegration
GWAS & QTL & Gene & Marker Discovery
Marker Assisted Breeding(MAS;GS) &Genetic Engineering
AdenineThymineGuanineCytosine
Image Acquisition
High throughput Genotype (HTG)
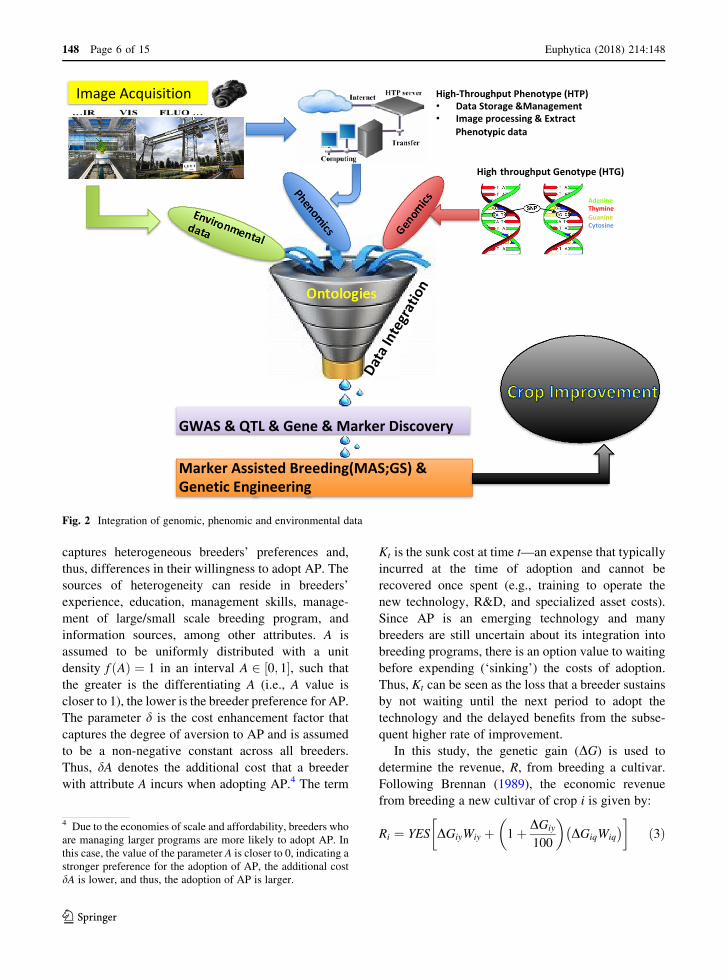
Fig. 2 Integration of genomic, phenomic and environmental data
4 Due to the economies of scale and affordability, breeders who
are managing larger programs are more likely to adopt AP. In
this case, the value of the parameter A is closer to 0, indicating a
stronger preference for the adoption of AP, the additional cost
dA is lower, and thus, the adoption of AP is larger.
123
148 Page 6 of 15 Euphytica (2018) 214:148
where Y is the mean yield (tonne/ha) before the
introduction of the new cultivar, E is the crop i total
growing area (ha); and S is the share of area E sown to
the new cultivar (the adoption rate of the new
cultivar); DGiy is the percentage genetic gain in trait
affecting yield; Wiy is the unit value of DGiy; DGiq is
the percentage genetic gain in traits affecting quality;
and Wiq is the unit value of DGiq.
Regardless of the technique or selection method
employed, the genetic gain (DG) from selection serves
as a universal concept for quantifying improvements
in a cultivar. Hence, it is called the breeders’ equation.
DG is the predicted change in the mean value of a trait
within a population that happens by selection, and
results in the introduction of a new cultivar in characters
affecting yield and/or quality. The genetic gain is given
by:
DG ¼ h2rpi=L ð4Þ
where h2 is the heritability parameter and represents
the probability that a trait will be transmitted from
parents to offspring. h2 in Eq. (4) is used in its narrow
sense representing the proportion of phenotypic vari-
ation due to additive genetic effects (h2 ¼ r2A=r2P).
The additive effect/breeding value is important in
plant breeding as it represents what is transferred to
offspring and can be changed by selection. As
previously indicated QTs are more difficult to breed
because of the large impact of dominance and epistatic
effects, which reduce heritability. The term rp is the
phenotypic variability in the original source popula-
tion (parental population), which is positively associ-
ated with genetic diversity, and affected by the
environment and the interactions between genotype
and the environment (G� E). The term i is the
selection intensity, expressed in units of standard
deviation frommean, and represents the fraction of the
current population retained and used as parents to
produce the next generation (i.e., if the whole popu-
lation is retained, i is zero). Finally, the term L is the
length of cycle interval, which is usually one gener-
ation (i.e., how quickly a generation can be completed
and the number of possible generations per year)
(Acquaah 2012; Moose and Mumm 2008).
Automated phenotyping enables breeders to improve
DG by: (1) estimating h2 through the use of large-scale
selection of (phenotype 9 genotype) association data
(GWAS) and large training population in GS that is
phenotyped and genotyped to estimate breeding value
(GEBV). In addition, automated phenotype can
improve h2 by determining the environmental effects
on traits at multiple field environmental conditions
(G 9 E); (2) increasing rp by introducing new genes,
a large phenotypic variance would provide the breeder
with a wide range of variability from which to select,
and thus resulting in a higher DG; (3) increasing
selection intensity, i, by helping breeders to choose a
lower proportion of individuals having a mean supe-
rior to the population mean; and (4) shortening cycles
(L), as individuals can be chosen in early growing
stage.
Breeder’s decision-making
A breeder’s adoption decision is determined by
comparing the profit derived from producing a cultivar
under CP and AP so the breeder with a differentiating
attribute At ¼ðRAP�RCPÞ� CAPþKtð Þ�CCP½ �
d (found by
equating pAPt ¼ pCPt Þ is indifferent between breeding
a cultivar under AP and CP (Fig. 3). Breeders with
attributes A 2 0; At
� �find it optimal to breed under
AP, while breeders with attributes A 2 At; 1�
breed
using CP. Given that breeders are uniformly dis-
tributed in the interval 0; 1½ �, the indifferent breeder At,
determines the share of AP and CT at time t, given by
Eqs. (5) and (6), respectively.
xAPt ¼ At ¼ðRAP � RCPÞ � CAP þ Ktð Þ � CCP½ �
dð5Þ
xCPt ¼ 1� At
¼ d� ðRAP � RCPÞ � CAP þ Ktð Þ � CCP½ �d
ð6Þ
Equation (5) shows that for the AP to have a
positive adoption the following conditions must hold:
RAP [ RCP � CCPð Þ þ CAP þ Ktð Þð Þ and/or
CAP þ Ktð Þ\ RAP � RCPð Þ � CCPð Þ. Otherwise, the
profit curve of the AP, pAPt , will lie below the profit
curve of the CP, pCPt ; for all A values, and all breeders
will not adopt AP and continue using CP (Fig. 3).
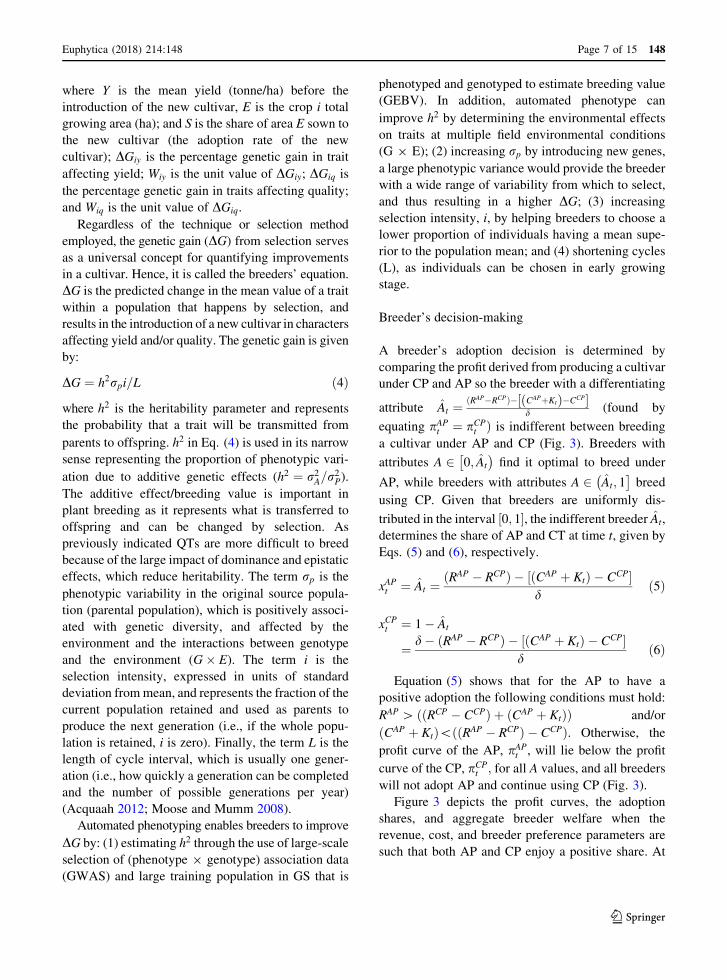
Figure 3 depicts the profit curves, the adoption
shares, and aggregate breeder welfare when the
revenue, cost, and breeder preference parameters are
such that both AP and CP enjoy a positive share. At
123
Euphytica (2018) 214:148 Page 7 of 15 148
time t, breeder welfare is given by the area below the
pCPt curve plus the green dashed area in Fig. 3.
The above results are based on the assumption that
a plant breeder is trying to make a decision whether to
adopt AP or to keep using CP by optimizing their
relative profit function. However, if AP is a comple-
mentary technology that is used, alongside, with the
exciting CP technology, or a technology that offers a
new information that is not provided by CP, the
decision to adopt AP doesn’t affect the use of CP. In
this case, the profit function of CP (i.e., pCPt ; Eq. 2)
does not enter into the breeders’ analysis process to
adopt AP, and thus, a breeder decision is determined
by only examining the profitability of AP (i.e., pAPt ;
Eq. 1). That is, for AP to have a positive adop-
tion/market share the following condition must hold:
RAP [ CAP þ dAþ Ktð Þ, for all values of A 2 0; 1½ �:At time t þ 1, if AP improves, the sunk cost, Kt,
decreases. Assuming that the technology improve-
ment decreases Kt by a constant rate a� 0; 1ð Þ (a could
address aspects such as improvement in robotics and
automation, big data management, training and edu-
cation needed and collaborations) the profit function,
ceteris paribus, of the breeder with attribute A from
the adoption of AP at time t þ 1 is given by:
pAPtþ1 ¼ RAP � CAP þ dA� �
� Kt 1� að Þif a cultivar is produced usingAP
ð7Þ
At time t þ 1, the indifferent breeder with attribute
Atþ1 is given by equating Eqs. (2) and (7):
Atþ1 ¼ðRAP�RCPÞ� CAPþKt 1�að Þð Þ�CCP½ �
d . In Fig. 3, breed-
ers with A 2 0; Atþ1
� �find it optimal to adopt AP,
while breeders with A 2 Atþ1; 1�
keep breeding by
using CP. The breeder with Atþ1 determines the
adoption/share of AP and CP at time t þ 1, given by
Eqs. (8) and (9), respectively.
xAPtþ1 ¼ Atþ1
¼ ðRAP � RCPÞ � CAP þ Kt 1� að Þð Þ � CCP½ �d
ð8Þ
xCPtþ1 ¼ 1� Atþ1
¼ d� ðRAP � RCPÞ � CAP þ Kt 1� að Þð Þ � CCP½ �d
ð9Þ
Equation (9) shows that the greater the rate of
technology improvement (a) the lower the sunk cost,
Kt, and thus the higher the proportion of breeders who
use AP at time t þ 1. This is shown graphically in
Fig. 3 by shifting the profit curve of AP upward from
pAPt to pAPtþ1 indicating an increase in the return to
breeders from using AP by Kt að Þ, and, thus, an
increase in the proportion of breeders who adopted AP
by the interval At; Atþ1
� . Breeders who were using CP
at time t decided to start using AP at time t þ 1 as a
At+1
RAP −(CAP +(Kt (1−α))
Xt+1AP Xt+1
CP
π t+1AP
0 1
π
At
XtAP Xt
CP
RAP − (CAP +Kt )
πCP
π tAP
δδ
α
RCP −CCP
Fig. 3 Breeder’s decisions
to adopt AP or keep using
CP
123
148 Page 8 of 15 Euphytica (2018) 214:148
result of the improvement in AP technology. At time
t þ 1, breeder welfare is given by the area below the
pCPt curve plus the green and red dashed areas in
Fig. 3, indicating an increase in breeder welfare by the
dashed red area as a result of technology improvement
að Þ.In addition to decreasing any sunk cost, technology
improvement, a, may increase the genetic gain (DG)from selection, which in turn improves the return, RAP,
from the adoption of AP. The result is an upward
parallel shift in the profit curve of AP in Fig. 3, and in
an increase in the adoption of AP.
It is clear that the subsequent rate of improvement is
an important determinant in advancing the adoption of
AP by plant breeders. Progress in developing inter-
disciplinary technologies that empowers AP is moving
forward rapidly. Tremendous investments in phe-
nomic projects—Awada et al. (2017) reported that
more than 33 plant phenotyping facilities were devel-
oped and seven networks were established around the
world—are underway to develop standards and
ontologies for trait measurement and to facilitate the
integration of the large volume of phenotypic data
with other big data relevant to plant breeding.
An important parameter in the model is breeder
aversion, d, to AP. Notice that, the parameter d is the
slope of the AP profit function, and represents the rate
of AP adoption associated with the differentiating
attribute A. For simplicity and without loss of
generality, we initially assumed that d is constant
across all breeders over time. However, as a result of
technological change and increase in the information
available on AP, dmay have variable values over time,
which in turn may result in a non-linear adoption of
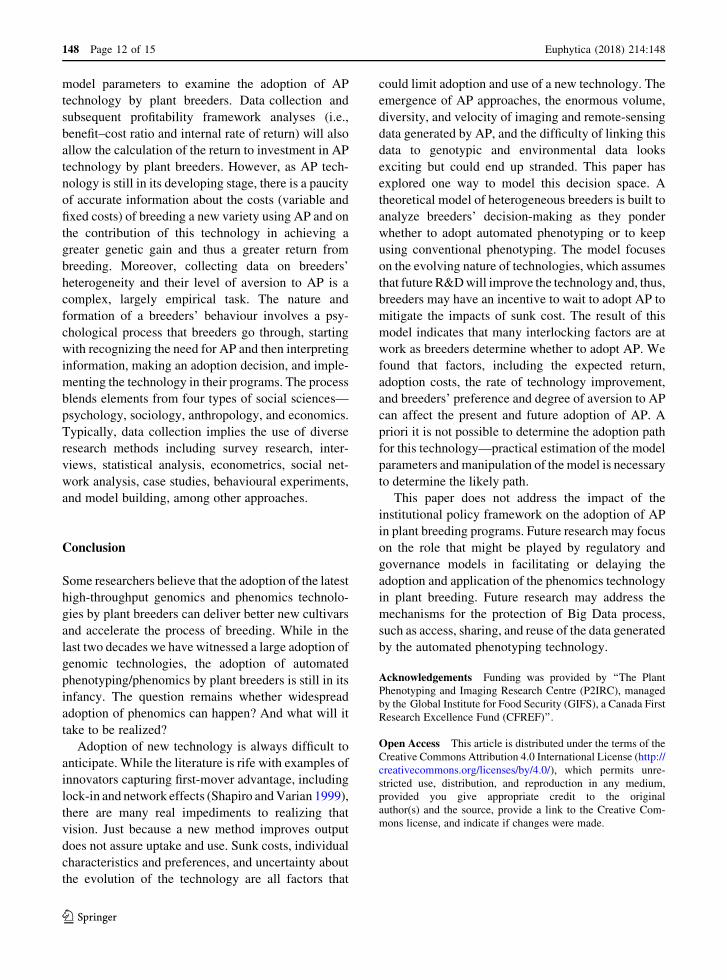
AP. Figure 4 shows the impact of a change in the value
of the parameter d. Lower d, ceteris paribus, leads to adecrease in the cost, dA, for all breeders (see Eq. 1)
and, thus, higher AP adoption, xAPt , (see Eq. 5). In
Fig. 4, the decrease in d causes the AP profit curve to
rotate counter-clockwise from pAPt to pAP0
t , resulting in
an increase in the adoption of AP by the segment
At; A0t
� . Breeders’ welfare increases by the blue dotted
area in Fig. 4.
The impact of different levels of breeder aversion
on the expected return and the adoption
of a technology
This section provides a numerical example to describe
how the rate of aversion, d, may affect breeder’s
decision-making to adopt a new technology. We focus
on the sensitivity of the expected return perceived by
heterogeneous breeders having different levels of
aversion toward the adoption of a technology (e.g., AP
technology). Breeders characterized with high rate of
aversion d seems to perceive the value of future returns
less valuable than the return perceived by breeders
At'0 1
π
At
RAP − (CAP +Kt )
πCP
π tAP
δRCP −CCP
π tAP '
δ '
Welfare gain
Fig. 4 Impact of a decrease
in breeder aversion on the
adoption of AP
123
Euphytica (2018) 214:148 Page 9 of 15 148
with low d. Basically, breeders adjust the discount rateon the future returns by d to reflect the risk they
perceive by adoption the new technology. The higher
the risk they perceive, the higher is d, and thus, the
lower is the future return from the adoption of a
technology.
In this example, we use wheat crop data in
Saskatchewan, Canada. Because wheat is a self-
pollinating non-hybrid crop, farmers can save har-
vested seeds without significant yield deterioration.
This reduces the ability to repeatedly capture a return
of the value created with the release of a new variety
and discourages private investments in wheat breed-
ing, the result is a high concentration of Canada’s
wheat breeding in public-funded programs, and an
economic return that is mostly captured by farmers.
As previously indicated in Eq. (5), for the AP to
have a positive adoption the following conditions must
hold: RAP [ RCP � CCPð Þ þ CAP þ Ktð Þð Þ: In this
example, RAP is assumed to be equal to the return
from the introduction of a new wheat variety when the
percentage of genetic gain, DG; in trait is affecting
yield (i.e., RAP ¼ YES DGiyWiy
� and
1þ DGiy
100
�DGiqWiq
� �¼ 0 (see Eq. (3)).
Taking into account the rate of aversion,d; the
present value of the social returns (PVR) from the
release of a new cultivar can be estimated as:
PVR ¼X Rt 1þ gð Þ
1þ r þ dð Þ½ �t
¼X YES DGiyWiy
� 1þ gð Þ
1þ r þ dð Þ½ �tfor t ¼ 1. . .n
ð10Þ
where Rt ¼ YES DGiyWiy
� is the annual social return
from releasing a new wheat variety, calculated based
on an average target growing area sowing to wheat in
Saskatchewan, E, of 5.3 million ha with mean yields,
Y , of 2.34 t/ha in the years 2001–2017; a new variety is
assumed to have a genetic gain in yield/yield advan-
tage, DG, of 2%; and wheat price,W , is $226/t
(Statistics Canada, CANSIM Tables: 001-0010; 002-
0043). The rate of adoption of a new wheat variety, S,
is derived from Covey (2012). In Covey (2012), a
prediction model was built to derive the adoption
pattern of wheat varieties in Western Canada, which
depends on the yield advantage, available varieties,
maturity, resistance to sawfly, rust, lodging, clearfield,
midge and loose smut, and the number of years since
release. Based on this study, a wheat variety reaches its
maximum adoption of 10.57% of wheat area in
Western Canada in the thirteenth year after its release.
The term g in Eq. (10) is the expected growth rate, a
normal random variable with mean 2 and 1% standard
deviation (g ¼ lþ rz). The growth rate reflects the
expected fluctuation in the price over the covered
period. The term r is the real discount rate and is equal
to 5%; d is the rate of breeder aversion; (r þ d)represents the risk-adjusted discount rate which
reflects the relationship between risk and return; and
t is the adoption period, representing the total life of
the new variety after its release, assumed to be equal to
forty-five years.
Estimation of total return
Using Eq. (10), the estimated annual returns for the
base run d � 0ð Þ from the release of a new wheat
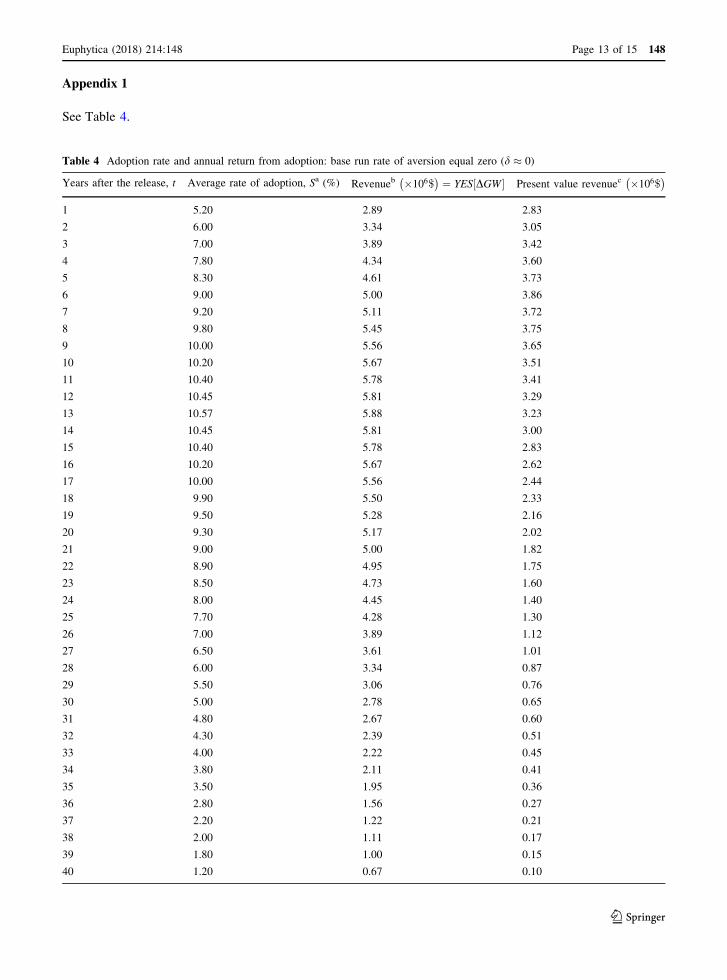
variety are presented in Table 4 in Appendix 1.
Table 4 shows that the return rises to a maximum of
$5.9 million in year thirteen before declining as the
variety is overtaken by newer and more competitive
varieties and gradually replaced. Total returns are
equal to $161.2 million, and total present value of the
returns (PVR) is $78.2 million at 5% discount rate.
Since plant-breeding programs are highly charac-
terized with uncertainty, a Monte Carlo simulation
(MCS) analysis is used to account for the variability in
the related variables, and to produce a distribution of
possible return values. Using MCS with 2000 runs, the
key statistics on the estimated returns based upon the
probability distributions of the related variables, are
summarized in Table 3. Results of the base run are
presented in Table 3, column 1, and the distribution
and frequency of the base run PVR are graphed in
Fig. 5a, b, respectively. The mean of PVR for the base
run is found equal to $78 million with a standard
deviation of $0.57 million. The mean of the Monte
Carlo simulations is found close to the analytical
result.
Columns 2–6 in Table 3 present the sensitivity of
the expected PVR results to different values of the
breeders’ aversion rates. Compared to the base run,
when breeders’ aversion, d, is equal to 2%, the mean of
the PVR decreases by 21%, and when d ¼ 50%, the
return decreases by 69%, indicating the high sensitiv-
ity of the results to the rate of aversion.
123
148 Page 10 of 15 Euphytica (2018) 214:148
Table 3 shows that the expected return from the
adoption of a new technology to improve wheat
varieties decreases when d increases, indicating that
breeders with higher d, tend to discount the return at
higher rate, and thus, to perceive lower return, which
in turn may negatively influence their adoption of the
technology.
The above framework can be applied to analyze the
impact of breeders’ aversion on the expected return
generated from the introduction of any new crop
variety. However, in the case of genetically modified
and hybridized crops, which are heavily concentrated
in the private sector, the emphasis would be mostley
on the economic returns to the seed breeding compa-
nies. In this case, the return would be determined
based on the market size and structure and on the
public sector policies within the geography area under
study.5
Future research
Clearly the next step is to operationalize the theoret-
ical model by collecting specific data on each of the
Table 3 Sensitivity analysis a Monte Carlo simulation: the impact of different values of breeders’ aversion rate (d) on the present
value of the returns (PVR)
Rate of breeder aversion (%)
Base run
d � 0 d ¼ 2 d ¼ 5 d ¼ 10 d ¼ 15 d ¼ 50
Mean PVR �106$� �
78.01 61.51 45.65 30.23 22.10 6.77
Standard deviation �106$� �
.57 .68 .77 .81 .81 .52
Minimum �106$� �
76.00 59.16 42.16 27.29 19.50 4.57
Maximum �106$� �
79.90 64.04 48.20 33.13 24.60 8.51
Upper limit at 95% confidence level �106$� �
78.04 61.54 45.68 30.27 22.13 6.80
Lower limit at 95% confidence level �106$� �
77.98 61.48 45.61 30.19 22.06 6.75
Monte Carlo Simulation is based on 2000 runs. Returns calculation is based an average target growing area, E, of 5.3 million ha with
mean yields, Y , of 2.34 t/ha (2001-17); new variety has a genetic gain in yield/yield advantage, DG, of 2%; wheat price,W , is $226/t
(Statistics Canada, CANSIM Tables: 001-0010; 002-0043); discount rate is equal to r = 5% per annum; expected growth rate, g; hasmean 2% and 1% standard deviation (i:e:; g ¼ lþ rz); and rates of adoption of new wheat variety in Western Canada are obtained
from Covey (2012)
Fig. 5 Base run result of the present value of the returns (PVR)
5 Hybridized crops are characterized by their ability to exhibit
heterosis – the ability of offspring to outperform their parents
with respect to different characteristics and agronomical
important traits. Heterosis effects disappear after the cultivation
of the first generation (F1), which compels farmers to purchase
new seeds every year, and makes it profitable for private seed
company to invest in breeding hybrid crops. In the case of
genetically modified crops patents prevent farmers from saving
their seed and secure monopoly profits to the seed companies.
123
Euphytica (2018) 214:148 Page 11 of 15 148
model parameters to examine the adoption of AP
technology by plant breeders. Data collection and
subsequent profitability framework analyses (i.e.,
benefit–cost ratio and internal rate of return) will also
allow the calculation of the return to investment in AP
technology by plant breeders. However, as AP tech-
nology is still in its developing stage, there is a paucity
of accurate information about the costs (variable and
fixed costs) of breeding a new variety using AP and on
the contribution of this technology in achieving a
greater genetic gain and thus a greater return from
breeding. Moreover, collecting data on breeders’
heterogeneity and their level of aversion to AP is a
complex, largely empirical task. The nature and
formation of a breeders’ behaviour involves a psy-
chological process that breeders go through, starting
with recognizing the need for AP and then interpreting
information, making an adoption decision, and imple-
menting the technology in their programs. The process
blends elements from four types of social sciences—
psychology, sociology, anthropology, and economics.
Typically, data collection implies the use of diverse
research methods including survey research, inter-
views, statistical analysis, econometrics, social net-
work analysis, case studies, behavioural experiments,
and model building, among other approaches.
Conclusion
Some researchers believe that the adoption of the latest
high-throughput genomics and phenomics technolo-
gies by plant breeders can deliver better new cultivars
and accelerate the process of breeding. While in the
last two decades we have witnessed a large adoption of
genomic technologies, the adoption of automated
phenotyping/phenomics by plant breeders is still in its
infancy. The question remains whether widespread
adoption of phenomics can happen? And what will it
take to be realized?
Adoption of new technology is always difficult to
anticipate. While the literature is rife with examples of
innovators capturing first-mover advantage, including
lock-in and network effects (Shapiro andVarian 1999),
there are many real impediments to realizing that
vision. Just because a new method improves output
does not assure uptake and use. Sunk costs, individual
characteristics and preferences, and uncertainty about
the evolution of the technology are all factors that
could limit adoption and use of a new technology. The
emergence of AP approaches, the enormous volume,
diversity, and velocity of imaging and remote-sensing
data generated by AP, and the difficulty of linking this
data to genotypic and environmental data looks
exciting but could end up stranded. This paper has
explored one way to model this decision space. A
theoretical model of heterogeneous breeders is built to
analyze breeders’ decision-making as they ponder
whether to adopt automated phenotyping or to keep
using conventional phenotyping. The model focuses
on the evolving nature of technologies, which assumes
that future R&Dwill improve the technology and, thus,
breeders may have an incentive to wait to adopt AP to
mitigate the impacts of sunk cost. The result of this
model indicates that many interlocking factors are at
work as breeders determine whether to adopt AP. We
found that factors, including the expected return,
adoption costs, the rate of technology improvement,
and breeders’ preference and degree of aversion to AP
can affect the present and future adoption of AP. A
priori it is not possible to determine the adoption path
for this technology—practical estimation of the model
parameters and manipulation of the model is necessary
to determine the likely path.
This paper does not address the impact of the
institutional policy framework on the adoption of AP
in plant breeding programs. Future research may focus
on the role that might be played by regulatory and
governance models in facilitating or delaying the
adoption and application of the phenomics technology
in plant breeding. Future research may address the
mechanisms for the protection of Big Data process,
such as access, sharing, and reuse of the data generated
by the automated phenotyping technology.
Acknowledgements Funding was provided by ‘‘The Plant
Phenotyping and Imaging Research Centre (P2IRC), managed
by the Global Institute for Food Security (GIFS), a Canada First
Research Excellence Fund (CFREF)’’.
Open Access This article is distributed under the terms of the
Creative Commons Attribution 4.0 International License (http://
creativecommons.org/licenses/by/4.0/), which permits unre-
stricted use, distribution, and reproduction in any medium,
provided you give appropriate credit to the original
author(s) and the source, provide a link to the Creative Com-
mons license, and indicate if changes were made.
123
148 Page 12 of 15 Euphytica (2018) 214:148
Appendix 1
See Table 4.
Table 4 Adoption rate and annual return from adoption: base run rate of aversion equal zero (d � 0)
Years after the release, t Average rate of adoption, Sa (%) Revenueb �106$� �
¼ YES DGW½ � Present value revenuec �106$� �
1 5.20 2.89 2.83
2 6.00 3.34 3.05
3 7.00 3.89 3.42
4 7.80 4.34 3.60
5 8.30 4.61 3.73
6 9.00 5.00 3.86
7 9.20 5.11 3.72
8 9.80 5.45 3.75
9 10.00 5.56 3.65
10 10.20 5.67 3.51
11 10.40 5.78 3.41
12 10.45 5.81 3.29
13 10.57 5.88 3.23
14 10.45 5.81 3.00
15 10.40 5.78 2.83
16 10.20 5.67 2.62
17 10.00 5.56 2.44
18 9.90 5.50 2.33
19 9.50 5.28 2.16
20 9.30 5.17 2.02
21 9.00 5.00 1.82
22 8.90 4.95 1.75
23 8.50 4.73 1.60
24 8.00 4.45 1.40
25 7.70 4.28 1.30
26 7.00 3.89 1.12
27 6.50 3.61 1.01
28 6.00 3.34 0.87
29 5.50 3.06 0.76
30 5.00 2.78 0.65
31 4.80 2.67 0.60
32 4.30 2.39 0.51
33 4.00 2.22 0.45
34 3.80 2.11 0.41
35 3.50 1.95 0.36
36 2.80 1.56 0.27
37 2.20 1.22 0.21
38 2.00 1.11 0.17
39 1.80 1.00 0.15
40 1.20 0.67 0.10
123
Euphytica (2018) 214:148 Page 13 of 15 148
References
Acquaah G (2012) Principles of plant genetics and breeding, 2nd
edn. Wiley-Blackwell, Oxford
Alston JM, Marra MC, Pardey PG, Wyatt TJ (2000) A meta
analysis of rates of return to agricultural R&D: ex pede
herculem? IFPRI Research Report No 557, Washington,
DC
Alston JM, Andersen MA, James JS, Pardey PG (2010) Per-
sistence pays: U.S. agricultural productivity growth and the
benefits from public R&D spending. Springer, New York
Araus JL, Cairns JE (2014) Field high–throughput phenotyping:
the new crop breeding frontier. Trends Plant Sci
19(1):52–61
Australian Government, GRDC (2017) The application of pre-
cision phenotyping technologies to a wheat breeding pro-
gram. https://grdc.com.au/Research-and-Development/
GRDC-Update-Papers/2017/02/The-application-of-
precision-phenotyping-technologies-to-a-wheat-breeding-
program. Accessed 5 Feb 2018
Awada L, Yiannaka A (2012) Consumer perceptions and the
effects of country of origin labeling on purchased decisions
and welfare. Food Policy 37(1):21–30
Awada L, Smyth S, Phillips P (2017) Phenotyping and the future
of plant breeding. In: Paper presented at the international
consortium on applied bioeconomy research, XXI confer-
ence, University of Califonia, BerkelyMay 30 June 2, 2017
Bassi, FM, Bentley AR, Charmet G, Ortiz R, Crossa J (2016)
Breeding schemes for the implementation of genomic
selection in wheat (Triticum spp.) Plant Sci 242: 23–36.
http://www.sciencedirect.com/science/article/pii/
S0168945215300534#!
Benkeblia N (2014) Omics technologies and crop improvement.
CRC Press, Taylor & Francis Group, Boca Raton
Bonnett DG, Rebetzke GJ, Spielmeyer W (2005) Strategies for
efficient implementation of molecular markers in wheat
breeding. Mol Breed 15: 75–85. https://link.springer.com/
content/pdf/10.1007%2Fs11032-004-2734-5.pdf
Brennan JP (1989) An analytical model of a wheat breeding
program. Agric Syst 31(4):349–366
Cobb JN, Declerck G, Greenbrg A, Clark R, McCouch S. (2013)
Next-generation phenotyping: requirements and strategies
for enhancing our understanding of genotype-phenotype
relationships and its relevance to crop improvement. Theor
Appl Genet 126(4): 867–887. https://link.springer.com/
article/10.1007%2Fs00122-013-2066-0
Covey CL (2012) Regional variety trials: reducing information
asymmetries in the Western Canadian CWRS wheat
industry. Master thesis, The Department of Bioresource
Policy, Business and Economics University of Saskatch-
ewan Saskatoon, Canada
Crossa, J, Perez P, Hickey J, Burgueno J, Ornella L, Ceron-
Rojas J, Zhang X et al. Genomic prediction in CIMMYT
maize and wheat breeding programs. Heredity
112(2014):48–60. http://repository.cimmyt.org/xmlui/
handle/10883/3441?locale-attribute=en
Desta ZA, Rodomiro O (2014) Genomic selection: genome-
wide prediction in plant improvement. Trends Plant Sci,
19(9): 592–601. http://www.sciencedirect.com/science/
article/pii/S1360138514001411#!
FAO (2012) World Agriculture Towards 2013/2050. The 2012
Revision
Fulton M, Giannakas K (2004) Inserting GM products into the
food chain: the market and welfare effects of different
labeling and regulatory regimes. Am J Agr Econ 86:42–60
Hunter MC, Smith RG, Schipanski ME, Atwood LW, Morten-
sen DA (2017) Agriculture in 2050: recalibrating targets
for sustainable intensification. Bioscience 67(4):386–391
Hurley TM, Rao X, Pardey PG (2014) Re-examining the
reported rates of return to food and agricultural research
and development. Am J Agri Econ 96(5):1492–1504
Hurley TM, Pardey PG, Rao X, Andrade RS (2016) Returns to
food and agricultural R&D investments worldwide,
1958–2015. InSTePP Brief. International science and
Table 4 continued
Years after the release, t Average rate of adoption, Sa (%) Revenueb �106$� �
¼ YES DGW½ � Present value revenuec �106$� �
41 1.00 0.56 0.08
42 0.80 0.45 0.06
43 0.70 0.39 0.05
44 0.65 0.36 0.04
45 0.60 0.33 0.04
Total �106$� �
161.15 78.22
aSource: Covey (2012)bBased on an average target growing area, E, of 5.3 million ha with mean yields, Y , of 2.34 t/ha (2001–2017); new variety has a
genetic gain in yield/yield advantage, DG, of 2%; wheat price,W , is $226/t; value of 2% yield increase is $4.5/t (Statistics Canada,
CANSIM Tables: 001-0010; 002-0043)cBased on discount rate, r = 5% per annum; d ¼ 0; and expected growth rate, g; with mean 2 and 1% standard deviation
(i:e:; g ¼ lþ rz)
123
148 Page 14 of 15 Euphytica (2018) 214:148
technology practice and policy center, University of Min-
nesota, St. Paul
International Plant Phenotyping Network (2016) A survey about
the status of Plant Phenotyping: Juli 2016. http://www.
plant-phenotyping.org/ippn-survey_2016. Accessed 5 Feb
2018
Kumar J, Pratap A, Kumar S (2015) Phenomics in crop plants:
trends, options and limitations. Springer India, New Delhi
LemnaTec (2018). Available at: http://www.lemnatec.com/
products/ Accessed 5 Feb 2018
Lu HY, Liu XF,Wei SP, Zhang YM (2011) Epistatic association
mapping in homozygous crop cultivars. PLoS ONE 6(3)
http://journals.plos.org/plosone/article?id=10.1371/
journal.pone.0017773
Lusser M, Parisi C, Plan D, Cerezo ER (2017) New plant
breeding techniques State-of-the-art and prospects for
commercial development. JRC European Commission
Technical Report EUR 24760 EN. (European Commission
Joint Research Centre, Rome). http://ftp.jrc.es/EURdoc/
JRC63971.pdf. Accessed 5 Feb 2018
Mahesh S (2016) The state of art of new transgenic techniques in
plant breeding: a review. J Adv Biol Biotechnol 9(4): 1–11
Moose SP, Rita MH (2008) Molecular plant breeding as the
foundation for 21st century crop improvement. Plant
Physiol 147(3):969–977
Nakaya AS, Isobe N (2012) Will genomic selection be a prac-
tical method for plant breeding? Ann Bot 110(6):
1303–1316. https://academic.oup.com/aob/article-lookup/
doi/10.1093/aob/mcs109
Newell S, Marabelli M (2015) Strategic opportunities (and
challenges) of algorithmic decision-making: a call for
action on the long-term societal effects of ‘‘Datification’’.
J Strateg Inf Syst 24(1):3–14
Phenospex (2016) How far are we from the 100$ Phenome?
https://phenospex.com/blog/how-far-are-we-from-the-
100-phenome/. Accessed 5 Feb 2018
Richards R, Greg JR, Watt M, Dolferus R (2010) Breeding for
improved water productivity in temperate cereals: pheno-
typing, quantitative trait loci, markers and the selection
environment. Funct Plant Biol 37:85–97
Shapiro C, Varian HR (1999) Information rules: a strategic
guide to the network economy. Harvard Business School
Press, Boston
Singh BD, Singh AK (2015) Marker-assisted plant breeding:
principles and practices. Springer, New Delhi
Thomas D (2010) Gene-environment-wide association studies:
emerging approaches. Nat Rev Genet 11:259–272
123
Euphytica (2018) 214:148 Page 15 of 15 148