The Aging of America: Implications for Social Security, etc. American Academy of Actuaries Summer Summit Presented by Steve Goss, Chief Actuary & Alice Wade, Deputy Chief Actuary Social Security Administration July 14, 2014
Transcript
The Aging of America: Implications for Social
Security, etc.
American Academy of Actuaries Summer SummitPresented by Steve Goss, Chief Actuary &
Alice Wade, Deputy Chief ActuarySocial Security Administration
July 14, 2014
22
Developed nations are “aging” “Macro Aging”
Shift to older age distribution, becauseLower birth ratesFewer working age per elder
“Micro Aging”People are living longer
Lower death ratesHigher life expectancy
Different Challenges—Different Solutions---Consider the U.S.
3
Macro Aging results from the drop in Birth Rates after 1964—Had Birth rates stayed at 3.0 or 3.3---
Aged Dependency Ratio (Population 65+/20-64) 2012 TR
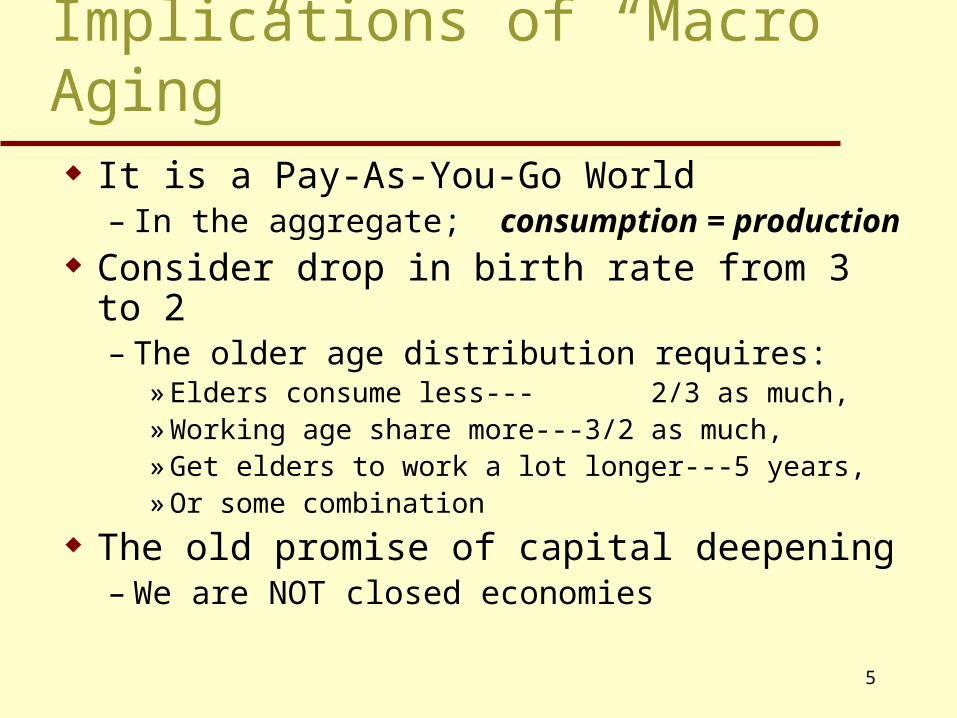
Implications of “Macro Aging” It is a Pay-As-You-Go World
– In the aggregate; consumption = production Consider drop in birth rate from 3 to 2
– The older age distribution requires:» Elders consume less--- 2/3 as much,» Working age share more---3/2 as much,» Get elders to work a lot longer---5 years,» Or some combination
The old promise of capital deepening– We are NOT closed economies
6
Cause of “Micro Aging”Declining death rates
7
Implications of “Micro Aging”Rising Life Expectancy
8
Implications of “Micro Aging” Most people are not saving enough
– Desire/need to “consume now”
Those who are saving do NOT annuitize– We have succeeded too well on accumulation?
» Once accumulated, people won’t give it up
– Annuities are not valued or understood» Fear of getting run over by a truck» Commercial annuities are expensive» Ford and GM now offering lump sum options» Even Social Security delayed retirement does not attract
9
Implications for Social Security
Micro aging”- increased longevity Gradual and manageable effects
“Macro aging”- changing age distribution due to drop in birth rates
Major abrupt shift with no obvious solution
Different challenges: different solutions
10
Potential for 23% Benefit Reduction Will Force ActionNeed to reduce cost 25% or increase revenue 33%
OASDI Annual Cost and Non-Interest Income as Percent of Taxable Payroll
11
“Micro Aging” Solution For the “micro aging” challenge, increase the Social
Security normal retirement age to maintain the ratio of expected retirement duration to potential work years:
LE(NRA) / (NRA – 20) = constant
For pay-as-you-go system, this makes financial status neutral under increasing life expectancy
We estimate this index results in increasing the NRA one month every two years after 2022
Saves18 percent of our long-term financing shortfall Can hold low earners harmless—Simpson/Bowles
12
“Macro Aging” Solutions: Many Choices
Raise Scheduled Revenue• Increase payroll tax rate• Increase taxable maximum• Increase revenue from taxation of benefits• Find other sources of revenue, expand coverage
Lower Scheduled Benefits• Change benefit formula• Reduce benefits for dependents• Reduce cost of living adjustments
Benefit Adequacy• Increase benefits for lower income by establishing a minimum benefit• Increase benefits for widows and widowers, childcare credits, student
benefits, increase benefits for oldest
Solutions: Raise taxable maximum for 90% intended of the early 1980’s. Or Higher like HI
Percent of Covered Earnings that is Taxable: Social Securityand Medicare HI
80
85
90
95
100
1980 1985 1990 1995 2000 2005 2010 2015
Social Security
Medicare HILast time explicitly legislated for
Social Security
14
Solutions Adjust the Benefit Formula: formula shown for those newly eligible in 2014
Can change bend points or formula factors
Call for Action
Decide what the American public wants No action – automatic benefit cuts Enacting Change Relatively Soon
More advance notice Gradual change More options
15
Learn more about the current program & the future financial challenges at: