Purdue University Purdue e-Pubs Computer Science Technical Reports Department of Computer Science 1985 e Analysis of Soſtware Development and Testing Processes: An Empirical Study T. J. Yu Herbert E. Dunsmore Purdue University, [email protected]Report Number: 85-508 is document has been made available through Purdue e-Pubs, a service of the Purdue University Libraries. Please contact [email protected] for additional information. Yu, T. J. and Dunsmore, Herbert E., "e Analysis of Soſtware Development and Testing Processes: An Empirical Study" (1985). Computer Science Technical Reports. Paper 429. hp://docs.lib.purdue.edu/cstech/429
Transcript
Purdue UniversityPurdue e-Pubs
Computer Science Technical Reports Department of Computer Science
1985
The Analysis of Software Development and TestingProcesses: An Empirical StudyT. J. Yu
This document has been made available through Purdue e-Pubs, a service of the Purdue University Libraries. Please contact [email protected] foradditional information.
Yu, T. J. and Dunsmore, Herbert E., "The Analysis of Software Development and Testing Processes: An Empirical Study" (1985).Computer Science Technical Reports. Paper 429.http://docs.lib.purdue.edu/cstech/429
The Analysis of Software Development and Testing Processes:
An Empiricnl Stndy
T.J.Yu
H. E. Dunsmore
Department of Computer SciencesPurdue University
West Lafayette, Indiana 47907
CSD-TR-508Feburary, 1985
ABSTRACT
One of the goals of researchers in software engineering is to
understand the software development process better. The main issues
are how to predict programming effort and control program quality.
In this experiment, we designed three ways to objectively measure the
programmer's ability. From these measures of programmer's ability
and the metrics algorithmically derived from the program, we studied
their relationships with (1) programming effort, (2) testing effort, and
(3) program defects. The data investigated were collected from 44 ver
sions of Pascal programs written by the student subjects. A significant
correlation between testing effort and corrected defects was
discovered in this study. We also fould 20% of tbe final defects were
introduced during the formal testing process. Some suggestions for
further study are provided.
·2·
1. Introduction
After many years of software design experience. we now know that it is very
hard to control the software development process. One of the major problems is that
we cannot predict programming effort accurately. Although there are a lot of
models that have been proposed. none of them really give good enough results!.
Another problem is that we do not know how to control program quality so that a
completed program will have no or a very few defects. Although there is typically a
significant amount of effort allocated to software testing. for most large software
projects there are usually quite a few defects that are not discovered until after the
software is placed into operation2.
In order to understand and control the software development process, we need
to be able to quantify some attributes of the product itself, of the development pro
cess, and of the personnel involved. Generally we classify software metrics into four
categories:
(1) Program metric - This is a measure which can be derived from the program
directly. such as program size (e.g., lines of code), the number of decisions (Le.,
boolean expressions), or tbe number of variables. Generally program metrics
can be determined objectively by using a software counting tool.
(2) Process metric - This is a measure pertaining to the software development pro
cess which is theoretically independent of the product. Examples of such meas·
ures are programming time, testing time, and the degree of use of modern
software development practices.
(3) Programmer metric - This is a measure related to a programmer's experience,
ability, style, etc. It is generally agreed that the programmer is one of the most
important factors involved in tbe software development process. However. it is
1. A good cost estimation model should provide the prediction for 80% of estimates within25% of actuals.2. From a study of four large software products (each product had about ninety thousandslines of code) [rom a large company [Shen85], it was found that these four products had 137,223,91, and 132 defecLS each after being delivered to customers.
-3-
difficult to find a good way to quantify the ability of programmers. Further
more, no one likes to be quantified by a single number. In this study we exam
ined several Metrics which were related to the programmers' experience and
abilities.
(4) Quality metric - Software quality is an elusive concept. It can refer to such
distantly-related items as errors present in the software, the "user friendliness"
of the system, or even its portability and maintainability. In this study. we con
sidered the quality metric as the number of defects remaining in the program
after a certain point. We recognize the importance of other factors of program
quality, but there is no agreement about bow to measure them objectively. We
think it important to investigate this concept using an algorithmic measure.
In recent years a large number of cost and effort estimation model based on
program metrics have been proposed [Hals77, Chapter 29 of Boehm8!, and Curt84].
In addition, several researchers have proposed models that purportedly can be used
to predict the number of occurrences of defects in delivered software modules
[Motl??, Otte?9. Smit82, Shen85]. We hypothesized that all types of metrics were
intercorrelated. and should therefore be analyzed simultaneously. Our analysis
below provides support to this hypothesis.
2. Experimental Design
In order to investigate program quality under different testing strategies, we
conducted a controlled experiment. The experiment can be called a pretest, posttest,
different treatment design [Camp63]. Before the discussion of the experimental
design, we would like to introduce the notation used in representing it:
R : Random assignment of experimental subjects
o : Observation during the experiment
X : eXposure to treatment
- 4-
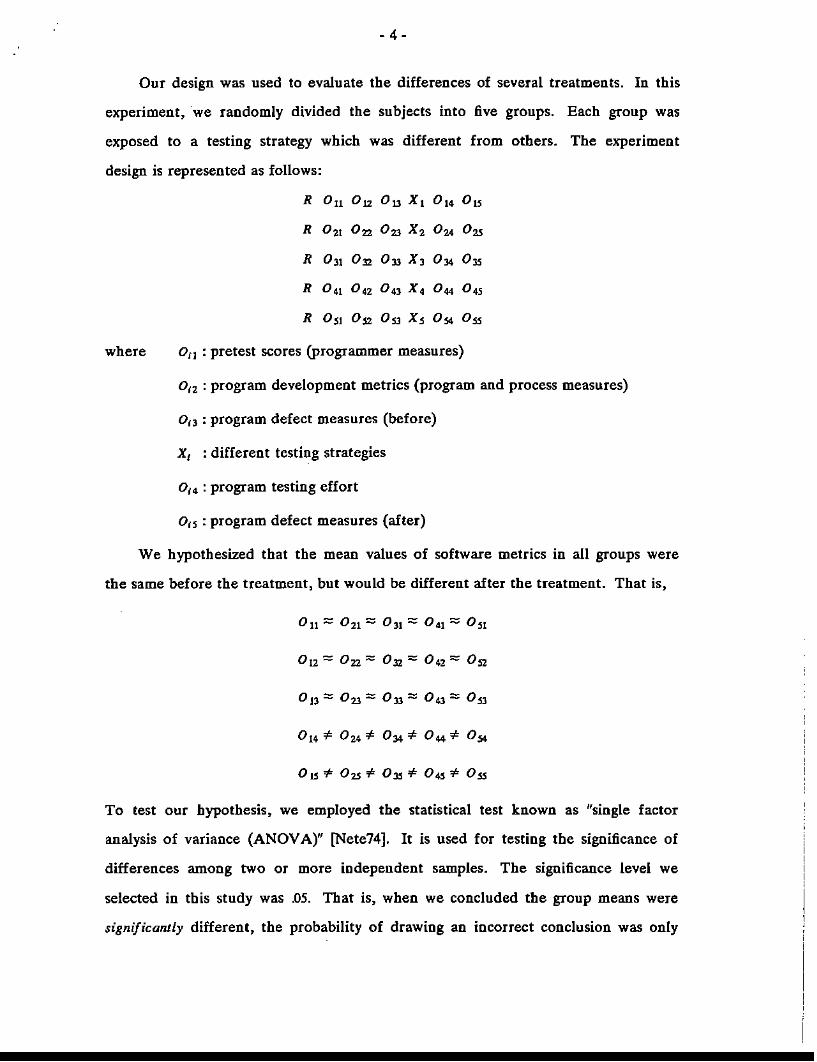
Our design was used to evaluate the differences of several treatments. In this
experiment, we randomly divided the subjects into five groups. Each group was
exposed to a testing strategy which was different from others. The experiment
design is represented as follows:
R On 0 12 0 13 Xl 0" 0"
R 0" 0,. 0 23 X 2 0,. 0"
R 0" 0", 033 X3 0" 0"
R 0" 0 42 04) X 4 0 .. 0"
R 0" 0" 053 X5 0" 0"
where Oil : pretest scores (programmer measures)
°/2 : program development metrics (program and process measures)
Oj3 : program defect measures (before)
X, : different testing strategies
0 14 : program testing effort
0 15 : program defect measures (after)
We hypothesized that the mean values of software metrics in all groups were
the same before the treatment, but would be different after the treatment. That is.
0J3::::: 023::::: 033:::::: Do:::::: OSJ
0 14 '* °24 ,* 034 '* 0 44 '* 0S4
Oel '* 025 '* 03j '* 04S =F 055
To test our hypothesis. we employed the statistical test known as "single factor
analysis of variance (ANDVA)" [Nete74]. It is used for testing the significance of
differences among two or more independent samples. The significance level we
selected in this study was .05. That is. when we concluded the group means were
significantly different. the probability of drawing an incorrect conclusion was only
·5·
.05. Because ANDVA analysis might not be appropriate for some Metrics which are
not normally distributed, we also employed a nonparametric statistical test, known as
the Kruskal-WaiLis rank test [SiegS6]. This was used to test the differences of the
rank among groups. As it turned out, the results of nonparametric analysis gave the
significance levels similar to that of ANOVA. Therefore, we ooly present the results
of ANOYA.
Besides ANOVA, we were also interested in the correlation between pairs of all
the metrics. One of the statistics we used to investigate tbe correlation is the weU
known Pearson correlation coefficient (represented by r). Because the Pearson
correlation coefficient might not be appropriate for some metrics, we also used
another nonparametric statistic known as the Spearman rank correlation coefficient
(represented by s) [Sieg56]. The significance level was also set at .05 for both statis
tics, unless otherwise specified.
3. Sobjects Bnd Empirical Environment
In the summer of 1983, the Department of Computer Science at Purdue Univer
sity offered a course for graduate students and upper-level undergraduates concern
ing software metrics and experimental design. The class was eight weeks long.
There were 44 students who completed the class and served as the subjects for the
experiment reported here. All subjects had taken at least one CS course in advanced
programming, algorithm analysis, or data structures. Their programming ability and
their familiarity with Pascal were tested by a pretest to ensure that all were qualified
to participate in this experiment.
For the purpose of conducting the experiment we set up a run-time system to
maintain a log of their activities. The data entered into the file were subjects' log·in
times, log-out times, and the progressing versions of their programs as they were sub
mitting.
- 6-
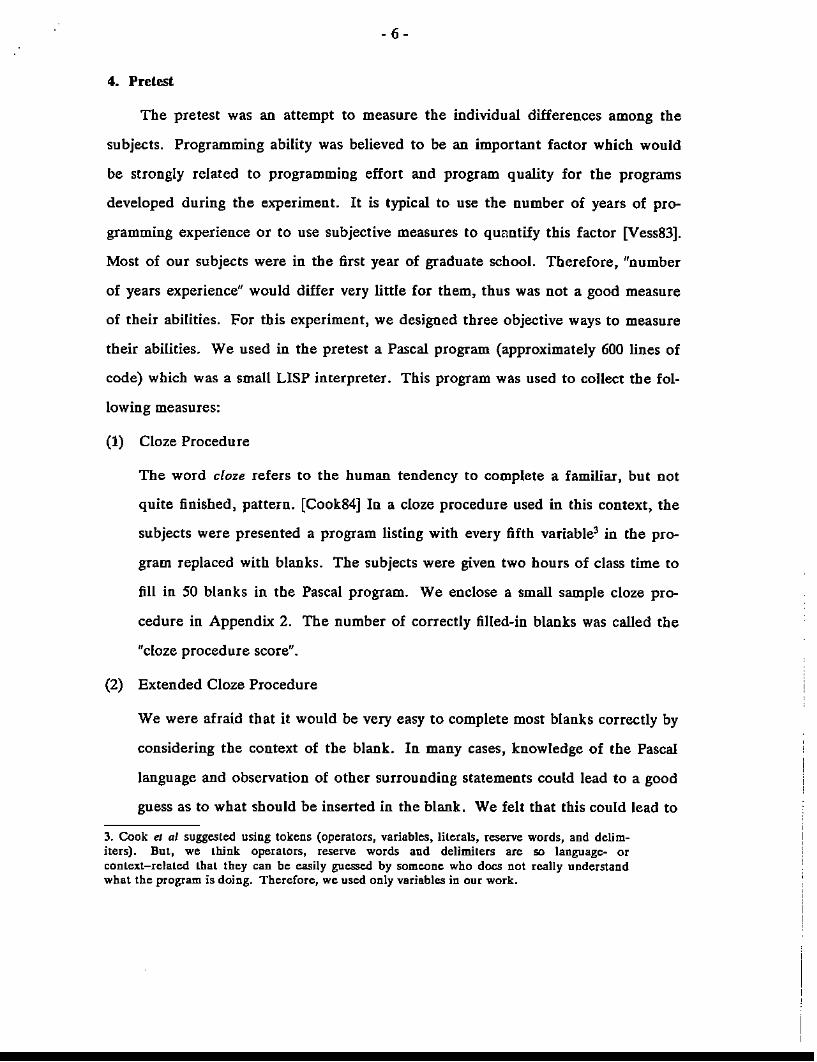
4. Pretest
The pretest was an attempt to measure the individual differences among the
subjects. Programming ability was believed to be an important factor which would
be strongly related to programming effort and program quality for the programs
developed during the experiment. It is typical to use tbe Dumber of years of pro
gramming experience or to use subjective measures to qurmtify this factor [Vess83].
Most of our subjects were in tbe first year of graduate school. Therefore, "number
of years experience" would differ very little for them, thus was not a good measure
of their abilities. For tbis experiment, we designed three objective ways to measure
their abilities. We used in the pretest a Pascal program (approximately 600 lines of
code) which was a small LISP interpreter. This program was used to collect the fol-
lowing measures:
(1) Cloze Procedure
The word doze refers to the human tendency to complete a familiar, but not
quite finished, pattern. [Cook84] In a cloze procedure used in this context. the
subjects were presented a program listing with every fifth variable3 in the pro
gram replaced with blanks. The subjects were given two hours of class time to
fill in 50 blanks in the Pascal program. We enclose a small sample cloze pro
cedure in Appendix 2. The number of correctly filled-in blanks was called the
"cloze procedure score".
(2) Extended Cloze Procedure
We were afraid that it would be very easy to complete most blanks correctly by
considering the context of the blank. In many cases, knowledge of the Pascal
language and observation of other surrounding statements could lead to a good
guess as to what should be inserted in the blank. We felt that this could lead to
3. Cook el al suggested using tokens (operators, variables, lilerals, reserve words, and delimiters). But, we think operators, reserve words and delimiters are so language- orcontext-related that they can be easily guessed by someone who does not really understandwhat the program is doing. Therefore, we used only variables in our work.
- 7-
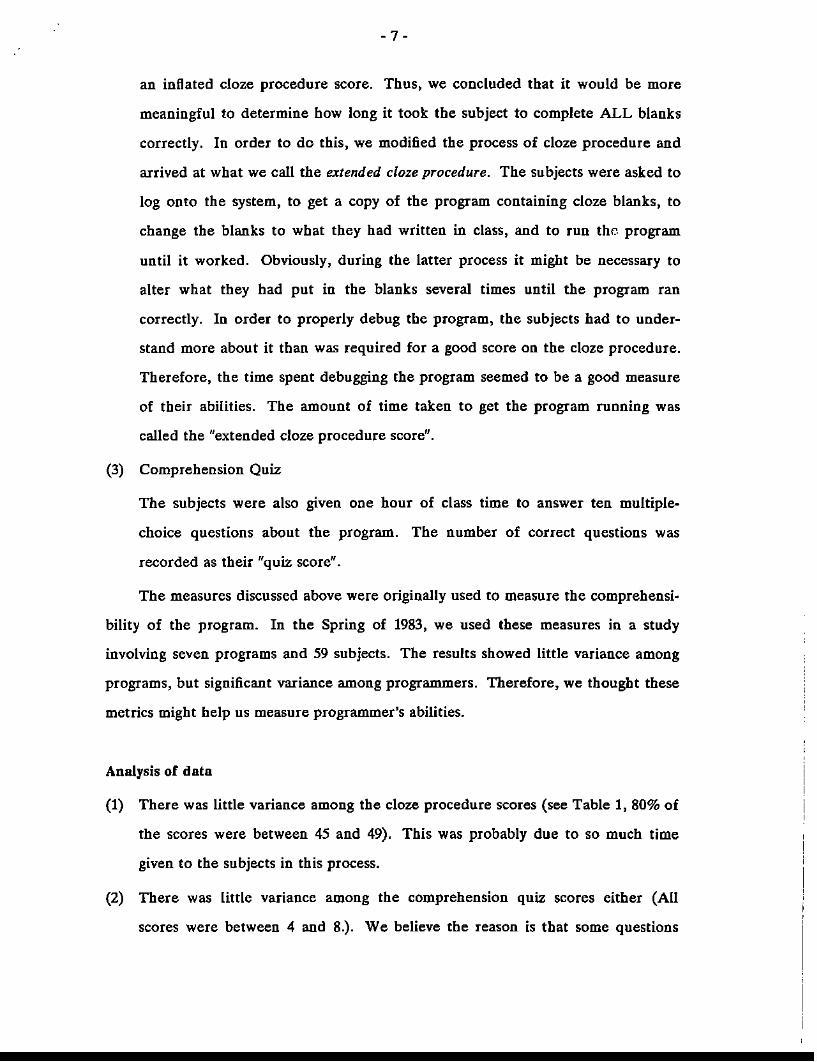
an inflated doze procedure score. Thus, we concluded that it would be more
meaningful to determine how long it took the subject to complete ALL blanks
correctly. In order to do this, we modified the process of doze procedure and
arrived at what we call the extended doze procedure. The subjects were asked to
log onto the system, to get a copy of the program containing doze blanks, to
change the blanks to what tbey had written in class, and to run the program
until it worked. Obviously, during the latter process it might be necessary to
alter what they had put in the blanks several times until the program ran
correctly. In order to properly debug tbe program, the subjects had to under
stand more about it than was required for a good score on tbe doze procedure.
Therefore, the time spent debugging the program seemed to be a good measure
of their abilities. The amount of time taken to get the program running was
called the "extended cloze procedure score".
(3) Comprehension Quiz
The subjects were also given one hour of class time to answer ten multiple
choice questions about the program. The number of correct questions was
recorded as their "quiz score".
The measures discussed above were originally used to measure the comprehensi
bility of the program. In the Spring of 1983, we used these measures in a study
involving seven programs and 59 subjects. The results showed little variance among
programs, but significant variance among programmers. Therefore, we thought these
metrics might help us measure programmer's abilities.
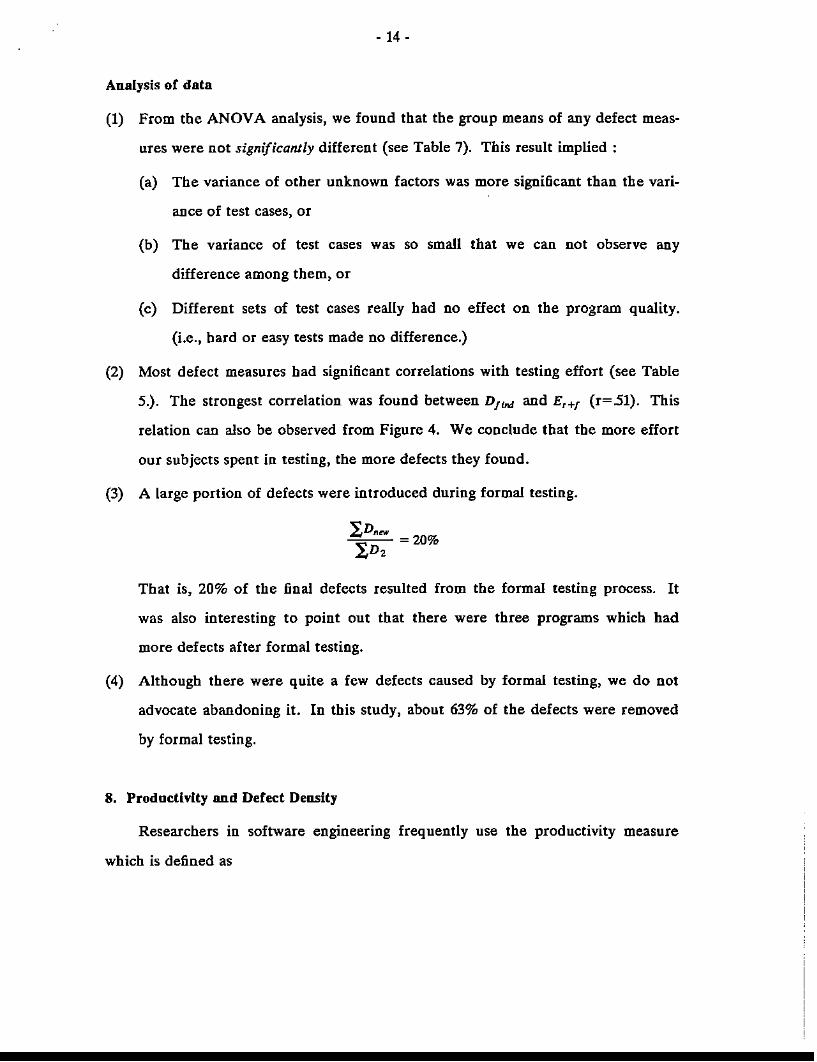
Analysis of data
(1) There was little variance among the cloze procedure scores (see Table I, 80% of
the scores were between 45 and 49). This was probably due to so much time
given to the subjects in this process.
(2) There was little variance among the comprehension quiz scores either (All
scores were between 4 and 8.). We believe the reason is that some questions
- 8-
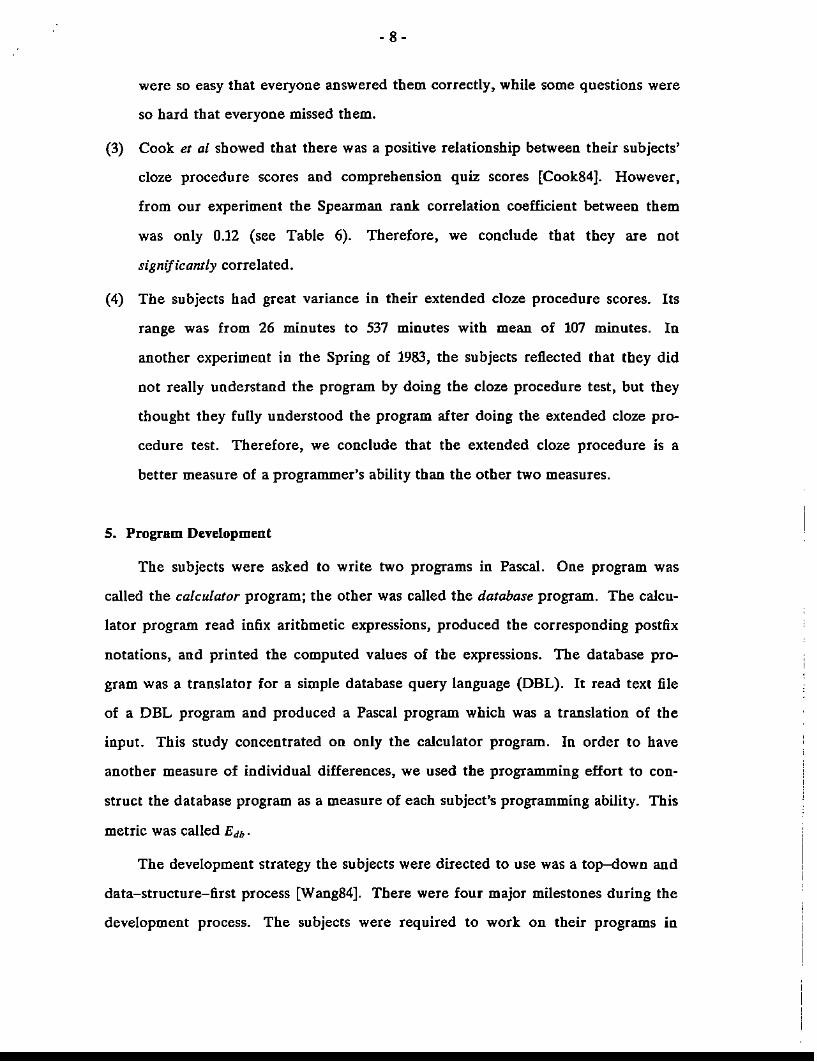
were so easy that everyone answered them correctly, while some questions were
so hard that everyone missed them.
(3) Cook et at showed that there was a positive relationship between their subjects'
doze procedure scores and comprehension quiz scores [Cook84]. However,
from our experiment the Spearman rank correlation coefficient between them
was only 0.12 (see Table 6). Therefore. we conclude that they are not
significantly correlated.
(4) The subjects had great variance in their extended doze procedure scores. Its
range was from 26 minutes to 537 minutes with mean of 107 minutes. In
another experiment in the Spring of 1983, the subjects reflected that they did
not really understand the program by doing the doze procedure test, but they
thought they fully understood the program after doing the extended c10ze pro
cedure test. Therefore, we conclude that the extended c10ze procedure is a
better measure of a programmer's ability than the other two measures.
S. Program Development
The subjects were asked to write two programs in Pascal. One program was
called the calculator program; the other was called the database program. The calcu
lator program read infix arithmetic expressions, produced the corresponding postfix
notations, and printed the computed values of the expressions. The database pro
gram was a translator for a simple database query language (DBL). It read text file
of a DBL program and produced a Pascal program which was a translation of the
input. This study concentrated on only the calculator program.. In order to have
another measure of individual differences, we used the programming effort to con
struct the database program as a measure of each subject's programming ability. This
metric was called Edb.
The development strategy the subjects were directed to use was a top-down and
data-structure-first process [Wang84]. There were four major milestones during the
development process. The subjects were required to work on their programs in
- 9 -
blocks of time from one to fOUf hours. Each block of time was referred to as a work
session. The subjects were asked not to work more tban eight hours a day on the
program to avoid fatigue. After each work session, every subject was interviewed to
produce a session report which indicated how much time be spent in this session.
The development process can be divided into fOUf stages as follows:
(1) Specification
The subjects received a handout which clearly stated the input and output
specifications of the problem. The subjects reported the time they used to study
the handout and related materials.
(2) Design
After the specification phase, tbe subjects started their design. They designed
their global data structures first and then the procedures associated with that
global data structures. They next defined the local variables for each procedure,
but no executable code was written in this phase. This design process was very
similar to that employed by programmers using abstract data types. After
design, programs were submitted to the Pascal counting tool which recorded the
desired Metrics.
(3) Coding
During this phase the actual code was written. After each work session, the
subjects handed in a compilable version of their programs so that we could
record the Metrics as the programs evolved during the development process.
(4) Minimal Acceptance Testing
We gave the subjects six test cases. They used these test cases to detect and
correct errors in their programs.
The effort from (2) to (4) was accurately collected from their session reports and was
recorded as their programming effort (Ep ). The effort involved in constructing com
ment lines was excluded from this metric.
- 10 -
Software Metrics Collected during Programming Development
(1) loc - lines of code. This was a count of the declarative and executable state
ments in the program.. Comments and blank lines were excluded.
(2) v(G) - McCabe's cyclomatic complexity [McCa76]. This was a count of the con
ditional statements, loops, procedures (including the main program), and binary
Boolean operators such as AND and OR.
(3) vars - number of unique variables
The remainder of the program metrics we considered were originally proposed by
Halstead [Hats?7]. They were collectively called Software Science Metrics.
(4) 111 - number of unique operators
(5) 'fJ2. - number of unique operands
(6) N 1 - total number of operators
(7) N 2 - total number of operands
(8) Program Length: N = N 1 + N 2
(9) Estimated Length: N = TI110gZTJl + TJzlogzTJz
(10) Volume: V = N xlo~( Til + Tlz)
(11) Difficulty: D
(12) Software Science Effort: E = D xv. We divided this number by 18x3600 so that
it had the unit of "hoursl/.
Analysis of data
(1) lac, N. and Volume were highly4 correlated with each other (see Table 3). We
expected this, because all three are measures of program size. We also found
that v(O) was highly correlated with these three size measures. Because Pascal
4. When we say two metrics are highly correlated, we mean their R2 is larger then .sO, whereRZ is the coefficient of muhiple determination. This implies that more than 50% of the totalvariance of one metric can be explained by the other.
- 11 -
was designed to be a structured language and programmers were trained to
write structured programs~. we concluded that: /Iv (G) for a highly structured
program bas a strong size component."
(2) Unique operands ('TI2) and unique variables (vars) were highly correlated (r=.79).
Although they seemed to be good measures of the complexity of data structures,
they were correlated witb neither programming effort nor program defects.
(3) Difficulty (D) and Software Science Effort (E) were highly correlated with pro-
gram size. But, neither one of them was related to either programming effort or
program defects.
(4) N was not correlated with N (let alone equal to N). However. we found N was
highly correlated with 'TJ2 (r = 0.96). It appeared that for these Pascal programs
the number of operators TIL reaches a near-maximum level of about 60. Thus, N
became simply a linear function of Tl2.
(5) Edb • the programming effort of the database program, was highly correlated
with the programming effort (Ep ) of this calculator program (r = .68). From
Figure 1, it showed a strong relation between Ep and Edb • We conclude that
there is a tendency for some programmers to be faster than others regardless of
the program involved.
(6) No program metrics were better correlated with Ep than loc. Although the
correlation between Ep and loc was significant (r = 39), from Figure 2 we
thought it was not good to use loc alone to estimate programming effort. We
also used multiple linear regression to find the multiple relation between Ep and
other program metrics. Because most program metrics were size related, there
was no combination of others that did significantly better than loc alone.
(7) Because the distrioution of the programmer metrics was not a normal distribu-
tion, we thought it would be better to use the nonparametric Spearman rank
5. Students in the department of computer science at Purdue University are not allowed to usethe goto statement in their Pascal programs.
- 12-
test to find their correlations with other metrics. We found that extended doze
score and programming effort were significantly correlated at a level equal to
0.1 (5=28). No other programmer Metrics had better performance than the
extended doze procedure. From Figure 3, we could see a weak relation
between these two metrics. The relation was very weak. because we believe that
programming effort involves many other important factors which are Dot related
to the programmer's ability.
6. Formal Testing
In order to test the variability of program quality under different testing stra
tegies, we designed five separate sets of test data. Each set contained the same
number of cases (10), but a varying number of unique tests. The easiest set of test
data contained two unique tests, but had multiple copies of each test. The hardest
set of test data contained ten unique tests. The other sets of test data contained
four, six, and eight unique tests. The information collected in this phase was
(1) E,: effort for running these test cases
(2) Ef : effort for fixing the errors.
(3) E'+/: total testing effort = E, + £1
Analysis of data
We used ANOVA to investigate the variance among groups. The results appear
in Table 7. As we expected, there was no variance among the groups before formal
testing in terms of any metrics. (That was because, up to that point, they had all
been given exactly the same task). We did expect to see significant variability of test
ing effort (E, or EI ) among tbe different groups. However, such a result did not
occur. We will discuss later why we think this happened.
- 13-
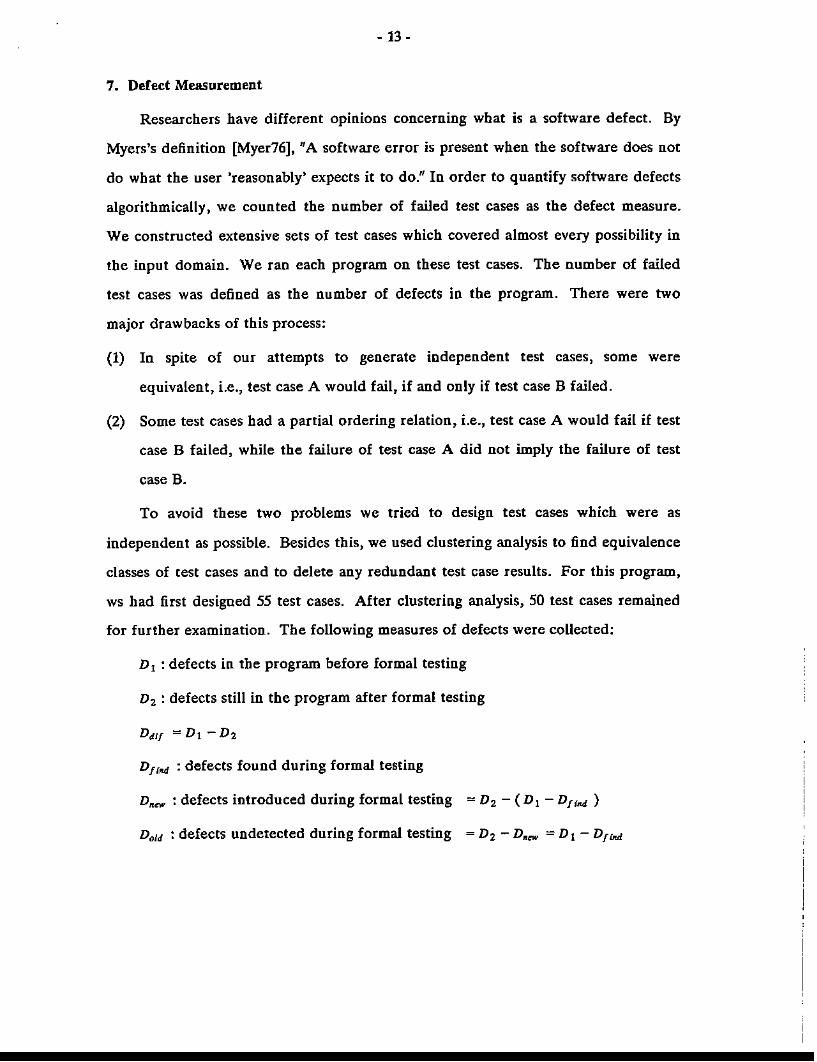
7. Defect Measurement
Researchers have different opinions concerning what is a software defect. By
Myers's definition [Myer76], "A software error is present when the software does not
do what the user 'reasonably' expects it to do." In order to quantify software defects
algorithmically. we counted the number of failed test cases as the defect measure.
We constructed extensive sets of test cases which covered almost every possibility in
tbe input domain. We ran each program on these test cases. The number of failed
test cases was defined as the number of defects in the program. There were two
major drawbacks of this process:
(1) In spite of our attempts to generate independent test cases, some were
equivalent, Le., test case A would fail, if and only if test case B failed.
(2) Some test cases had a partial ordering relation, i.e., test case A would fail if test
case B failed, while the failure of test case A did not imply the failure of test
case B.
To avoid these two problems we tried to design test cases which were as
independent as possible. Besides this. we used clustering analysis to find equivalence
classes of test cases and to delete any redundant test case results. For this program,
ws had first designed 55 test cases. After clustering analysis. 50 test cases remained
for further examination. The following measures of defects were collected:
D 1 : defects in the program before formal testing
D2 : defects still in the program after formal testing
Test Cases 2 4 6 8 10 F (4,39)' "Number(44) 7 8 9 9 11
Cloze 45.7 46.1 40.1 44.8 455 0.96
Extend(min) 72.14 141.9 118.6 120.7 8327 1.05
Quiz 6.14 6 622 6.11 654 0.39
loc 405 503 501 467 436 1.65
N 1642 2257 2103 2043 1873 1.47
,(G) 108 137 134 135 125 0.97
"'" 55 59 74 66 63 1.89
", 72 70 71 70 71 0.19
", 96 106 121 116 110 3.09 < .05
Ep (he) 25.49 2923 30.72 23.89 2556 0.98
Et (min) 1229 1338 1856 28.67 1827 1.66
E/ (min) 10 10.63 26.67 23.11 25.12 124
D, 5.14 725 5.67 7.78 7.64 0.879
V, 2.71 350 2.33 3.11 3.73 0532
Ddl/ 2.43 3.75 3.33 4.67 3.91 0502
Vf ". 257 438 3.33 5.67 5.00 1.851
V_ .14 .63 .00 1.00 1.09 1.347
V.u 257 2.88 2.33 2.11 2.64 0.196
1. F (4,39) is F sialisdc of degree of freedom 4 and 311.
RANGE OF X AXIS; 8 5SRANGE OF Y AXIS: 8 SS
•
•
••
•
E • .'P ••
I •• • •
C ••A •L • • ••• •C ••
• • ••• • •'. •
• ••r·•
Ep - DBL
Flgnre 1. Relation of Programming Effort
RANGE OF X AXIS: 267 784RANGE OF Y AXIS: 15.92 54.32
•
prograrr
Effort
••
..•
••
••• • •• •• I• • •••
• • • •• • •
• • •• • •• •• • ••
Program Size (lac)
Figure 2. Programming Effort vs. Program Size
•
RANGE OF X AXIS: 0 220RANGE OF Y AXIS: 10 60
•
•
pr0g •r •am •mi •0 ••g •
• •E • •f ••f •• •0 •• • • •r •t •• • •
•• •• • •
• •• •• • • •
Extended Cloze Procedure
FIgure 3. Programming Effort vs. Extended Cloze Procedure
RANGE OF X AXIS: 5 152RANGE OF Y AXIS: 0 11
,
,
, .,
,
,
D • • • • •efee , • 2' , , • ,t
- , •
•• 2' •
•
2
2
. .., ., .
Testing Effort
FIgure 4. Corrected Defect vs. Testing Effort
RANGE OF X AXIS: 267 784RANGE OF Y AXIS: 8.16 33.91
•
•
••
productiviIY
•
••
••••
•••
•• •
•• •• • •
• •• M
• I • •• I
• • • •
••
•
Lines of Code
Flgore 5. Produclivity (Joe Ihr) ...s. Lines of Codes
.
RANGE OF X AXIS: 267 784RANGE OF Y AXIS; .18 536
D0e
feet
D •0 • 0
e0
n •, •it •o.y 0
• •0 • -0
'2 •0 •
• •0 ..
• • •0 • •
• ••
• • 0 •
Lines of Code
Figure 6. Defect Density (D 1' 100 Joe) vs. Lines of Code
Appendb. 1: a. valne or corresponding statlstk
degree of freedom"" 0·2 := 40
r or s .202 257 .304 357 393
Student-t 1.303 1.684 2.021 2.423 2.704
a 2 .1 .os .02 .01
a. value of correlation coefficient (two tailed test)
If n > 30, Pearson correlation coefficient and Spearman rank correlation coefficient have thesame significance level.
degree of freedom : n 1 = 4 • n2 = 40
F 2.61 3.83
a .os .01
a. value of F Statistic
Appendix 2: A sample of the cloze procedure
(********************************************)(* cloze format is { J *)(********************************************)
procedure readlist (var current,parent:lptr: var flag:boolean):
varc:char:i :integer:
(* used to read in all characters of a list *)(* index used to read in the atoms *)
begin (* readlist *)repeat
readecho({ __~~~}):until c in [ a •• z ,left,right, 0 •• 9 ]:if c in [ a ~.-z ; 0 •• 9 ) then-begin
-("* read in-the atom *){ }:~false,
new( curren t) :ans(current,{ }):i:=l:current~.car[i]:={ }:readecho(c):while c in [ a •• z , 0 •• 9 ] do begin
i:={ -- }+l;current-.car[i):=c:{ }( c)end: (* while *)
if c = right thencurrent-.{ }:=true
elsereadlist(current-.ptr2,current, { })
end (* character *)else if c = left then begin
(* open a new sublist data structure *)new(current):{ }(current,tenblank):flag: true:readlist({ }-.ptrl,current,flag):readlist({.~~~===}-.Ptr2,current,flag)end (* left *)