Landcare Research LINK Seminar 25 August 2015 2015 International Year of the Soil Where has all the carbon gone? The answer lies in the soil….. David Whitehead Louis Schipper Miko Kirschbaum
Transcript
Landcare Research LINK Seminar 25 August 2015
2015 International Year of the Soil
Where has all the carbon gone?
The answer lies in the soil…..
David Whitehead Louis Schipper Miko Kirschbaum
Global carbon storage
23% atmosphere 15% vegetation 62% soil to 1 m
• Carbon input to soil is regulated by plants • Carbon retention is regulated by physical and microbial processes • Carbon is stored in a range of organic materials with turnover
rates from days to centuries • Disturbance can cause rapid losses and recovery is often slow
Soil carbon is essential for maintaining the productive potential of our primary industries
• soil physical structure and stability • water retention • nutrient cycling • buffering and filtering
Retaining and increasing soil carbon provides opportunity to offset our greenhouse gas emissions. Research is needed to inform our international negotiations
Identify land management practices to maintain soil carbon stocks and, if possible, achieve stable, increased stocks
• Top soil carbon stocks can be high
Average for NZ’s grassland soils is 100 t C/ha to a depth of 0.3 m
• Deeper in soils, carbon stocks can be much lower but have higher potential to store carbon
• Carbon stability (longevity) in soils is not well understood
• Between 1990 and 2013 increases in NZ’s methane (8%) and soil nitrous oxide emissions (23%) are equivalent to 1 Mt C
• This could be offset with an increase in soil carbon of 1 t C/ha over 1 Mha or 0.1 t C/ha over NZ’s approx. 10 Mha grassland estate ie. 0.1% increase
• Increasing soil carbon stocks commits nitrogen, phosphorus, sulphur and other nutrients. This represents of order $200 for 1 t C/ha based on today’s fertiliser costs
Improved measurements of soil carbon
Visible near infra red spectroscopy
Hedley et al(2015), Roudier et al (2015)
• rapid • lower cost • increased spatial and depth representation • allows spatial scaling • enables interpretation about carbon stability • increased efficiency for accounting practices
ELEVATION
WATER BALANCE
PARENT MATERIAL
TWI
SOLAR IRRAD.
RAINFALL
SLOPE
ASPECT
SWI
Landform
Units
Tuapaka Hill Country (Manawatu) Soil organic carbon t C/ha to 0.3m depth at 50 sampling positions
Carolyn Hedley, Pierre Roudier, Leo Valette (CSIRO) GRA funding
Relative importance of covariates (%)
Carbon stock t C/ha
• From National Soils Database including long term grasslands
• Using a spatially explicit model, differences in carbon content were attributable to surface area, aluminium and pH
• Potential carbon saturation deficit was estimated from the difference between the upper (90th percentile) and current level 50th percentile)
• 0 – 0.15 m average potential saturation deficit 32%
• 0.15 – 0.3 m average potential saturation deficit 83%
• At 40 mg C/g (0 - 0.15 m) filling the deficit equivalent to 30% increase carbon stocks
What is the potential for increasing soil carbon stocks?
Beare et al. (2014)
Pasture renewal
Stocking, supplemental feed
Irrigation
Biochar addition
Exotic worms Mixed swards Fertiliser addition
We need to use management practices that maintain and increase soil carbon
It’s changes in carbon stocks that are important
Pasture renewal
Stocking, supplemental feed
Irrigation
Biochar addition
Exotic worms Mixed swards Fertiliser addition
We need to use management practices that maintain and increase soil carbon
• Resampling sites to 1 m previously sampled 20-40 years previously
• Analysed archived soil samples
Schipper et al. (2014)
National Soils Database resampling
Flat land
5 t C/ha
Schipper et al. (2014)
Change in grassland carbon stocks
National Soils Database resampling after 20-40 years
-10 t C/ha
2014 (148 sites)
– Allophanic (-0.5 t/ha/y) and Gley (-0.3 t/ha/y) losing carbon
– Other mineral soils no significant change
– Hill country gaining carbon (0.6 t/ha/y)
– No apparent effect of grazing type
Change in grassland carbon stocks
National Soils Database resampling
Schipper et al. (2014)
Approach • 158 sites resampled after 7 years to 0.1 m depth • Range of people collected samples • No reanalysis of archived soils
Findings • Gains on dairy 0.32 t C/ha/y and drystock 0.57 t C/ha/y • Not significant from zero • Combined was significant 0.42 t C/ha/y for flat land • Gains on hill country 1.33 t C/ha/y
Change in grassland carbon stocks
500 soils resampling
Parfitt et al. (2014)
• Loss of 2.9 t C/ha/y
• Size of error ? Only one site
• Many peats many metres deep and losses will continue as long as they are drained for farming: many centuries
– at about 0.02 m/y
Carbon changes in organic soils
Campbell et al. (2015)
Tota
l car
bo
n (
%)
0
Residual
376
C arbon % by T reatm ent
2.5
3.0
3.5
4.0
4.5
5.0
Ca
rbo
n %
51 61 71 81 91 01 11
D ate
C ontrol
2.5
3.0
3.5
4.0
4.5
5.0
Ca
rbo
n %
51 61 71 81 91 01 11
D ate
376-0-250
2.5
3.0
3.5
4.0
4.5
5.0
Ca
rbo
n %
51 61 71 81 91 01 11
D ate
376
2.5
3.0
3.5
4.0
4.5
5.0
Ca
rbo
n %
51 61 71 81 91 01 11
D ate
C arbon % by T reatm ent
Note: shallow sampling
Te Ara
Management effects: P fertiliser
Winchmore, South Canterbury Whatawhata, Waikato
No benefit of adding P on soil carbon recovery
Schipper et al. (2013)
Ca
rbo
n_
%
C arbon % by T reatm ent
3.5
4.0
4.5
5.0
61 71 81 91 01
T reatm ent D ry
3.5
4.0
4.5
5.0
61 71 81 91 01
T reatm ent 10%
3.5
4.0
4.5
5.0
61 71 81 91 01
T reatm ent 20%
3.5
4.0
4.5
5.0
61 71 81 91 01
C arbon % by T reatm entTo
tal c
arb
on
(%
)
Year
Dry
10%
20%
Schipper et al. (2013)
Also confirmed to 1 m depth (Condron et al. 2014)
Management effects: irrigation
Winchmore, South Canterbury
Preliminary data South Island 0 – 0.3 m depth 10 farms Similar but less significant effects at North Island sites
Management effects: irrigation
Kelliher, Mudge, Schipper Report due soon
• Occurs every 5 to 10 years
• Sprayed off and can involve cultivation
• Total carbon losses of between 0.8 and 4.1 t C/ha (2-3% of carbon stock to 0.3 m)
• Losses and gains dependent on soil water availability
• Likely recovered between renewals
• 2 farms only
Management effects: pasture renewal
Rutledge et al. (2014)
Lucerne Chicory Plantain Ryegrass Clover
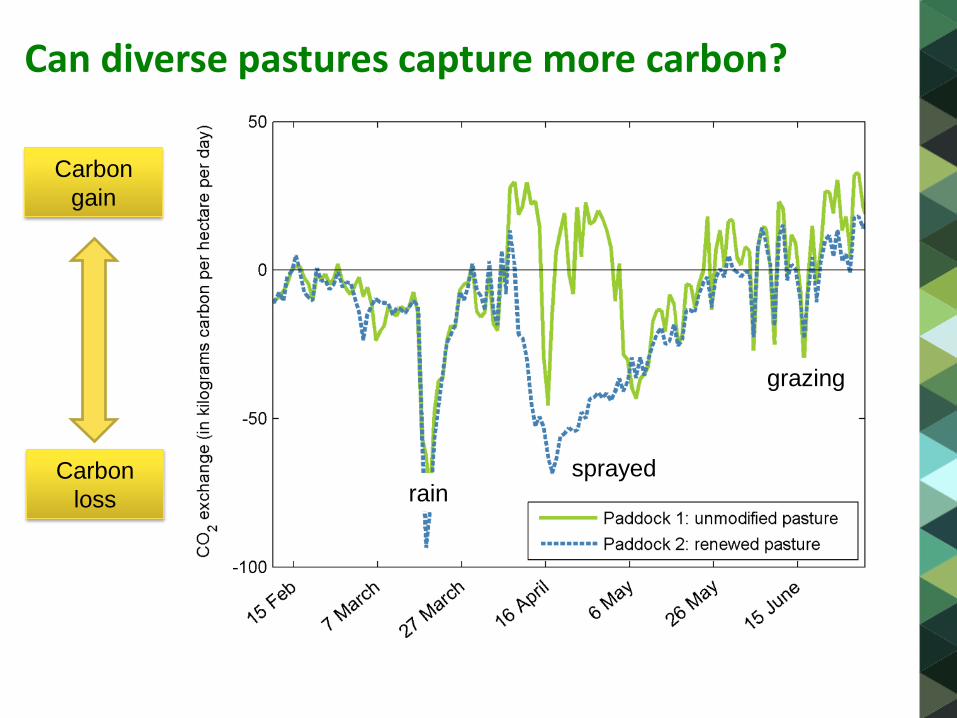
Can diverse pastures capture more carbon?
500 m
Troughton Farm, Waikato Established late 2011 on 3 ryegrass/clover areas Treatments imposed early 2013
Ryegrass
New ryegrass
Ryegrass
Ryegrass
Diverse sward
Carbon
gain
Carbon
loss
Can diverse pastures capture more carbon?
rain sprayed
grazing
Methane
respiration photosynthesis
Net carbon exchange
Carbon imports
(feed, effluent) Carbon exports
(milk/silage)
Carbon balance
Carbon sink overall average ~600 ± 320 kg C/ha/y
Both weather and management impact the annual carbon balance
Farm scale carbon balance
Scott Farm, Waikato, 4 years
But how stable is this carbon and how much more can NZ soil store?
Time trends in soil carbon stocks
Flat land
• losses up to 0.5 t C/ha/y from Allophanic and Gley soils to 0.3 m depth over 30 years
• large ongoing losses up to 2.9 t C/ha/y from organic soils (1 site!)
• no change other soil orders
• some evidence of recent increases in top 0.1 m depth (method?)
Hill country
• increases up to 0.6 t C/ha/y observed both short and long term
Summary from historical observations
Management effects on soil carbon stocks
• P fertiliser: no detectable change
• N fertiliser: no information available
• Irrigation: decrease BUT size of loss to be determined shortly
• Pasture renewal: small decrease probably recovers if infrequent
• Diverse swards: short-term increases but no long-term data yet
Summary from historical observations
How to estimate changes at national scale?
• Limited historical observations do not provide clarity • Trends depend on soil type, slope and management • Complexities of multiple variables interacting
Hill-country soils (other slopes) no data 2 330 473 no data
National total 10.7 (2.81 to 18.59)
7-year analyses of soil quality in upper 0.1 m Parfitt et al. (2014)
National scale soil carbon trends
So
il C
sto
ck
s
Time
(a)(a)
So
il C
sto
ck
s
Time
(b)
So
il C
sto
ck
s
Time
(c)
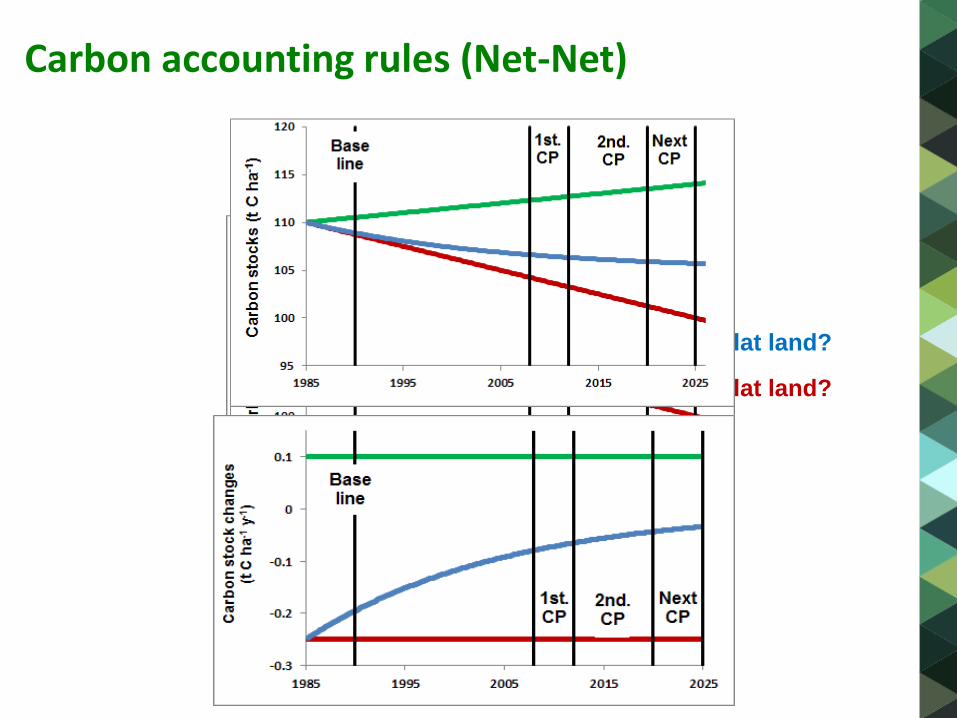
Soil carbon trends - extrapolation
Hill country
Some flat land?
Some flat land?
Carbon accounting rules (Net-Net)
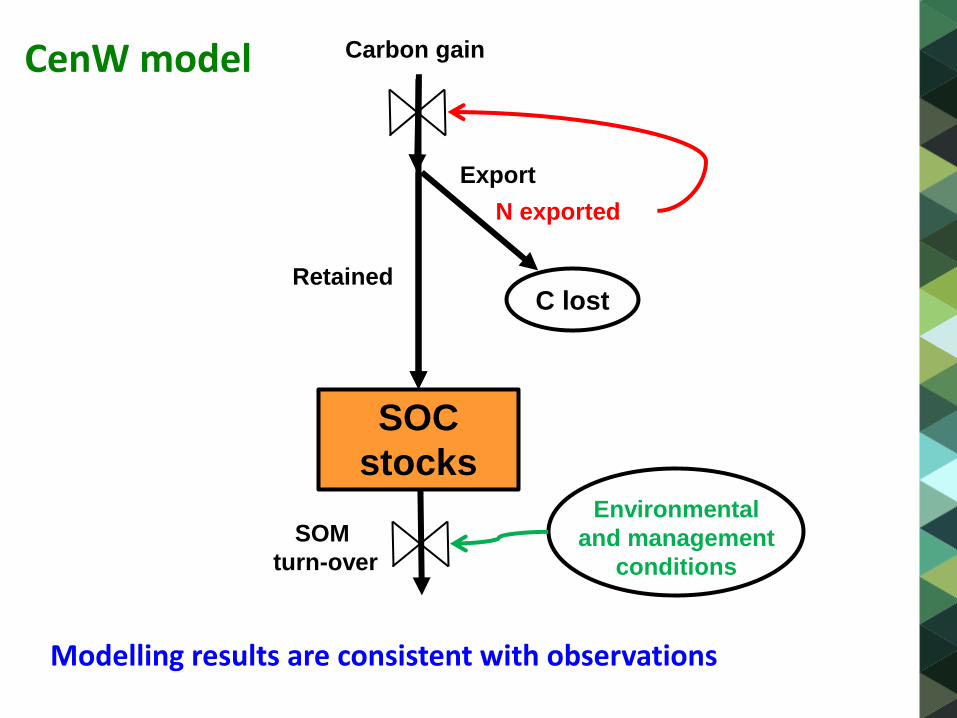
Carbon gain
Export
N exported
Retained
SOM
turn-over
Environmental
and management
conditions
C lost
SOC
stocks
CenW model
Modelling results are consistent with observations
Supplemental feed
-0.2
-0.15
-0.1
-0.05
0
0.05
0 100 200 300C
ha
nge
in S
OC
(t
ha
-1 y
r-1
)
Fertiliser addition (kgN ha-1 yr-1)
Base conditions
Fertiliser addition
Fertiliser addition (kgN ha-1 yr-1)
0
5
10
15
20
0 500 1000 1500 2000 2500
Net
pri
mar
y p
rod
uct
ion
(t
DW
ha-1
yr-1
)
Rainfall + irrigation (mm yr-1)
Changing rainfall, irrigation
Conclusions
• National-scale estimates of carbon stocks changes rely on a small number of measurements
• Changing trends could be real or not! Many questions remain
• There is potential to increase carbon in New Zealand soils • Changes depend on carbon gain, grazing off-take, carbon
stabilisation and turn-over • Carbon can increase with supplemental feeding, fertiliser
addition, and irrigation on very dry sites • Carbon increases can be achieved at the cost of reduced milk
production
• Management practices most likely to achieve increase are: • optimising nitrogen addition and irrigation • increasing carbon inputs from roots eg. mixed swards
• Potential C saturation deficit found in the soils sampled
• Pasture renewal did not greatly affect C stock in the soils studied
• Preliminary evidence that diverse sward increased (i) root C input to the soil and (ii)
net C uptake
• The effect of irrigation on soil C stock was uncertain and there have been few studies
• Models can implement research results, examine weather and management effects on
soil C stocks over many years, and develop new questions
Massey University
Marta Camps Arbestain Roberto Calvelo Pereira
University Waikato
Dave Campbell Sam McNally Jack Pronger Susanna Rutledge Louis Schipper Aaron Wall
NZAGRC PGgRc
Harry Clark Andy Reisinger
Landcare Research
Carolyn Hedley Miko Kirschbaum Andrew Manderson Stephen McNeill Pete Millard Gabriel Moinet Paul Mudge Roger Parfitt Beckie Phillips Nicolas Puche Pierre Roudier David Whitehead
AgResearch
Mike Dodd Frank Kelliher Alec Mackay Nicole Schon
Plant & Food Research
Mike Beare Denis Curtin
Scion
Simeon Smaill
CSIRO
Jeff Baldock
GNS Science
Troy Baisden
MPI
Gerald Rys
Soil C trends – temporal variability
Case study from Te Whanga catchment (de Rose, 2013)
Model-data comparison
(c)
-60 -30 0 30 60-60
-30
0
30
60
Ob
serv
ed
net
eco
syste
m
pro
du
cti
vit
y (
kg
C h
a-1
d-1
)
Modelled net ecosystem
productivity (kgC ha-1
d-1
)
0 50 100 150
Ob
serv
ed
ph
oto
syn
thesis
rate
(kg
C h
a-1 d
-1)
0
50
100
150
Modelled photosynthesis
rate (kgC ha-1
d-1
)
(a)
0 2 4 6
0
2
4
6
Ob
serv
ed
evap
otr
an
sp
irati
on
rate
(m
m d
-1)
Modelled evapotranspiration
rate (mm d-1
)
(b)
(d)
0 1000 2000 3000 4000
Ob
serv
ed
folia
r bio
mass
(kg
C h
a-1)
0
1000
2000
3000
4000
Modelled foliar
biomass (kgC ha-1
)
EFd = 0.56
EFw = 0.54
EFd = 0.91
EFw = 0.96
EFd = 0.79
EFw = 0.84
EF = 0.58
Simulations with CenW (Kirschbaum et al., 2015)
Data from Waikato University (Rutledge, Mudge,
Schipper et al.)
Understanding Biochar
Biochar and Carbon Stability
BIOCHAR
UNPYROLYZED BIOMASS
Biochar mineralizes more slowly than the biomass
it was produced from
Biochar C storage capacity differs widely!
Class 1 (< 300 g C kg-1 biochar will remain stable for > 100 years)
Class 5 (> 600 g C kg-1 biochar will remain stable for > 100 years)
C storage value
Biochars produced from ash rich material (e.g., manure) at low temperature
Biochars produced from woody material at high temperature
Camps Arbestain et al. (2015)
Biochar and Fertiliser Value
Class 0 (no fertiliser value for hypothetical Corn needs at doses ≤ 10 t ha-1)
Class 4 (fertiliser class 4; e.g., K2t, P2t, S5t, Mg3t)
Fertiliser value Biochars produced from pine
Biochars produced from poultry litter, tomato waste
Camps Arbestain et al. (2015)
Biochar and Liming Value
Class 0 (liming eq < 1%) Class 3 (liming eq > 20%)