RESEARCH REPORT Prepared for: Multicultural Affairs Branch Anti-Racism Campaign Unit Department of Immigration and Multicultural Affairs The anti-racism campaign: Quantitative market research to guide campaign development Project 2115 July 1998
Transcript
RESEARCH REPORT
Prepared for:
Multicultural Affairs Branch
Anti-Racism Campaign Unit
Department of Immigration and Multicultural Affairs
The anti-racism campaign: Quantitative market research to guide campaign development
4.1 Attitudes to build on and to address......................................10 4.2 The best contribution of migrants and indigenous people ....17 4.3 The perceived causes of racism ...........................................20 4.4 Defining racism .....................................................................21 4.5 An index of racism ................................................................25 4.6 A profile of the community segments....................................30 4.7 Shared values .......................................................................34 4.8 Perceptions of harmony ........................................................39
4.8.1 Groups perceived as not living in harmony in Australia..............43 5. Conclusions..................................................................................45
5.1 Possible communication ‘bridges’.........................................45 5.2 Do we target the segment holding most racist views?..........48 5.3 Why a subtle campaign is recommended .............................49 5.4 A note re “cultural diversity” .......................................................... 51
Appendix 1: DIMA Research Brief Appendix 2: Questionnaire Appendix 3: Sample demographics Appendix 4: Best contributions of migrants and indigenous people Appendix 5: Segment demographics
1 Introduction
Quantitative Research DIMA
EUREKA 1
The research reported here is the second stage of a two-phase
research project conducted on behalf of the Commonwealth
Department of Immigration and Multicultural Affairs (DIMA). The
project was conducted to inform the development of an anti-racism
campaign. The first phase, conducted in November-December
1997, was a qualitative research project. This phase consisted of
36 focus groups with members of the community expressing
positive or negative attitudes towards other ethnic and religious
groups. The findings and recommendations resulting from the
qualitative phase were reported in March, 1998 under two separate
covers.
This document presents the main findings of the second,
quantitative phase of research. However, the findings from the
qualitative phase of research will again be discussed in this report in
light of the findings and recommendations arising from the
quantitative research.
The quantitative research was conducted during 7-10 May 1998 to
provide strategic directions for the campaign, to assist campaign
development and to act as a “benchmark” of community attitudes
prior to the launch of the anti-racism campaign.
DIMA Anti-Racism Campaign Quantitative Research
EUREKA 2
1.1 A working definition In conducting this research, Eureka has employed the operational
definition of racism stated in DIMA’s draft campaign strategy
document. That is, we have used a definition based on the
concepts of racial vilification and racial discrimination which defines
racism as:
“...offensive behaviour or attitudes based on reasons of the race,
colour, national or ethnic origin and religion of a person or group.
The definition will incorporate behaviour and attitudes which
perpetrators often may not perceive to be racist.”
Furthermore, this definition is perceived as encompassing:
“...structural forms of racism or ‘institutional racism’, as found for
example in the systemic discrimination against particular group(s) in
access to services”.
2 Research objectives
The broad aim of this research project was to explore and
understand the subtleties and nature of racism in the Australia of
the late 1990's, with a view to mounting an effective anti-racism
campaign. More specifically, the quantitative research aimed:
To explore public perceptions of the existence, and
community support for, shared community values;
Quantitative Research DIMA
EUREKA 3
To investigate whether these shared values are perceived as
beneficial to Australia;
To explore perceptions of harmony (or lack thereof) within
Australian society and test the key campaign messages,
including “Living in harmony”;
To identify the perceived contributions of minority ethnic
groups and of the indigenous community;
To assess community attitudes towards various ethnic
groups and toward indigenous Australians;
To explore the perceptions of which of a set of behaviours
can be defined as racism;
To explore perceptions of the causes of racism, and
To determine whether, and if so, how, the above attitudes
and perceptions vary across people of varying socio-
demographic profiles.
A copy of DIMA’s research brief for this project is presented at
Appendix 1. The brief presents a full list of research objectives for
both the qualitative and quantitative research.
3 Methodology
Quantitative Research DIMA
EUREKA 4
3.1 Research design
The quantitative phase of the research consisted of 2,000 telephone
interviews. The interviews were conducted nationally with a random
sample of the Australian population aged 16 years and over.
The interviews were of 17 minutes’ duration (on average) and
conducted using Computer Assisted Telephone Interviewing (CATI)
technology. A telephone methodology offered participants more
anonymity than a face to face interview and hence, was more likely
to result in honest responses to a sensitive issue such as racism.
The sample was drawn at random from CD ROM discs containing
up to date listings of the White Pages. To further enhance the
representativeness of the sample:
The sample covered capital cities and country areas,
including some remote locations, in all territories. Broad
quotas were set in each region to ensure the sample
reflected the population in terms of age and gender:
Interviewing was carried out in the evenings and weekends;
Three call backs were made to unavailable respondents, and
The selection of respondents from within the members of the
household was randomised by interviewing the individual
whose birthday was next.
Quantitative Research DIMA
EUREKA 5
Where the respondent was under 18 years of age, the broad nature
of the interview was first discussed with the parent or other
responsible adult, and consent obtained. This was a necessary
step in adhering to the code of conduct of the Market Research
Society of Australia (MRSA).
Forty-five (45) pilot interviews were conducted prior to launching the
survey proper to check for any problems in question wording or
misinterpretation, response scale usage or codes and interview
length.
All fieldwork for the survey was subcontracted to NCS Australasia
(formerly Wells Australasia). NCS are fully IQCA accredited and
adhere to the MRSA code of ethics, as does Eureka. NCS has a
particularly strong team of bilingual interviewers. While not qualified
translators, these interviewers were able to carry out the interview in
another language to increase the response rate amongst the non-
English speaking (NES) segment of the Australian population.
3.2 Survey content
A copy of the questionnaire used in the quantitative phase of this
research is presented in Appendix 2. Broadly speaking, the
interview explored the following issues:
Perceptions of the existence, and societal support for,
shared community values;
Whether these shared values are perceived as beneficial to
Australia;
Quantitative Research DIMA
EUREKA 6
Perceptions of harmony (or lack thereof) within Australian
society and testing of the key campaign messages, including
“Living in harmony”;
The perceived contributions of minority ethnic groups and of
Australia’s indigenous people;
Attitudes towards various ethnic groups and indigenous
people;
Perceptions of whether everyday or only extreme racist
level, whether they self-identify as an Aboriginal or a Torres
Strait Islander, whether born in Australia, whether either
parent was born outside Australia (and if so, whether in an
English-speaking country), (if respondent was born overseas)
their length of stay in Australia, whether they were born in a
non-English speaking country and whether a language other
than English is the main language spoken in their household.
Finally, given the sensitive nature of some of the questions asked,
the following was read to all respondents as a “sign off” at the end
of the interview:
That’s the end of the interview. Please note that the statements I
asked you to comment on are not necessarily my views or the
views of the research company. Those were simply some things
other people have said and we wanted to know if you agreed with
them. Your answers will be combined with those of other people
and will be used to help the Commonwealth Government to develop
Quantitative Research DIMA
EUREKA 7
a campaign to promote unity and harmony in the Australian
community. Thank you for your time and assistance.
All statistical analyses reported in this document were conducted
personally by Eureka’s consultants using SPSS version 8.0.
3.3 Sample frame
The random sampling for this research was monitored to ensure
that it produced a sample representative of the wider Australian
population in terms of:
location (urban, rural and remote areas);
socio-demographic variables (gender and age).
A full profile of the sample is presented in Appendix 3. In brief, the
sample can be described as:
spread across all states of Australia (36% NSW/ACT, 26%
Victoria, 17% Queensland, 10% WA, 9% SA/NT, 3%
Tasmania);
mainly in metropolitan regions (64% metro, 36% non-metro);
slightly skewed towards females (54% female, 46% male);
more likely to be aged 45 or under (56% under 46, 44%
aged 46 or more);
mostly in some form of paid work (45% full-time, 18% part-
time, 37% not in paid work);
primarily having a white collar worker as the household’s
main income earner (50% upper or lower white collar, 26%
Quantitative Research DIMA
EUREKA 8
blue collar, 20% not in the workforce, 4% student or working
in the home);
varying in total annual household income (46% over
$40,000, 45% under $40,000, 10% refused or other);
not tertiary educated (56% secondary school or lower, 41%
TAFE or university, 3% other), and
primarily of Anglo-Australian background (75% Anglo, 22%
from non-English speaking backgrounds and 2.5% self-
identified as an Aboriginal or a Torres Strait Islander).
Quantitative Research DIMA
EUREKA 9
The profile of the sample almost exactly matched that of the
Australian population aged 16 and over. The proportion of
interviews conducted in each State matched the proportion of the
adult Australian population residing in that State. As well, the
sample frame matched the metropolitan/non-metropolitan split in
population within each State. With regard to age, the population
aged over 45 was presented in its true proportion. However, the
sample slightly under-represented those aged 16-35 (by 3%) and
over-represented those aged 36-45 (by 4%). Further, while the
Australian population is 51% female (and 49% male), the sample
frame slightly over-represented females as they formed 54% of the
final sample.
None of these differences between the sample frame and the
Australian population are of a magnitude to have significantly
skewed the results of the survey.
The sample frame generated in this research did not allow Eureka
to report separately on two groups of interest: recently arrived
migrants and Aboriginal and Torres Strait Islander people. From a
sample of 2,000 people, only 50 respondents (or 2.5%) self-
identified as an Aboriginal and Torres Strait Islander. Given this
sample size, we have not to referred to this group separately or
conducted separate analysis on their responses.
Furthermore, “recently arrived” refers to migrants who have been in
Australia for only two years ... or five years at the most. The sample
frame generated in this research contained only 9% of people who
were born overseas and had been in Australia for five years or less
(see Appendix 3). In our survey, this amounted to only 40 people
Quantitative Research DIMA
EUREKA 10
(9% of 442), hardly adequate to make any valid conclusions about
this group. Again, this is the reason no separate analyses have
been provided for this community group.
4 Findings
This section will provide an analysis of the current climate of racism,
its form, prevalence and intensity, the profile of those most likely to
hold more racist views and community reactions to possible
campaign themes.
4.1 Attitudes to build on and to address
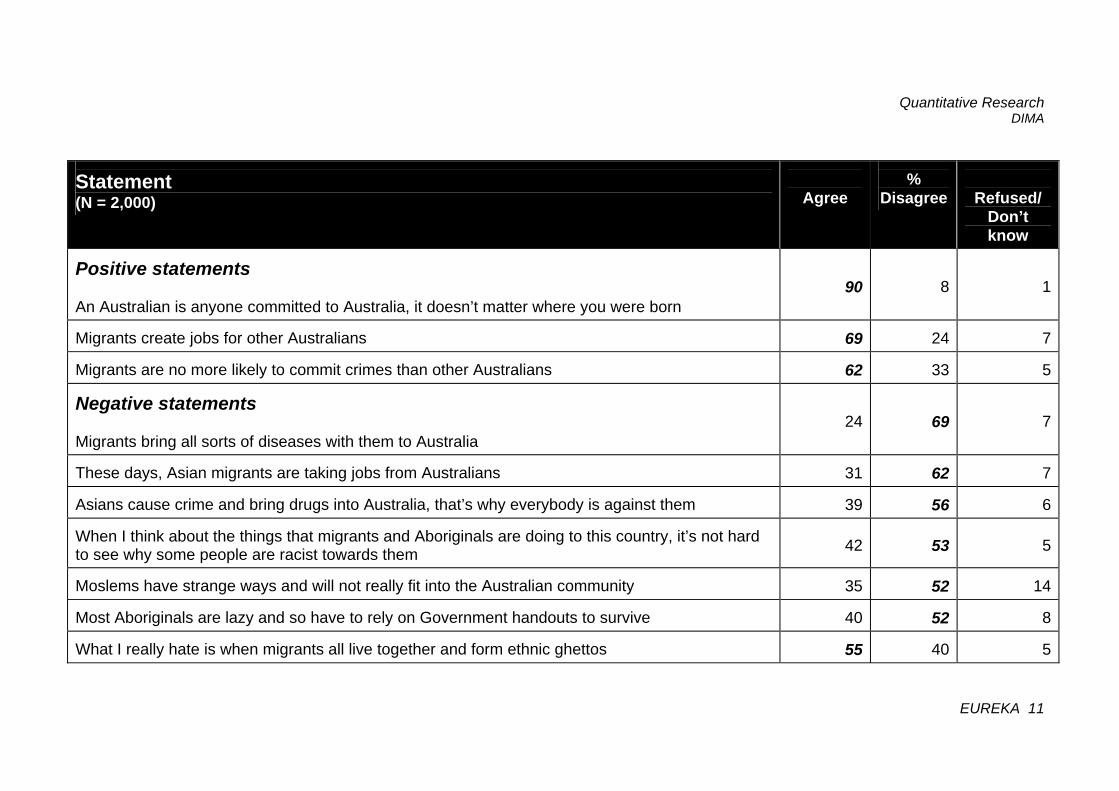
During the interview, respondents were asked whether they agreed
or disagreed with ten statements expressing negative and positive
attitudes towards different ethnic/religious groups. As shown in the
following table, the majority agreed with all of the positive
statements and disagreed with most of the negative statements.
Quantitative Research DIMA
EUREKA 11
Statement (N = 2,000)
Agree
%
Disagree
Refused/ Don’t know
Positive statements An Australian is anyone committed to Australia, it doesn’t matter where you were born
90
8
1
Migrants create jobs for other Australians
69
24
7
Migrants are no more likely to commit crimes than other Australians
62
33
5
Negative statements Migrants bring all sorts of diseases with them to Australia
24
69
7
These days, Asian migrants are taking jobs from Australians
31
62
7
Asians cause crime and bring drugs into Australia, that’s why everybody is against them
39
56
6
When I think about the things that migrants and Aboriginals are doing to this country, it’s not hard to see why some people are racist towards them
42
53
5
Moslems have strange ways and will not really fit into the Australian community
35
52
14
Most Aboriginals are lazy and so have to rely on Government handouts to survive
40
52
8
What I really hate is when migrants all live together and form ethnic ghettos
55
40
5
Quantitative Research DIMA
EUREKA 12
The level of positive sentiment shown in the table above suggests
that some positive attitudes, widely held in the community, can be
built on in the context of an anti-racism or pro-harmony campaign.
In particular, it is extremely encouraging that 9 in 10 respondents
agreed that “An Australian is anyone committed to Australia, it
doesn’t matter where you were born.” Clearly, there is room to build
on this sentiment and to use it in communicating an anti-racist
viewpoint. As it is a view that almost all Australians support, it can
be used in communication terms as a starting point in presenting a
theme or message about what unites all Australians.
At the same time, the above findings show that a substantial
proportion of respondents, and hence, the Australian population,
hold very negative views towards segments of our society, views
that need to be addressed. These negative views attracted varying
levels of support from the Australian community. However, even
the negative statement with the lowest level of agreement was
supported by one adult Australian in every four.
The fact that most people agree that they really hate (it) when
migrants all live together and form ethnic ghettos suggests that
slightly more than half of the community has an underlying belief
that migrants should become part of the “mainstream” and integrate
more quickly into the community. Not surprisingly, those of Anglo
background were significantly more likely than their counterparts
from non-English speaking backgrounds to agree with this
statement (57% of Anglo people v 50% of people from NES
background). Nevertheless, even half of the established migrants
agree that this is an undesirable phenomenon. This was also a
view expressed by a large segment of both Anglo people and
people from NES background during the qualitative research phase.
Quantitative Research DIMA
EUREKA 13
However, this was in fact a relatively “mild” statement. It is of even
more concern that about 1 in 3 Australians agreed that:
Moslems have strange ways and will not really fit into the
Australian community
Asian migrants are taking jobs from Australians
When it comes to “Asians”, concerns about crime and drug issues
find more support than concerns about employment. Jobs do not
seem to be a major issue: two thirds believed migrants create jobs,
while one third believed Asian migrants were taking jobs.
Almost a quarter of the community agreed with the view that
migrants bring diseases with them.
The largest proportion of people who agreed with negative
statements was 2 in 5 Australians, or approximately 40% of the
population. This substantially large segment agreed that:
Asians cause crime and bring drugs into Australia.
Most Aboriginals are lazy and so have to rely on Government
handouts to survive.
When I think about the things that migrants and Aboriginals
are doing to this country, it’s not hard to see why some
people are racist towards them.
All three of these statements arose out of the comments made by
people during the focus groups. Clearly, what the quantitative
Quantitative Research DIMA
EUREKA 14
research has shown is that a substantial portion of the community
does hold these views. The last statement listed above, in
particular, is indicative of a view that racism can be justified. In the
qualitative research we found people using such perceptions as a
“justification” for racist acts. In a sense, subjects of racism were
blamed and claimed to bring the racism onto themselves. In
psychological parlance, this is known as “victim blaming” and it is
clearly a view that needs to be addressed by an anti-racism
campaign.
The table below shows how people from non-English speaking
backgrounds compared in attitudes with “Anglos.” In sum, there
were three differences. Two pertained to the fact that people from
NES background were less likely to agree with two of the
statements: (a) that they object to formation of “ethnic ghettos”
(though 50% still agree with this) and (b) that Asian migrants are
taking jobs from Australians. The third difference is that people
from NES background are more likely to agree that migrants create
jobs for other Australians. For the remaining seven statements, the
attitudes of these two community groups did not vary significantly.
Quantitative Research DIMA
EUREKA 15
Statement
NESB
(n = 448) % Agree
Anglos
(n = 1502) % Agree
Positive statements An Australian is anyone committed to Australia, it doesn’t matter where you were born
93
90
Migrants create jobs for other Australians
75
67*
Migrants are no more likely to commit crimes than other Australians
61
62
Negative statements Migrants bring all sorts of diseases with them to Australia
23
24
These days, Asian migrants are taking jobs from Australians
26
33*
Asians cause crime and bring drugs into Australia, that’s why everybody is against them
37
39
When I think about the things that migrants and Aboriginals are doing to this country, it’s not hard to see why some people are racist towards them
40
42
Moslems have strange ways and will not really fit into the Australian community
36
34
Most Aboriginals are lazy and so have to rely on Government handouts to survive
39
40
What I really hate is when migrants all live together and form ethnic ghettos
50
57*
* Significant difference between the two columns
Quantitative Research DIMA
EUREKA 16
4.2 The best contribution: migrants and indigenous people
When asked to nominate the best single contribution that migrants have made to Australia, some people reeled off a series of benefits (hence the data in the following table total over 100%). The contributions most commonly mentioned related to diversity in cuisine, culture or economic benefits. Only a minority of respondents said that migrants had not contributed anything to our nation or, similarly, responded “don’t know.” Migrants’ best contribution (n = 2,000)
% Nominate as
best contribution of migrants*
Variety of foods
24
Their culture/way of life
22
Diversified the culture
22
Willingness to work hard
13
Made us more tolerant/ encouraged harmony
8
Broadened our horizons/aware of the world
6
Economic
5
Multiculturalism
4
Business/set up business
2
Don’t know
6
Nothing
3
* Numerous other benefits were mentioned by fewer than 1% of respondents. These are listed in Appendix 4.
Quantitative Research DIMA
EUREKA 17
The results shown above replicate the findings of qualitative
research by emphasising the perceived importance of culinary
variety as a contribution of migrants to Australia. However, the
quantitative research has also revealed much more support for
other contributions of migrants than was apparent in the qualitative
research. Clearly, diversification of culture and the contribution of
other cultures to Australia’s culture is appreciated by almost half
(44%) of the Australian population ... without any prompting from the
survey. A further 20% of the community see the economic benefits
of migration and migrants (13% hard work + 5% economic + 2%
business). Approximately 1 in 7 Australians (14%) recognise that
migrants have given the Australian society greater tolerance,
“broader horizons” and a greater awareness of the rest of the world.
Only 3% of Australians say that migrants have contributed
nothing to the country.
From the point of view of a campaign emphasising harmony, then,
there are significant potential benefits in referring to the contribution
of migrants in diversifying and enriching the Australian culture.
However, it is important to keep in mind that the qualitative research
indicated that people with the most racist attitudes were most
threatened by the dilution of Australian culture perceived to be
caused by migrants and by multiculturalism. The quantitative data
support this view. Those who supported the most negative
statements about migrants and Aboriginals were significantly less
likely than those supporting non-racist views to see diversification of
culture or “their way of life” as migrants’ best contribution to
Australia. Only 29% of those supporting many of the racist views
nominated this as the best contribution, compared with 55% of
those supporting non-racist views. (See section 4.5 for how these
two groups were defined.)
Quantitative Research DIMA
EUREKA 18
Caution therefore needs to be exercised in communicating this message both because those supporting numerous racist views are less likely to believe in these benefits of migration and because they are more likely to feel threatened by cultural diversification. When it came to nominating the best contribution of indigenous people to Australia, their culture or art was mentioned by half the community. Over a quarter of the community (26%) either could not nominate a contribution of indigenous people or said outright that indigenous people have not made any contribution to Australia. This figure is a lot higher than for migrants’ best contribution (9%), indicating that people are almost three times more likely to be disparaging of the contributions of indigenous people than of migrants.
Indigenous people’s best contribution
% Nominate as best
contribution of Indigenous people*
Their culture/lifestyle
38
Arts/artwork
12
Way they relate to the land
9
Made us more tolerant
6
Sportspeople
4
Their land
3
Made us more aware of family values
1
Strong community spirit
1
Nothing
13
Don’t know
13
Quantitative Research DIMA
EUREKA 19
* Numerous other benefits were mentioned by fewer than 1% of respondents. These are listed in Appendix 4.
Those who said that indigenous people had contributed nothing to
Australia were significantly more likely than others to also report that
migrants had made no contribution to Australia (12% vs 2%). In
other words, there was considerable overlap in these two negative
views of the contributions of Australia’s minority groups.
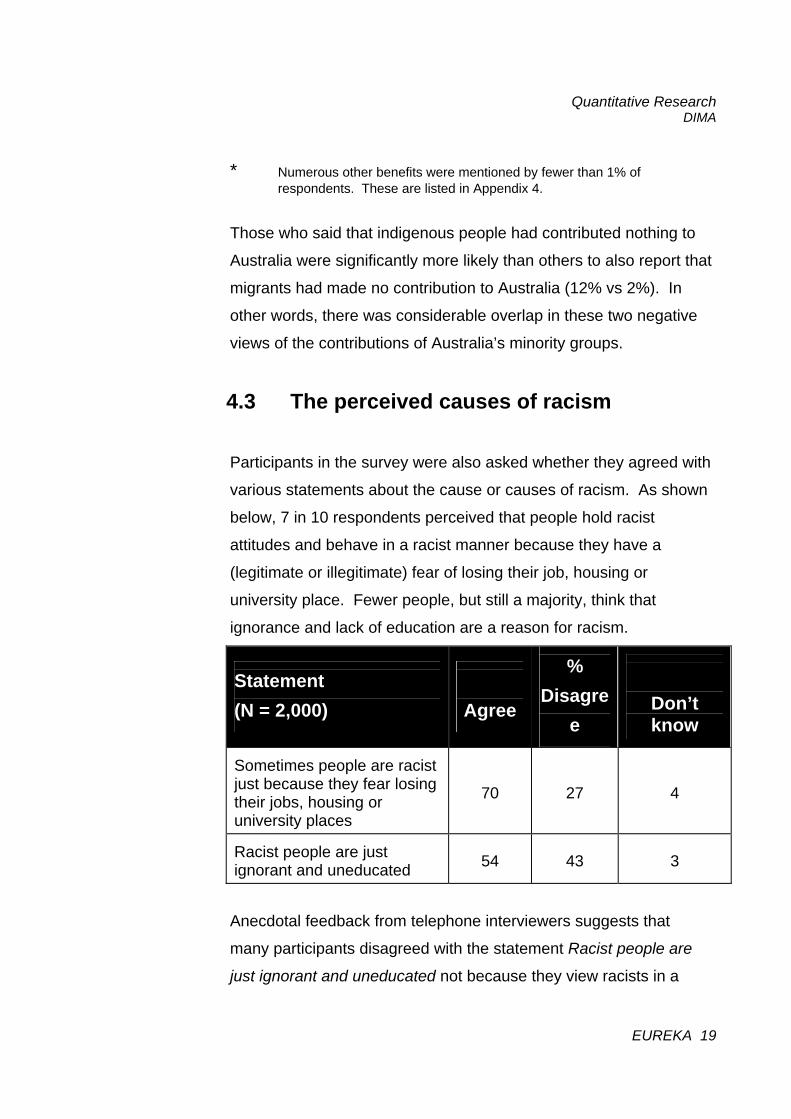
4.3 The perceived causes of racism
Participants in the survey were also asked whether they agreed with
various statements about the cause or causes of racism. As shown
below, 7 in 10 respondents perceived that people hold racist
attitudes and behave in a racist manner because they have a
(legitimate or illegitimate) fear of losing their job, housing or
university place. Fewer people, but still a majority, think that
ignorance and lack of education are a reason for racism.
Statement (N = 2,000)
Agree
%
Disagree
Don’t know
Sometimes people are racist just because they fear losing their jobs, housing or university places
70
27
4
Racist people are just ignorant and uneducated
54
43
3
Anecdotal feedback from telephone interviewers suggests that
many participants disagreed with the statement Racist people are
just ignorant and uneducated not because they view racists in a
Quantitative Research DIMA
EUREKA 20
positive light, but because they perceive that many well-educated
people are often racist. The research therefore indicates that it
would be unproductive to represent racists as merely ignorant,
uneducated or ill-informed. A large segment of the community
would simply question the truthfulness of such an assertion and any
such message would be dismissed quickly and readily by most
segments of the community.
4.4 Defining racism The qualitative research revealed that people defined racism in one
of two ways: either as inclusive of “everyday” negative acts towards
people of other races or only as extreme acts of violence against
people of other races. Furthermore, in the qualitative research,
those who expressed the most negative and stereotyped views
toward other groups - predominantly made up of Anglo-Saxon
people - were largely of the view that racism is an extreme act, such
as physical violence against people of other races (genocide,
behaviours shown by groups such as the Ku Klux Klan and National
Action). By definition, they excluded themselves from the definition
of what a racist is. That is, they generally said that racism is how
other people behave, not themselves. The remaining group
participants (positive Anglo-Saxons, most Aboriginals and most
migrants) defined racism to include far less “extreme” and more
“everyday” behaviours. These groups defined racism to include
behaviour such as:
name calling;
derogatory comments from people in the street;
making some customers wait longer for service in shops;
Quantitative Research DIMA
EUREKA 21
showing unwarranted rudeness to people trying to make
themselves understood in English;
making sweeping negative generalisations on the basis of
cultural, linguistic or religious differences;
providing assistance (e.g., job applications and income
assistance) in a begrudging and reluctant manner;
discrimination when trying to rent or buy real estate;
rougher treatment from - or being treated with unwarranted
suspicion by - the police;
abuse on sporting fields;
walking away from public places (e.g., parks, crossing the
footpath) to avoid contact with certain people;
conversing in a patronising or mocking way; and
media references to the ethnic background of non-
Caucasian offenders.
The quantitative research sought to determine what proportion of
the community agreed with an extreme versus everyday definition of
racism. To do this, respondents were presented with the two
alternative definitions of racism and asked which they agreed with
more.
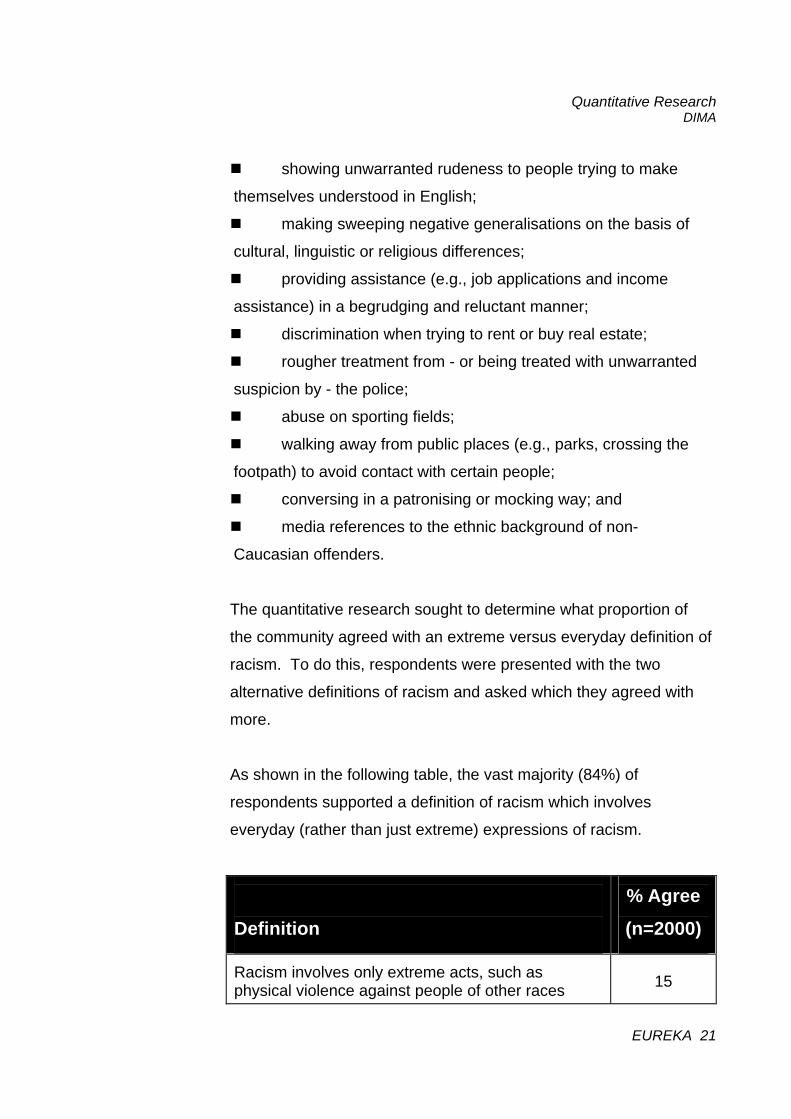
As shown in the following table, the vast majority (84%) of
respondents supported a definition of racism which involves
everyday (rather than just extreme) expressions of racism.
Definition
% Agree
(n=2000) Racism involves only extreme acts, such as physical violence against people of other races
15
Quantitative Research DIMA
EUREKA 22
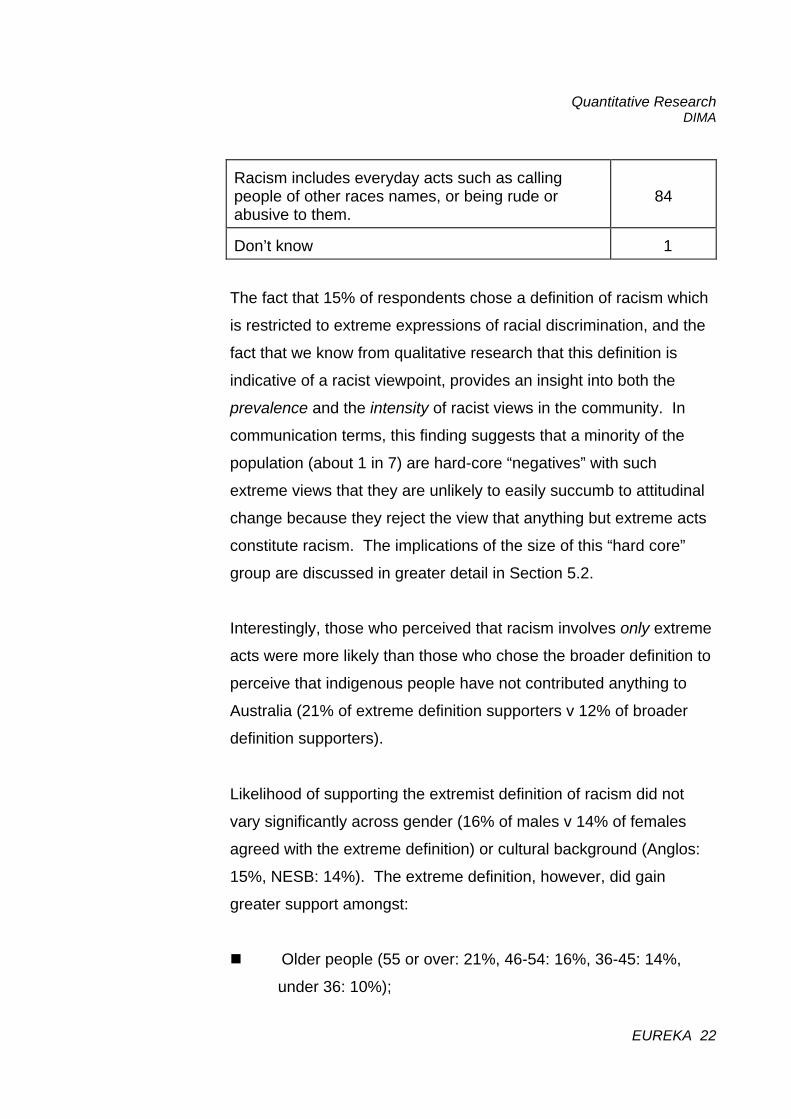
Racism includes everyday acts such as calling people of other races names, or being rude or abusive to them.
84
Don’t know
1
The fact that 15% of respondents chose a definition of racism which
is restricted to extreme expressions of racial discrimination, and the
fact that we know from qualitative research that this definition is
indicative of a racist viewpoint, provides an insight into both the
prevalence and the intensity of racist views in the community. In
communication terms, this finding suggests that a minority of the
population (about 1 in 7) are hard-core “negatives” with such
extreme views that they are unlikely to easily succumb to attitudinal
change because they reject the view that anything but extreme acts
constitute racism. The implications of the size of this “hard core”
group are discussed in greater detail in Section 5.2.
Interestingly, those who perceived that racism involves only extreme
acts were more likely than those who chose the broader definition to
perceive that indigenous people have not contributed anything to
Australia (21% of extreme definition supporters v 12% of broader
definition supporters).
Likelihood of supporting the extremist definition of racism did not
vary significantly across gender (16% of males v 14% of females
agreed with the extreme definition) or cultural background (Anglos:
15%, NESB: 14%). The extreme definition, however, did gain
greater support amongst:
Older people (55 or over: 21%, 46-54: 16%, 36-45: 14%,
under 36: 10%);
Quantitative Research DIMA
EUREKA 23
People in non-metro areas (Non-metro: 16%, metro: 14%);
Those with lower levels of education (Secondary educated or
less: 18%, Tertiary educated: 11%);
Those not in paid work (Not in paid work: 18%, full time paid
work: 13%, part-time paid work: 12%);
People not in the workforce, students/home workers and
blue collar workers (Not in the workforce: 21%,
students/home workers: 17%, blue collar: 17%, white collar:
11%);
Those with low annual household incomes (under $20,000:
19%, $20,000 to under $40,000: 16%, $40,000 to under
$80,000: 12%, $80,000 or over: 12%), and
People living in Western Australia (WA: 18%, NSW: 16%,
SA: 14%, Tas: 14%, Vic: 13%, Queensland: 12%).
This “profile” of those more likely to hold to an extremist definition of
racism views is based on only one attitudinal measure. The
following section outlines the development of a more
comprehensive index incorporating seven attitudinal measures.
4.5 An index of racism
In order to identify the segments of our community which are most
likely to support racist views, Eureka developed an index of racism
based on seven statements employed in the survey (five expressing
racist attitudes and two expressing non-racist attitudes). In devising
this scale, respondents were given a “point” if they agreed with each
of the following statements:
Migrants bring all sorts of diseases with them to Australia
Quantitative Research DIMA
EUREKA 24
Moslems have strange ways and will not really fit into the
Australian community
Most Aborigines are lazy and so have to rely on Government
handouts to survive
When I think about the things that migrants and Aboriginals
are doing to this country, it’s not hard to see why some people are
racist towards them
Asians cause crime and bring drugs into Australia, that’s why
everybody is against them
Furthermore, a “point” was assigned for each respondent who
disagreed with either of the following statements:
Migrants are no more likely to commit crimes than other
Australians
An Australian is anyone committed to Australia, it doesn’t
matter where you were born.
This process resulted in the calculation of a “racism score” between
0 and 7 for each respondent in the sample: 0 for people who agreed
with each of the five former statements and disagreed with each of
the two latter statements and 7 for those who did the opposite (and
of course other scores between 0 and 7 for those whose answers
met the other 254 possible permutations).
The analysis of the resulting racism scale showed that the
community can be split into three segments:
Quantitative Research DIMA
EUREKA 25
42% of the sample expressed support for none or only one
racist statement. These people can be described as those
generally supporting non-racist views;
33% supported only 2 or 3 racist statements (essentially,
fence-sitters), and
25% supported 4 or more racist statements - those
supporting numerous racist views.
These three attitudinal segments of the community are depicted
below.
33%
25%
42%
Fence sitters
Support numerous racist views
Support non‐racist views
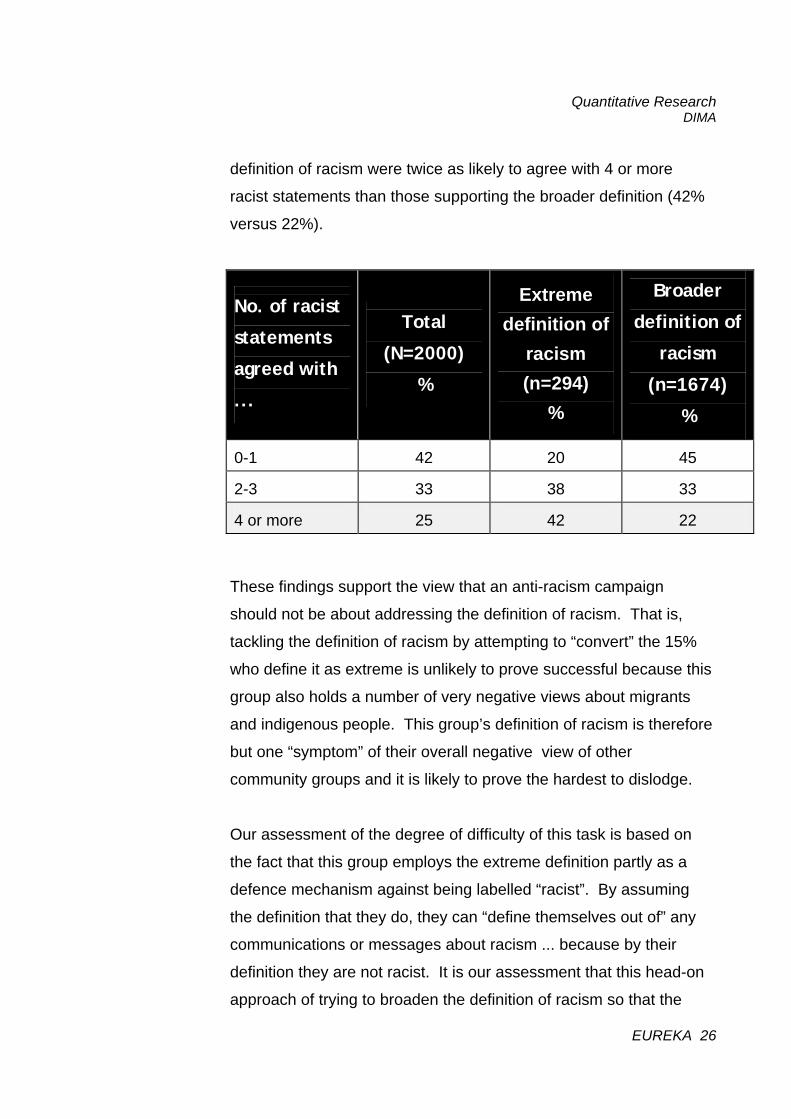
As one would expect, there is a statistically significant correlation
between agreement with 4 or more racist statements and support
for the extreme definition of racism (r=0.189). In other words,
people defining racism only by its extreme expression are also more
likely to agree with a greater number of racist statements. As
shown in the following table, those who supported the extreme
Quantitative Research DIMA
EUREKA 26
definition of racism were twice as likely to agree with 4 or more
racist statements than those supporting the broader definition (42%
versus 22%).
No. of racist
statements
agreed with
...
Total
(N=2000)
%
Extreme
definition of racism (n=294)
%
Broader
definition of
racism
(n=1674)
%
0-1
42
20
45
2-3
33
38
33
4 or more
25
42
22
These findings support the view that an anti-racism campaign
should not be about addressing the definition of racism. That is,
tackling the definition of racism by attempting to “convert” the 15%
who define it as extreme is unlikely to prove successful because this
group also holds a number of very negative views about migrants
and indigenous people. This group’s definition of racism is therefore
but one “symptom” of their overall negative view of other
community groups and it is likely to prove the hardest to dislodge.
Our assessment of the degree of difficulty of this task is based on
the fact that this group employs the extreme definition partly as a
defence mechanism against being labelled “racist”. By assuming
the definition that they do, they can “define themselves out of” any
communications or messages about racism ... because by their
definition they are not racist. It is our assessment that this head-on
approach of trying to broaden the definition of racism so that the
Quantitative Research DIMA
EUREKA 27
whole community defines it to include everyday racist acts would be
futile so far as 15% of of the community is concerned.
4.6 A profile of the community segments
Analyses reveal that the three segments do not vary significantly in
terms of gender. That is, males and females were equally likely
to express racist attitudes (27% of males agreed with 4 or more
racist statements compared to 24% of females).
Likewise, the three segments were not found to vary according to
cultural background with Anglos and people of non-English
speaking background just as likely to express racist attitudes (26%
of Anglos agreed with 4 or more racist statements compared to 22%
of people of non-English speaking background).
These findings indicate that any anti-racism or pro-harmony
campaign will need to equally target males and females and people
of all cultural backgrounds.
Next, we will examine the differences between the three segments.
Those supporting numerous racist views (25% of the
sample) The segments varied in some respects. As suggested by the
definition measure, those who agreed with 4 or more racist
statements were found to particularly over-represent people:
aged 55 or over;
living in non-metro areas;
living in Western Australia;
Quantitative Research DIMA
EUREKA 28
with a low annual household income (that is, earning under
$40,000 and even more so, under $20,000);
with a lower level of education (secondary school or less);
not in paid work, and/or
with a blue collar worker or unemployed person as their
household’s main income earner.
The above list therefore provides the Department with a list of
groups that will prove the most resistant to either an anti-racism or a
pro-harmony message. Section 5.2 will explore whether this group
is worth targeting in case of either campaign.
As to gender differences, amongst those aged 55 or over who
supported 4 or more racist statements, 47% were male and 53%
female. This gender split reflects that of the total sample. In other
words, males and females aged 55 years or over were equally likely
to agree with 4 or more racist statements and hence equally likely to
be part of the more extreme segment in the community.
The fence-sitters (33% of the sample) This segment (consisting of people who supported 2 or 3 racist
statements) was found to particularly over-represent people:
aged 36 to 45 years;
in South Australia and the Northern Territory;
with a lower level of education (secondary school or less),
and/or
having a blue collar worker or unemployed person as their
household’s main income earner.
No other features distinguished this group from the broader
Quantitative Research DIMA
EUREKA 29
Australian community. Interestingly, fence-sitters did not vary from
the total sample in terms of their location (metro or non-metro) or
annual household income.
This is a segment whose attitude toward other community groups
will be worthy of addressing in the context of either an anti-racism or
pro-harmony campaign. Given that they only support some of the
racist views and disagree with others, we judge them to hold views
that can be influenced in a more positive direction.
This segment was not represented in the qualitative research.
Following the quantitative research, it is clear now that this group is
an important segment with whom the campaign will need to
communicate. Apart from the small demographic differences
outlined above, this group represents the general community whose
views are mixed when it comes to migrants, other races and to
indigenous people. It is their attitudes that should prove most
responsive to a community or mass media education campaign.
Those supporting non-racist views (42% of the
sample) The segment supporting none or only one of the racist statements
was over-represented by people:
in metro areas;
in Victoria; aged 35 years or under (particularly those under 24);
with an annual household income over $40,000 per year
(and even more so, over $80,000 per annum);
with a higher level of education (that is, tertiary educated);
Quantitative Research DIMA
EUREKA 30
in part-time or full-time paid work, and/or
living in a household where the main income earner is a
student, home worker or in a white collar occupation.
Although just as likely to support racist statements as their male
counterparts, females aged 55 or over were more likely than their
male counterparts to support none or only one of the racist
statements (females: 39%, males: 61%).
This finding indicates that older females are more likely to support
non-racist views than older males (with the latter more likely to be
fence-sitters).1
Detailed demographic profiles of the three segments are also
provided in Appendix 5 in tabular form and the reader is directed to
these for a greater understanding of how the results outlined above
were arrived at.
4.7 Shared values
To test some of the hypotheses arising from the qualitative
research, the survey also involved exploration of the values shared
by Australian society. In this task, respondents were read out seven
values and asked:
whether each was currently shared by Australians, and if so
1One should also consider the possibility that there may be more young people in metro areas
than rural areas. Were this the case, it would be age, rather than a rural location, that may be driving racist attitudes. Whilst sub-analysis revealed that there were proportionally more young people in metropolitan areas than non-metro areas, it was not possible to determine whether location or age are stronger determinants of racist attitudes (as the total sample contained only a small number of young non-metro dwellers).
Quantitative Research DIMA
EUREKA 31
the degree to which the value was shared, and
whether the values make Australia a better place to live than
other countries.
This investigation was undertaken to evaluate whether shared
values could form the basis of the campaign and if so, which values
had the greatest support in the community ... and hence the
greatest chance of succeeding in promoting harmony and
addressing racist attitudes.
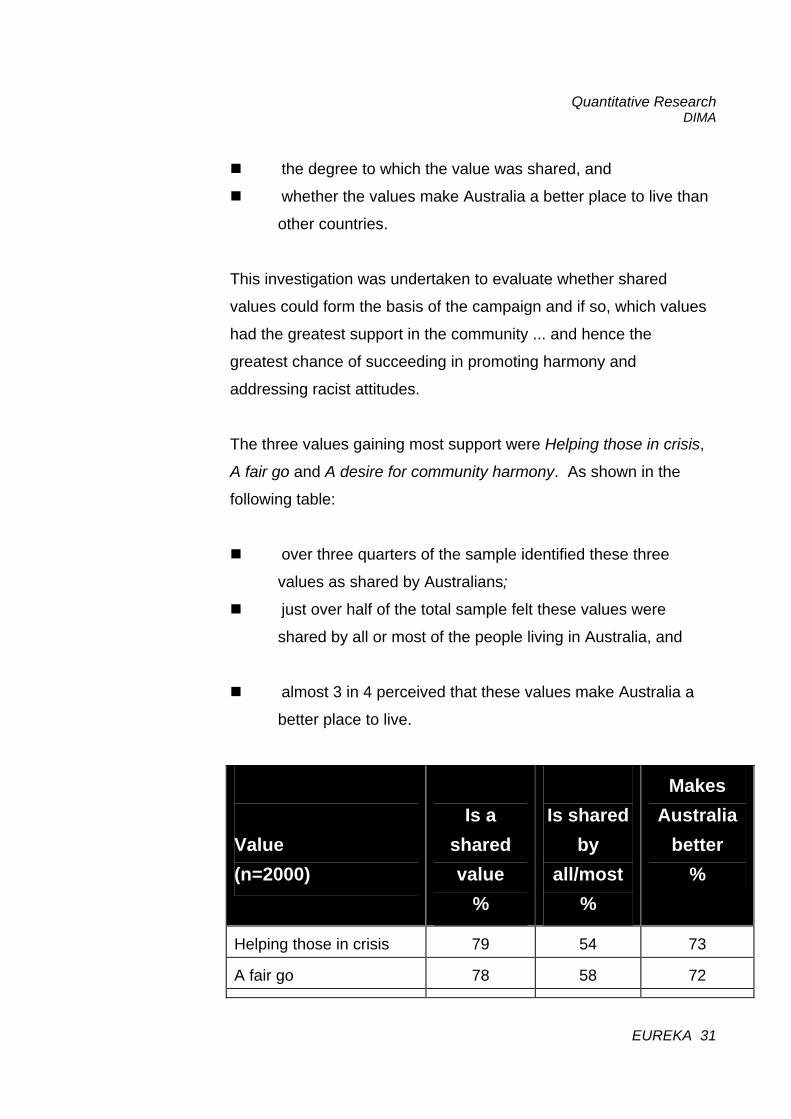
The three values gaining most support were Helping those in crisis,
A fair go and A desire for community harmony. As shown in the
following table:
over three quarters of the sample identified these three
values as shared by Australians;
just over half of the total sample felt these values were
shared by all or most of the people living in Australia, and
almost 3 in 4 perceived that these values make Australia a
better place to live.
Value (n=2000)
Is a shared value
%
Is shared by
all/most %
Makes
Australia better
%
Helping those in crisis
79
54
73
A fair go
78
58
72
Quantitative Research DIMA
EUREKA 32
Value (n=2000)
Is a shared value
%
Is shared by
all/most %
Makes
Australia better
%
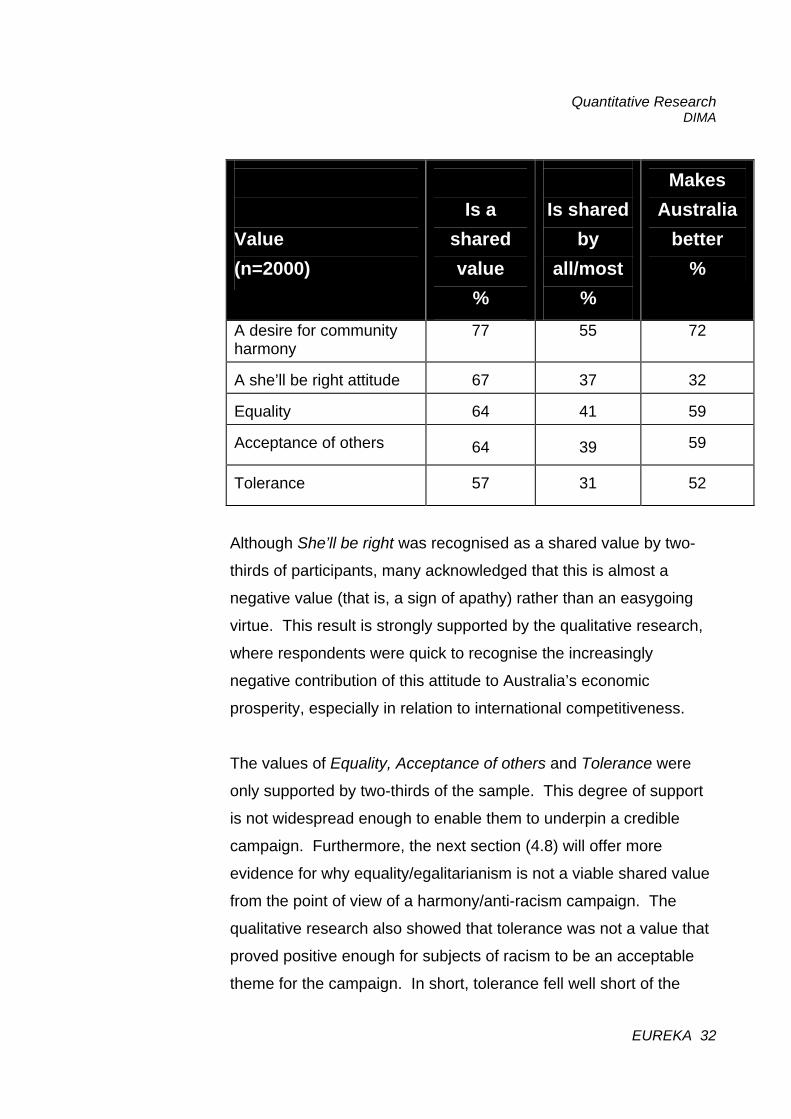
A desire for community harmony
77 55 72
A she’ll be right attitude
67
37
32
Equality
64
41
59
Acceptance of others
64
39
59
Tolerance
57
31
52
Although She’ll be right was recognised as a shared value by two-
thirds of participants, many acknowledged that this is almost a
negative value (that is, a sign of apathy) rather than an easygoing
virtue. This result is strongly supported by the qualitative research,
where respondents were quick to recognise the increasingly
negative contribution of this attitude to Australia’s economic
prosperity, especially in relation to international competitiveness.
The values of Equality, Acceptance of others and Tolerance were
only supported by two-thirds of the sample. This degree of support
is not widespread enough to enable them to underpin a credible
campaign. Furthermore, the next section (4.8) will offer more
evidence for why equality/egalitarianism is not a viable shared value
from the point of view of a harmony/anti-racism campaign. The
qualitative research also showed that tolerance was not a value that
proved positive enough for subjects of racism to be an acceptable
theme for the campaign. In short, tolerance fell well short of the
Quantitative Research DIMA
EUREKA 33
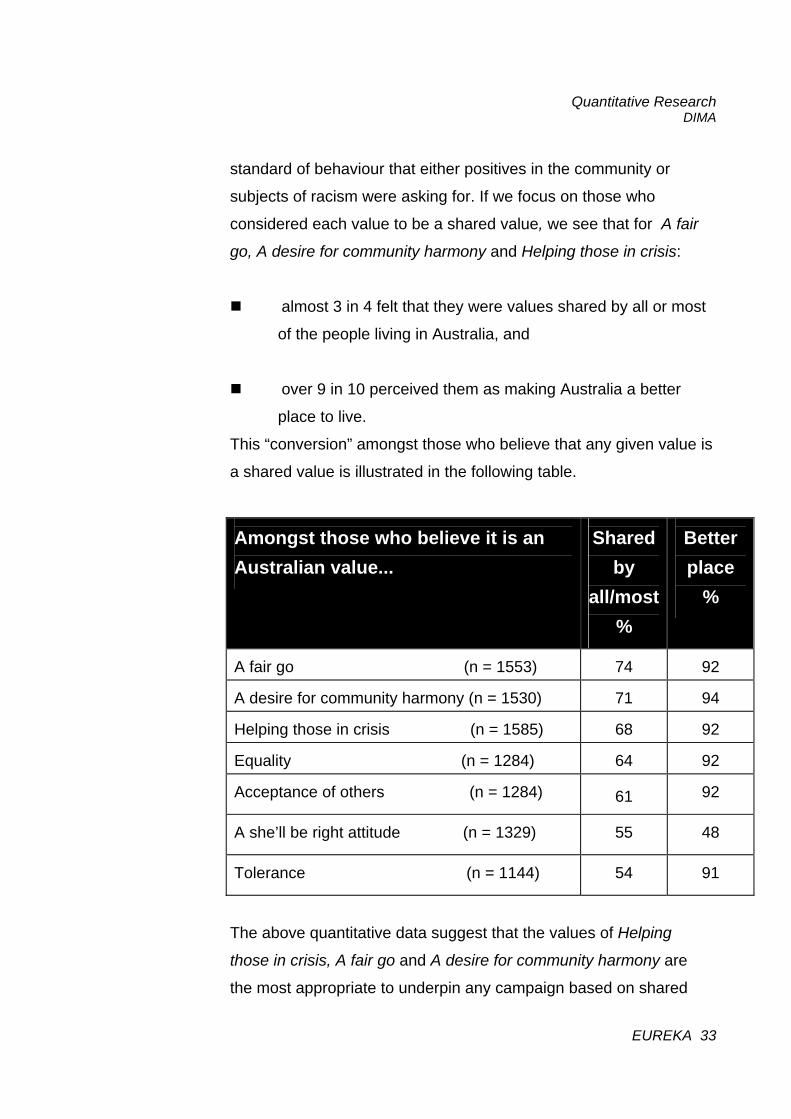
standard of behaviour that either positives in the community or
subjects of racism were asking for. If we focus on those who
considered each value to be a shared value, we see that for A fair
go, A desire for community harmony and Helping those in crisis:
almost 3 in 4 felt that they were values shared by all or most
of the people living in Australia, and
over 9 in 10 perceived them as making Australia a better
place to live. This “conversion” amongst those who believe that any given value is
a shared value is illustrated in the following table.
Amongst those who believe it is an Australian value...
Shared
by all/most
%
Better place
%
A fair go (n = 1553)
74
92
A desire for community harmony (n = 1530)
71
94
Helping those in crisis (n = 1585)
68
92
Equality (n = 1284)
64
92
Acceptance of others (n = 1284)
61
92
A she’ll be right attitude (n = 1329)
55
48
Tolerance (n = 1144)
54
91
The above quantitative data suggest that the values of Helping
those in crisis, A fair go and A desire for community harmony are
the most appropriate to underpin any campaign based on shared
Quantitative Research DIMA
EUREKA 34
values because they have the greatest pre-existing support within
the community. On the basis of the qualitative research, however,
Eureka advises against using the values of Helping those in crisis or
A fair go.
Indeed, when focus group participants discussed the theme of
helping those in crisis, some participants openly questioned whether
people of certain backgrounds help others, indicating for example,
that they doubted “... you’d ever see an Asian bush firefighter”.
Furthermore, this theme was perceived by some as pleading or as a
theme focusing on the down-and-out and appropriate for a charity
rather than a country.
Likewise, A fair go is likely to have negative repercussions as a
campaign theme because some interpret A fair go as equality. In
fact, many of the focus group participants supported the theme of A
fair go but perceived this as impossible as long as minority groups
are “running the country” or “getting more than their fair share”.
Eureka suggests that the theme of A desire for harmony would be
the easiest to communicate to the general public in a credible and
effective manner. Indeed, this value was equally perceived as a
shared value across people of different:
gender (Males: 77%, Females: 76%)
age (under 45 years: 78%, over 45 years: 74%)
education (secondary school or less: 76%, higher education:
77%, other 84%)
work status (Full-time: 78%, Part-time: 78%, Not in paid
work: 74%) and main income earner occupation (blue collar:
Quantitative Research DIMA
EUREKA 35
76%, white collar: 77%, not in workforce: 76%, student/home
location (metro areas: 76%, non-metro areas: 78%).
Whilst this value did gain widespread support, participant reaction
did vary according to participants’ household income. Those with a
low annual household income were less likely to nominate A desire
for community harmony as a shared value (Under $40,000: 74%,
$40,000 or more: 79%, other: 80%). Hence, if this theme is used,
particular attention will need to be paid when developing and
conducting the campaign to ensure it effectively targets this low-
income segment of the community.
4.8 Perceptions of harmony
In order to more precisely understand the community’s reactions to
a possible harmony theme, a number of further statements were
presented to respondents specifically on this theme and they were
once again asked whether they agreed or disagreed with the
sentiments expressed. The quantitative research showed that
almost all participants supported the sentiment that people in
Australia should strive for community harmony (98%). The
majority also supported other positive statements concerning
harmony within Australia’s society, as shown in the table below.
Quantitative Research DIMA
EUREKA 36
Statement (n=2000)
Agree
%
Disagree
Refused/ Don’t know
Community harmony is something we should strive for in Australia
98
2
-
Compared with other countries, Australians live in harmony with one another.
86
11
3
In Australia, people from many cultures co-exist peacefully...and this is something we should be more proud of
86
12
2
Compared to other nations, Australia has absorbed its migrants in a very harmonious way
77
18
4
One of the great things about Australia is the fact that people from so many different cultures live together in harmony
77
21
2
These results indicate that the vast majority of the community
already perceives Australia as having a harmonious society .
Furthermore, most feel that this achievement should be celebrated
more. These findings suggest that an anti-racism campaign based
on a theme of harmony could be credibly built on pre-existing
attitudes. That is, using harmony as an entry-point (with which most
people agree) and building into it messages about non-racist
behaviours and standards of behaviour that support a harmonious
community.
Quantitative Research DIMA
EUREKA 37
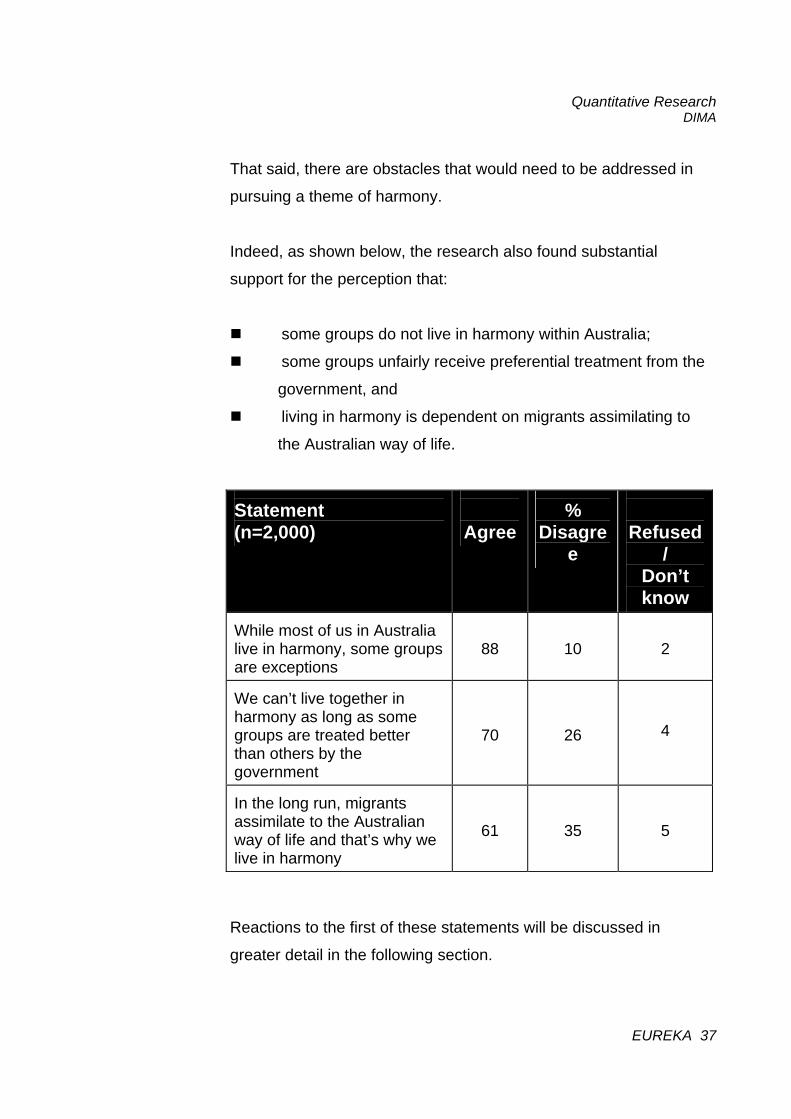
That said, there are obstacles that would need to be addressed in
pursuing a theme of harmony.
Indeed, as shown below, the research also found substantial
support for the perception that:
some groups do not live in harmony within Australia;
some groups unfairly receive preferential treatment from the
government, and
living in harmony is dependent on migrants assimilating to
the Australian way of life.
Statement (n=2,000)
Agree
%
Disagree
Refused/
Don’t know
While most of us in Australia live in harmony, some groups are exceptions
88
10
2
We can’t live together in harmony as long as some groups are treated better than others by the government
70
26
4
In the long run, migrants assimilate to the Australian way of life and that’s why we live in harmony
61
35
5
Reactions to the first of these statements will be discussed in
greater detail in the following section.
Quantitative Research DIMA
EUREKA 38
What the first of the two remaining statements shows is that the
majority of the adult Australian population does think that some
groups in the community are treated better than others. There is
support then for the idea that this is not an equitable society and
that those who “shout loudest get the most,” a view strongly
supported by comments people made in the qualitative research.
Any education campaign in this sphere must therefore avoid
references to equality because the majority of the population would
be dismissive of such an approach in light of their firmly held
assumptions about favourable treatment of some groups.
4.8.1 Groups perceived as not living in harmony in
Australia
Participants who agreed with the statement While most of us in
Australia live in harmony, some groups are exceptions were also
asked which groups they had in mind as exceptions. As shown in
the following table, Aboriginals, Asians and more specifically,
Vietnamese people, were most commonly described as groups not
living in harmony within Australia.
Of those who said some groups are exceptions to the living in harmony rule ... (n = 1760)
%
Nominate group
Aborigines/Aboriginals
22
“Asians”’
20
Vietnamese
10
Migrants/”ethnics”
6
Those who won’t assimilate
5
Middle Eastern
4
Quantitative Research DIMA
EUREKA 39
Of those who said some groups are exceptions to the living in harmony rule ... (n = 1760)
%
Nominate group
Racists 4 Pauline Hanson
3
Muslims
3
Italians
2
Greeks
2
Poor and underprivileged
2
Lebanese
2
Chinese
2
Turkish
1
Europeans
1
Unions
1
The table above indicates that any campaign based on a theme of
harmony will need to enhance the public’s perception that particular
minorities are living in harmony within Australia and, that, in
conjunction with others living in Australia, they are striving for even
greater community harmony. These goals can be achieved by
demonstrating in the campaign that “visibly different” people of
different ethnic and religious groups are living in harmony with
Anglo-Australians and indigenous people (and vice versa). Clearly,
this is an addressable issue because the majority of the adult
population does not see any one group as living in disharmony with
the rest of the community. For example, whilst 22% nominate
Aboriginals as such a group, the majority (78%) do not feel this way
about the indigenous community.
Quantitative Research DIMA
EUREKA 40
5 Conclusions
5.1 Possible communication “bridges”
Given the broad-based community support for statements regarding
harmony, this research has identified several possible
communication “bridges” which can be used to develop an effective
anti-racism campaign based on a harmony theme. Indeed, the
campaign should build on strong public support for the beliefs that:
in comparison to other countries, community harmony
already exists in Australia;
this sense of harmony is worth protecting, and
is worthy of more celebration.
The last of these views is also strongly supported by the findings of
the qualitative research.
Those groups which are perceived as exceptions to harmony within
Australia should be explicitly promoted by the campaign as
harmonious ... with examples of their cooperation within the wider
community. Furthermore, by convincingly emphasising the widely
held view that community harmony is desirable, the campaign
should implicitly (i.e., by implication only) aim to portray people
with negative views as extremists, as disharmonious and as a
minority (which they are).
Eureka also recommends that the campaign address the fears that
were expressed in the qualitative research that some migrants lack
Quantitative Research DIMA
EUREKA 41
long-term commitment to Australia. We suggest achieving this by
redefining the ingroup (that is, redefining “us”) as anyone committed
to Australia and its values. This definition of an Australian was
almost universally supported in the quantitative research, even by
the ardent racists. It is also consistent with the findings of the
qualitative research where negative attitudes toward “outgroups”
were effectively shifted once the latter’s commitment to the country
was demonstrated. This approach will act to shift the perception of
what constitutes an Australian away from a race/religion-based
definition. In turn, such a change will contribute both to reducing the
level of expressed racism and to promoting greater (outward)
harmony.
The campaign should then demonstrate the commitment that
minorities (particularly those perceived as obstacles to harmony)
have to Australia. However, it is imperative that the messages of
commitment and harmony are conveyed in a positive and subtle
manner so that the campaign does not appear to portray migrants,
minorities or indigenous people as pleading for understanding or as
pleading to racists to abandon racism. This is a question of subtlety
and an issue that further research will need to address as campaign
messages (and themes or “executions”) are refined and tested.
The quantitative research showed that the views toward indigenous
people were more extreme and more widespread than those
expressed toward migrants. The qualitative research did not lead
us to believe that the difference would be so stark and so
significant. In particular, the negative stereotypes and myths about
this community group were found to have wide support in the
quantitative research.
Quantitative Research DIMA
EUREKA 42
The misinformation about Aboriginal and Torres Strait Islander
people is so widely believed that we recommend not only taking an
emotional approach to the issue but also using any rational
information-based messages that are available. Whilst this
approach may have a limited impact on a small proportion of the
misinformed, it will serve to question some of the negative views
based solely on misinformation about the ATSI community.
In other words, the quantitative research leads us to believe that a
sufficient proportion of negative views toward indigenous people is
based on pure misinformation as to warrant adding an information
arm to the campaign where messages touch on this community
group. We also advocate public relations projects `which provide
accurate information concerning the assistance provided to the
indigenous community, the eligibility criteria for such assistance and
the need for affirmative action policies.
5.2 Do we target the segment holding the most racist views?
As noted earlier, the findings of this quantitative survey indicate that
the Australian public can be segmented into three groups in terms
of their likelihood of expressing racist views. These three groups:
those supporting non-racist views, fence-sitters and those
supporting numerous racist views can be thought of as lying along a
racism continuum.
For any campaign aimed at attitudinal and/or behavioural change,
there will be a component of the broad target audience who will not
be receptive or open to significant changes in attitude. That is,
Quantitative Research DIMA
EUREKA 43
there will be an extremist segment of the audience who will not
undergo attitudinal and behavioural change as result of direct
exposure to the campaign.
In this case, the segment at the negative extreme are unlikely to
undergo a change in racist attitudes and behaviour as a result of
direct exposure to an anti-racism campaign (whatever its theme).
On this basis, it could be argued that the anti-racism campaign
should abandon these “unwinnables” and focus on reducing the
racist attitudes of fence-sitters and promoting the positive attitudes
of those who support non-racist views.
To a degree, Eureka advocate this focused approach. Indeed, we
feel that the campaign should focus on directly:
reducing the ambivalence of fence-sitters so that they are
less likely to hold (and hence, express) racist views and
perform racist behaviours, and
promoting and reinforcing the non-racist attitudes of the
largest segment of the community, those supporting non-
racist views.
In our opinion, targeting these two segments directly will create a
social climate of anti-racist sentiment which will indirectly reduce
the expression of racist attitudes and racist behaviours by the racist
segment (rather than actually change their attitudes).
5.3 Why a subtle campaign is recommended
It is crucial that the message of this campaign is conveyed in a
Quantitative Research DIMA
EUREKA 44
subtle manner. Indeed, a “head-on” campaign will be firmly rejected
both by fence-sitters and by those supporting numerous racist views
because they see their attitudes and behaviour as justified and as
non-racist. The pervasiveness of such justification is supported by
the finding that 15% of the community do not even perceive
everyday racist acts as racism. Anything directly confronting the
mindset of those supporting many racist views is only likely to
further polarise their views in the direction opposite to that desired.
Further, as the experience of fence-sitters is such that they
experience and are witnesses to so few instances of racism, they
too are likely to question the credibility of any message that paints a
picture of the Australian community as one rife with disharmony and
racist acts.
In fact, the qualitative research revealed that both the “negatives”
and some fence-sitters have come to resent political correctness to
varying degrees. Not only do they feel that immigration,
multiculturalism and Aboriginal assistance is continuing unchecked,
they resent that they are not allowed to express their views for fear
of being labelled racist.
A direct anti-racism campaign aimed at fence-sitters which depicts
any form of extreme racism is also likely to be rejected by this
segment. As most of the community have not witnessed extreme
racism, they are likely to feel that any extreme scenes portrayed are
unrealistic and just “hyping up” racism in the community, something
they already accuse the media of doing.
Participants in the qualitative research were also strongly of the
view that the campaign should be apolitical and bipartisan,
supported by all political parties. Furthermore, a large segment of
those supporting many racist views is likely to reject an overt anti-
Quantitative Research DIMA
EUREKA 45
racism campaign as further evidence of “the government pandering
to minority groups.”
5.4 A note re “cultural diversity”
To date, DIMA has vigorously promoted cultural diversity in its
policies as one of Australia’s strengths and advantages. Whilst not
within the brief for this project, the qualitative research discussions
provided valuable insight into public reaction to this term.
The focus group discussions showed that this term will not be an
effective means of promoting the benefits of having many cultures
within Australia. Usage of this term assumes that diversity is, and is
perceived as, a positive by the majority of the community. In reality,
when reacting to possible campaign themes and titles, “diversity”
was often opposed by positives and negatives alike because it was
seen as emphasising the differences between people rather than
the similarities.
In a social climate where assimilation is preferred by many, the
discussions indicated that cultural diversity is perceived as a divisive
rather than unifying description of our society. It is therefore not a
term we would recommend for usage either in an anti-racism or pro-
harmony campaign.
Appendix 1: DIMA Research Brief
Appendix 2: Questionnaire
Appendix 3: Sample demographics
Gender
%
(n=2000) Female
54
Male
46
Age
%
(n=2000) 16-23
11
24-35
22
36-45
24
46-54
16
55 and over
28
Occupation of household’s
main income earner
%
(n=2000) Not in workforce
20
Home duties
1
Full-time student
1
Unskilled Blue collar
12
Skilled Blue collar
14
Lower White collar
35
Upper White collar
15
Refused/Don’t know
2
*Please note that the data in each table may not add to 100% due
to rounding
In paid work?
%
(n=2000) Not in paid work
37
Part-time work
18
Full-time work
45
Total annual household income
%
(n=2000) Under $20,000
18
$20,000 to under $40,000
27
$40,000 to under $80,000
32
$80,000 or over
13
Don’t know
4
Refused
6
Highest education level
achieved
%
(n=2000) No formal education
1
Primary school
9
Secondary school
46
Technical College/ TAFE
15
University
26
Other
3
*Please note that the data in each table may not add to 100% due
to rounding
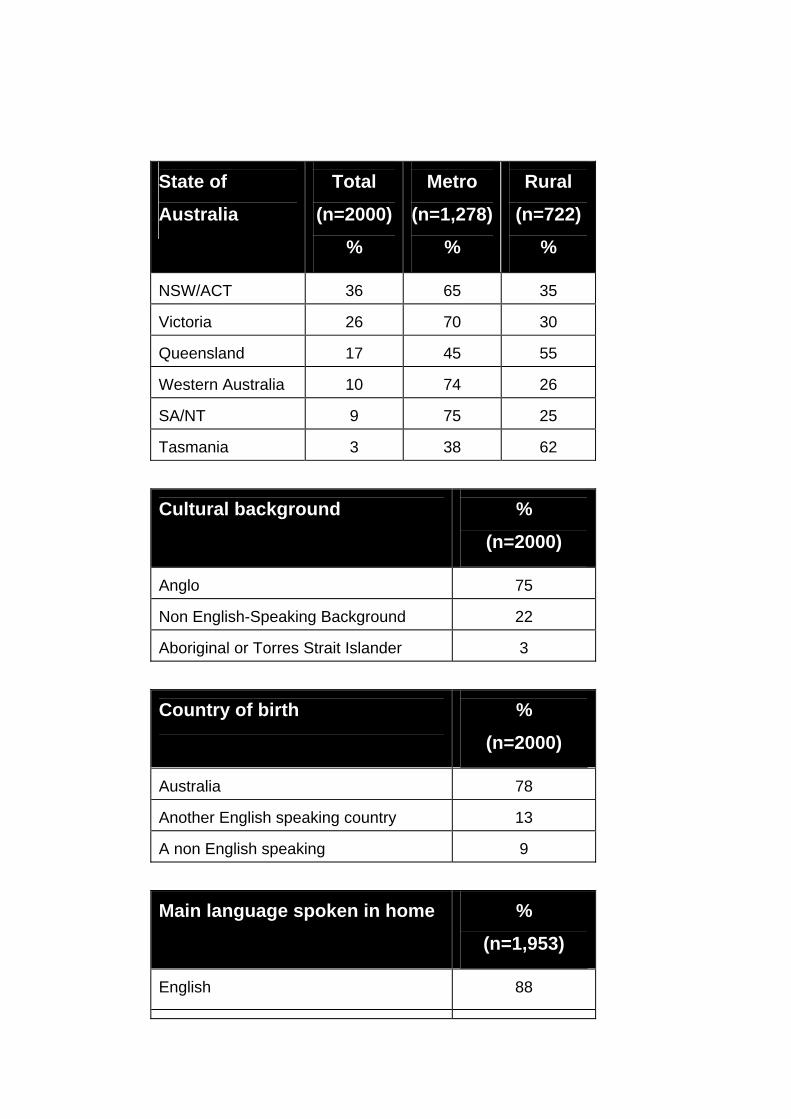
State of
Australia
Total
(n=2000)
%
Metro
(n=1,278)
%
Rural
(n=722)
% NSW/ACT
36
65
35
Victoria
26
70
30
Queensland
17
45
55
Western Australia
10
74
26
SA/NT
9
75
25
Tasmania
3
38
62
Cultural background
%
(n=2000) Anglo
75
Non English-Speaking Background
22
Aboriginal or Torres Strait Islander
3
Country of birth
%
(n=2000) Australia
78
Another English speaking country
13
A non English speaking
9
Main language spoken in home
%
(n=1,953) English
88
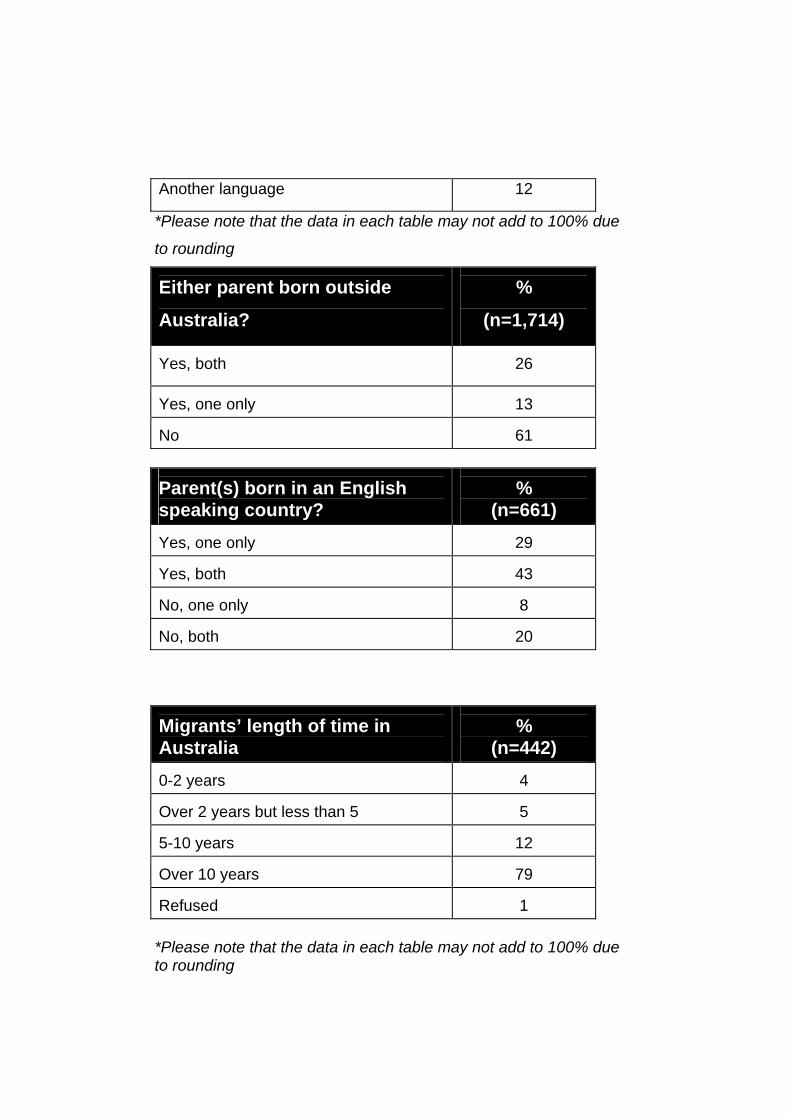
Another language 12
*Please note that the data in each table may not add to 100% due
to rounding Either parent born outside
Australia?
%
(n=1,714) Yes, both
26
Yes, one only
13
No
61
Parent(s) born in an English speaking country?
%
(n=661) Yes, one only
29
Yes, both
43
No, one only
8
No, both
20
Migrants’ length of time in Australia
%
(n=442) 0-2 years
4
Over 2 years but less than 5
5
5-10 years
12
Over 10 years
79
Refused
1
*Please note that the data in each table may not add to 100% due to rounding
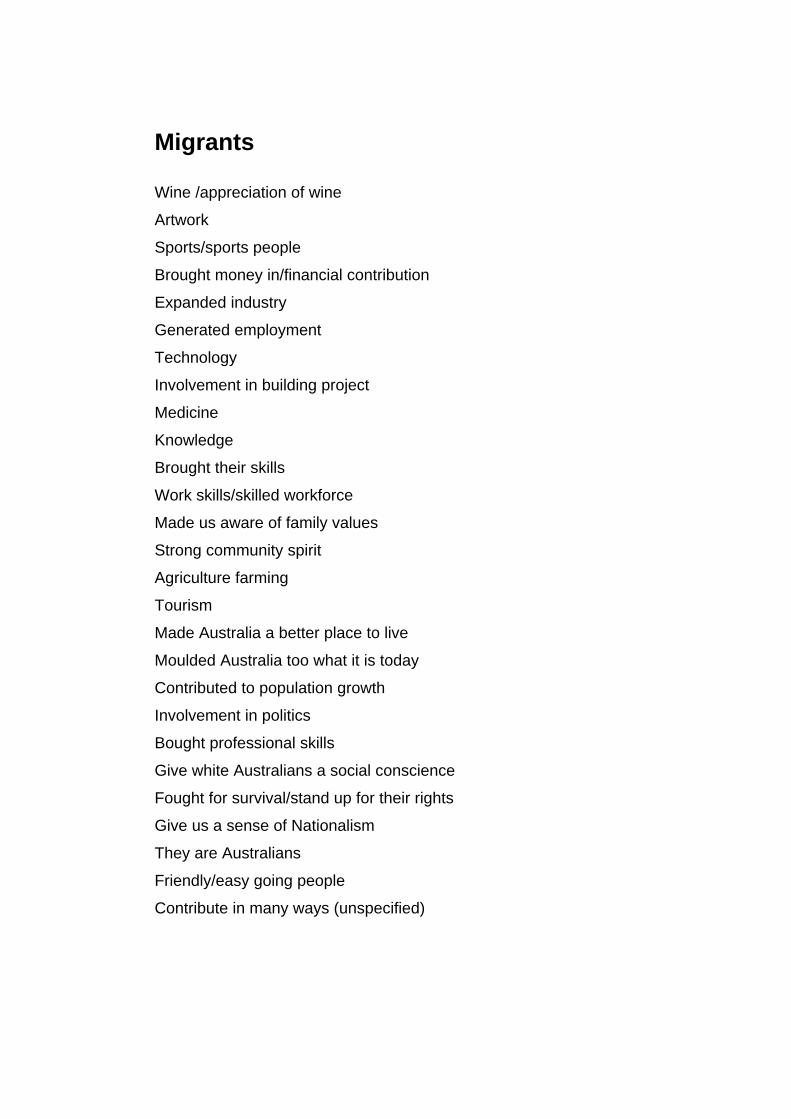
Appendix 4: Contributions of migrants and indigenous people mentioned by fewer than 1% of the
sample
Migrants Wine /appreciation of wine
Artwork
Sports/sports people
Brought money in/financial contribution
Expanded industry
Generated employment
Technology
Involvement in building project
Medicine
Knowledge
Brought their skills
Work skills/skilled workforce
Made us aware of family values
Strong community spirit
Agriculture farming
Tourism
Made Australia a better place to live
Moulded Australia too what it is today
Contributed to population growth
Involvement in politics
Bought professional skills
Give white Australians a social conscience
Fought for survival/stand up for their rights
Give us a sense of Nationalism
They are Australians
Friendly/easy going people
Contribute in many ways (unspecified)
Indigenous people
Made us less European
Willingness to work/hard
Knowledge
Ability to survive in outback
Contribution to outback life
Tourism
Appendix 5: Segment demographics
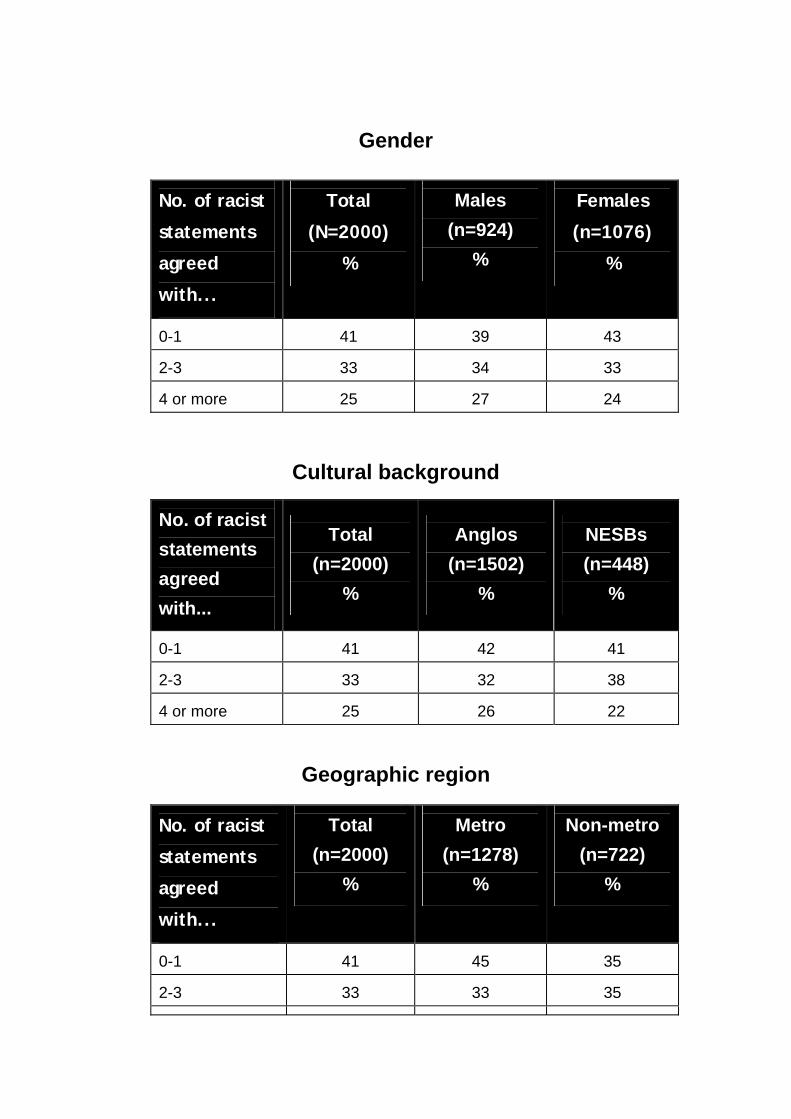
Gender
No. of racist
statements
agreed
with...
Total
(N=2000)
%
Males
(n=924) %
Females
(n=1076)
%
0-1
41
39
43
2-3
33
34
33
4 or more
25
27
24
Cultural background
No. of racist statements agreed with...
Total
(n=2000) %
Anglos
(n=1502) %
NESBs (n=448)
%
0-1
41
42
41
2-3
33
32
38
4 or more
25
26
22
Geographic region
No. of racist
statements
agreed
with...
Total
(n=2000) %
Metro
(n=1278) %
Non-metro
(n=722) %
0-1
41
45
35
2-3
33
33
35
4 or more 26 23 31
*Please note that the data in each table may not add to 100% due to rounding
State
No. of racist statements agreed with...
Australia
(N=2000)
%
WA
(n=190) %
NSW/ ACT
(n=716)
%
QUEENS
LAND
(n=344)
%
TAS
(n=52)
%
VIC
(n=512)
%
SA/NT
(n=186)
%
0-1
41
36
39
44
44
45
44
2-3
33
34
35
29
31
32
39
4 or more
26
31
27
27
25
24
17
Age
No. of racist statements agreed with...
Total
(n=2000) %
Under
24 (n=213)
%
24-35
(n=440) %
36-45
(n=469) %
46-54
(n=317) %
55 or over
(n=557)%
0-1
41
53
47
43
41
31
2-3
33
30
30
37
34
34
4 or more
26
17
23
20
25
35
Annual household income
No. of racist statements agreed with...
Total
(n=2000) %
Under
$20,000(n=368)
%
$20,000
to under
$40,000(n=541)
%
$40,000
to under
$80,000(n=637)
%
$80,000
and over
(n=253) %
Don’t know/ refuse
d (n=201)
% 0-1
41
31
37
46
55
40
2-3
33 32 35 33 30 35 4 or more
25
36
28
21
15
25
*Please note that the data in each table may not add to 100% due to rounding Highest education level completed No. of racist statements agreed with...
Total (n=2000)
%
Secondary school or less
(n=1120) %
Tertiary educated (n=813)
%
Other (n=67)
%
0-1
41
32
54
39
2-3
33
37
28
37
4 or more
25
31
18
24
In paid work? No. of racist statements agreed with...
Total (n=2000)
%
Full-time (n=899)
%
Part-time (n=359)
%
Not in
paid work(n=740)
%
0-1
41
44
46
37
2-3
33
32
33
35
4 or more
25
24
21
29
Occupation of household’s main income earner No. of racist statement
Total (n=2000)
Not in
workforce
Student/ home duties
Blue collar
(n=522)
White collar
(n=989)
s agreed with...
% (n=393) %
(n=82)* %
% %
0-1
41
30
52
30
51
2-3
33
38
22
37
30
4 or more
25
32
26
32
19
*Please note that the data in each table may not add to 100% due to rounding
DIMA - Anti-racism Project #2115
EUREKA 1
Department of Immigration and Multicultural Affairs Anti-Racism Campaign - Quantitative Questionnaire
Introduction Hello. My name is [INTERVIEWER] from Eureka Strategic Research, a public
opinion research company. We are conducting a survey on behalf of the
Australian Government on an important national issue. Please be assured that
we will not ask you any questions of a highly personal nature and that we are
not trying to sell you anything. It is very important that we include your views in
our survey.
I actually need to speak with someone in the household who is aged 16 or over.
(If there is more than one person over 16 in the household, say “I need to
speak with the person whose birthday is next.” If “next birthday” person
unavailable, arrange a convenient call-back time.)
IF RESPONDENT - Continue
IF ANOTHER RESPONDENT - repeat intro.
You can be assured that any information that you give us will be kept
completely confidential. The questions will take no more than 15 minutes of
your time.
[IF QUERIED AT ANY STAGE ABOUT BONA FIDES OF RESEARCH OR ABOUT EUREKA’S CREDENTIALS, INVITE RESPONDENT TO CALL MRSA ENQUIRY LINE ON 1300 36 4830 OR EUREKA ON (02) 9519 2021: Contact Dr Fadil Pedic or Philippa McCafferty.]
1. Values
DIMA - Anti-racism Project #2115
EUREKA 2
Q1.1 It’s often said that Australians share a set of values that make us who we are.
Which of the following values would you say are shared by Australians
nowadays? (READ OUT & ROTATE and allow for Don’t know/Can’t say
answers) To start off, do you think that ... is a value shared by
Australians nowadays?
A SHE’LL BE RIGHT ATTITUDE HELPING THOSE IN CRISIS A DESIRE FOR COMMUNITY HARMONY EQUALITY A FAIR GO TOLERANCE ACCEPTANCE OF OTHERS
Q1.2 For each YES @ Q1.1, ask: And do you think that (READ OUT VALUE) is a value
shared by ALL of the people living in Australia, or MOST or SOME or
ONLY A FEW of the people living in Australia?
Q1.3 For each YES @ Q1.1, ask: And do you think that (READ OUT VALUE) makes
Australia a better place to live than other countries in the world?
2. Harmony
Q2.1 I am going to read out a series of statements, please tell me whether you personally
agree or disagree with each statement.
OK, the first statement is ... [ROTATE]
a. Compared with other countries, Australians live in harmony with one another.
b. While most of us in Australia live in harmony, some groups are exceptions.
c. One of the great things about Australia is the fact that people from so many
different cultures live together in harmony.
d. We can’t live together in harmony as long as some groups are treated better than
others by the government.
e.
DIMA - Anti-racism Project #2115
EUREKA 3
Community harmony is something we should strive for in Australia.
f. In Australia, people from many cultures co-exist peacefully ... and this is something
we should be more proud of.
g. Compared to other nations, Australia has absorbed its migrants in a very
harmonious way.
h. In the long run, migrants assimilate to the Australian way of life and that’s why we
live in harmony.
[AFTER EACH ITEM] Do you agree or disagree with that statement? Is that strongly or
mildly?
Q2.2 If agree (strongly or mildly) @ Q2.1b above, ask: When you agreed that (READ
OUT b. above), which groups in particular did you have in mind?
(OPEN-ENDED QUESTION)
Q2.3 This is probably the hardest question I’ll ask you today, so please take a moment to
reflect on it. What’s the single best contribution that ...
(READ OUT AND ROTATE)
a. migrants
b. Indigenous people
... have made to Australia? (OPEN-ENDED QUESTION)
(PLEASE DISTINGUISH BETWEEN A “DON’T KNOW” AND “NIL” RESPONSE TO THIS
QUESTION)
3. Attitudes
DIMA - Anti-racism Project #2115
EUREKA 4
Q3.1 I am again going to read out a series of statements. Please tell me if you
personally agree or disagree with each statement.
OK, the first statement is ... [ROTATE]
a. Migrants are no more likely to commit crimes than other Australians.
b. Migrants bring all sorts of diseases with them to Australia.
c. What I really hate is when migrants all live together and form ethnic ghettos.
d. These days, Asian migrants are taking jobs from Australians.
e. An Australian is anyone committed to Australia, it doesn’t matter where you were born.
f. Moslems have strange ways and will not really fit into the Australian community.
g. Migrants create jobs for other Australians.
h. Most Aborigines are lazy and so have to rely on government handouts to survive.
[AFTER EACH ITEM] Do you agree or disagree with that statement? Is that strongly or
mildly?
4. Definition & Explanations
Q4.1 Next, I would like you to think about racism. Racism can be defined in a
number of different ways. If there were only two possible
definitions, which of these would you agree with more? (READ
OUT AND ROTATE)
a. Racism involves only extreme acts, such as physical violence against people of other
races.
OR
b. Racism includes everyday acts such as calling people of other races names, or being
rude or abusive to them.
DIMA - Anti-racism Project #2115
EUREKA 5
Q4.2 I am again going to read out four statements. Please tell me if you
personally agree or disagree with each statement.
OK, the first statement is ... [ROTATE]
a. Racist people are just ignorant and uneducated.
b. Sometimes people are racist just because they fear losing their jobs, housing or
university places to migrants.
c. Asians cause crime and bring drugs into Australia, that’s why everybody is against
them.
d. When I think about the things that migrants and Aboriginals are doing to this country,
it’s not hard to see why some people are racist towards them.
[AFTER EACH ITEM] Do you agree or disagree with that statement? Is that strongly or
mildly?
5. Demographics
Q5.1 Location: record State/Territory and metro/regional/rural.
Q5.2 Record gender
MALE
FEMALE
Thanks for all that. Before you go, I’d like to ask you a few more questions to ensure that
we have spoken to a good cross-section of people.
Q5.3 First, what is your age? (PRE-CODES BELOW)
UNDER 24
24-35
DIMA - Anti-racism Project #2115
EUREKA 6
36-45
46-54
55 AND OVER
Q5.4 What is the highest level of education that you have completed to date?
(PRE-CODES BELOW)
NO FORMAL EDUCATION PRIMARY SCHOOL SECONDARY SCHOOL TECHNICAL COLLEGE (TAFE) UNIVERSITY
Q5.5 Do you work in full time employment, part time employment or are you not in
paid work? (PRE-CODES BELOW)
FULL TIME
PART TIME
NOT IN PAID WORK
Q5.6 Thinking about the main income earner in your household, what is their
occupation and position or job title? (PROBE FULLY AND USE
NCS PRE-CODES)
Q5.7 And what about the total annual income of your household before tax)? Is it
above or below $40,000? (before tax). In which of these ranges
does it fall?
LESS THAN $20,000
$20,000 to under $40,000
$40,000 to under $80,000
$80,000 OR OVER
DIMA - Anti-racism Project #2115
EUREKA 7
Q5.8 Do you consider yourself to be an Aboriginal OR a Torres Strait Islander?
NO - Continue YES - Skip to section 6
Q5.9 Were you born in Australia?
YES - skip to Q5.13 NO
Q5.10 In total, how long have you been living in Australia?
(RECORD IN WHOLE YEARS ONLY)
Q5.11 Were you born in a country where English is the main language?
YES NO
Q5.12 Is a language other than English the main language spoken in your
household?
YES - skip to 6 NO
Q5.13 Were either of your parents born outside Australia?
YES - ONE ONLY YES - BOTH NO - skip to 6
DIMA - Anti-racism Project #2115
EUREKA 8
Q5.14 [Were your parents][Was this parent] born in an English-speaking country?
YES - ONE PARENT YES - BOTH PARENTS NO - ONE PARENT NO - BOTH PARENTS
6. Sign-off
That’s the end of the interview. Please note that the statements I asked you to
comment on are not necessarily my views or the views of the research company.
Those were simply some things other people have said and we wanted to know if you
agreed with them. Your answers will be combined with those of other people and will
be used to help the Commonwealth Government to develop a campaign to promote
unity and harmony in the Australian community. Thank you for your time and