51
The applicability of the SUR measurement for ultrafiltration of WWTP effluent

The applicability of the SUR measurement for
ultrafiltration of WWTP effluent
Copyright © by A.N. Janssen
Printed: Gildeprint drukkerijen Enschede
ISBN/EAN: 978-90-8957-020-8
Published and distributed by Arie Janssen
E-mail: [email protected]
Front site cover: ultrafiltration module
Back site cover: overflow final clarifier of wastewater treatment plant
Source cover photos: Evides Industriewater
All rights reserved. This book or parts thereof, may not be reproduced in any form or by any
means, electronic or mechanical, including photocopying, recording or any information
storage and retrieval system now known or to be invented, without written permission from
the publisher.
The applicability of the SUR measurement for
ultrafiltration of WWTP effluent
Proefschrift
ter verkrijging van de graad van doctor
aan de Technische Universiteit Delft,
op gezag van de Rector Magnificus prof. ir. K.C.A.M. Luyben,
voorzitter van het College voor Promoties,
in het openbaar te verdedigen op vrijdag 18 februari 2011 om 12.30 uur
door Arie Nelis JANSSEN
landbouwkundig ingenieur
geboren te Lisse.

Dit proefschrift is goedgekeurd door de promotor:
Prof. ir. J.H.J.M. van der Graaf
Samenstelling promotiecommissie:
Rector Magnificus, voorzitter
Prof. ir. J.H.J.M. van der Graaf, Technische Universiteit Delft, promotor
Prof. dr. ir. B. van der Bruggen, Katholieke Universiteit Leuven
Prof. dr. ir. J.B. van Lier, Technische Universiteit Delft
Prof. dr. ir. W.G.J. van der Meer, Universiteit Twente
Dr. ir. P.-J. Remize, Veolia Environnement Recherce & Innovation
Prof. dr. ir. W.H. Rulkens, Wageningen Universiteit
Prof. dr. T. Wintgens, University of Applied Sciences Northwestern Switzerland
Prof. ir. J.C. van Dijk, Technische Universiteit Delft, reservelid
Dit proefschrift is tot stand gekomen met financiële ondersteuning van Evides Industriewater,
Rossmark Waterbehandeling (Veolia Water Solutions & Technologies), Witteveen+Bos en
Veolia Environnement Recherce & Innovation.

Table of contents
vii
Table of contents
Voorwoord v
1 Introduction
1.1 Development of wastewater treatment 1
1.2 Reclaiming water from WWTP effluent 3
1.3 Membrane filtration 5
1.4 Ultrafiltration definitions 10
1.5 Background of this thesis 12
1.6 Aim of this thesis 13
1.7 Outline 14
References 15
2 Wastewater treatment plant effluent and membrane filtration
2.1 Introduction 17
2.2 Wastewater treatment plant effluent 17
2.3 Membrane fouling 21
2.4 Factors affecting fouling 24
2.5 Fouling indicators and predictions 36
2.6 Summary 40
References 41
3 Research methodology
3.1 Introduction 45
3.2 Research locations 4
3.3 Specific Ultrafiltration Resistance 61
3.4 Fractionation 66
3.5 Physical-chemical analyses 69
References 71
4 Filtration properties and performance of ultrafiltration installations
4.1 Introduction 73
4.2 The SUR values of feedwater and the operational flux of an ultrafiltration
installation 74
4.3 The SUR value of feedwater and the increase of filtration resistance of an
ultrafiltration installation 86
4.4 Evaluation 92
4.5 Conclusions 93
References 94
Table of contents
viii
5 Filtration properties and pretreatment
5.1 Introduction 95
5.2 Powdered Activated Carbon 96
5.3 Granulated Activated Carbon Filter 111
5.4 Multi Media Filter 118
5.5 1-STEP®
Filter 126
5.6 Evaluation 133
5.7 Conclusions 137
References 138
5 Application of the SUR measurement in practice: A case study
6.1 Introduction 141
6.2 Filterability and foulants of WWTP effluent after secondary clarifier and
stabilized WWTP effluent 142
6.3 Performance of the pretreatment steps 147
6.4 Performance of the ultrafiltration membrane units 159
6.5 Evaluation 162
6.6 Conclusions 163
References 164
6 Filterability and reversibility
7.1 Introduction 165
7.2 Filterability and reversibility during the operation of an ultrafiltration pilot
installation 166
7.3 Filterability and reversibility during lab scale experiments 181
7.4 Evaluation 190
7.5 Conclusions 192
References 193
7 General evaluation
8.1 Introduction 195
8.2 Process performance of ultrafiltration installations 195
8.3 Pretreatment of ultrafiltration feedwater 202
8.4 Recommendations and general conclusions 209
References 212

Table of contents
ix
Appendices
A Ultrafiltration pilot installation and membrane properties 215
B Polysaccharides and proteins 219
Summary 221
Samenvatting 225
Curriculum Vitae 229
List of publications 231


Introduction
1
1 Introduction
1.1 Development of wastewater treatment
There have been a lot of changes in wastewater treatment in the Netherlands since the mid-
20th
century. In the period 1960 – 1970 governmental and public awareness led to the
introduction of the first part of Dutch environmental legislation, the Pollution of Surface
Water Act (Wet Verontreiniging Oppervlaktewater, WVO). Here the focus was on the
removal of oxygen consuming substances (ammonia and biodegradable organics). Later in the
80s – 90s the objective changed to the removal of nutrients (nitrogen and phosphorus) in order
to decrease eutrophication of receiving water bodies. A modern wastewater treatment plant
(WWTP) is now able to remove most nutrients up to the parts per million (ppm) level.
Nowadays, new treatment methods and developments to remove heavy metals and organic
micro pollutants from WWTP effluent are under investigation. Recently, studies have shown
environmental effects linked to the discharge of organic micro pollutants, such as feminisation
of male fish and deformation of aquatic animals (Routledge, et al., 1998; Jobling, et al.,
2002). In an attempt to counter the unwanted presence of organic micro pollutants in the
surface water, the European Water Framework Directive (WFD) was adopted in the year
2000. The WFD aims at a good ecological and biological status for all surface waters, coastal
waters, transitional waters and groundwater in Europe by 2015. In total 33 components
(nutrients, biological parameters, pesticides, heavy metals, hormone disrupters and medicinal
substances) are listed in the WFD as priority compounds. Most likely, it will lead to stricter
discharge limits for those 33 priority compounds at WWTPs. In addition to those 33 priority
substances, new discharge limits will also be established for ‘relevant area-specific’
substances (STOWA, 2005).
In addition to the stricter standards the WFD encourages the integration of water reuse1
options in an integrated approach of water resource management (Bixio and Wintgens, 2006).
In this approach WWTP effluent is considered as a water source rather than a waste stream to
augment water supply and to decrease the impact of human activities on the environment. In
principle, WWTP effluent can be used for any purpose as long as adequate treatment is
provided to meet the water quality for the intended use (Asano, 2002). For adequate treatment
of WWTP effluent more advanced treatment methods are needed after the biological
treatment. Therefore, nowadays the focus in wastewater treatment is changed to advanced
treatment techniques to reclaim water from WWTP effluent and to meet future standards. In
Table 1.1 an overview of advanced treatment techniques is given according to STOWA
(2005).
1 In this thesis water reuse refers to the use of treated wastewater for beneficial purposes such as agricultural
irrigation and industrial cooling, while wastewater reclamation refers to the treatment or processing of
wastewater to make it reusable. Reclaimed water is a treated effluent suitable for an intended water reuse
application.

Chapter 1
2
Table 1.1 – Overview of advanced techniques to treat WWTP effluent
Technique Description Biological techniques Membrane bioreactor (MBR)
An activated sludge system in which the sludge/water separation step takes place via membrane filtration instead of secondary clarifiers.
Advanced nitrogen removal
Removal of nitrogen molecules by nitrification and/or denitrification biomass in the form of a biofilm.
Advanced removal of organic contaminants
Biological removal of organic components by (1) physical/chemical bounding to biomass, (2) active uptake of dissolved organics by biomass and (3) degradation in the cells of biomass.
Pond treatment systems Man made copies of natural wetland systems to exploit the treating processes (filtration, predation, biological removal nutrients, etc.) that occur in these systems.
Oxidative techniques Oxidisation processes
Process to oxidise (complex) organic compounds with the aid of strong oxidants like ozone (O3) and hydrogen peroxide (H2O2).
Advanced oxidisation processes (AOP)
Combination of oxidation processes (O3 – H2O2, O3 – UV and UV – H2O2) that accelerate the oxidation reaction.
Chemical precipitation techniques Precipitation
The settling of ionic contaminants from a solution by the addition of chemicals.
Coagulation/Flocculation The agglomeration of small particles to large flocs, caused by the use of coagulants such as ferric and aluminium chloride.
Coagulation/Flocculation in combination with suspended solids removal
The combination of coagulation, floc-formation and filtration (sand, membrane, etc.) to remove suspended particles and colloidal matter.
Adsorption techniques Activated carbon
The bonding of non-polar organic compounds due to Van der Waals forces.
Ion exchange Bonding of ions to specific charged groups on the surface of a synthetic resin.
Bed filtration
The separation of particles from the water phase, while water flows through the pores in between the filter bed granules. The particles are removed by sieving, adsorption to the filter medium and settling onto the medium.
Screen- and membrane filtration
This type of filtration works by passing water through a filter of a defined pore size. In section 1.3 a more detailed description of this technique is given.
Disinfection
Destruction of micro organisms and the removal of viruses by filtration, physical disinfection (UV) and chemical disinfection (chlorine, ozone and AOP).
Integrated treatment techniques
Techniques that are added to or combined with conventional activated sludge systems like MBR, dosage of powdered activated carbon (PAC) in activated sludge process, etc..

Introduction
3
1.2 Reclaiming water from WWTP effluent
Over the past two decades, the amount of municipal wastewater recovered has increased
throughout the world (Levine and Asano, 2004). In 2004, Bixio et al. reported that worldwide
over 3000 (municipal) wastewater reclamation sites existed. Especially in regions of the world
faced with water scarcity, WWTP effluent is seen as a potential source for water reclamation.
Some examples of water reclamation projects in the world are:
� The Water Factory 21 in Orange County, California (USA) where reclaimed water is
recharged into the aquifer in order to stop salt intrusion. The first facility in operation
since 1976 consisted of a series of treatment steps: flocculation, multi-media filtration,
activated carbon adsorption, reverse osmosis and chlorination. The new facility is called
Advanced Water Treatment (AWT) and has been commissioned in 2004. The AWT is
designed to produce 325,000 m3/d of microfiltration filtrate, among which 265,000 m
3/d
will be further reclaimed with reverse osmosis. The system may even be expanded in the
future to 491,000 m3/d of product water (Bixio and Wintgens, 2006).
� The WWTP Baix Llobregat in Spain where wastewater is collected and treated from the
southern part of Barcelona. Two reclaimed water flows with different qualities are
produced at this plant. One for ecological flow, agricultural irrigation and wetlands and a
second with a better quality for a barrier against seawater intrusion. The process scheme
of the first flow is; regulation basin – flocculation/coagulation – filtration – ultraviolet –
disinfection. The water to be used for the barrier against intrusion is additionally treated
by microfiltration and reverse osmosis to obtain the required quality (Cazzura, 2008).
� The indirect potable use of WWTP effluent is applied in Wulpen (Belgium). Per year
2,500,000 m3 WWTP effluent is infiltrated into the dunes after ultrafiltration, reverse
osmosis and ultraviolet radiation. The purpose of infiltrating WWTP effluent is to reduce
the extraction of natural groundwater for potable water production and hold back the
saline intrusion at the coast. After a residence time of one to two months the water is
recaptured and used for the production of drinking water (van Houtte and Verbauwhede,
2003).
� In Singapore the NEWater Project was implemented to supply industries and augment
freshwater resources with reclaimed water. At the moment 4 water reclamation plants are
in operation with a total capacity of about 95,000 m3/d. The treatment technologies of the
water reclamation plants differ, but the core of all the processes are membranes.
� The US $2.0 billion Western Corridor Recycled Water Project (WCRWP) is part of a
capital works program of the Queensland Government to secure the future water supply
for the region. Treated effluent is collected from WWTPs and further treated at three
advanced water treatment plants incorporating microfiltration, reverse osmosis, advanced
oxidisation and residual disinfection. The project will supply up to 182,000 m3/day of
purified recycled water for industrial and potable purposes (Traves et al., 2008).
� The only direct potable reuse project is operated in Windhoek (Namibia), one of the driest
regions in Southern Africa. About 21,000 m3/day of water (mixture WWTP effluent and

Chapter 1
4
surface water) is produced per day by a complex treatment chain of coagulation, dual
media filtration, ozonation, multi-stage activated carbon adsorption and ultrafiltration
prior to chlorine disinfection (Menge et al., 2007).
� The DECO plant of Evides Industriewater (supplier of industrial water), in the southwest
of the Netherlands (Zeeuws-Vlaanderen). This plant has been in operation since the year
2000 and produces an aggregate of 750 m3/h demineralised water, 750 m
3/h cooling tower
supply water and 1200 m3/h ultra-pure water for the Dow Chemical Company. Part of the
demineralised water is produced from effluent of a local communal WWTP in the vicinity
of the plant. The applied technologies to upgrade the WWTP effluent to demineralised
water are microfiltration followed by reverse osmosis; the design capacity is 2.2 million
m3/year (van Agtmaal et al., 2007).
Considering the given examples it is clear that wastewater can be reused for various purposes
including a whole range of less advanced to more highly advanced purposes. The primary
incentives for implementing water reuse were augmentation of water supplies and/or pollution
abatement (Levine and Asano, 2004). Nowadays on an international scale, direct non-potable
water reuse is currently the dominant mode for agricultural irrigation, industrial cooling
water, river flow augmentation and other applications. In Table 1.2 a summary of the various
possible applications from a global perspective is given.

Introduction
5
Table 1.2 – Categories and description of water reuse applications from a global perspective
according to Asano (2002)
Category Description Agricultural irrigation Use of reclaimed water restricted to agricultural
purposes and worldwide the largest current use.
Landscape irrigation
The second largest user of reclaimed water in industrialised countries and it includes the irrigation of parks, playgrounds, golf courses, etc.
Industrial reuse
The third major use of reclaimed water for a diversity of industries including power plants, pulp and paper and other industries with high rates of water utilisation.
Groundwater recharge
Include groundwater replenishment by assimilation and storage of reclaimed water in groundwater aquifers and the establishment of hydraulic barriers against saltwater intrusion in coastal areas.
Environmental and recreational uses
Involve non-potable uses related to land based water features such as the development of recreational lakes, marsh enhancement and stream flow augmentation.
Non-potable urban uses
Use of reclaimed water for fire protection, air conditioning, toilet flushing, construction water, flushing sanitary sewers, etc.
Indirect or direct potable reuse Potable reuse occurs either by blending in water supply storage reservoirs or by the direct input of reclaimed water into the water distribution system.
1.3 Membrane filtration
1.3.1 Ultrafiltration membranes
Membrane filtration is a treatment process based on the physical separation of compounds
from the water phase with the use of a semi-permeable barrier (membrane). Membranes for
water treatment are pressure driven and can be divided into two categories based on their
sieving mechanism (Mulder, 1996): porous and dense membranes. Porous membranes
processes are microfiltration and ultrafiltration and their separation mechanism is sieving
achieved by the pore size. The distinction between microfiltration and ultrafiltration is based
on the size of the pores. Microfiltration features pore sizes of 100 nanometer (nm) up to a few
micrometers (µm) while the ultrafiltration membranes feature smaller pores, from 1 – 100 nm.
At lower pore size of the ultrafiltration membranes the charge of the membranes might be
active as a separation mechanism as well. Nanofiltration and reverse osmosis are dense
membranes that are able to retain dissolved salts and solids from water. By nanofiltration low
molecular weight components and divalent ions (Ca2+
, Mg2+
, SO42-
, CO32-
, etc.) can be
separated and furthermore monovalent ions (Na+, K
+, Cl
-, NO3
-, etc.) can be rejected by
reverse osmosis. The driving force for porous and dense membrane processes in water

Chapter 1
6
treatment is usually a hydraulic trans membrane pressure (TMP). It is obvious that the
operating TMP of dense membranes is much higher than that of porous membranes. Table 1.3
outlines the typical pore sizes, required operational TMP and removable components of the
different membrane processes for water treatment. It is mentioned that the pore size range
related to each of the membrane processes is not fixed: slight variations can be found in the
literature.
Table 1.3 – Classification of membrane processes with the pore size, pressure and removable
components for water treatment (Mulder, 1996)
Membrane process Pore size (nm) Pressure (bar) Removable component Microfiltration 100 – 1000 0.1 – 2 Suspended solids, bacteria Ultrafiltration 10 – 100 0.1 – 2 Macromolecules, viruses, proteins Nanofiltration 1 – 10 4 – 20 Micropollutants, bivalent ions Reverse osmosis 0.1 – 10 10 – 30 Monovalent ions, hardness
Many WWTP effluent reclamation plants rely heavily on membranes. Bixio and Wintgens
(2006) state that the combination of microfiltration/ultrafiltration and reverse osmosis is the
most applied scheme for the production of high quality water. Reverse osmosis itself has been
used for desalination of WWTP effluent already since 1970 but the combination of
microfiltration/ultrafiltration and reverse osmosis (double membrane system) has been
developed recently. Initially pretreatment of reverse osmosis had been based on technologies
like flocculation, lime clarification, recarbonation, settling and filtration. Compared to these
pretreatment technologies microfiltration and ultrafiltration are superior in removing
suspended solids, bacteria, large macro-molecules and pathogenic organisms, in order to
provide a high quality feedwater to the reverse osmosis system. Although microfiltration and
ultrafiltration are operated under similar process conditions, they differ in pore size
characteristics (see Table 1.3). Ultrafiltration membranes are able to reject viruses completely
where microfiltration does not. Also in the combination with reverse osmosis membrane
differences are found. Kim et al., (2002) present lower operating pressures and longer
cleaning intervals when reverse osmosis membranes are fed with ultrafiltration filtrate instead
of microfiltration filtrate.
The research described in this thesis focuses on the ultrafiltration membranes because of their
good references. The ultrafiltration membranes have a proven capability to produce a stable
and good filtrate quality in terms of particles and microbial parameters, regardless of the
feedwater quality. Beside this the ultrafiltration membranes are able to operate at relatively
high flux, low TMP and low energy costs, applying dead-end mode (te Poele, 2005).
1.3.2 Membrane process
In a membrane process three different streams can be defined (Figure 1.1). First the feed
stream containing the constituents that have to be removed. The feed stream is split into two
streams by the membrane; a clean water stream (the permeate) and the stream containing the

Introduction
7
retained constituents (the concentrate). The separation is mostly forced by pressure in water
treatment, the so-called (hydraulic) trans membrane pressure. Depending on the height of the
TMP and the filtration resistance water will flow from the feed side through the membrane to
the permeate side with a certain flow rate called the flux (J).
Figure 1.1 – Schematic representation of a membrane process
The membrane process can be designed in different ways. Generally three main aspects
should be considered during the design of the membrane process: the membrane material,
membrane configuration and mode of operation. These aspects will be described and
discussed in the following section.
1.3.3 Membrane material
Membranes are made of various organic and inorganic materials. The most commonly applied
in water treatment are the organic membranes with a wide variety of membrane materials,
pore size, pore size distributions, membrane configurations and production processes.
Compared to the organic membranes, inorganic membranes have superior mechanical
strength and resistance to chemicals and temperature but the manufacturing costs are much
higher. Although the prices of ceramic membranes are decreasing and therefore they are
becoming more and more attractive (Baker, 2004) and will compete with organic membranes.
Formerly the organic membranes were made of cellulose, a natural material but nowadays
most of the ultrafiltration membranes are mainly made of polymers with hydrophilic
properties like polysulfone, polyethersulfone or polyvinylidene fluoride (Meier et al., 2006).
In Table 1.4 the different membrane materials are summarized. The membrane structure can
be isotropic or anisotropic. Whereas isotropic membranes have a uniform composition and
structure, anisotropic (or asymmetric) membranes consist of different layers, prepared by a
phase inversion process, each with different structures and permeability (Baker, 2004).

Chapter 1
8
Table 1.4 – Different membrane materials (Mulder, 1996)
Organic Inorganic Cellulose acetate (CA) Ceramic Polyetherimide (Ultem) Titanium Oxide (TiO2) Polyacrylonitrile (PAN) Zircon Oxide (ZrO2) Polysulphone (PSU) Metallic Polyethersulphone (PES) Aluminium Oxide y-Al2O3 Teflon Polyvinylidenefluoride (PVDF) Polyethylene (PE)
1.3.4 Configuration
The configuration of membranes generally differs in two ways based on their geometry: as
flat sheet or tubular. The application of one of the configurations mainly depends on the
feedwater characteristics. An ideal configuration would provide a high membrane area per
volume area (packing density), high turbulence, low energy use, easy cleaning and operation.
However, some of these features are conflicting and therefore result in a number of
configurations in terms of membranes and membrane module. The two geometries and
different features form the basis for four principle types of membrane modules used for
wastewater treatment (Aptel and Buckley, 1996; Mulder, 1996):
� Tubular membranes; having an internal diameter larger than 3 mm and packing density of
< 300 m2/m
3, which are bundled in a module.
� Hollow fibre or capillary membranes; having an internal diameter less than 3 mm, which
are bundled into a membrane module with some hundred or thousand fibres. The
difference between hollow fibre and capillary membranes lies in the packing density,
which is about 600 – 1200 m2/m
3 and values of 30,000 m
2/m
3 respectively (te Poele,
2005).
� Plate or frame membranes; comprised of a series of flat sheet membranes and support
layers and having a packing density of 100 – 400 m2/m
3.
� Spiral wound membranes; flat membranes wound around a spacer, having a packing
density of 300 – 1000 m2/m
3 and used for nanofiltration and reverse osmosis.
In tubular and hollow fibre membranes the flow direction of feedwater can be inside-out or
outside-in. During outside-in filtration permeate is collected inside the membrane and during
inside-out it is collected outside the membrane fibre. This is illustrated in Figure 1.2.
Introduction
9
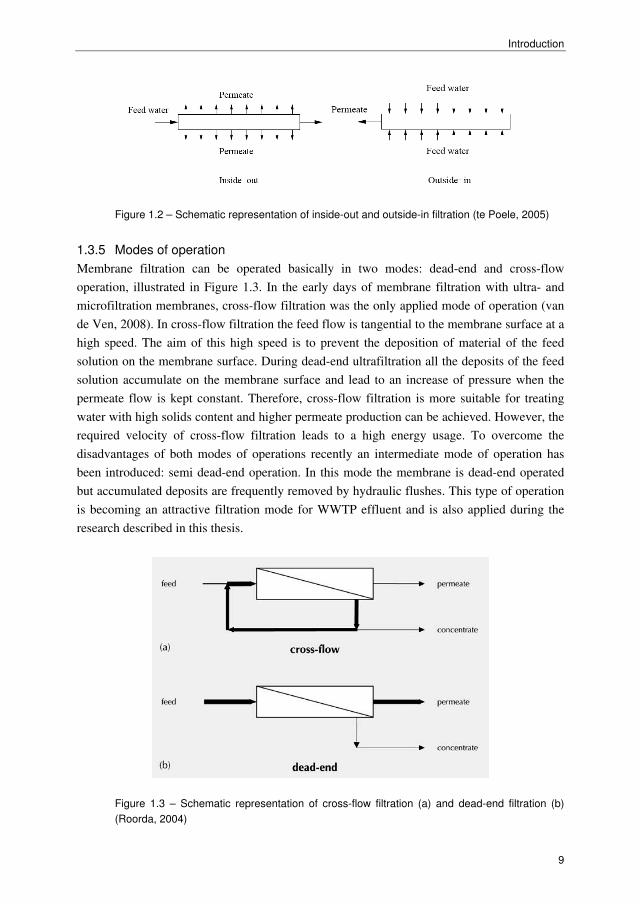
Figure 1.2 – Schematic representation of inside-out and outside-in filtration (te Poele, 2005)
1.3.5 Modes of operation
Membrane filtration can be operated basically in two modes: dead-end and cross-flow
operation, illustrated in Figure 1.3. In the early days of membrane filtration with ultra- and
microfiltration membranes, cross-flow filtration was the only applied mode of operation (van
de Ven, 2008). In cross-flow filtration the feed flow is tangential to the membrane surface at a
high speed. The aim of this high speed is to prevent the deposition of material of the feed
solution on the membrane surface. During dead-end ultrafiltration all the deposits of the feed
solution accumulate on the membrane surface and lead to an increase of pressure when the
permeate flow is kept constant. Therefore, cross-flow filtration is more suitable for treating
water with high solids content and higher permeate production can be achieved. However, the
required velocity of cross-flow filtration leads to a high energy usage. To overcome the
disadvantages of both modes of operations recently an intermediate mode of operation has
been introduced: semi dead-end operation. In this mode the membrane is dead-end operated
but accumulated deposits are frequently removed by hydraulic flushes. This type of operation
is becoming an attractive filtration mode for WWTP effluent and is also applied during the
research described in this thesis.
Figure 1.3 – Schematic representation of cross-flow filtration (a) and dead-end filtration (b)
(Roorda, 2004)

Chapter 1
10
In order to maintain stable operation during semi dead-end operation the membranes should
be cleaned periodically. Cleaning can be performed either hydraulically, mechanically,
chemically or by electrical cleaning. Hydraulic cleaning can be applied in two flow directions.
A forward flush is a complete cross-flow cleaning method with high flow rates. With a
backflush the flow rate is changed in the opposite direction, which means that backflush water
is flowing from the permeate side to the feed side of the membrane and is discharged as
concentrate.
After several filtration periods the performance declines, in spite of frequently applied
hydraulic flushes. Chemical cleaning is needed to recover the performance of the membrane.
This cleaning method can be applied by either starting with a forward or a back flush.
Subsequently the membranes are soaked in chemicals for a certain period and finally the
membranes are flushed with permeate, tap water or ultra pure water.
1.4 Ultrafiltration definitions
1.4.1 Flux and resistance
During ultrafiltration the TMP is the driving force for permeation. The permeate flow through
the membrane is called flux (J) and is defined as the permeate volume through the membrane
per unit of membrane area. The permeate flux is expressed as m3/m
2·s or more commonly L/
m2·h and is given by the Equation 1.1 (Mulder, 1996).
membraneAdt
dVJ
1⋅= (1.1)
in which: J = flux (m3/m
2⋅s), in this thesis expressed as (L/m
2⋅h)
V = filtered volume (m3)
t = time (s)
Amembrane = membrane area (m2)
The relation between the permeate flux and the trans membrane pressure under laminar
conditions and through porous membranes can be described conveniently by an adaptation of
the Darcy’s law (Lojikine et al., 1992) and is introduced in Equation 1.2.
Introduction
11
tp R
PJ
⋅
∆=
η (1.2)
in which: ∆P = trans membrane pressure (Pa), in this thesis expressed as (bar)
ηp = dynamic viscosity of the permeate (Pa⋅s)
Rt = total resistance to filtration resistance (m-1
)
Equation 1.2 presents an inversely proportional relation between the permeate flux and the
dynamic viscosity. In water and wastewater treatment it is usual to assume permeate viscosity
equal to pure water (Manem and Sanderson, 1996) and therefore solely dependent on its
temperature. In the literature several empirical relationships between temperature and pure
water viscosity can be found; in this thesis the one as derived by Janssen and Warmoeskerken
(1997) is used and shown in Equation 1.3.
32 264.0909.0520.2580.03 exp10 θθθη −+−− ⋅=p (1.3)
in which: θ = empirical factor: 3.6610⋅(T/(273.1+T)
T = temperature (°C)
When the object of filtration is not pure water (i.e. WWTP effluent) a contribution to the
resistance may arise from the solute and other substances, which cause fouling (thoroughly
described in chapter 2). Therefore the total filtration resistance (Rtotal) is often expressed as the
sum of membrane resistance (Rmembrane) and the additional resistance from fouling (Rfouling) as
presented in Equation 1.4.
foulingmembranetotal RRR += (1.4)
1.4.2 Filterability and reversibility
Dead-end ultrafiltration operation consists of subsequent filtration, backflush and chemical
cleaning steps. The definitions of the various cycles are used throughout this thesis, as well as
the definitions of filterability and reversibility used in this work are graphically given in
Figure 1.4. Filterability is the increase of filtration resistance over time (or filtrated volume).
A good filterability means that the increase of resistance is small. Reversibility is described as
the extent to which the filtration resistance is returned to the original value after applying a
hydraulic cleaning. If the filtration resistance after a backflush is equal to the filtration
resistance at the start of the previous filtration period, than the fouling is considered to be
completely reversible. Both terms, filterability and reversibility are related to the properties of
the feedwater, membrane material and operational conditions. Therefore, the definitions are
used in respect to these parameters. When the amount of irreversible fouling becomes too

Chapter 1
12
high, or after a predetermined amount of backflush cycles, the membrane is chemically
cleaned. Ideally, chemical cleaning removes all the irreversible fouling from the membrane.
Figure 1.4 – Typical filtration curves illustrating filterability, reversibility and chemical cleaning
1.5 Background of this thesis
Since 1999 research at Delft University of Technology has been carried out on dead-end
ultrafiltration of WWTP effluent. From 1999 – 2005 the research was performed in the
framework of the project “Membrane filtration of effluent”. The overall objective of the
project was to develop filtration techniques for the large-scale distribution of reclaimed water,
based on biologically treated effluent. Within the project the researchers focused on dead-end
ultrafiltration. The aim of this part of the project was to gain more insight into the interaction
between WWTP effluent and the ultrafiltration membranes in order to improve the design of
ultrafiltration installations at lower costs.
The research at the Delft University of Technology has resulted until now in two dissertations.
The first dissertation ‘Filtration characteristics in dead-end ultrafiltration of WWTP effluent’
published by Roorda (2004) deals with the filterability of WWTP effluent. In addition to pilot
experiments at various WWTPs in the Netherlands the filterability of WWTP effluent was
studied in detail on lab scale. These experiments resulted in a new parameter to describe the
filtration characteristics of WWTP effluent during dead-end ultrafiltration, the Specific
Ultrafiltration Resistance (SUR). With the SUR it is possible to measure even small
differences in filtration characteristics of WWTP effluent (Roorda, 2004). The SUR was also
used to measure the filterability of size fractions of the WWTP effluent. In chapter 3 the SUR
equipment and measurement are described in detail.
Introduction
13
The second dissertation deals with the physical and chemical mechanisms of membrane
fouling during dead-end ultrafiltration of WWTP effluent (te Poele, 2005). To gain insight
into this matter, photometric measurement methods are further developed in order to analyse
potential membrane foulants in WWTP effluent. The analytical data of the foulants are
compared with the actual filtration properties of WWTP effluent on lab and pilot scale. More
details about the membrane foulants in WWP effluent were obtained by using different
cleaning agents and methods in laboratory and pilot filtration tests. In chapter 2 the results of
this dissertation are discussed in more detail.
In 2005 the research project was continued under the name “Ultrafiltration of WWTP
effluent”. This research focuses on the application of ultrafiltration of WWTP effluent for
high quality industrial applications. Within the project two research topics were defined. The
first topic deals with the improvement of filterability of WWTP effluent by pretreatment
before ultrafiltration. Roorda (2004) stated earlier that an high initial filterability of WWTP
effluent is required for stable ultrafiltration performance at fluxes as high as 100 L/m2⋅h and
also showed that the filterability is dominated by particles in the range of 0.1 – 0.2 µm.
Therefore for a high initial filterability of WWTP effluent particles in this particular size
range should be removed or transformed during pretreatment for ultrafiltration. Pilot and lab
scale experiments showed that with conventional pretreatment techniques (coagulation,
sandfiltration and double layer filtration) only a moderate improvement of the initial
filterability could be obtained. Therefore within this topic the application of alternative
pretreatment technologies is investigated. The second topic deals with the SUR measurement
and the operation of ultrafiltration installations. In this part the filterability of WWTP effluent
measured as the SUR value and the performance of UF installations are evaluated. It is well
known that the performance of UF installations depends on the filtration characteristics of the
effluent. But this relation is not yet really quantified and therefore this part of the research
focuses on the relation between SUR and process parameters like flux, trans membrane
pressure and resistance increase.
1.6 Aim of this thesis
The research described in this thesis deals with the filterability and reversibility of WWTP
effluent during dead-end ultrafiltration in order to optimise the process conditions and
pretreatment technology of dead-end ultrafiltration. To gain insight into this matter, the
following aspects are covered:
� Investigation of the relation between the SUR value of WWTP effluent and operating
flux, trans membrane pressure and resistance.
� Identification of the effect of four pretreatment technologies: powdered activated carbon,
granulated activated carbon filtration, dual media filtration and biological granulated

Chapter 1
14
activated carbon filtration (1-STEP®
filter). The effect is determined by fractionation,
foulants and SUR measurements of untreated and pretreated WWTP effluent.
� Evaluation of the performance of a pretreatment technology (coagulation – dual media
filter – coagulation) and full scale ultrafitration installation during the intake of WWTP
effluent after buffering in a stabilization pond. For the evaluation SUR measurements and
foulants analyses are performed.
� The effect of operational conditions flux and pretreatment on both fouling parameters,
filterability and reversibility. To determine this effect a pilot ultrafiltration installation is
used.
� Characterization of both filterability and reversibility of WWTP effluent with a revised
version of the SUR equipment.
With the gained insight it should be possible to further implement or optimize the application
of dead-end ultrafiltration of WWTP effluent at different locations and in different situations
in order to increase the perspectives of water reuse for different applications.
1.7 Outline
For a general understanding of the terms and concepts in membrane filtration of WWTP
effluent a concise introduction is presented in Chapter 2 WWTP effluent and membrane
filtration. Chapter 3 Research methodology describes the material and methods used during
the experiments. Chapters 4 – 7, the heart of the thesis, present the results of the experiments.
Chapter 4 Filtration properties and performance of ultrafiltration installations.presents the
results of tests at the WWTP Sas van Gent (full scale) and WWTP Horstermeer (pilot scale)
to investigate the relation between the SUR value of WWTP effluent, flux, trans membrane
pressure and resistance increase. Chapter 5, Filtration properties and pretreatment, focuses
on the effect of powdered activated carbon, granulated activated carbon filtration, dual media
filtration and biological granulated activated carbon filtration (1-STEP®
filter) on the
filterability of WWTP effluent. The next chapter, Application of SUR in practice: A case
study, presents the added value of applying SUR measurements parallel to the operation of a
full scale ultrafiltration – reverse osmosis installation. The effect of operation conditions on
both filterability and reversibility are presented in Chapter 7. Finally in Chapter 8 the results
of the various experiments are evaluated and several recommendations for future research
directions are proposed.

Introduction
15
References
Agtmaal, J. van, Boks, P.A., Cornips, R. and Paping, L.L.M.J. (2007). Evaluation of feed water sources and
retrofitting of an Integrated Membrane System. Proceedings 6th IWA Specialist Conference on Wastewater
Reclamation an Reuse for Sustainability, October 9 – 12, 2007, Antwerp, Belgium.
Asano, T. (2002). Water from (waste)water – the dependable water resource. Water science and Technology,
45(8), 23 – 33.
Baker, R.W. (2004). Membrane Technology and Applications. 2nd Edition. John Wiley & Sons, Ltd, Chichester,
United Kingdom.
Bixio, D. and Wintgens T. Editors (2006). Water Reuse System Management Manual AQUAREC. Project report
European Comission, Luxembourg.
Cazurra, T. (2008). Water reuse of south Barcelona’s wastewater reclamation plant. Desalination, 218, 43-51.
CBS (2006). 25 Jaar Statistiek Zuivering van afvalwater in vogelvlucht. in Dutch, Voorburg/Heerlen, the
Netherlands.
Houtte, E. van and Verbauwhede, J. (2003). Drinkwater uit effluent via duinfiltratie (ET 16). Proceedings PAO
Cursus ‘Effluent van de toekomst’, Delft, The Netherlands.
Jobling, S., Beresford, N., Nolan, M., Rodgers-Gray, T., Brighty, G.C., Sumpter, J.P. and Tyler, C.R. (2002)
Altered sexual maturation and gamete production in wild roach (Rutilus rutilus) living in rivers that receive
treated sewage effluents. Biology of reproduction, 66, 272 – 281.
Kim, S.L., Paul Chen, J. and Ting, Y.P. (2002). Study on feed pretreatment for membrane filtration of secondary
effluent. Separation and Purification Technology, 29, 171 – 179.
Levine, A.D. and Asano T. (2004). Recovering sustainable Water from Wastewater. Environmental Science &
Technology, June, 201 – 208.
Lojkine, M.H., Field, R.W. and Howell, J.A. (1992). Crossflow microfiltration of cell suspensions: a review of
models with emphasis on particle size effects. Transition Inst. Chemical Engineering. 70. 149 – 164.
Manem, J. and Sanderson R. (1996). Membrane bioreactors. Water Treatment Membrane Processes.
AWWARF/Lyonnaise des Eaux/WRC, McGraw-Hill, New York, USA.
Menge, J.G., Pisani, P. du and Merwe, B. van der. (2007). Water quality control in a third world country:
challenges to ensure good quality reclaimed in Windhoek, Namibia. Proceedings 6th IWA Specialist Conference
on Wastewater Reclamation an Reuse for Sustainability, October 9 – 12, 2007, Antwerp, Belgium.
Meier, P., Salehi, F., Kazner, C., Wintgens, T. and Melin T. (2006). Ultrafiltration with pre-coagulation in
drinking water production – Literature review. Report Techneau project, report 06.
Mulder, M. (1996). Basic principles of membrane technology. Kluwer Academic Publishers, Dordrecht, The
Netherlands.
Poele, S. te (2005). Foulants in ultrafiltration of wwtp effluent. PhD thesis, Department of Sanitary Engineering,
Delft University of Technology, Delft, The Netherlands.
Roorda, J.H. (2004). Filtration characteristics in dead-end ultrafiltration of wwtp-effluent. PhD thesis,
Department of Sanitary Engineering, Delft University of Technology, Delft, The Netherlands.
Routledge, E.J., Sheahan, D., Desbrow, C., Brighty, C., Waldock, M. and Sumpter, P. (1998). Identification of
estrogenic chemicals in STW effluent. 2. In vivo responses in trout and roach. Environmental Science &
Technology, 32, 1559 – 1565.
STOWA (2005). Exploratory study for wastewater treatment techniques and the European Water Framework
Directive. Report 25, Utrecht, The Netherlands.

Chapter 1
16
Traves, W.H., Gardner, E.A., Dennien, B. and Spiller, D. (2008). Towards indirect potable reuse in South East
Queensland. Water Science & Technology, 58(1), 153 – 161.
Ven, W. van de (2008). Towards optimal saving in membrane operation. PhD thesis, Universtiteit Twente,
Enschede, The Netherlands.

Wastewater treatment plant effluent and membrane filtration
17
2 Wastewater treatment plant effluent and membrane filtration 2.1 Introduction This chapter provides the background information for this thesis. In section 2.2 the municipal
wastewater treatment process and the characteristics of WWTP effluent are described. Further
in section 2.3 the fundamentals of membrane filtration for water treatment are addressed and
in section 2.4 the main drawback of this process: fouling. The subsequent sections provide
information about factors that affect this almost inevitable consequence of membrane
filtration. The last section gives an overview of methods to indicate the fouling rate of WWTP
effluent.
2.2 Wastewater treatment plant effluent 2.2.1 Treatment process Nowadays in the Netherlands almost all the produced municipal and industrial wastewater
(>98%) is treated in wastewater treatment plants (CBS, 2006). The municipal wastewater
treatment plants (356 in 2007) with a total design capacity of 24,462,000 population
equivalents (pe’s) and a total volume of wastewater treated of approximately 2,100 Mm3 in
2007 (CBS, 2009). In general almost all the current wastewater treatment plants in the
Netherlands are based on the activated sludge process (Figure 2.1). Therefore the description
of the treatment process in this section focuses on this process. The activated sludge process
consists of three processes in series. The first step, the primary treatment, is usually
mechanical aiming to remove coarse material, suspended solids and other undesired
substances. Subsequently, in the second step, the “heart” of the process, the influent is mixed
with biomass (activated sludge) and treated under aerobic and/or anoxic conditions. These
conditions provide not only a removal of biodegradable COD but also a conversion of
phosphorus and nitrogen. In the end the biologically treated water and the activated sludge are
separated in a final clarifier using gravitational settling. The settled activated sludge is
returned partly to the beginning of the biological process and the other part is wasted. In many
cases the wasted sludge is treated on site together with the sludge of the primary step by
digestion and dewatering. After dewatering it is usually transported to an incinerator.

Chapter 2
18
Figure 2.1 – Schematic flow scheme of an activated sludge process
2.2.2 Characteristics of WWTP effluent The wastewater transported by the sewerage system and treated in a wastewater treatment
plant consists of a mixture of municipal and industrial (pretreated) wastewater. Additionally,
during storm weather events, the sewer is used for the transport of rainwater and is collected
at the wastewater treatment plant. Considering these factors and the consequent variations in
loads and concentrations of pollutants on different time and spatial scale an average influent
quality for all wastewater treatment plants in the Netherlands is presented in Table 2.1.
Table 2.1 – Average quality of WWTP effluent in the Netherlands in 2007 and the current
discharge standards
Parameter Unit Average concentration
1
Discharge standards2
Chemical oxygen demand (COD) mg O2/L 43 125 Biochemical oxygen demand (BOD) mg O2/L 4 20 (without nitrification Total nitrogen (Ntot) mg N/L 91 10 (> 20,000 pe)
15 (2,000 – 20,000 pe) Total phosphorus (Ptot ) mg P/L 1 1 (> 100,000 pe)
2 (2,000 – 100,000 pe) Suspended solids (SS) mg/L 11 30 1)
Data 2007 (CBS, 2008) 2)
VROM (1996)
Next to the constituents presented in Table 2.1 WWTP effluent contains a wide variety of
trace compounds and elements, although they are not measured routinely. In Table 2.2
individual constituents are grouped into four broad categories: (1) the residual organic and
inorganic colloidal and suspended solids, (2) dissolved organic constituents, (3) dissolved
inorganic constituents and (4) biological constituents.

Wastewater treatment plant effluent and membrane filtration
19
Table 2.2 – Typical residual constituents found in treated wastewater effluent and their
impacts (Metcalf & Eddy, 2003)
Residual constituent Effect Inorganic and organic colloidal and suspended solids
Suspended solids - May cause sludge deposits or interfere with receiving water clarity - Can impact disinfection by shielding organisms Colloidal solids - May affect effluent turbidity Organic matter (particulate)
- May shield bacteria during disinfection, may deplete oxygen resources
Dissolved organic matter
Total organic carbon - May deplete oxygen resources Refractory organic - Toxic to humans; carcinogenic Volatile organic compounds
- Toxic to humans; carcinogenic; form photochemical oxidants
Pharmaceutical compounds
- Impact aquatic species (e.g., endocrine disruption, sex reversal)
Surfactants - Cause foaming and may interfere with coagulation
Dissolved inorganic matter
Ammonia - Increases chlorine demand - Can be converted to nitrates and, in the process, can deplete oxygen
resources - With phosphorus, can lead to the development of undesirable aquatic
growths - Toxic to fish Nitrate - Stimulates algal and aquatic growth Phosphorus - Stimulates algal and aquatic growth - Interferes with coagulation - Interferes with lime-soda softening Calcium and magnesium - Increase hardness and total dissolved solids Total dissolved solids - Interfere with agricultural and industrial processes Biological
Bacteria - May cause disease Protozoan cyst and oocyst - May cause disease Viruses - May cause disease
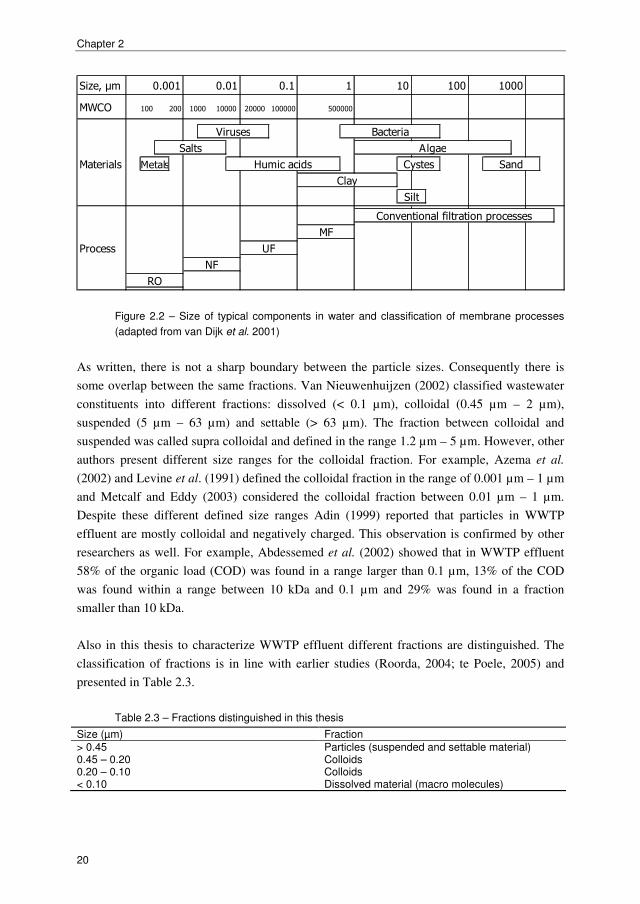
2.2.3 Particles in WWTP effluent
Particles in WWTP effluent are defined based on their size as dissolved, colloidal and
suspended matter but there is not a sharp boundary in size that separates them. An overview
of the different fractions, constituents and sizes of WWTP effluent is presented in Figure 2.2.
Chapter 2
20
`
Size, µm
MWCO
Materials
Process
Conventional filtration processes
10 100 1000
Cystes Sand
Clay
Silt
Humic acids
10.001 0.01 0.1
20000200 500000100 100001000 100000
Viruses Bacteria
AlgaeSalts
MF
Metals
RO
NF
UF
Figure 2.2 – Size of typical components in water and classification of membrane processes
(adapted from van Dijk et al. 2001)
As written, there is not a sharp boundary between the particle sizes. Consequently there is
some overlap between the same fractions. Van Nieuwenhuijzen (2002) classified wastewater
constituents into different fractions: dissolved (< 0.1 µm), colloidal (0.45 µm – 2 µm),
suspended (5 µm – 63 µm) and settable (> 63 µm). The fraction between colloidal and
suspended was called supra colloidal and defined in the range 1.2 µm – 5 µm. However, other
authors present different size ranges for the colloidal fraction. For example, Azema et al.
(2002) and Levine et al. (1991) defined the colloidal fraction in the range of 0.001 µm – 1 µm
and Metcalf and Eddy (2003) considered the colloidal fraction between 0.01 µm – 1 µm.
Despite these different defined size ranges Adin (1999) reported that particles in WWTP
effluent are mostly colloidal and negatively charged. This observation is confirmed by other
researchers as well. For example, Abdessemed et al. (2002) showed that in WWTP effluent
58% of the organic load (COD) was found in a range larger than 0.1 µm, 13% of the COD
was found within a range between 10 kDa and 0.1 µm and 29% was found in a fraction
smaller than 10 kDa.
Also in this thesis to characterize WWTP effluent different fractions are distinguished. The
classification of fractions is in line with earlier studies (Roorda, 2004; te Poele, 2005) and
presented in Table 2.3.
Table 2.3 – Fractions distinguished in this thesis
Size (µm) Fraction > 0.45 Particles (suspended and settable material) 0.45 – 0.20 Colloids 0.20 – 0.10 Colloids < 0.10 Dissolved material (macro molecules)

Wastewater treatment plant effluent and membrane filtration
21
2.3 Membrane fouling 2.3.1 Definitions As explained in chapter 1 membrane fouling is a natural consequence of the membrane
separation process. The definitions of membrane fouling are several in literature and can be
generally distinguished in two approaches. Some authors (van der Berg and Smolders, 1990
and Lojkine, 1992) use the term fouling to indicate strictly the ‘tenacious’ interactions that
take place on the membrane and that would not be reversed by a release of the driving force
(Ravazinni, 2008). The other approach includes within the term fouling each mechanism that
leads to a decrease of performance during the filtration process. The approach, used in this
thesis, is defined by the International Union for Pure and Applied Chemistry which defines
fouling as the process resulting in loss of performance of a membrane due to the deposition of
suspended or dissolved substances on its external surfaces, at its pore openings, or within its
pores (Koros et al., 1996). Within this definition fouling is encountered in the two terms:
filterability and reversibility. Filterability as the loss of performance e.g. during a filtration
run and reversibility as the extent to which membrane performance can be regained after it
was fouled during filtration.
2.3.2 Fouling mechanisms In the membrane filtration process of WWTP effluent different fouling mechanisms may
occur. Generally, five fouling mechanisms can be distinguished; each mechanism contributes
to the total resistance over the membrane. The fouling mechanisms are schematically
presented in Figure 2.3:
� Concentration polarisation (Rcp): The increased concentration of rejected solutes near the
membrane surface resulting in e.g. scaling, raise of osmotic pressure and gel formation.
� Pore blocking (Rpb): Particles enter the membrane pores and get stuck in their openings, so
that the number of pore channels available for permeation is reduced.
� Pore narrowing, e.g. by adsorption (Ra): Particles, colloids and macro molecules that
enter the membrane pores and adsorb to the pore wall, resulting in less open pore channels
and decrease of the permeate flow.
� Cake layer formation (Rc): Particles, colloids and macro molecules accumulate on the
membrane surface forming a more or less dense and more or less permeable layer. The
strength of the cake layer depends on the interaction between the substances themselves
and interaction with the membrane.
� Compression of cake layer (Rcc) (not shown in Figure 2.3): If the cake layer is
compressible an increase of trans membrane pressure will compress the cake layer
resulting in a higher resistance.

Chapter 2
22
The type of fouling is highly dependent on the type of filtration process, i.e. microfiltration,
ultrafiltration, nanofiltration and reverse osmosis. Concentration polarisation e.g. is of minor
importance during dead-end ultrafiltration. The term originated from reverse osmosis
applications and therefore left out of consideration in this thesis. Another fouling mechanism
that is not incorporated in Figure 2.3 is the growth of micro organisms and their metabolic
products of the membrane surface, so called biofouling. Once developed biofouling is very
hard to remove as incomplete removal of (dead) micro organisms will spawn re-establishment
of new biological activity (Schrader, 2006). Also in Figure 2.3 possible fouling mechanisms
as compaction of membrane and capillary blocking are not included. Capillary blocking as
fouling mechanism was established by Heijman et al. (2007). Heijman et al. (2007)
investigated in a lab scale test whether there is heterogeneous fouling (capillary blocking) in
dead-end ultrafiltration, the hydraulic cleaning with backflush and/or forward flush is not
capable to remove all the cake fouling or pore blocking in the membrane module.
According to Figure 2.3 the total resistance (Rtotal) in equation 2.1 is based on the different
fouling mechanisms and the initial membrane resistance, presented by a resistance-in-series
relationship according to Bowen and Jenner (1995):
adsorptionngporeblockicakemembranetotal RRRRR +++= (2.1)
Figure 2.3 – The resistance of a fouled membrane by various fouling mechanisms, the driving force is from the left to the right: Ra = adsorption, Rp = pore blocking, Rm = initial membrane resistance, Rc = cake filtration, Rcp = concentration polarization (van den Berg, 1988)
Wastewater treatment plant effluent and membrane filtration
23
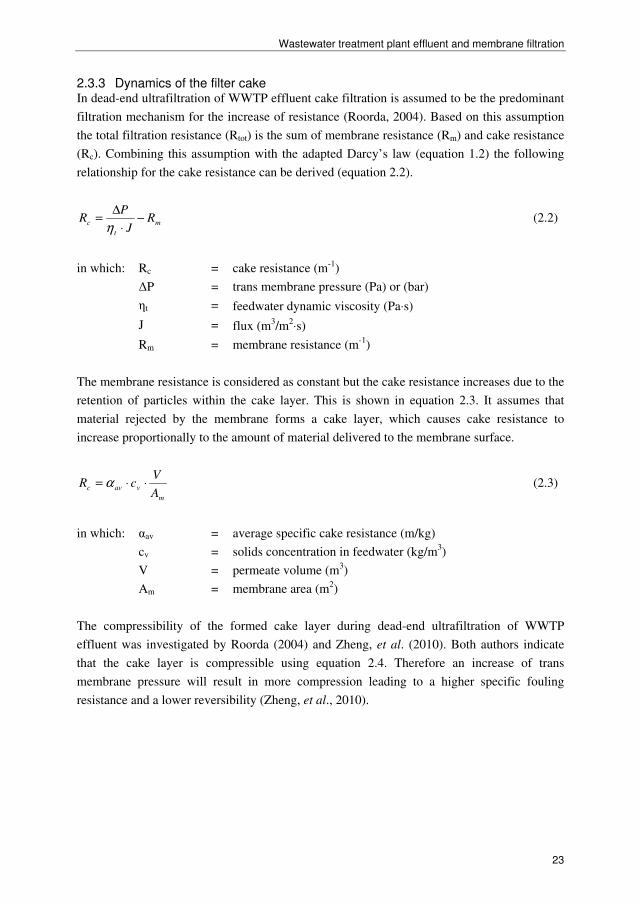
2.3.3 Dynamics of the filter cake In dead-end ultrafiltration of WWTP effluent cake filtration is assumed to be the predominant
filtration mechanism for the increase of resistance (Roorda, 2004). Based on this assumption
the total filtration resistance (Rtot) is the sum of membrane resistance (Rm) and cake resistance
(Rc). Combining this assumption with the adapted Darcy’s law (equation 1.2) the following
relationship for the cake resistance can be derived (equation 2.2).
m
t
c RJ
PR −
⋅
∆=
η (2.2)
in which: Rc = cake resistance (m-1
)
∆P = trans membrane pressure (Pa) or (bar)
ηt = feedwater dynamic viscosity (Pa⋅s)
J = flux (m3/m
2⋅s)
Rm = membrane resistance (m-1
)
The membrane resistance is considered as constant but the cake resistance increases due to the
retention of particles within the cake layer. This is shown in equation 2.3. It assumes that
material rejected by the membrane forms a cake layer, which causes cake resistance to
increase proportionally to the amount of material delivered to the membrane surface.
m
vavcA
VcR ⋅⋅= α (2.3)
in which: αav = average specific cake resistance (m/kg)
cv = solids concentration in feedwater (kg/m3)
V = permeate volume (m3)
Am = membrane area (m2)
The compressibility of the formed cake layer during dead-end ultrafiltration of WWTP
effluent was investigated by Roorda (2004) and Zheng, et al. (2010). Both authors indicate
that the cake layer is compressible using equation 2.4. Therefore an increase of trans
membrane pressure will result in more compression leading to a higher specific fouling
resistance and a lower reversibility (Zheng, et al., 2010).
Chapter 2
24
s
av P∆⋅= 0αα (2.4)
in which: α0 = specific cake resistance at reference pressure (m/kg)
s = compressibility coefficient (s = 0 refers to no compression, the
increase of s represents the layer is more compressed, s = 1
refers to complete compression)
2.4 Factors affecting fouling As already mentioned the fouling mechanisms will result in a performance decrease of the
separation step. The operational performance of membrane filtration is a function of time and
many other variables. In general there are three major variables influencing membrane
fouling: feedwater properties, operational conditions and membrane characteristics (Amy,
2008). Table 2.4 summarizes the main factors involved in the fouling process for each of
these three variables.
Table 2.4 – Factors influencing membrane fouling
Feedwater properties Operational conditions Membrane characteristics Chemical and physical properties feedwater solution
Flux
Clean water flux and/or resistance
Chemical properties of particles, colloids and dissolved material
Recovery Pore size or molecular weight cut off
Particle size distribution Pretreatment Hydrophobicity/hydrophilicity Chemical cleaning Surface charge Hydraulic flushes Surface morphology
2.4.1 Feedwater properties The potential membrane foulants in WWTP effluent can be present in the influent of the
wastewater treatment plant, or originate from the activated sludge (particulate material) and
bacterial metabolism. During the biological treatment the particle size distribution in
wastewater changes as a result of new cell synthesis, flocculation, adsorption, enzymatic
breakdown of macro molecules and biochemical oxidation (Levine et al., 1985). Usually and
also presented in Figure 2.1 the biomass and the biologically treated water (WWTP effluent)
are separated by gravity in the final clarifier. Generally, the WWTP effluent consist of mainly
organic compounds, suspended solids and nutrients (Metcalf and Eddy, 2003). In Table 2.5 an
overview of these components is presented adopted from te Poele (2005) and Metcalf and
Eddy (2003).

Wastewater treatment plant effluent and membrane filtration
25
Table 2.5 – Constituents found in WWTP effluent that influence membrane fouling
Soluble biodegradable organics - Organics that escaped biological treatment. - Organics formed an intermediate products in the biological
degradation of the waster. - Cellular components as a result of cell death or lysis .
Suspended organic material - Biomass produced during treatment that escaped separation
in the final settling tank. - Colloidal organic solids in the wastewater plant influent that
escaped treatment and separation. Nitrogen and phosphorus - Contained in biomass in effluent suspended solids.
- Soluble nitrogen as NH4-N, NO3-N, NO2-N and organic–N. - Soluble orthophosphates.
Non biodegradable organics - Those originally present in the wastewater influent.
- By-products of biological degradation
2.4.1.1 Organic fouling
From the constituents presented in Table 2.5 the organic compounds are mostly associated
with fouling of ultrafiltration membranes. Fouling caused by these constituents (organic
fouling) can be distinguished in three types (Amy, 2008) for drinking water treatment and
wastewater reclamation/reuse:
� allochthonous natural organic matter (NOM) dominated by humic substances derived
from runoff and leaching of vegetative debris from terrestrial sources within a watershed;
� autochthonous or algal organic matter (AOM) consisting of extracellular and
intracellulare macromolecules and cellular debris;
� wastewater effluent (EfOM) consisting of background (drinking water) NOM plus soluble
microbial products (SMPs) derived from biological wastewater treatment.
During filtration of WWTP effluent EfOM deposits on or in the membranes, reducing the
permeate rate by the different filtration mechanisms. In particular the soluble microbial
products (SMP) and/or (soluble) extracellular polymeric substances (EPS) are considered as
the major foulants of EfOM during ultrafiltration of WWTP effluent (Jarusutthirak and Amy,
2001; te Poele, 2005; Rosenberger, et al., 2005; Jarusutthirak and Amy, 2007; Haberkamp, et
al., 2008; Zheng et al., 2010). Both, SMP and (soluble) EPS are considered as similair
substances. Laspidou and Rittmann (2002) compared the concepts of soluble EPS and soluble
SMP and concluded that both are indeed identical. Furthermore, because of the analytical
methods for their determination, soluble SMP and soluble EPS cannot be distinguished in
engineering practice (te Poele, 2005). Both substances are produced by micro organisms and
released into the liquid phase as part of the metabolism and due to biological or mechanical
stress (te Poele, 2005). However, with respect to EPS two basic forms are distinguished:
bound (or extracted EPS) or soluble EPS (Geilvoet 2010). Bound extracellular polymeric
substances are of a biological origin, participate in the formation of microbial aggregates and
consist of insoluble materials (sheats, capsular polymers, condensed gel, loosely bound
polymers and attached organic material) (Laspidou and Rittmann 2002). Soluble EPS and

Chapter 2
26
SMP consists of soluble macro molecules, colloids and slimes (te Poele, 2005) and can be
defined as “the pool of organic compounds that are released into the solution from substrate
metabolism (usually with biomass growth) and biomass decay” (Barker and Stuckey, 1999).
The main components of soluble EPS and SMP are proteins and polysaccharides and to a
minor extent, nucleic acids and lipids (Flemming and Wingender, 2001).
Which compound of SMP, either proteins or polysaccharides, are most strongly linked to
membrane fouling is still an open question. For example, te Poele (2005) has demonstrated
that the smaller colloids or organic molecules (< 0.10 µm) of WWTP effluent predominantly
influence the reversibility during ultrafiltration. These organic molecules had a protein origin
and the influence of polysaccharides was not clearly demonstrated. This observation was also
noticed by Haberkamp (2008). In that research a model solution mixed with a natural EPS
extract and real WWTP effluent were filtrated during cross flow filtration experiments. The
model solution with bacterial EPS extract contained significantly more polysaccharides than
proteins, whereas the WWTP effluent contained a larger proportion of proteins. The
ultrafiltration of WWTP effluent resulted in a higher flux decline than the EPS model
solutions. Therefore, it was indicated that proteins play an important role in ultrafiltration
membrane fouling.
Other researchers underline the negative impact of proteins but take the effect of
polyasaccharides and proteins in one term as biopolymers together. Zhing et al. (2009a) found
during stirred cell experiments that dissolved substances of WWTP effluent larger than the
ultrafiltration pore size attribute to more than 50% of the total fouling resistance. Within the
dissolved substances, the concentration biopolymers detected by LC-OCD shows a
quantitative correlation with the filterability of water samples in dead-end ultrafiltration.
During the filtration process, biopolymers cover membrane pores firstly and lead to a steep
flux decline. The impact of polysaccharides and colloids was shown by Jarusutthirak and
Amy (2006) during the characterisation of different EfOM fractions in fouling of
ultrafiltration and nanofiltration membranes. In addition, Cho et al. (1998) characterised clean
and NOM fouled ultrafiltration and nanofiltration membranes and indicated polysaccharides
or polysaccharide like substances as foulants.
Although the main components of soluble microbial products are the proteins (60%) and
polysaccharides (40 – 95%) (Flemming and Wingender, 2001) also humic substances are a
major part (Drewes and Fox, 1999; Hezjlar and Chudoba, 1986). Humic substances or fulvic
substances are composed of phenol compounds, single sugars and amino acids and bound
with ether, carbon and peptide bonds. Compared to the proteins and polysaccharides, humic
substances are considered of minor relevance during ultrafiltration of WWTP effluent (Laabs
et al., 2006; Haberkamp et al., 2008).

Wastewater treatment plant effluent and membrane filtration
27
2.4.1.2 Size of organics
As stated in the previous section various researchers report that fouling is predominantly
determined by soluble microbial products in WWTP effluent. To analyse SMP in WWTP
effluent different methods (specific UV-absorbance, total organic carbon, colorimetric
analyses and size exclusion chromatography) are applied but all these methods solely provide
information about the characteristic concentration and not about the characteristic size.
Therefore also investigations to characterize the size of (organic) colloidal particles causing
fouling during ultrafiltration of WWTP effluent are performed by several researchers. Roorda
(2004) performed SUR tests with different fractions of WWTP effluent and showed that the
fraction between 0.1 – 0.2 µm predominantly determined the filtration characteristics. This
finding is confirmed by research of te Poele (2005). Te Poele (2005) stated that organic
colloids of size fraction < 0.45 and 0.10 µm reveal to be of major influence on the filterability.
It is assumed that these colloids might possibly be cell fragments and large molecules (te
Poele, 2005), which could not be measured by analytical methods like specific UV-
absorbance, total organic carbon, colorimetric analyses and size exclusion chromatography.
Furthermore, te Poele (2005) stated that the reversibility is mostly influenced by organic
molecules (mainly proteins) < 0.10 µm. These findings of Roorda (2004) and te Poele (2005)
underline the need to focus on both aspects of organic fouling: concentration and size.
Therefore in this thesis the colorimetric analyses will be accompanied by fractionation tests in
order to obtain a better understanding of fouling formation during ultrafiltration of WWTP
effluent.
2.4.1.3 Divalent cations, pH and ionic strength
In addition to the composition and concentration of EfOM substances the concentration of
divalent cations, pH and ionic strength influence the impact of organic fouling. The pH and
ionic strength composition of feedwater influence the chemical interactions between the
foulants and the membrane and between the foulant and fouling layer (Costa et al., 2006)
Divalent cations like calcium and magnesium bridges with negatively charged functional
groups within the bacterial EPS, which helps to aggregate and stabilize the matrix of
biopolymer and microbes (Kim and Jang, 2006). This mechanism may result in a network
structure of EPS on the membrane surface influencing the filtration rate.
2.4.2 Operational conditions 2.4.2.1 Operating mode
The permeate flux can be regarded as a measure for the fouling load on the membrane,
because it determines how much foulants are transported towards the membrane. This
unavoidable transport during permeation can be generally performed in three different
operation modes: with constant trans membrane pressure, with constant permeate flux or with
a combination of these. During constant trans membrane pressure operation the flux will
decrease over time and during constant flux operation the trans membrane pressure will

Chapter 2
28
increase over time. In the case of no fouling there will be no difference between both
operation modes but from an engineering practice point of view the use of constant flux is
preferable instead of constant trans membrane pressure. However many researchers use
constant pressure operation for the benefit of conducting simple short term experiments (Lee
et al., 2008). Whether the constant flux or the constant trans membrane pressure is more
beneficial for fouling control is a difficult question. On the one hand different authors
(Loijkine et al., 1992; Bourgeos et al., 2001; Tarabara et al., 2002) prefer for different reasons
constant pressure but on the other hand other authors (Defrance and Jaffrin, 1999; Ho and
Zydney, 2002) suggest constant flux as it usually results in higher permeate volume
production. Differently, Vyas et al. (2002) suggest a combination of constant flow and
constant pressure, which seems favourable to minimise fouling and optimise process
performance.
2.4.2.2 Hydraulic flushes
As a result of the dead-end mode the membrane has to be cleaned often in order to remove the
rejected compounds. The period (filtration run) between two hydraulic flushes may vary
between 10 and 60 minutes depending on the feedwater quality, but a filtration period of 30
minutes is usually applied in practice. Depending on the type of hydraulic flush either feed
water, permeate or ultrapure water are flushed into the membranes. The different types of
hydraulic flushes are a forward flush (FF) and back flush (BF) as illustrated in Figure 2.4.
Figure 2.4 - Schematic drawing of hydraulic cleaning: forward flush and back flush (te Poele,
2005)
The forward flush is a turbulent cross flow along the feed side of the membrane surface. With
small diameters of membrane fibres high cross flow velocities are needed to obtain turbulent
flow. This velocity is many times higher compared to the velocity during dead-end filtration.
A mixture of air and water can be used to improve the forward flush. The air is used to create
turbulent flow in the membrane under process conditions where no turbulence is attained with
the water flow. The air/water flush is patented as the AirFlush®
and further investigated by
Verberk (2005). For a forward flush feed water can be used in order to obtain a high recovery.
Wastewater treatment plant effluent and membrane filtration
29
The back flush or backwash is a permeate flow reversed to the filtration mode. As a result, the
retained material in the membrane pores and on the membrane is released. Permeate is used
for the back flush in order to keep the permeate side of the membrane free of particles. The
back flush flux is normally 2 to 2.5 times the flux during filtration. Typical duration of the
back flush is 30 to 60 seconds. After removing the retained material from the pores and
membrane surface it has to be transported out of the module. Because the amount of permeate
used for back flush is limited (because of recovery) the transport of retained material may be
insufficient. A combined back flush and forward flush can be used to overcome this problem.
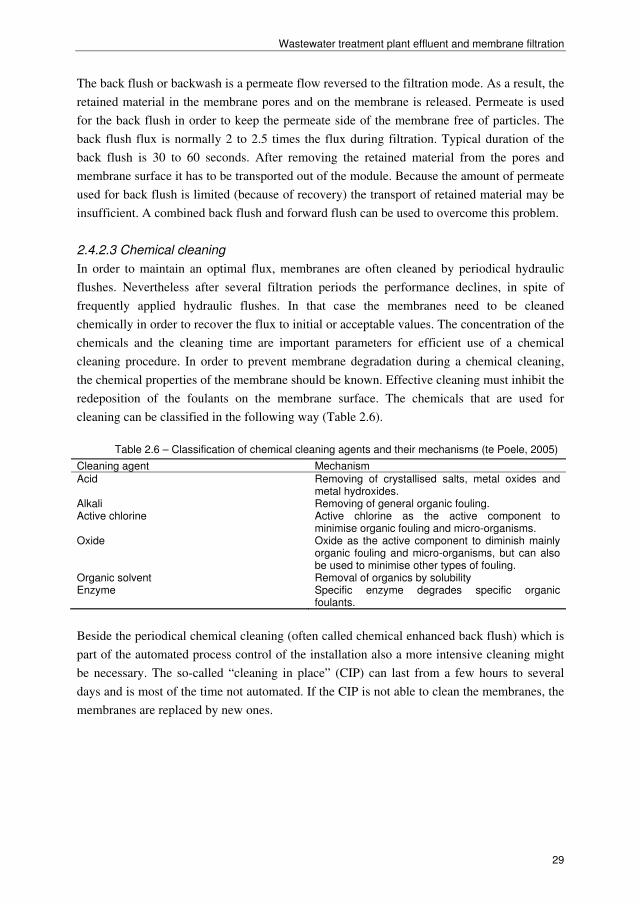
2.4.2.3 Chemical cleaning
In order to maintain an optimal flux, membranes are often cleaned by periodical hydraulic
flushes. Nevertheless after several filtration periods the performance declines, in spite of
frequently applied hydraulic flushes. In that case the membranes need to be cleaned
chemically in order to recover the flux to initial or acceptable values. The concentration of the
chemicals and the cleaning time are important parameters for efficient use of a chemical
cleaning procedure. In order to prevent membrane degradation during a chemical cleaning,
the chemical properties of the membrane should be known. Effective cleaning must inhibit the
redeposition of the foulants on the membrane surface. The chemicals that are used for
cleaning can be classified in the following way (Table 2.6).
Table 2.6 – Classification of chemical cleaning agents and their mechanisms (te Poele, 2005)
Cleaning agent Mechanism Acid Removing of crystallised salts, metal oxides and
metal hydroxides. Alkali Removing of general organic fouling. Active chlorine Active chlorine as the active component to
minimise organic fouling and micro-organisms. Oxide Oxide as the active component to diminish mainly
organic fouling and micro-organisms, but can also be used to minimise other types of fouling.
Organic solvent Removal of organics by solubility Enzyme Specific enzyme degrades specific organic
foulants.
Beside the periodical chemical cleaning (often called chemical enhanced back flush) which is
part of the automated process control of the installation also a more intensive cleaning might
be necessary. The so-called “cleaning in place” (CIP) can last from a few hours to several
days and is most of the time not automated. If the CIP is not able to clean the membranes, the
membranes are replaced by new ones.
Chapter 2
30
2.4.3 Pretreatment The integration of an extra treatment step (pretreatment) in front of the membrane process is
an important trend in the development of membrane filtration to improve the performance. In
this thesis pretreatment refers to the operation of processes that are conducted in precedence
to membrane filtration to improve the performance of membranes during filtration of WWTP
effluent. Beside the improvement of the performance pretreatment is sometimes applied to
enhance the rejection efficiencies. However, predominantly pretreatment is applied to control
membrane fouling (Huang et al., 2007).
In a paper of Huang et al. (2007) the mechanisms of pretreatment are summarized by three
types of effect:
� Physical effects: pretreatment can increase the size of aquatic substances by aggregation
(i.e., coagulation) or adsorbing them onto materials larger than membrane pore
dimensions thereby enhancing their rejections by membrane filtration and reducing
membrane fouling.
� Chemical effects: pretreatment can alter the nature (i.e., prefiltration, coagulation or
adsorption) and magnitude (coagulation and softening) of interfacial interactions involved
in the subsequent membrane filtration and mitigate the impact of undesirable interactions
between aquatic substances and membrane surfaces.
� Biological effects: pretreatment can either enhance positive impacts (i.e., reduction of
organic contaminant concentration in the feedwater by biodegradation) or reduce negative
impacts (i.e., disinfection of feedwater to reduce biofilm formation) of biological
processes in the performance of membrane filtration.
The effects are not strictly separated in process operations of pretreatment. Some pretreatment
processes can have multiple effects on membrane filtration. For example, coagulation may
results in two effects. Firstly, an increase of the particle size by the aggregation of aquatic
substances (physical) and secondly a chemical reduction of dissolved and colloidal organic
matter that may attribute to irreversible fouling (te Poele, 2005).
In general coagulation, prefiltration and adsorption are the most widely used pretreatment
technologies in full scale applications. Beside these technologies oxidation and ion exchange
are getting more attention. In the following sections the different pretreatment technologies
are presented.
2.4.3.1 Coagulation
Metcalf and Eddy (2003) define coagulation as the process of destabilizing colloids and
particles so that particle growth can occur as a result of particle collisions. Strictly the word
coagulation refers to the destabilization process and the word flocculation to the formation of
aggregates (flocks) consisting of destabilized colloidal and particulate matter and precipitated

Wastewater treatment plant effluent and membrane filtration
31
hydroxides. In this thesis coagulation is used as a general term that includes both
destabilization and flocculation. Most commonly cationic or metallic coagulants like
aluminium and ferric salts are used for pretreatment. The operation of coagulation for
membrane filtration can be directly (or so called direct in-line coagulation) or in combination
with sedimentation or filtration. During these separation steps particles subject to membrane
filtration can be effectively removed. Therefore the feedwaters after coagulation-
sedimentation/filtration usually cause less fouling than raw feedwater (Huang et al., 2007).
Roorda (2004) investigated the performance of an ultrafiltration pilot installation in
combination with coagulation-filtration as pretreatment. Although some increase of
performance was obtained, Roorda (2004) concludes that the technologies did not efficiently
remove the 0.1 – 0.2 µm particles, which is the fraction that predominantly determines
filtration characteristics. Direct in-line coagulation with ferric chloride was investigated by
Decarolis et al. (2001) on pilot scale with a dead-end ultrafiltration system. This research
showed that ferric chloride pretreatment enhanced membrane productivity by increasing
particle floc size, which led to decreased pore plugging, reduced cake layer resistance and
enhanced backwashing efficiency.
2.4.3.2 Prefiltration
In this thesis prefiltration as pretreatment for ultrafiltration and microfiltration involves the
use of conventional packed bed filters i.e. rapid sand filters, dual media filter etc. Its main
purpose is the removal of suspended (including coagulated flocs) and colloidal matter from
raw WWTP effluent. Many authors (de Koning and van Nieuwenhuijzen, 1999; Bourgeous et
al., 2001; Roorda, 2004; te Poele, 2005; Fan, et al., 2008) have reported about the
effectiveness of prefiltration prior to ultrafiltration or microfiltration. De Koning and van
Nieuwenhuijzen (1999) investigated the performance of the combination flocculation –
filtration – ultrafiltration at two WWTPs (WWTP Ede and WWTP Elburg) in the
Netherlands. Although the prefilter did not produce high removal efficiencies it appeared to
be an important part of the total polishing concept. However, the results differed at the two
treatment locations. At the WWTP Elburg prefiltration was required to achieve constant high
fluxes and reliable operation at constant trans membrane pressure. Without prefiltration the
flux rapidly decreased from an average of 90 L/m2.
h to a low level of 40 L/m2.
h, without
successful hydraulic cleaning procedures. Only chemical cleaning was effective for a short
term. At the WWTP Ede successful and stable operation of ultrafiltration was possible at a
trans membrane pressure of 0.6 – 0.9 bar without prefiltration. Nevertheless the content of
suspended solids was higher in the effluent of WWTP Ede compared to WWTP Elburg.
Therefore the authors suggested that the filterability of WWTP effluent is not related to
amount of particles or suspended solids but effected by local circumstances. This
phenomenon has been further investigated by Roorda (2004) who concluded that multi media
filtration slightly improves the filterability of WWTP effluent with a maximum of 25%. But
multi media filtration did not effectively decrease the 0.1 – 0.2 µm fraction of WWTP

Chapter 2
32
effluent. This fraction is not measured during the analyses of turbidity and suspended solids.
The results of Roorda (2004) have been confirmed by research of Bourgeous et al. (2001) and
te Poele (2005). Bourgeous et al. (2001) showed that a thin cake layer developed for
ultrafiltration of effluent after prefiltration, while a thicker cake layer developed for raw
WWTP effluent. The thinner cake layer showed better filterability and was completely
removed by a regular back flush. The cake layer found for raw WWTP effluent could not be
removed completely with a backflush because of clogging membrane fibers. More or less the
same observation was obtained by Fan, et al. 2008. Lab scale experiments showed that the
combination of coagulation and prefiltration (1.5 µm) resulted in better ultrafiltration and
microfiltration performance compared to coagulation-sedimentation and direct in-line
coagulation.
Next to the mentioned prefiltration techniques, recent work has shown biofiltration as a
promising pretreatment technology to reduce fouling (Mosqueda-Jimenez, 2006 and Huck and
Sozański, 2008). Treatment combinations of natural biofiltration i.e. bank filtration and soil
aquifer treatment and ultrafiltration/microfiltration are rarely applied in advanced water
treatment. Nevertheless biofiltration processes offer simple and cost effective measures to
reduce the content of bio available organic compounds (Zheng et al., 2009b). This effect has
been shown by Zheng, et al. (2009b) with respect to the removal of biopolymers of WWTP
effluent. Slow sand filtration of WWTP effluent removed the biopolymer peak and therefore
decreased the fouling potential of water samples to ultrafiltration membranes.
2.4.3.3 Adsorption
In the context of this thesis adsorption refers to the use of activated carbons and other “pre-
formed” adsorbents in precedence to membrane filtration. The adsorption process itself
involves the uptake of aquatic substances by the surface of the activated carbon. Due to the
high porosity and dispersity activated carbon has a relatively large specific surface area. In
combination with ultrafiltration and microfiltration activated carbon can have two functions.
Firstly, adsorption of small substances of WWTP effluent that can poorly be removed by the
membranes. These substances can be of different origin e.g. humic substances,
micropollutants, (organically bounded) heavy metals, etc. Secondly, the adsorbents may also
serve as competitor with organic matter that can cause membrane fouling once being adsorbed
on membrane surfaces (Crozes, et al., 1993).
Generally, activated carbon for water treatment can be separated in two size classifications:
powdered activated carbon (PAC), which typically has a diameter of less than 0.074 mm, and
granulated activated carbon, which has a diameter of larger than 0.1 mm (Metcalf and Eddy,
2003). The most intensively studied size for membrane filtration is probably powdered
activated carbon. PAC is added into the feedwater to adsorb the small substances; it can be
effectively rejected by ultrafiltration/microfiltration as its size is significantly greater than the
Wastewater treatment plant effluent and membrane filtration
33
membrane pores. Consequently, PAC in the membrane concentrate may be recycled to
maintain enough adsorbent concentration in feedwater. GAC is mostly applied in precedence
to ultrafiltration/microfiltration in a filterbed and operated like a discontinuous sand/anthracite
filter. This process is also referred to the name adsorptive filtration (Roorda, et al., 2005).
In respect to PAC and the effect on membrane fouling different findings are reported in the
literature. In general it seems that the effect depends on the membrane material, operation
mode, membrane configuration and type of feedwater. Mozia et al. (2005) tested the influence
of PAC addition on flux decline of three different polymer ultrafiltration membranes. The
tested membranes were prepared from polysulfone (PSF), cellulose acetate (CA) or
polyacrylonitrile (PAN). The researchers presented the combination of PAC addition and
membranes formed of PAN as most favourable considering the effectiveness of organics
removal and the permeate flux. In contrast an earlier study performed by Lin et al. (1999)
showed a significant decrease of flux of negatively charged polysulfone membranes due to
PAC addition. One of the main differences between both studies was the applied membrane
configuration; Lin et al. (1999) used a hollow fibre while Mozia et al. (2005) tested a flat
sheet membrane. The optimization of the PAC-UF configuration in terms of increase of
backwash pressure, greater linear velocity, feedwater direction and proper module design was
also suggested by Oh et al. (2006) to get a suitable integrated system. Nevertheless good
experience regarding ultrafiltration fouling control of WWTP effluent and PAC addition was
obtained by Shon et al. (2004a) and Haberkamp et al. (2007). Shon et al. (2004a) presented
similar reduction of flux decline for both flocculation and PAC adsorption. In spite of the
same effect the underlying mechanisms were different. Flocculation resulted in higher
reduction of colloidal matter and larger molecules than with PAC adsorption. The flocculation
also achieved a removal of a portion of small molecular weight organics through the
mechanisms of adsorption and complexation (Shon et al., 2004a). The PAC adsorption played
a major role in removing small organics only. The removal of the colloidal portion (between
3500 Da to 0.45 µm) by adsorption was not significant. Haberkamp et al. (2007) observed as
well a positive affect of PAC addition on flux decline during ultrafiltration but remarked that
increased demand of activated carbon due to considerable consumption of adsorption capacity
by low molecular weight substances, which do not presumably contribute tot membrane
fouling, may be a limiting factor for the application of adsorption as the pretreatment process
for fouling reduction.
Compared to the application of PAC addition less research is published about the use of
granulated activated carbon (GAC) filtration in precedence to ultrafiltration and
microfiltration. Nevertheless GAC and biological activated carbon filtration (BACF) give
important perspectives in minimizing organic fouling. The main distinction between BACF
and GAC filtration is the removal mechanism. BACF combines adsorption and
biodegradation where GAC filtration only implies adsorption as a removal mechanism.

Chapter 2
34
Regarding GAC filtration, Tsujimoto et al. (1998) found that this pretreatment step reduced
irreversible fouling of ultrafiltration membranes treating a natural surface water. The
combination of GAC – (cross flow) ultrafiltration and biologically treated sewage effluent
was investigated by Shon et al. (2004b). In this study this combination was compared with
other pretreatment steps for ultrafiltration: flocculation, PAC adsorption and flocculation
followed by PAC adsorption. Compared to the other pretreatment technologies the flux
decline after GAC filtration was more but it was still significantly better than raw biologically
treated sewage effluent. The combination of GAC filtration and airflushed microfiltration
with WWTP effluent was also subject of research by Roorda et al. (2005). In terms of stable
operation performance the researchers found adsorptive filtration one of the best pretreatment
steps for microfiltration.
2.4.3.4 Alternative pretreatment technologies
Advanced Oxidation Processes
In water treatment applications, advanced oxidation processes usually refer to a specific
subset of processes that involve ozone (O3), peroxide (H2O2), and/or ultra violet (UV) light.
Usually only ozonation is applied for the treatment of wastewater. Park (2002) investigated
ozonation of chemical wastewater as pretreatment for UF. It was concluded that the flux rate
increased as the amount of ozone increased. Seo et al. (2001) concludes for ceramic
membranes ozone is effective to control the membrane fouling by the increased organic
degradation.
Ion exchange
Application of magnetic ion exchange (MIEX®
) resin to membrane filtration has been studied
at different scales in the past few years. Zhang et al. (2006) tested MIEX®
as pretreatment to a
submerged membrane system in the treatment of biologically treated wastewater. It was found
that MIEX®
resin could effectively remove the small molecular weight (500 – 1000 Da)
organic matter and the hydrophilic portion of DOC. At optimal concentration MIEX®
could
remove as much as 60% of DOC in the wastewater resulting in a longer operational time of
the membrane process. Combining MIEX®
and PAC adsorption could even increase the
removal rate (TOC removal of 80%). Generally the effect of MIEX®
on ultrafiltration and
microfiltration seems to be positive though the major mechanisms are unsolved.
Precoat
Removal of the 0.1 to 0.2 µm fraction might be done by the formation of a precoat (e.g.
Diatomite, Powdered Activated Carbon (PAC), Kaolinite or iron oxide) on the membrane that
acts as secondary membrane. Enhanced Pre-Coat Engineering (EPCE) results in a better
restoration of the permeability after a backwash. Bigger particles seem to restore the
membrane better after a backwash or enhanced backwash. Smaller particles seem to give a

Wastewater treatment plant effluent and membrane filtration
35
lower rate of fouling. EPCE is a promising technique to increase membrane performance
(Galjaard et al., 2001).
Integrated pretreatment technologies
As discussed previously, pretreatment technologies often remove only a certain type or range
of compounds in WWTP effluent. It is, therefore, reasonable to consider that proper
integration of multiple pretreatment can combine the benefits of each separate pre-treatment
technology. For example, the technologies, coagulation – PAC adsorption – ultrafiltration are
presented by different researchers (Shon et al., 2004a and Haberkamp et al., 2007) as an
optimal combination in terms of flux decline and DOC removal. Roorda (2004) and te Poele
(2005) presented coagulation – multi media filtration – ultrafiltration as a good integrated
concept for stable operation performance. Generally, integration of pretreatment technologies
can provide better feedwater quality for membranes, but the costs of the entire system may
increase drastically (Huang et al., 2007).
2.4.4 Membrane characteristics The effective pore size (Lozier et al., 2008) and surface charge of membranes (Schafer et al.,
1998) are considered to be significant factors contributing to the reduction of permeate flux
The effective pore size of a membrane is a membrane characteristic affecting the decrease of
permeate flux. The lower the molecular weigh cut off (MWCO), the larger the membrane
resistance. A negatively charged membrane will electrostatically repulse negatively charged
functional groups associated with EfOM (Jarusutthirak and Amy, 2001). The more negative
charge density on the membrane surface is correlated to the greater hydrophilicity of the
membrane. Therefore, a less negative surface charge (more hydrophobic) may increase the
deposition of hydrophobic EfOM leading to more adsorptive fouling.
The interaction between EfOM and the membrane characteristics like surface charge and
MWCO has been investigated by Jarusutthirak and Amy (2001). They established a
dependency of the flux decline, EfOM rejection and fouling mechanisms on the charge of
membrane surface and the MWCO. The negatively charged surface led to the adsorption of
the hydrophobic portion of EfOM.
The effect of the pore size of membranes on the retention of foulants of WWTP effluent is
presented by Laabs et al. (2006). During filtration experiments with ultrafiltration membranes
(pore size of 10 nm) the substances (organic colloids, polysaccharides and proteins) eluting in
the polysaccharide peak of a size exclusion chromatogram changed completely e.g. the
feedwater exhibits a clearly polysaccharide peak, the permeate sample contains no substances
in this molecular weight/size range. But during the same experiment with microfiltration
membranes (pore size of 50 nm) the substances of the polysaccharide peak remained in the
Chapter 2
36
filtrate. Therefore Laabs et al. (2006) suggested that the fouling rate depends on the pore size
of the membranes even when the size of the pores differs a little.
2.5 Fouling indicators and predictions
As written in chapter 1 the performance of the ultrafiltration process is determined by both
filterability of the feedwater and by reversibility of the fouling layer. Both parameters are
affected by the operational conditions and membrane characteristics but the more fundamental
cause for membrane fouling are the properties of the feedwater. Therefore many researches
(Boerlage et al., 2003; Roorda, 2004; Rosenberg et al., 2005; Park et al., 2006; Kim and
DiGiano, 2006 and Huang et al., 2008) underline the need for a general method to measure
and predict the fouling potential of the feedwater to membrane filtration system. Such a
method can be used at the design stage to assess required pretreatment and later to monitor the
effectiveness and performance of a pretreatment system during plant operation (Park et al.,
2006). Ultimately the fouling indices enable engineers to determine the design requirements
without conducting pilot studies which need considerable time and expenses. There have been
attempts to establish tests and indices to describe the filterability, respectively fouling
potential of feed suspensions and solutions (Rosenberg et al., 2005):
� On-line measurements of flux and trans membrane pressure during continuous filtration
can be used to calculate the fouling rate (slope of resistance over time). This can be done
either in batch experiments (e.g. with side-stream modules) or in situ.
� Time to filter (TTF), modified fouling index (MFI), specific resistance to filtration (SRF)
and specific ultrafiltration resistance (SUR) are used to describe filterability. Recently the
unified modified fouling index (UMFI) is added to this list as a parameter to describe both
filterability and reversibility. All these tests are based on the theory of cake filtration and
are usually performed in dead-end mode on lab or bench scale.
2.5.1 Bench and lab scale tests
In this section briefly the MFI-(UF), UMFI and SUR are discussed.
2.5.1.1 Modified filtration index-(UF)
The MFI is measured in dead-end mode with a microfiltration membrane (0.45 µm) at
constant pressure (2 bar) and continous measurement (every 30 seconds) of the produced
filtrate. According to the cake filtration model (Hermia, 1982) at constant pressure the
following relation between filtration time and filtrated volume can be derived (Mulder, 1996):
VMFIAP
R
V
t m ⋅+⋅∆
⋅=
η (2.5)
in which: t = filtration time (s)
V = filtrate volume (m3)

Wastewater treatment plant effluent and membrane filtration
37
η = water viscosity (N s/m2)
Rm = membrane resistance (m-1
)
∆P = applied trans membrane pressure (bar or N/m2)
A = membrane surface area (m2)
MFI = membrane fouling index (s/m3)
Equation 2.5 predicts a linear relationship between t/V and V during cake filtration. A high
value of MFI indicates rapid fouling of the membrane.
The MFI is further developed by Boerlage et al. (2003) to the MFI-UF to measure and predict
the particulate fouling potential for different feedwaters in membrane filtration installations.
A disadvantage of the MFI-UF is the applied pressure. This pressure is 2 bar which is about 4
times more than usual in ultrafiltration applications. Especially during tests with WWTP
effluent the applied pressure will result in unrepresentative values due to the compression of
the formed cake layer.
2.5.1.2 Unified Membrane Filtration Index
The Unified Membrane Filtration Index (UMFI) has been recently reported by Huang et al.
(2008) and presented as a parameter to quantify and compare the fouling on different scales
(e.g., lab, bench and full scale) and different units (e.g., stirred-cell versus hollow fiber bench
scale units). A value of UMFI (m2/L) can be estimated from a data plot of inversed
normalized flux (Js/Js0) versus hydraulic throughput (L/m2) as shown in equation 2.6. Like the
other filtration indices the UMFI is based on solely cake filtration and Darcy’s law.
s
m
fc
s
VR
C
J
+=
α1
1,
(2.6)
in which: Js’ = normalized specific flux (-)
αc = specific cake resistance (m-1
)
Cf = concentration of foulants (kg/m3)
Rm = membrane resistance (m-1
)
Vs = permeate throughput (L/m2)
Based on this relationship, UMFI (m2/L) is defined as follows:
m
fc
R
CUMFI
α= (2.7)
For a filtration without hydraulic backwash, UMFI is related to the hydraulic property of the
cake layer (αc), the concentration of total foulants (Cf) and the hydraulic property of the clean
Chapter 2
38
membrane. Its value is not affected by the operating mode. Temperature effects are also
canceled out through the normalization of specific fluxes. If the concept is applied to a
filtration with either frequent hydraulic backwashes or chemical cleaning (as with the pilot
systems), the UMFI can still be calculated as a measure of the rate of hydraulically
irreversible fouling or chemically irreversible fouling that occurs within certain unit permeate
throughputs.
A critical note concerning the UMFI is that the value depends on the hydraulic property of the
clean membrane (Rm). As a consequence it means the UMFI is not universal but differs for
each type of membrane.
2.5.1.3 Specific Ultrafiltration Resistance
To measure the filterability of WWTP effluent Roorda (2004) developed a parameter called
Specific Ultrafiltration Resistance (SUR). The SUR is calculated from the slope of a filtration
curve (t/V versus V) that is measured in a period of 30 minutes of filtration over an
ultrafiltration membrane at a constant temperature (~ 20 °C) and a trans membrane pressure
(TMP) of 0.5 bar. The parameter is used during the experiments presented in this thesis and
therefore is described in detail in chapter 3.
2.5.1.4 Vito Fouling Measurement
The Belgian company VITO (Flemish Institute for Technological Research) developed a
filtration characterisation method called the Vito Fouling Measurement (VFM) (Braun et al.,
2005). In contrast to the MFI-(UF), UMFI and SUR the VFM aims to characterise (by
mathematical processing) all (complex) fouling phenomena (Brauns et al., 2002) instead of
only cake filtration. As a consequence the VFM measurement does not results in one value
like the MFI-(UF), UMFI and SUR but it will give a graphical presentation. By comparing
filtration graphs of different types of feedwater information is gained about the fouling
potential. However, since cake filtration is considered as the predominant mechanism during
ultrafiltration of WWTP effluent (Roorda, 2004) this approach will not provide much extra
information compared to the MFI-(UF), UMFI and SUR.
2.5.2 On-line measurements
In full scale or pilot installations, the filterability is measured in a different way. The
filterability is measured as fouling rate (dR/dt) which is the increase in filtration resistance
over time after one filtration period (see Figure 2.5) The filterability can be derived from on-
line measurements of flux, TMP and temperature (te Poele, 2005), see equations 2.8 and 2.9
dt
dR (2.8)

Wastewater treatment plant effluent and membrane filtration
39
JT
PR
⋅
∆=
)(η (2.9)
Figure 2.5 – Typical filtration curves illustrating filterability and reversibility
Reversibility is described as the extent within which the filtration resistance after applying a
hydraulic cleaning is returned to the start value. If the filtration resistance after hydraulic
cleaning is equal to the filtration resistance at the start of the previous filtration period, then
the fouling is considered to be completely reversible (te Poele, 2005). Figure 2.5 shows two
different filtration curves, with a different reversibility. The lowest filtration curve (covered
line) is completely reversible. The reversibility can be determined after a few filtration
periods and is illustrated in Figure 2.5 and described in equation 2.10.
t
R
∆
∆ (2.10)

Chapter 2
40
2.6 Summary The conventional method for the treatment of municipal wastewater is the activated sludge
process. After the treatment process the micro-organisms (activated sludge) are separated
from the treated water (WWTP effluent) by sedimentation but the WWTP effluent still
consists of different constituents that may foul the membranes when it is tertiary treated by
e.g. ultrafiltration. In this thesis fouling is defined as “the process resulting in loss of
performance of a membrane due to the deposition of suspended or dissolved substances on its
external surfaces, at its pore openings, or within its pores”.
In the literature soluble microbial products (SMP) and/or (soluble) extracellular polymeric
substances (EPS) are considered as the major foulants of EfOM during ultrafiltration of
WWTP effluent. But it has to be considered that in addition to soluble organic material,
colloidal organic particles play an important role during ultrafiltration of effluent. With the
analytical method that is mainly applied (specific UV-absorbance, total organic carbon,
colorimetric analyses and size exclusion chromatography) only concentrations are
characterized but not the size. Furthermore Roorda (2004) and te Poele (2005) have shown the
importance of fractionation tests in order to quantify size of organic colloids. These studies
have shown that especially the colloidal fraction of 0.1 – 0.2 µm causes fouling.
In order to remove fouling membranes are periodical chemically and hydraulically cleaned. In
addition to these operational strategies the feedwater of membranes can also be pretreated.
Main applied pretreatment technologies in practice are coagulation, prefiltration and
adsorption. Unfortunately these pretreatment technologies do only partly remove the earlier
mentioned fraction size of 0.1 – 0.2 µm. Therefore other pretreatment technologies have to be
applied to remove this colloidal fraction. In the literature biofiltration (e.g. slow sand
filtration) and the combination of coagulation – adsorption are considered as promising
technologies. Therefore the performance of these technologies is investigated in the context of
this thesis.
To measure the fouling rate/potential of WWTP effluent during ultrafiltration of WWTP
effluent different methods are available. In this thesis the SUR measurement is used because
the process conditions of this method are closely related to the process conditions applied in
practice. Furthermore this measurement results in one value independent of the initial
membrane resistance. On pilot and full scale the fouling is characterised in accordance to
methods applied by other researchers.
Wastewater treatment plant effluent and membrane filtration
41
References Abdessemed, D., Nezzal, G. and Ben Aïm, R. (2002). Fractionation of a secondary effluent with membrane
separation. Desalination, 146, 433 – 437.
Adin, A. (1999). Particle characteristics: a key factor in effluent treatment and reuse. Water Science and
Technology, 40, 4, 67 – 74.
Amy, G. (2008). Fundamental understanding of organic matter fouling. Desalination, 231, 44 – 51.
Azema, N., Pouet, M-F., Berho, C. and Thomas, O. (2002). Wastewater suspended solids study by optical
methods. Colloids and Surfaces A: Physochemical and Engineering Aspects, 204, 131 – 140.
Barker, D.J. and Stuckey, D.C. (1999). A review of soluble microbial products (SMP) in wastewater treatment
systems. Water Research, 33, 14, 3063 – 3082.
Berg, G.B. van den (1988). Concentration polarization in ultrafiltration – models en experiments. PhD thesis, U
lux decline in ultrafiltration processes. PhD thesis, Department of Chemical Technology, University of Twente,
Enschede, The Netherlands.
Boerlage, S.F.E., Kennedy, M.D., Aniye, M.P., Abogrean, E., Tarawneh, Z.S. and Schippers, J.C. The MFI-UF
as water quality test and monitor. Journal of Membrane Science, 2003, 271 – 289.
Bowen, W.R. and Jenner, F. (1995). Theoretical descriptions of membrane filtration of colloids and fine
particles: an assessment and review. Advances in Colloid an Interface Science, 56, 141 – 200.
Bourgeos, K.N., Darby, J.L. and Tchobanoglous, G. Ultrafiltration of wastewater: effects of particles, mode of
operation, and backwash effectiveness. Water Research, 35, 1, 77 – 90.
Brauns, E., Hoof, V. van, Molenberghs, B., Dotremont, C., Doyen, W. and Leysen, R. (2002). A new method of
measuring and presenting the membrane fouling potential. Desalination, 150, 31 – 34.
Brauns, E., Dotremont, C., Hoof, V. van and Doyen, W. (2005). Het meten van het membraan
vervuilingspotentieel van water. Afvalwaterwetenschap, 4, 1, 18 – 35.
CBS (2006). 25 Jaar Statistiek Zuivering van afvalwater in vogelvlucht. (in Dutch), Voorburg/Heerlen, the
Netherlands.
CBS (2008). Zuivering van stedelijk afvalwater. (in Dutch), Voorburg/Heerlen, the Netherlands, March 2008,
www.StatLine.nl.
Cho, J., Amy, G., Pellegrino, J. and Yoon, Y. (1998). Characterization of clean and natural organic matter
(NOM) fouled NF and UF membrane, and foulants characterization. Desalination, 2, 2, 101 – 108.
Costa, A.R., de Pinho, M.N. and Elimelech, M. (2006). Mechanisms of colloidal natural organic matter in
fouling of ultrafiltration. Journal of Membrane Science, 281, 716 – 725.
Crozes, G., Anselme, C. and Mallevialle, J. (1993). Effect of adsorption of organic-matter on fouling of
ultrafiltration membranes. Journal of Membrane Science, 84, 1 – 2, 61 – 77.
Decarolis, J., Hong, S. and Taylor, J. (2001). Fouling behaviour of a pilot scale inside-out hollow fiber UF
membrane during dead-end filtration of tertiary wastewater. Journal of Membrane Science, 191, 165 – 178.
Defrance, L. and Jaffrin, M.Y. (1999). Comparison between filtration at fixed transmembrane pressure and fixed
permeate flux: application to a membrane bioreactor used for wastewater treatment. Journal of Membrane
Science, 152, 203 – 210.
Drewes, J.E. and Fox, P. (1999). Fate of natural organic matter (NOM) during groundwater recharge using
reclaimed water. Water Science and Technology, 40, 9, 241 – 248.

Chapter 2
42
Dijk, J.C. van, Rietveld, L.C., Verberk, J.Q.J.C. (2001). Drinking water technology 1 ct4470 (in Dutch). Lecture
notes, Department of Sanitary Engineering, Delft University of Technology, Delft, The Netherlands.
Fan, L., Nguyen, T., Roddick, F.A. and Harris, J.L (2008). Low-pressure membrane filtration of secondary
effluent in water reuse: Pre-treatment for fouling reduction. Journal of Membrane Science, 320, 135 – 142.
Flemming, H-C. and Wingender J. (2001). Relevance of microbial extracellular polymeric substances (EPSs) –
Part 1: Structural and ecological aspects. Water Science and Technology, 43, 6, 1 – 8.
Galjaard, G., Buijs, P., Beerendonk, E., Schoonenberg, F. and Schippers, J.C. (2001). Precoating (EPCE®
) UF
membranes for direct treatment of surface water. Desalination, 139, 1, 305 – 316.
Geilvoet, S.P. (2010). The Delft Filtration Characterisation method. PhD thesis, Department of Sanitary
Engineering, Delft University of Technology, Delft, The Netherlands.
Haberkamp, J., Ruhl, A.K., Ernst, M. Jekel, M. (2007). Impact of coagulation and adsorption on DOC fractions
of secondary effluent and resulting behaviour in ultrafiltration. Water Research, 41, 3794 – 3802.
Haberkamp, J., Ernst, M., Böckelmann, U., Szewzyk, U. and Jekel, M. (2008). Complexity of ultrafiltration
membrane fouling caused by macromolecular dissolved organic compounds in secondary effluents. Water
Research, 42, 3153 – 3163.
Heijman, S.G.J., Vantieghem, M., Raktoe, S., Verberk, J.Q.J.C. and van Dijk, J.C. (2007). Blocking of
capillaries as fouling mechanism for dead-end ultrafiltration. Journal of Membrane Science, 287, 1, 119 – 125.
Hejzlar, J. and Chudoba, J. (1986). Microbial polymers n the aquatic environment-II: isolation form biologically
nonpurified and purified municipal wastewater and analysis. Water Research, 1986, 20, 10, 1217 – 1221.
Hermia, J. (1982). Constant pressure blocking filtration laws – application to power-law non Newtonian fuids.
Transactions of the Institution of Chemical Engineers, 60, 183 – 187.
Huck, P.M. and Sozański, M.M. (2008). Biological filtration for membrane pre-treatment and other
applications: towards the development of a practically-oriented performance parameter. Journal of Water
Supply: Research and Technology-AQUA, 57, 4, 203 – 223.
Huang, H., Young, T. and Jacangelo, J.G. (2008). Unified membrane fouling index for low pressure filtration of
natural water: principles and methodology. Environmental Science & Technology, 42, 714 – 720.
Huang, H., Young, T. and Jacangelo, J.G. (2007). Pretreatment and its effect and implications on water
treatment by low pressure membranes. Proceedings 4th IWA leading-edge conference and exhibition on water
and wastewater technologies, June 3-6, Singapore, Republic of Singapore.
Ho, C.C. and Zydney, A.L. (2002). Transmembrane pressure profiles during constant flux microfiltration of
bovine serum albumin. Journal of Membrane Science, 209, 363 – 377.
Koning, J. de and Nieuwenhuiijzen, A.F. van. Optimal combination of flocculating filtration and ultra filtration
for advanced effluent treatment in the Netherlands. Water Science and Technology, 40, 4 – 5, 285 – 292.
Jarusutthirak, C. and Amy, G. (2001). Membrane filtration of wastewater effluents for reuse: effluent organic
matter rejection and fouling. Water Science and Technology, 42, 10, 225 – 232.
Jarusutthirak, C., Amy, G. and Croué, J.P. (2002). Fouling characteristics of wastewater effluent organic matter
(EfOM) isolates on NF and UF membranes. Desalination, 145, 247 – 255.
Jarusutthirak, C. and Amy, G. (2007). Understanding soluble microbial products (SMP) as component of effluent
organic matter (EfOM). Water Research, 41, 2787 – 2793.
Kim, J. and DiGiano, F.A. (2006). A two-fiber, bench scale-test of ultrafiltration (UF) for investigation of
fouling rate and characteristics. Journal of Membrane Science, 271, 196 – 204.

Wastewater treatment plant effluent and membrane filtration
43
Kim, I.S. and Jang, N. (2006). The effect of calcium on the membrane fouling in the membrane bioreactor
(MBR). Water Research, 40, 2756 – 2764.
Koros, W.J., Ma, Y.H. and Shimidzu, T. (1996). Terminology for membranes and membrane processes; IUPAC
recommendations 1996. Journal of Membrane Science, 120, 149 – 159.
Laabs, C.N., Amy, G.L. and Jekel. M. (2006). Understanding the size and character of fouling-causing
substances from effluent organic matter (EfOM) in low-pressure membrane filtration. Environmental Science &
Technology, 40, 14, 4495 – 4499.
Laspidou, C.S. and Rittmann, B.E. (2002). A unified theory for extracellular polymeric substances , soluble
microbial products, and active and inert biomass. Water Research, 36, 2711 – 2720.
Lee, E.K., Chen, V. and Fane, A.G. (2008). Natural organic matter (NOM) fouling in low pressure membrane
filtration – effect of membranes and operation modes. Desalination, 218, 257 – 270.
Levine, A.D., Tchobanoglous, G. and Asano, T. (1985). Characterization of the size distribution of cantaminants
in wastewater: treatment and reuse implications. Journal WPCF, 57, 7, 805 – 816.
Levine, A.D., Tchobanoglous, G. and Asano, T. (1991). Size distributions of particulate contaminants in
wastewater and their impact on treatability. Water Research, 25, 8, 911 – 922.
Lojkine, M.H., Field, R.W. and Howell, J.A. (1992). Crossflow microfiltration of cell suspensions: a review of
models with emphasis on particle size effects. Transition Inst. Chemical Engineering, 70, 149 – 164
Lin, C-F., Huang, Y-J. and Hao, O.J. (1999). Ultrafiltration processes for removing humic substances: effect of
molecular weight fractions and PAC treatment. Water Research, 33, 5, 1252 – 1264.
Lozier, J., Cappuci, L., Amy, G., Lee, N., Jacangelo, J.G., Huang, H., Young, T., Mysore, C., Emeraux, C.,
Clouet, J., Croué, J-P. and Heijman, B. (2008). Natural organic matter fouling of low pressure membrane
systems, American Water Works Association Research Foundation, USA.
Metcalf and Eddy (2003). Wastewater engineering, treatment and reuse. Fourth Edition, McGraw-Hill, New
York, United States of America.
Mozia, S., Tomaszewska, M. and Morawski. (2005). Studies on the effect of humic acids and phenol on
adsorption-ultrafiltration process performance. Water Research, 39, 501 – 509.
Mosqueda-Jimenez, D.B and Huck, P.M. (2006). Fouling analysis of ultrafiltration and nanofiltration. Water
Practice Technology, 1, 4, 90 – 99.
Mulder, M. (1996). Basic principles of membrane technology. Kluwer Academic Publishers, Dordrecht, The
Netherlands.
Nieuwenhuijzen, A.F. van (2002). Scenario Studies into Advanced Particle Removal in the Physical – Chemical
Pre-treatment of Wastewater. PhD thesis, Delft University of Technology, Delft, The Netherlands.
Park, C., Kim, H., Hong, S. and Choi, S-I. (2006). Variation and prediction of membrane fouling index under
various feed water characteristics. Journal of Membrane Science, 284, 248 – 254.
Park, Y.G. (2002). Effect for reducing membrane-fouling in the UF membrane. Desalination, 147, 43 – 48.
Poele, S. te (2005). Foulants in ultrafiltration of wwtp effluent. PhD thesis, Department of Sanitary Engineering,
Delft University of Technology, Delft, The Netherlands.
Ravazzini, A.M. (2008). Crossflow Ultrafiltration of Raw Muncipal Wastewater. PhD thesis, Department of
Sanitary Engineering, Delft University of Technology, Delft, The Netherlands.
Roorda, J.H. (2004). Filtration characteristics in dead-end ultrafiltration of wwtp-effluent. PhD thesis,
Department of Sanitary Engineering, Delft University of Technology, Delft, The Netherlands.


