NA SA TECHNICAL NOTE ? AFWL KIRTLAND THE APPLICATION OF COLOR DISPLAY TECHNIQUES FOR THE ANALYSIS OF NIMBUS INFRARED RADIATION DATA bY Lewis J. Allison, G. Thomas Goddard Space Flight Center Greenbelt, Md. 20771 and Hurold Azlsfresser Cherrix Westinghozlse Defense a n d Space Center /- 10 Baltimore, Md. 21203 TN D-6786 c,/ I_ ': RETUI <DOUL AFB, P 1 I 1'1: NATIONAL AERONAUTICS AND SPACE ADMINISTRATION WASHINGTON, D.' C. AUGUST 1972
Transcript
N A S A TECHNICAL NOTE
? AFWL KIRTLAND
THE APPLICATION OF COLOR DISPLAY TECHNIQUES FOR THE ANALYSIS OF NIMBUS INFRARED RADIATION DATA
bY Lewis J. Allison, G. Thomas Goddard Space Flight Center Greenbelt, Md. 20771
and
Hurold Azlsfresser
Cherrix
Westinghozlse Defense and Space Center /
10Baltimore, Md . 21203
TN D-6786 c,/I_
': RETUI <DOUL AFB, P
1
I 1'1:
NATIONAL AERONAUTICS A N D SPACE ADMINISTRATION WASHINGTON, D.' C. AUGUST 1972
1. Report No. 2. Government Accession No. NASA TN D-6786 1
4. T i t le and Subtitle
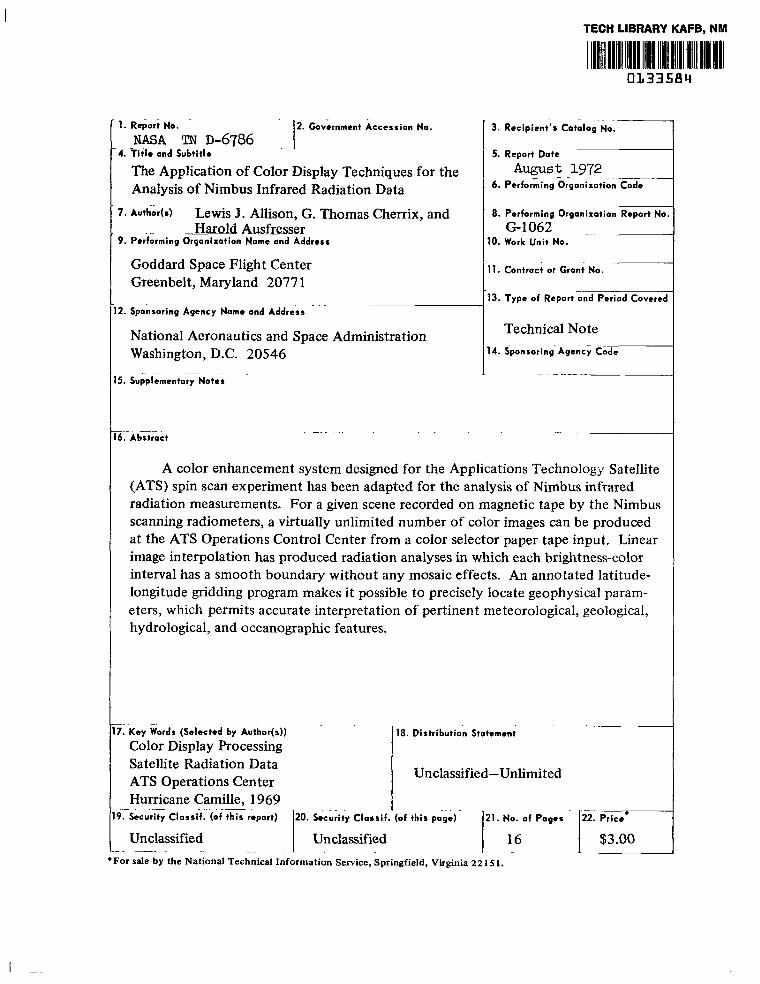
The Application of Color Display Techniques for theI Analysis of Nimbus Infrared Radiation Data 7. A u t W s ) Lewis J. Allison, G. Thomas Cherrix, and
Harold Am f r w e r 9. Performing Orgonizotion Name and Address
Goddard Space Flight Center Greenbelt, Maryland 2077 1
. .. 12. Sponsoring Agency Name and Addressi
National Aeronautics and Space Administration Washington, D.C. 20546
A color enhancement system designed for the Applications Technology Sate (ATS) spin scan experiment has been adapted for the analysis of Nimbus infrared radiation measurements. For a given scene recorded on magnetic tape by the Nin scanning radiometers, a virtually unlimited number of color images can be produc at the ATS Operations Control Center from a color selector paper tape input. Lir image interpolation has produced radiation analyses in which each brightness-colc interval has a smooth boundary without any mosaic effects. An annotated latituc longitude gridding program makes it possible to precisely locate geophysical parar eters, which permits accurate interpretation of pertinent meteorological, geologic; hydrological, and oceanographic features.
I17. Key Fords (Selected by Author(s)) 18. Distribution Statement
Color Display Processing Satellite Radiation Data
Unclassified-UnlimitedATS Operations Center
19-SecurG Classif. (of th i r report) 20. Security Clorsif . (of this poge)
THE APPLICATION OF COLOR DISPLAY TECHNIQUES FOR THE ANALYSIS OF NIMBUS INFRARED RADIATION DATA
by
Lewis J. Allison G. Thomas Cherrix
Goddard Space Flight Center
and
Harold Ausfresser Westinghouse Defense and Space Center
INTRODUCTION
The use of color presentation to more readily and accurately perform human discrimination tasks has-been the subject of increased interest in the fields of biomedicine, geology, topographic mapping, air pollution, and oceanography (Cleveland and McFadden, 1970; Mairs, 1970; Smith, 1971 ;Stratton and Sheppard, 1970; Veress, 1970; Yost et al., 1970).
The adaptation of pseudo-color image enhancement techniques to the Applications Technology Satellite (ATS) data had been pioneered by the ATS project at Goddard Space Flight Center (Westinghouse Electric Corporation, 1968 and 1970). Subsequent applications of this system (Kreins and Allison, 1970) and of other, less sophisticated color depiction systems172(Oort, 1970; Warnecke et al., 1971) were made to Nimbus radiation data.
The infrared radiometer flown on the Nimbus 3 meteorological satellite recorded outgoing emitted radiation in the 3 .4 to 4 .2 pm “atmospheric window”; detailed observations of the Earth’s surface and three-dimensional cloud structures were possible from these nighttime measurements. The normal presentation of these data can be either a black and white photofacsimile image, formed scan by scan from the original analog record, or a computer-produced grid print map in a standard geographical map projection (Allison et al., 1971 ;Shenk and Fujita, 197 1 ;Warnecke et al., 1968). Only approximately six to eight gray scale intervals of brightness temperatures could be delineated by eye in the photographic print; the contoured computer map also had its distinctive interpretation problems. The
lK. H. Szekielda and W. F. Mitchell, “Oceanographic Applications of Color-Enhanced Satellite Imageries,” NASA-GSFC Document X-651-71-53, 1971, 13 pp,
2T. Wilheit, J. Blinn, W. Campbell, A. Edgerton, and W. Nordberg, “Aircraft Measurements of Microwave Emission From Arctic Sea Ice,” NASA-dSFC Document X-651-71-417, September 1971.
1
utilization of a computer-produced color grid print map has helped to simplify this radiation data analysis problem because the human eye can distinguish many more colors (i.e., brightness intervals) than shades of gray.
This paper briefly describes the Nimbus 3 radiation experiment and data samples and the multicolor ATS system used to process the enhanced Nimbus infrared radiation analyses.
NIMBUS 3 HI GH-R ESOLUTlON INFRARED RAD1OMETER EXPERIMENT
The Nimbus 3 meteorological satellite, which was launched April 14, 1969, carried a high-resolution infrared radiometer (HRIR), shown in Figure 1. This single-channel scanning radiometer contained a lead-selenide photoconductive cell which was radiatively cooled and had a peak spectral response in the 3.4 to 4.2 pm atmospheric window (Figure 2). At night, the radiometer measured radiance temperatures between approximately 2 10 and 330 K with a noise equivaIent temperature of less than 1.5 K for a 260 K background. The radiometer scan mirror rotates the field of view of the detector through 27r rad (360”) in a plane normal to the orbital path and through the center of the Earth. The detector views, in order, the housing cavity, outer space, Earth, outer space, and the housing cavity. The outer space level serves as a zero reference and, together with the radiometer housing level, provides for an in-flight check of instrument calibration. The instantaneous field of view of the instrument is 0.0087 rad (0.5’); at an average satellite altitude of 1100 km, a 9 by 9 km scan spot of the Earth’s surface is viewed at the subsatellite point.
The radiometer produces three identical outputs. Two of these are routed to separate tape recorder high-data-rate storage subsystems (HDRSS’s A and B), and the third, the direct readout infrared radiometer (DRIR), is broadcast in real time to ground stations equipped with special automatic picture transmission sets.
The calibration and data reduction methods for daytime and nighttime HRIR data are quite different. The daytime data are reduced to percent of reflected solar energy, whereas the nighttime data are reduced to equivalent blackbody temperatures. Since this paper is concerned only with the pseudo-color processing of nighttime HRIR data, the reader interested in daytime HRIR data is referred to “Nimbus 3 Users’ Guide” (Allied Research Associates, Inc., 1969) for further details.
At the Data Acquisition Facilities (Fairbanks, Alaska, and Rosman, North Carolina), the HRIR information is demultiplexed and recorded on magnetic tape. It is transmitted to GSFC, where the FM signal is demodulated, synchronized, and displayed on a photofacsimile recorder. This recorder converts the radiometer analog output signals into a continuous strip picture, line by line, on 70 mm black and white film. Blanking circuits in the recorder reject unwanted sections of each scan line. Only the Earth scan and small portions of the space scan used for calibration purposes are recorded on this film.
An example of Nimbus 3 HRIR photofacsimile coverage over Hurricane Camille on August 18, 1969, as it crossed the gulf coast at approximately midnight is shown in Figure 3. This storm, whose maximum surface winds were approximately 90 m-s-’ (1 75 kt) at this time, ranks as one of the most destructive ever to hit the United States, with total damage estimated at $1.42 billion and 258 deaths (DeAngelis and Nelson, 1969). This convenient photographic display of the analog data
2
contains an approximate geographic grid superimposed, which has an accuracy of 1" of great circle arc at the subsatellite point. Severe distortions occur at the sides near the horizons because of the Earth's curvature. Only six shades of equivalent blackbody temperatures are distinguishable by the human eye.
The grid print map is a computer transformation of the radiation data, calibrated in equivalent blackbody temperature, in a Mercator projection. The advantages of this form of presentation are the display of absolute values, the elimination of distortion, and the possibility of compositing consecutive orbits into quasi-synoptic areal maps.
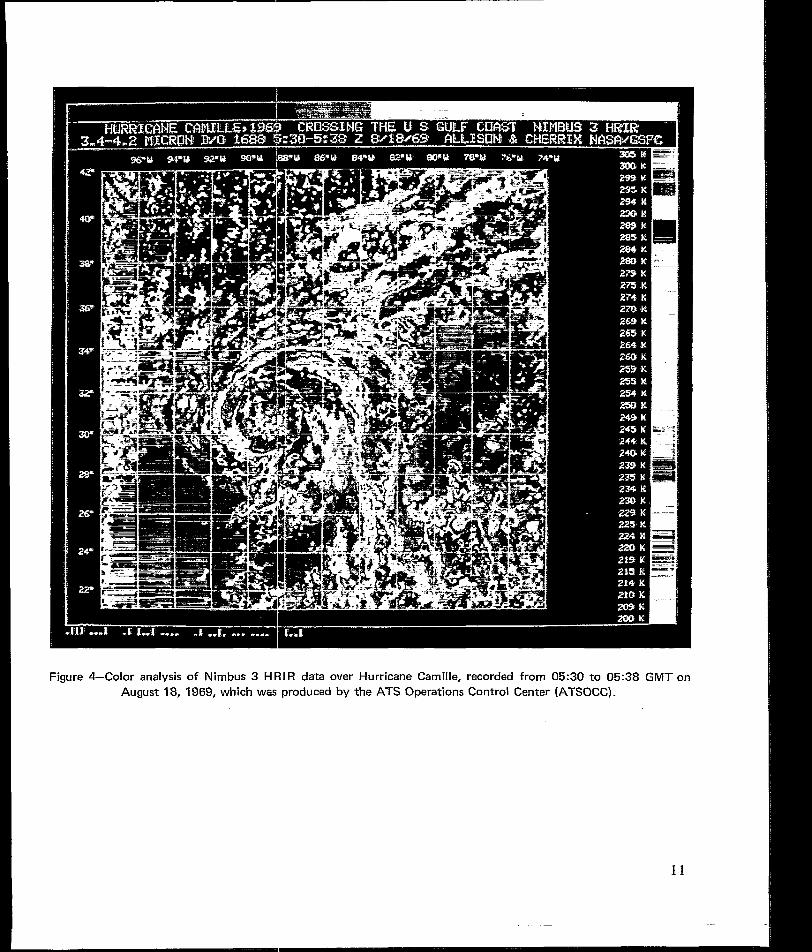
Figure 4 shows a color grid print map of Camille, which uses 17 colors and 3 shades of gray to signify 5 K intervals. One can determine, at a glance, the warm (purple-red) end of the spectrum. This indicates low clouds, ground, and/or sea surface temperatures in the Gulf of Mexico and the Gulf Stream. Middle clouds are shown by tan to yellow, and high clouds are shown by greens, blues, and grays. A 1:1 million Mercator mapping program was used which averages approximately three to five scan spots at each one-eighth degree of latitude and longitude intersection. More details concerning the basic color principles of display enhancement used in this technique are described by Kreins and Allison (1970).
Figure 5 shows the numerical contouring, which facilitates the recognition of large cloud patterns over the storm, but one still has difficulty in interpreting the various numerically printed brightness intervals. The hand-drawn map (Figure 6) took approximately 2 days to complete, and experienced analysts still had some difficulty in data interpretation without detailed zip-toning or cross-hatching of the brightness intervals (Pouquet, 1969).
In order for the reader to place Figures 3 through 6 in their proper perspective, Figure 7 is included, which shows the ground track of Camille with associated daytime coverage by the Nimbus 3 image dissector camera system.
ATS GROUND RECORDING AND COLOR PLAYBACK SYSTEM
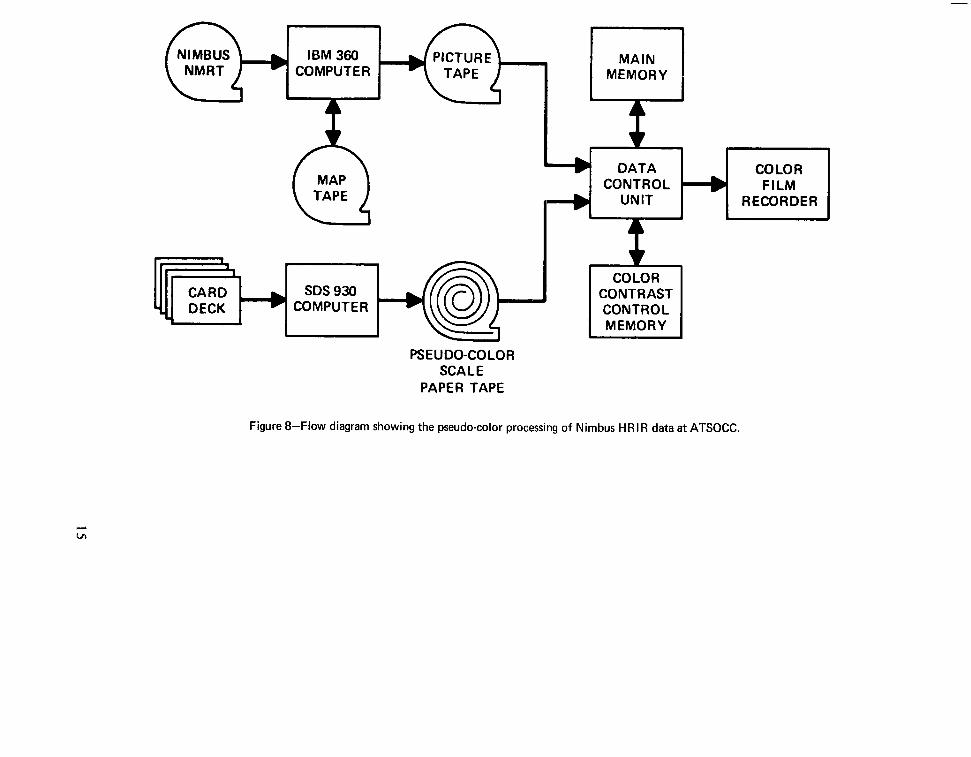
The ATS Operations Control Center (ATSOCC) at GSFC has equipment designed to process and color-display data from any source, provided they are in the proper format to be accepted by the data processing system. The basic equipment consists of two digital tape decks, a data control unit, and a cathode ray tube (CRT) film recorder for color and black and white. The data control unit is capable of electronic expansion of selected picture areas and intensity control made possible by a programmable digital look-up table. With normal black and white or color video data input, this intensity control subunit can be set to produce contrast enhancement, contour maps, and pseudo-color pictures. These techniques have been proven effective in producing black and white, color, and various types of pseudo-color pictures from ATS 1,ATS 3, Nimbus, and Orbiting Astronomical Observatory source data. A generalized overview of the processing capabilities of this facility is shown in Figure 8. The Nimbus infrared data are converted into a color contoured chart by the following steps:
The Nimbus analog data are initially received at either the Fairbanks, Alaska, or the Rosman, North Carolina, Data Acquisition Facility and are then transmitted to GSFC, where they are processed by a CDC 930 computer. The output, in the form of a digitized infrared radiation tape with
3
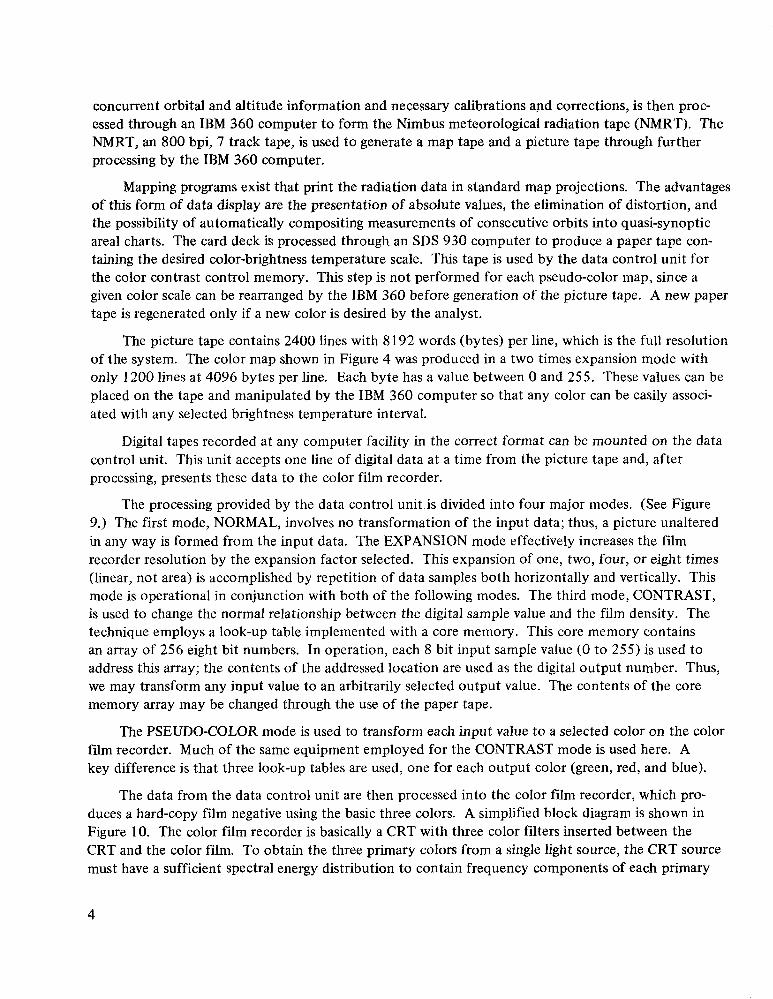
concurrent orbital and altitude information and necessary calibrations and corrections, is then processed through an IBM 360 computer to form the Nimbus meteorological radiation tape (NMRT). The NMRT, an 800 bpi, 7 track tape, is used to generate a map tape and a picture tape through further processing by the IBM 360 computer.
Mapping programs exist that print the radiation data in standard map projections. The advantages of this form of data display are the presentation of absolute values, the elimination of distortion, and the possibility of automatically compositing measurements of consecutive orbits into quasi-synoptic areal charts. The card deck is processed through an SDS 930 computer to produce a paper tape containing the desired color-brightness temperature scale. This tape is used by the data control unit for the color contrast control memory. This step is not performed for each pseudo-color map, since a given color scale can be rearranged by the IBM 360 before generation of the picture tape. A new paper tape is regenerated only if a new color is desired by the analyst.
The picture tape contains 2400 lines with 8192 words (bytes) per line, which is the full resolution of the system. The color map shown in Figure 4 was produced in a two times expansion mode with only 1200 lines at 4096 bytes per line. Each byte has a value between 0 and 255. These values can be placed on the tape and manipulated by the IBM 360 computer so that any color can be easily associated with any selected brightness temperature interval.
Digital tapes recorded at any computer facility in the correct format can be mounted on the data control unit. This unit accepts one line of digital data at a time from the picture tape and, after processing, presents these data to the color film recorder.
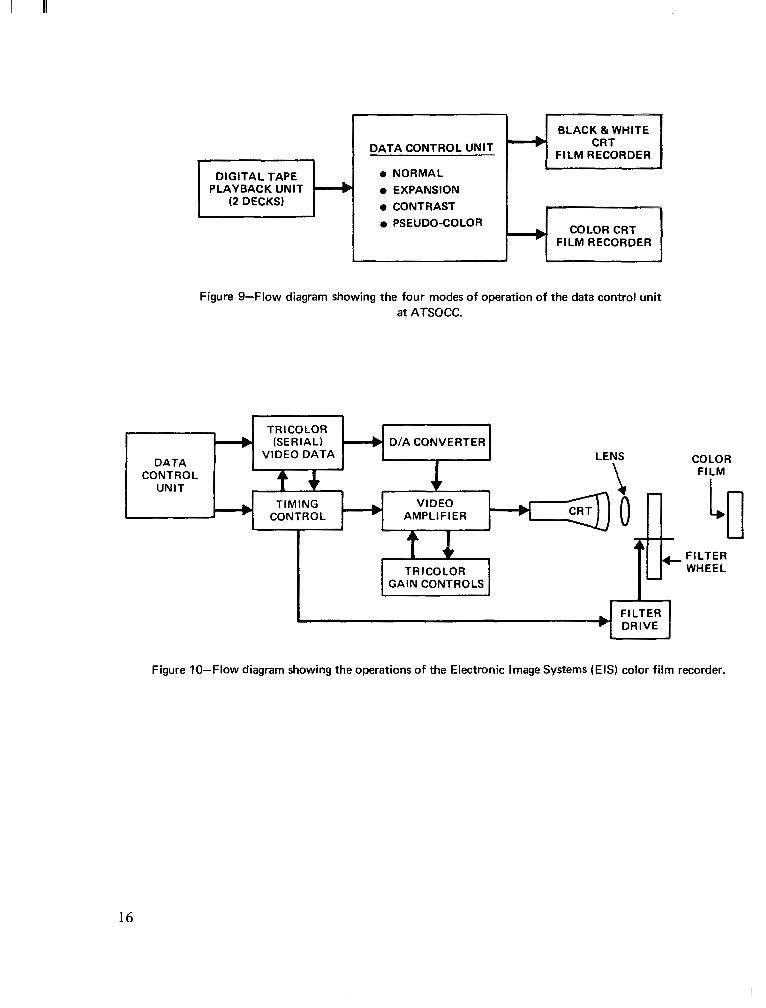
The processing provided by the data control unit.is divided into four major modes. (See Figure 9.) The first mode, NORMAL, involves no transformation of the input data; thus, a picture unaltered in any way is formed from the input data. The EXPANSION mode effectively increases the film recorder resolution by the expansion factor selected. This expansion of one, two, four, or eight times (linear, not area) is accomplished by repetition of data samples both horizontally and vertically. This mode is operational in conjunction with both of the following modes. The third mode, CONTRAST, is used to change the normal relationship between the digital sample value and the film density. The technique employs a look-up table implemented with a core memory. This core memory contains an array of 256 eight bit numbers. In operation, each 8 bit input sample value (0 to 255) is used to address this array; the contents of the addressed location are used as the digital output number. Thus, we may transform any input value to an arbitrarily selected output value. The contents of the core memory array may be changed through the use of the paper tape.
The PSEUDO-COLOR mode is used to transform each input value to a selected color on the color film recorder. Much of the same equipment employed for the CONTRAST mode is used here. A key difference is that three look-up tables are used, one for each output color (green, red, and blue).
The data from the data control unit are then processed into the color film recorder, which produces a hard-copy film negative using the basic three colors. A simplified block diagram is shown in Figure 10. The color film recorder is basically a CRT with three color filters inserted between the CRT and the color film. To obtain the three primary colors from a single light source, the CRT source must have a sufficient spectral energy distribution to contain frequency components of each primary
4
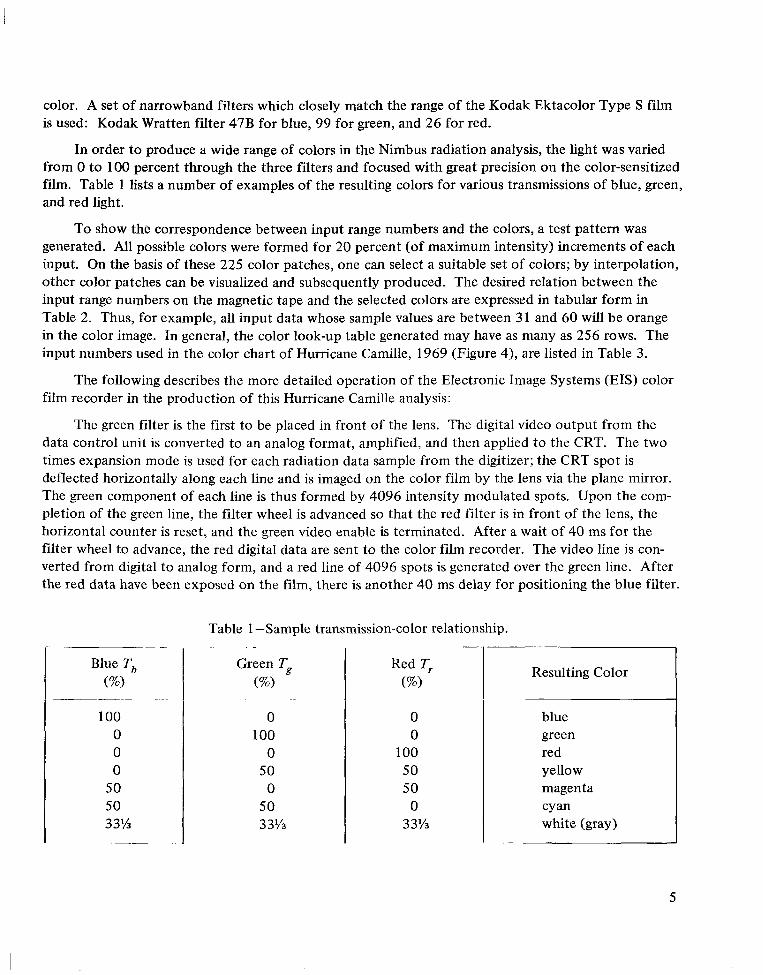
color. A set of narrowband filters which closely match the range of the Kodak Ektacolor Type S film is used: Kodak Wratten filter 47B for blue, 99 for green, and 26 for red.
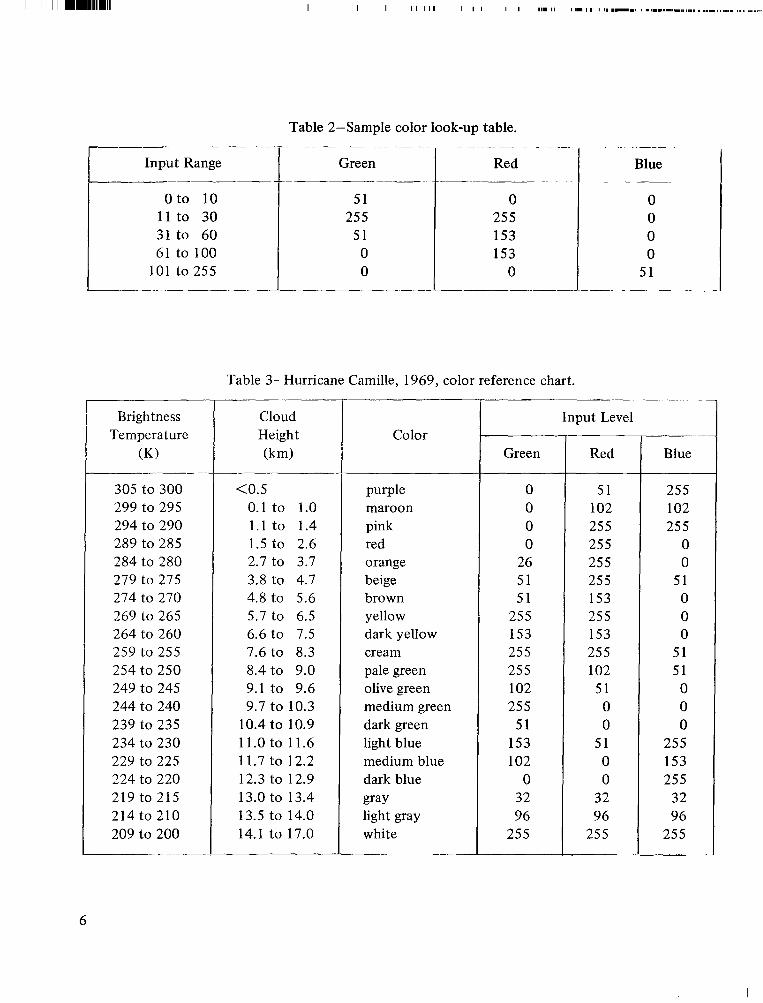
In order to produce a wide range of colors in the Nimbus radiation analysis, the light was varied from 0 to 100 percent through the three filters and focused with great precision on the color-sensitized film. Table 1 lists a number of examples of the resulting colors for various transmissions of blue, green, and red light.
To show the correspondence between input range numbers and the colors, a test pattern was generated. All possible colors were formed for 20 percent (of maximum intensity) increments of each input. On the basis of these 225 color patches, one can select a suitable set of colors; by interpolation, other color patches can be visualized and subsequently produced. The desired relation between the input range numbers on the magnetic tape and the selected colors are expressed in tabular form in Table 2. Thus, for example, all input data whose sample values are between 3 1 and 60 will be orange in the color image. In general, the color look-up table generated may have as many as 256 rows. The input numbers used in the color chart of Hurricane Camille, 1969 (Figure 4), are listed in Table 3 .
The following describes the more detailed operation of the Electronic Image Systems (EIS) color film recorder in the production of this Hurricane Camille analysis:
The green filter is the first to be placed in front of the lens. The digital video output from the data control unit is converted to an analog format, amplified, and then applied to the CRT. The two times expansion mode is used for each radiation data sample from the digitizer; the CRT spot is deflected horizontally along each line and is imaged on the color film by the lens via the plane mirror. The green component of each line is thus formed by 4096 intensity modulated spots. Upon the completion of the green line, the filter wheel is advanced so that the red filter is in front of the lens, the horizontal counter is reset, and the green video enable is terminated. After a wait of 40 ms for the filter wheel to advance, the red digital data are sent to the color film recorder. The video line is converted from digital to analog form, and a red line of 4096 spots is generated over the green line. After the red data have been exposed on the film, there is another 40 ms delay for positioning the blue filter.
Oto 10 51 0 11 to 30 255 255 31 to 60 51 153 61 to 100 0 153
101 to255 0 0 _ _ ~ _
Table 3-Hurricane Camille, 1969, color reference chart. ~~
Brightness Cloud Input Level Temperature Height Color
(K) (km) Green Red Blue
305 to 300 <0.5 purple 0 51 255 299 to 295 0.1 to 1.0 maroon 0 102 102 294 to 290 1.1 to 1.4 pink 0 255 255 289 to 285 1.5 to 2.6 red 0 255 0 284 to 280 2.7 to 3.7 orange 26 255 0 279 to 275 3.8 to 4.7 beige 51 255 51 274 to 270 4.8 to 5.6 brown 51 153 0 269 to 265 5.7 to 6.5 yellow 255 255 0 264 to 260 6.6 to 7.5 dark yellow 153 153 0 259 to 255 7.6 to 8.3 cream 255 255 51 254 to 250 8.4 to 9.0 pale green 255 102 51 249 to 245 9.1 to 9.6 olive green 102 51 0 244 to 240 9.7 to 10.3 medium green 255 0 0 239 to 235 10.4 to 10.9 dark green 51 0 0 234 to 230 11.0 to 11.6 light blue 153 51 255 229 to 225 11.7 to 12.2 medium blue 102 0 153 224 to 220 12.3 to 12.9 dark blue 0 0 255 219 to 215 13.0 to 13.4 gray 32 32 32 214 to 210 13.5 to 14.0 light gray 96 96 96 209 to 200 14.1 to 17.0 white 255 25 5 255
-~ __
6
The blue video line is then displayed. Thus, at each of the 4096 spots along the line, the three colors have been superimposed on the film to form an “integrated” color spot. The end of the blue video display increments the vertical counter in preparation for the next tricolor line. The procedure continues to cycle until 1200 tricolor lines have been displayed in approximately 30 minutes. The standard data transfer rate to the color film recorder is 45 kHz. This is the rate for real time buffered operation, digital playback operation (both normal and expanded), and analog playback operation.
CONCLUSION
The color Nimbus radiation analysis which was produced by ATSOCC at GSFC is superior to a black and white picture principally because the human eye can interpret color more readily than the same number of shades of gray. Hence, the radiation data originally recorded on the Nimbus satellite are more effectively displayed and interpreted by the human analyst. This color technique has been applied to tornado studies using Nimbus 4 temperature-humidity infrared radiometer data and ITOS 1 and NOAA 1 infrared data and will be used to produce color time-lapse movies over severe weather systems on a 24 hour basis from the Synchronous Meteorological Satellite infrared data during 1974.
ACKNOWLEDGMENTS
The authors would like to thank John Lahzun and Wendell Sunderlin of the ATS Project for their original support in this endeavor; Joseph garksdale, Lawrence Fritz, and Douglas Johnson for invaluable programming assistance; and Dr. Raymond Wexler for his helpful comments in the review of this article.
Goddard Space Flight Center National Aeronautics and Space Administration
Greenbelt, Maryland, December 7, 1971 160-44-51-01-51
REFERENCES
Allied Research Associates, Inc., “Nimbus 3 Users’ Guide,” prepared by Allied Research Associates, Inc., Concord, Mass., for the Nimbus Project, NASA-GSFC, Greenbelt, Md., 1969.
Allison, L. J., Cherrix, G. T., and Ausfresser, H., “Color Analysis of Hurricane Camille, 1969, Using Nimbus Infrared Radiation Data,” Bull. Amer. Met. SOC.52(9): 862, Sept. 1971.
Cleveland, N. P., and McFadden, W. J., “Electronic Color,” Photogram. Eng. 36(8): 830-839, 1970.
DeAngelis, R. M., and Nelson, E. R., “Hurricane Camille, August 5-22, 1969,” U.S. Dept. of Commerce, ESSA, Climatological Data, National Summary, 20(80), 1969.
Kreins, E. R., and Allison, L. J., “Color Enhancement of Nimbus High Resolution Infrared Radiometer Data,” Appl. Opt. 9(3): 681-686, 1970.
7
I
Mairs, R. L., “Oceanographic Interpretation of Apollo Photographs,” Photogram. Eng. 36(10): 10451058, 1970.
Oort, A., “The Energy Cycle of the Earth,” Sci. Amer. 223(3): 54-64, 1970.
Pouquet, J., “Gkomorphologie et Ere Spatiale,” Sonderdruck aus Zeitschrift fur Geomorphologie, neue Folge Band 13, Heft 4, Seite 414-47 1 Verlag Gebruder Borntraeger, 1 Berlin-7 Stuttgart, 1969.
Shenk, W., and Fujita, T., “The Structure of Tropical Storm Camille Over the U.S. as Determined From Satellite and Conventional Measurements,” paper presented at the Seventh Technical Conference on Hurricanes and Tropical Meteorology, Barbados, B.W.I., Dec. 6-8, 197 1.
Smith, F. R., “Color Contrast Methods in Microscopy and Photomicrography,” Photog. Appl. Sci. Tech. andMed. 6(3): 19-23, 1971.
Stratton, R. H., and Sheppard, J. J., Jr., “A Photographic Technique for Image Enhancement: Pseudo-color Three-Separation Process,” U.S. Air Force Project Rand Report R-596-PR, Santa Monica, Calif., 1970, 41 pp.
Veress, S. A., “Air Pollution Research,” Photogram. Eng. 36(8): 840-848, 1970.
Warnecke, G., Allison, L. J., Kreins, E. R., and McMillin, L. M., “A Satellite View of Typhoon Marie 1966 Development,” NASA Technical Note D-4757, 1968, 94 pp.
Warnecke, G., Allison, L. J., McMillin, L. M., and Szekielda, K. H., “Remote Sensing of Ocean Currents and Sea Surface Temperature Changes Derived From the Nimbus I1 Satellite,” J. Phys. Ocean. l( l) 45-60, 1971.
Westinghouse Electric Corporation, “ATS-1 SSCC Data Reduction and Analysis,” Final Report, Contract No. NAS 5-1 1513, Defense and Space Center, Baltimore, Md., prepared for NASA-GSFC, Greenbelt, Md., 1968.
Westinghouse Electric Corporation, “Final Project Report for the Ground Recording and Playback System,” Contract No. NAS 5-1 1597 (July 1968-December 1969), Defense and Space Center, Baltimore, Md., prepared for NASA-GSFC, Greenbelt, Md., 1970.
Yost, E. F., Anderson, R., and Wenderoth, S., “Multispectral Terrain Photography,” Technical Report SERGTR-13, Contract No. NAS 9-9341, Science Engineering Research Group, Long Island University, New York, prepared for NASA-MSC, Houston, Tex., 1970.
8
DR: N E
MCITOR
RAD IAT 10N /
SUN 7s,
SHIELD ELECT RONICs
RADIATION
Figure 1-Nimbus 3 HRIR.
1.o 1 1 1
0.9 2 0.8 - RELATIVE RESPONSE $(A)-a UJ 0.7 - vs. v)z WAVE LENGTH 0 0.6 n v) w 0.5 - HRIR FLIGHT UNIT F-5 CT W 0.4 z !- 0.3 4
0.2 0.1
1 I
0 1.o 1.5 2.0 2.5 3.0 3.5 4.0 4.5 WAVELENGTH (pm)
Figure 2-Effective spectral response of the Nimbus 3 HRIR.
9
SO'"
30"N
30'"
lo0"W 90"w 80"W
Figure 3-Photofacsimile print of Hurricane Camille, 1969, recorded by the Nimbus 3 HRlR from 0530 to 05:38 Greenwich mean time (GMT) on August 18, 1969.
10
Figure 4-Color analysis of Nimbus 3 H R l R data over Hurricane Camille, recorded from 05:30 to 05:38 GMT on August 18, 1969, which was produced by the ATS Operations Control Center (ATSOCC).
11
Figure 5-Computer-contoured grid print map of Nimbus 3 HRI R data (equivalent blackbody temperature in kelvins) over Hurricane Camille, recorded from 05:30 to 0538 GMT on August 18, 1969.
12
1 Y W 46' 45.N
40' 4O.N
3501 35'N
30'1 M"N
25'1 !5'N
2091 'O'N I I
Figure 6-Hand analysis of a computer-produced grid print map of Nimbus 3 HRlR data (equivalent blackbody temperature in kelvins) over Hurricane Camille, recorded from 05:30to 05:38GMT on August 18, 1969.
13
AUGUST 19 AUGUST 20
AUGUST 18
AUGUST 17 AUGUST 16
AUGUST 21
NIMBUS 3 TRACKS HURRICANE CAM1LLE
Photographiccoverage of Camille, one of the deadliest hurricanes in recent history, begins with a picture of the storm's infancy on August 11, 1969. Camille was christeneda tropical storm on August 14 and reachedhurricane strength the following day. It then swept through the southeastern United States and back into the Atlantic, where it is shown in the last photograph with Hurricane Debbie.
AUGUST 11
Figure 7-Nimbus 3 image dissector camera pictures of Hurricane Camille from its formative stage on August 11, 1969, to i ts near dissipation on August 21, 1969, with associated ground track.
MEMORY
COLOR FILM
RECORDER
PSEUDO-COLOR SCALE
PAPER TAPE
Figure 8-Flow diagram showing the pseudo-color processing of Nimbus HRlR data at ATSOCC.
I II
7BLACK &WHITE
DATA CONTROL UNIT FILM RECORDER
DIGITAL TAPE PLAYBACK UNIT 0 EXPANSION
0 CONTRAST I I
PSEUDOCOLOR COLOR CRT FILM RECORDER
I I I
Figure 9-Flow diagram showing the four modes of operation of the data control unit at ATSOCC.
III+ (SERIAL) D/A CONVERTER
DATA VIDEO DATA LENS COLOR
CONTROL FILM UNIT t
TIMING
FILTER WHEEL
Figure IO-Flow diagram showing the operations of the Electronic Image Systems (EIS) color film recorder.
16
.___ _.4 '--""'--NATIONAL AERONAUTICS AND SPACE ADMINISTRATION
WASHINGTON, D.C. 20546 POSTAGE A N D FEES P A I D N A T I O N A L AERONAUTICS A N D
OFFICIAL BUSINESS SPACE A D M I N I S T R A T I O N
PENALTY FOR P R I V A T E USE 1300 FIRST CLASS M A I L 451 (Z)'U S M A I L
If Uridelivernble (Section 158POSTMASTER ~ Postal Rfiiniial) Do Not Return
'"The aeronautical and space activities of the United States shall be conducted so as to contribute . . . to the expansion of human Rnowledge of phenomena in the atmorphere and space. The Administration shall provide for the widest practicuble and appropriate dissemination of information concerning its activities and the results thereof."
-NATIONAL AERONAUTICSAND SPACE ACT OF 1958
NASA SCIENTIFIC AND TECHNICAL PUBLICATIONS TECHNICAL REPORTS: Scientific and technical information considered important, ' complete, and a lasting contribution to existing knowledge.
TECHNICAL NOTES: Information less broad in scope but nevertheless of importance as a contribution to existing knowledge.
TECHNICAL MEMORANDUMS: Information receiving limited distribution because of preliminary data, security classification, or other reasons. Also includes conference proceedings with either limited or unlimited distribution.
CONTRACTOR REPORTS: Scientific and technical information generated under a NASA contract or grant and considered an important contribution to existing knowledge.
TECHNICAL TRANSLATIONS: Information published in a foreign language considered to merit NASA distribution in English.
SPECIAL PUBLICATIONS: Information derived from or of value to NASA activities. Publications include final reports of major projects, monographs, data compilations, handbooks, sourcebooks, and special bibliographies.
TECHNOLOGY UTILIZATION PUBLICATIONS: Information on technology used by NASA that may be of particular interest in commercial and other non-aerospace applications. Publications include Tech Briefs, Technology Utilization Reports and Technology Surveys.
Details on the availability of these publications may be obtained from:
SCIENTIFIC AND TECHNICAL INFORMATION OFFICE
N A T I O N A L A E R O N A U T I C S A N D SPACE A D M I N I S T R A T I O N Washington, D.C. 20546