THE APPLICATION OF PORTER’S GENERIC BUSINESS STRATEGIES AND PERFORMANCE OF PHARMACEUTICAL WHOLESALERS IN KENYA BY PAULINE OLWANDE A Management Research Project Submitted in Partial Fulfillment of the Requirements for the Degree of Master of Business Administration, School of Business, University of Nairobi 2012
Transcript
THE APPLICATION OF PORTER’S GENERIC BUSINESS STRATEGIES
AND PERFORMANCE OF PHARMACEUTICAL WHOLESALERS IN
KENYA
BY
PAULINE OLWANDE
A Management Research Project Submitted in Partial Fulfillment of the
Requirements for the Degree of Master of Business Administration,
School of Business, University of Nairobi
2012
i
DECLARATION
I hereby declare that this management research project is my original work. It has not been
presented by any other person from the University or any other institution.
The strategy literature provides numerous theories, research methodologies, and ideas on
the strategy-performance relationship. Strategy research has its roots in industrial
organization (IO) theory. According to Bain (1956), the IO framework of industry
behavior, firm performance or profitability is seen as a function of the industry structure.
Industry characteristics rather than firm-based issues are found to determine firm
performance (Barney, 1986). This structure-conduct-performance model from IO and
economics has been used in industries with high concentrations and similar firms (Seth
and Thomas, 1994). Some studies have not found any linkage between strategy and
performance (McGee and Thomas, 1986, 1992). To investigate the strategy and
performance linkage, many researchers began utilizing approaches found to be
generalizable across industries, specifically those proposed by Porter (1987).
2.4 Organizational Performance Measures
While researchers may not always agree on the best strategy, or strategy combination,
most if not all, support the long-term benefits of strategic planning for the successful
performance of an organization or business unit. However, measuring the performance of
a company is challenging. Researchers disagree about how to both define and
operationalize performance (Buckley et al., 1988; Littler, 1988; Day and Wensley, 1988).
Most studies on organizational performance use a variety of financial and non-financial
success measures. Researchers employ financial measures such as profit (Saunders and
Wong, 1985; Hooley and Lynch, 1985; Baker et al., 1988), turnover (Frazier and Howell,
1983), return on investment (Hooley and Lynch, 1985), return on capital employed
(Baker et al., 1988), and inventory turnover (Frazier and Howell, 1983). Non-financial
23
measures include innovativeness (Goldsmith and Clutterbuck, 1984) and market standing
(Saunders and Wong, 1985; Hooley and Lynch, 1985). When performance is measured at
a variety of levels (national, industry, company, and product), comparison of results is
rather difficult (Frazier and Howell, 1983; Buckley et al., 1988; Baker and Hart, 1989).
Measures of firm performance generally include bottom-line financial indicators such as
sales, profits, cash flow, return on equity, and growth. It is however, also important to
determine how a firm compares with its industry competitors when assessing firm
performance (Dess and Robinson, 1984). With the multitude of competitive environments
faced by firms in different industries, knowing only absolute financial numbers such as
sales, profits, or cash flow is not very illuminating unless viewed in the context of how
well the firm is doing compared to their competition. Therefore, it is important to use an
industry comparison approach when making firm performance assessments for
organizations sampled from a wide variety of industries. This study assessed the
relationship between Porter’s generic business strategies and Key Performance Indicators
such as market share; profitability and business growth so as to enable investors in the
various industries make informed decisions.
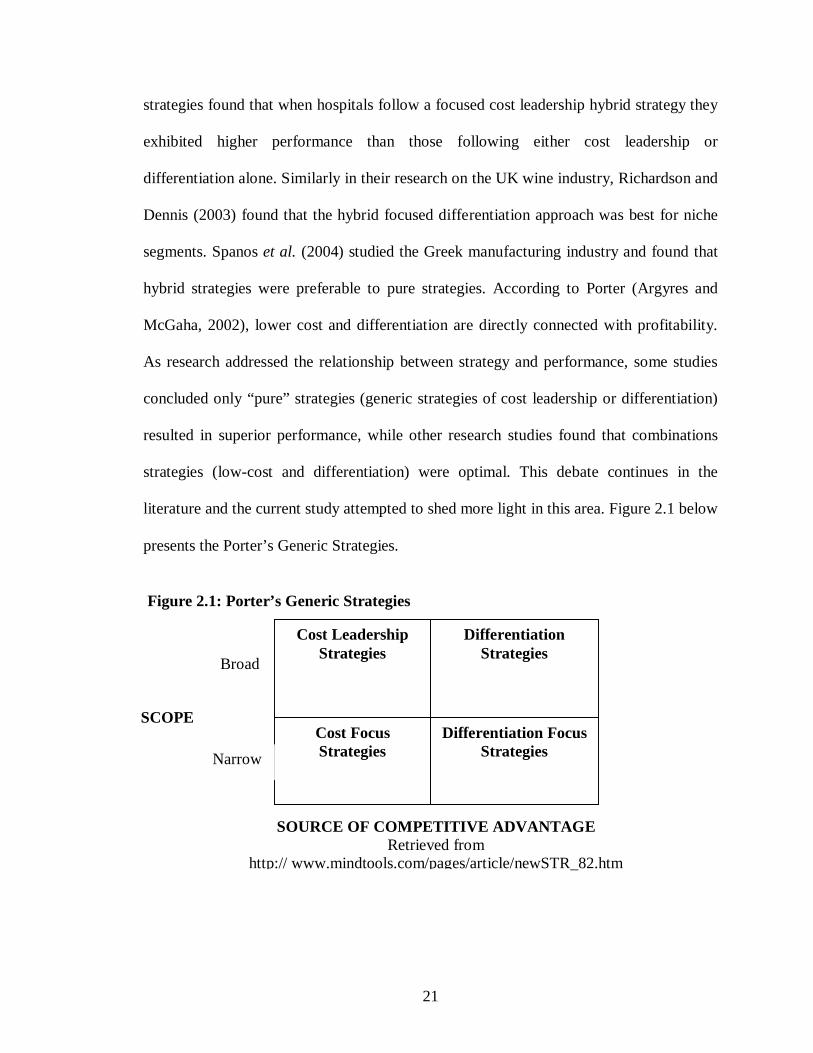
2.5 Conceptual Framework
The conceptual framework shows a diagrammatic relationship among the principle
variables – differentiation, cost leadership, focus and organizational performance. Figure
2.2 below presents the conceptual framework
24
Figure 2.2: Conceptual Framework
Independent Variable – X Dependent Variable
-y– Y
Source: The Author
This chapter reviewed the relevant literature in terms of theoretical background, Porter’s
generic business strategies, firm performance measures, identifying organizational
performance measures and the Author’s conceptual framework showing a diagrammatic
relationship among the principle variables and organizational performance.
Differentiation Strategy
Cost Leadership Strategy
Focus Strategy
Organizational Performance
Influence
25
CHAPTER THREE: RESEARCH METHODOLOGY
3.1 Introduction
This chapter defines the research design and methodology for the study. It contains a
description of the study design, population of the study, sampling design, data collection
instruments and procedures, data analysis and presentation.
3.2 Research Design
For purposes of this study, a descriptive cross sectional survey was undertaken. The
method was preferred as it permitted gathering of data from the respondents in natural
settings. Descriptive designs result in a description of the data, whether in words,
pictures, charts, or tables, and whether the data analysis shows statistical relationships or
is merely descriptive. Descriptive research is designed to describe the characteristics or
behaviors of a particular population in a systematic and accurate fashion. Survey research
uses questionnaires and interviews to collect information about people’s attitudes, beliefs,
feelings, behaviors, and lifestyles. The design was used to describe the what, who, when,
how and whereof the phenomenon. It had been used in the past by many researchers,
including Kibiru, 1999; Murage, 2001; Ndubai, 2003; and Ogolla, 2005.
3.3 Population of the study
The population of the study consisted of all the registered Multinational Pharmaceutical
wholesalers in Kenya, whose number stood at 40 as at July, 2012 (Pharmacy and Poisons
Board, 2012). The pharmaceutical wholesalers are located in the major towns in Kenya
26
and can be stratified in terms of distribution on the basis of the eight provinces. Due to
the small number of population of the study, a census study was conducted. In each of the
Pharmaceutical Wholesalers’ organizations, the Business Development manager or the
equivalent constituted the respondent.
3.4 Data Collection
A semi-structured questionnaire was used to collect primary data from the respondents.
Closed ended questions were presented on a Likert type scale. The Likert type scale,
commonly used in business research was applied because it allows participants to provide
their perceptions and opinions both in terms of direction (positive or negative) and
intensity (degree of agreement or disagreement). The ratings were on a scale of 1 (lowest
impact or least important) to 5 (highest or most important). The questionnaire had two
main sections. Section I captured the profile of the respondents and the pharmaceutical
wholesalers while section II captured information on the use of competitive strategies by
pharmaceutical wholesalers in Kenya.
The questionnaire was pre-tested on a small number of respondents who were selected on
a judgmental basis. The researcher and/or the research assistant delivered by hand, the
questionnaires to the personnel in charge of business development in the Pharmaceutical
wholesalers located in Nairobi and its environs while for those located outside Nairobi,
the questionnaires were emailed to them. A letter of introduction and questionnaire was
enclosed in an envelope delivered to the respondents. In addition, the researcher made
telephone calls to the respective respondents to further explain the purpose of the study
27
and set a time frame for the completion of the questionnaires. The respondents were
given a period of two weeks to complete and return the questionnaires. Once completed,
the researcher collected the questionnaires.
3.5 Data analysis and presentation
The Statistical Package for Social Sciences (SPSS) was used as an aid in the analysis.
The researcher preferred SPSS because of its ability to cover a wide range of the most
common statistical and graphical data analysis. The collected data from the questionnaire
and secondary sources were systematically organized in a manner to facilitate analysis.
For purposes of the study, the data pertaining to the profile of respondents were analyzed
using measures of central tendency and dispersion. In order to determine the relationship
between Porter’s Generic Strategies and firm performance, correlation and regression
analyses was undertaken. Measures of central tendency (mean scores and percentages)
and measures of dispersion (range, variance and standard deviation) were computed as
appropriate. In addition, bar charts, pie charts and graphs were also used. The information
was presented and discussed as per the objectives.
28
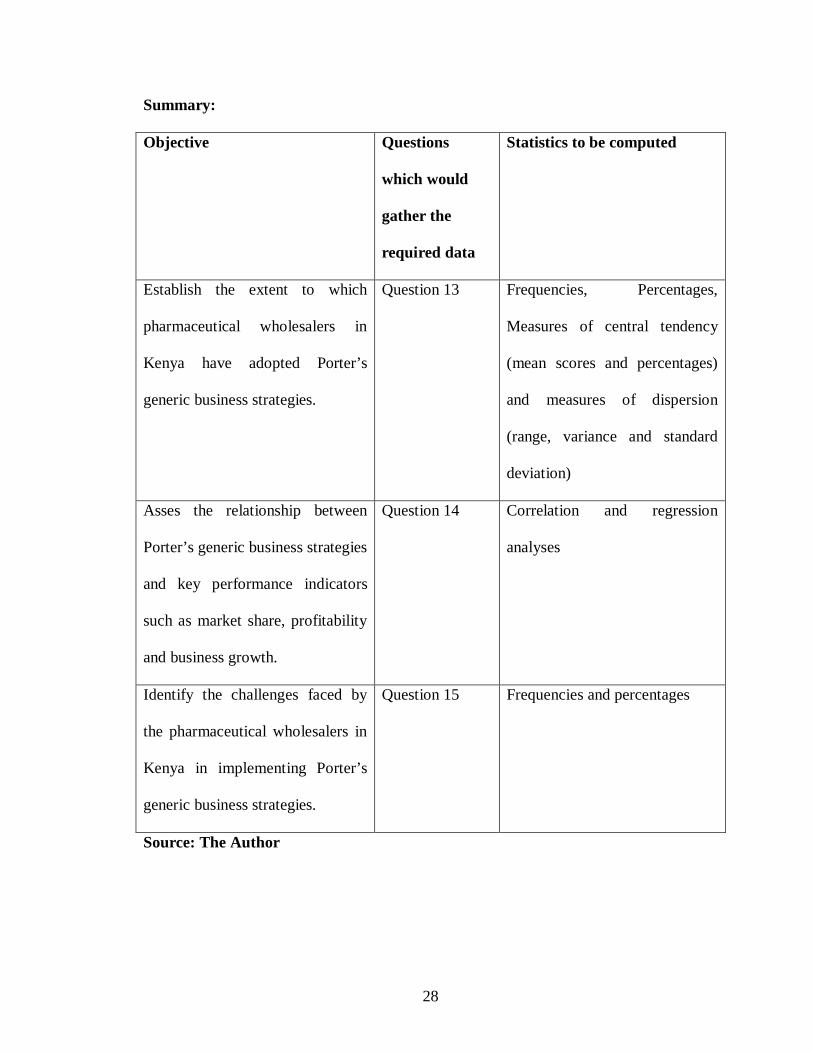
Summary:
Objective Questions
which would
gather the
required data
Statistics to be computed
Establish the extent to which
pharmaceutical wholesalers in
Kenya have adopted Porter’s
generic business strategies.
Question 13 Frequencies, Percentages,
Measures of central tendency
(mean scores and percentages)
and measures of dispersion
(range, variance and standard
deviation)
Asses the relationship between
Porter’s generic business strategies
and key performance indicators
such as market share, profitability
and business growth.
Question 14 Correlation and regression
analyses
Identify the challenges faced by
the pharmaceutical wholesalers in
Kenya in implementing Porter’s
generic business strategies.
Question 15 Frequencies and percentages
Source: The Author
29
CHAPTER FOUR: DATA ANALYSIS, FINDINGS AND DISCUSSION
4.1: Introduction
The research objective was to examine the application of Porter’s generic strategies by
Pharmaceutical wholesalers in Kenya. This chapter presents the analysis and findings
with regard to the objective and discussion of the same. The data was collected from the
40 Multinational Pharmaceutical wholesalers in Kenya. Respondents were personnel in
charge of business development in the Pharmaceutical wholesalers. The findings are
presented in percentages and frequency distributions, mean and standard deviations.
4.2: General information
4.2.1: Response Rate
A total of 40 questionnaires were issued out. The completed questionnaires were edited
for completeness and consistency. Of the 40 questionnaires issued, 37 were returned.
The returned questionnaires represented a response rate of 92.5%, which the study
considered adequate for analysis.
Figure 4.1: Response Rate
Source: Primary data
30
4.2.2: Distribution of respondents by ownership
As shown in table 4.2.1, most (75.68%) of the respondents firms were predominantly
foreign owned. 16.22% were both local and foreign owned while only 8.10% were
predominantly locally owned.
Table 4.2.1: Ownership structure Frequency Percent
Predominantly local (51% or more) 3 8.10
Predominantly foreign (51% or more) 28 75.68
Balanced between foreign and local (50/50) 6 16.22
Total 37 100.0
Source: Primary data
4.2.3: Distribution of respondents by length of operation in Kenya (Years).
The findings in table 4.2.2, indicates that 46% of the firms had been operating in Kenya
for over 16 years, 37.8% for 11 to 15 years and the rest (16.2%) had been in operation in
the country for a period of 6 to 10 years.
Table 4.2.2: Length of operation in Kenya (Years). Period Frequency Percent 6 to 10 Years 6 16.2 11 to 15 Years 14 37.8 16 Years and above 17 46 Total 37 100
Source: Primary data
31
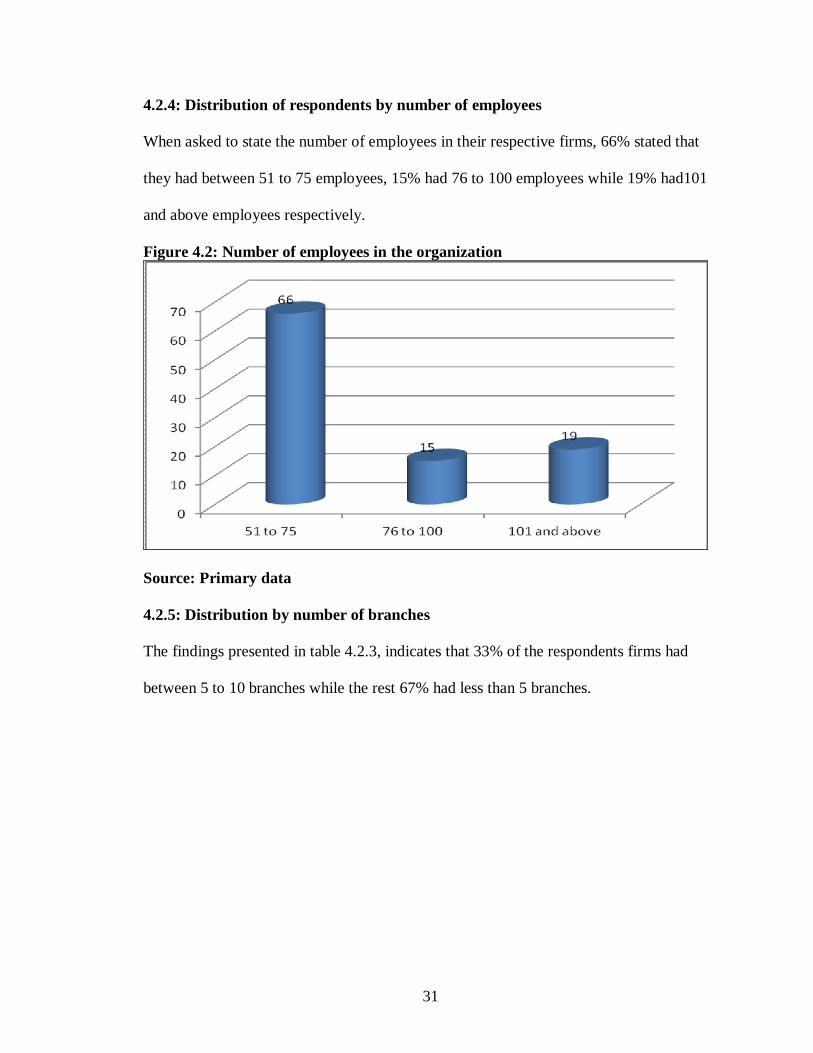
4.2.4: Distribution of respondents by number of employees
When asked to state the number of employees in their respective firms, 66% stated that
they had between 51 to 75 employees, 15% had 76 to 100 employees while 19% had101
and above employees respectively.
Figure 4.2: Number of employees in the organization
Source: Primary data
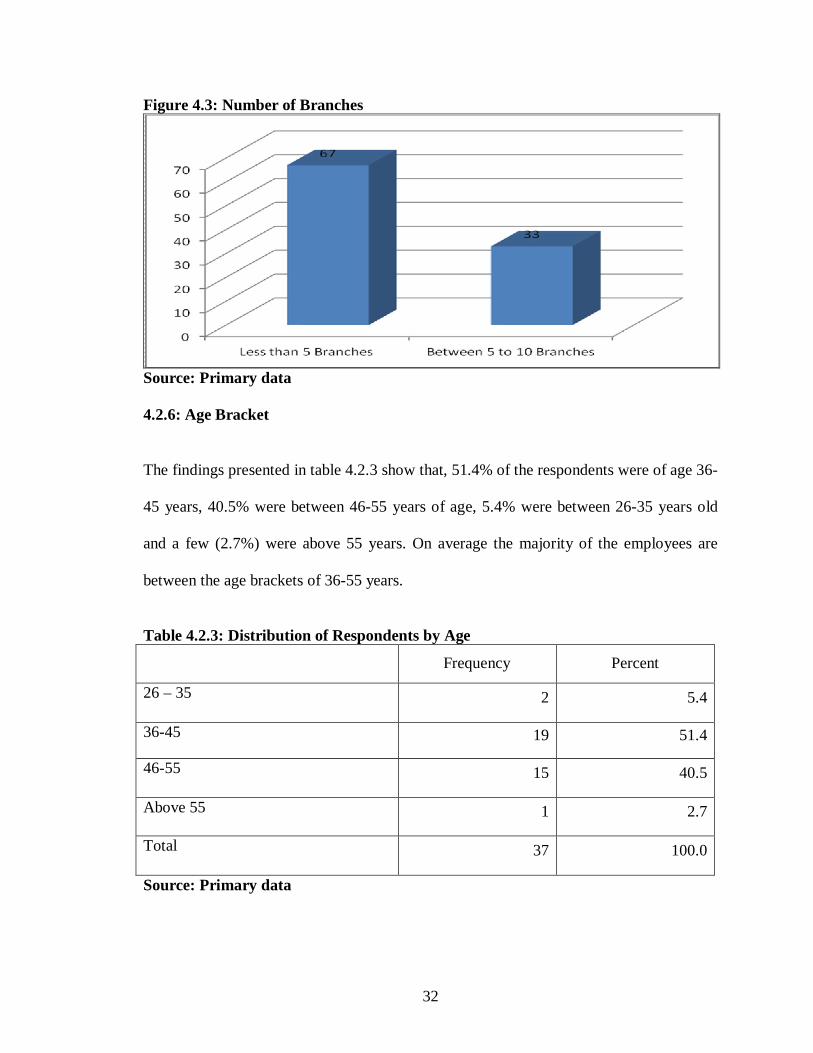
4.2.5: Distribution by number of branches
The findings presented in table 4.2.3, indicates that 33% of the respondents firms had
between 5 to 10 branches while the rest 67% had less than 5 branches.
32
Figure 4.3: Number of Branches
Source: Primary data
4.2.6: Age Bracket
The findings presented in table 4.2.3 show that, 51.4% of the respondents were of age 36-
45 years, 40.5% were between 46-55 years of age, 5.4% were between 26-35 years old
and a few (2.7%) were above 55 years. On average the majority of the employees are
between the age brackets of 36-55 years.
Table 4.2.3: Distribution of Respondents by Age Frequency Percent
26 – 35 2 5.4
36-45 19 51.4
46-55 15 40.5
Above 55 1 2.7
Total 37 100.0
Source: Primary data
33
4.2.7: Distribution of respondents on gender
As can be observed, in Figure 1, the respondents were made up of 65.2 % male and
34.8% female.
Figure 4.4: Gender Composition
65.2%
34.8%
Male
Female
Source: Primary data
4.2.8: Distribution of respondents by level of education
The findings presented in table 4.2.4 show that, 27% of the respondents had postgraduate
level of education, 56.8% were graduates, 10.8% had college diploma and only 5.4% had
secondary school certificate.
Table 4.2.4: Distribution of respondents by level of education Level of education Frequency Percentage Secondary school 2 5.40 College Diploma 4 10.80 Graduate Degree 21 56.80 Post Graduate Degree 10 27.00
Total 37 100
Source: Primary data
34
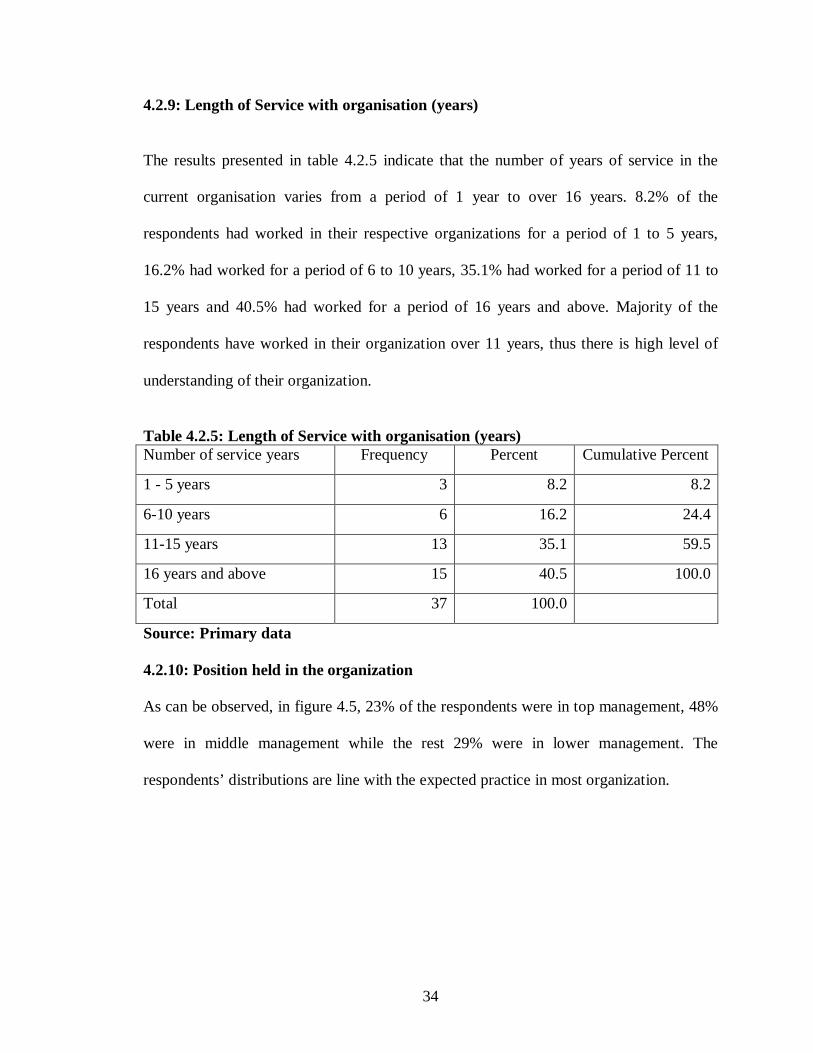
4.2.9: Length of Service with organisation (years)
The results presented in table 4.2.5 indicate that the number of years of service in the
current organisation varies from a period of 1 year to over 16 years. 8.2% of the
respondents had worked in their respective organizations for a period of 1 to 5 years,
16.2% had worked for a period of 6 to 10 years, 35.1% had worked for a period of 11 to
15 years and 40.5% had worked for a period of 16 years and above. Majority of the
respondents have worked in their organization over 11 years, thus there is high level of
understanding of their organization.
Table 4.2.5: Length of Service with organisation (years) Number of service years Frequency Percent Cumulative Percent
1 - 5 years 3 8.2 8.2
6-10 years 6 16.2 24.4
11-15 years 13 35.1 59.5
16 years and above 15 40.5 100.0
Total 37 100.0
Source: Primary data
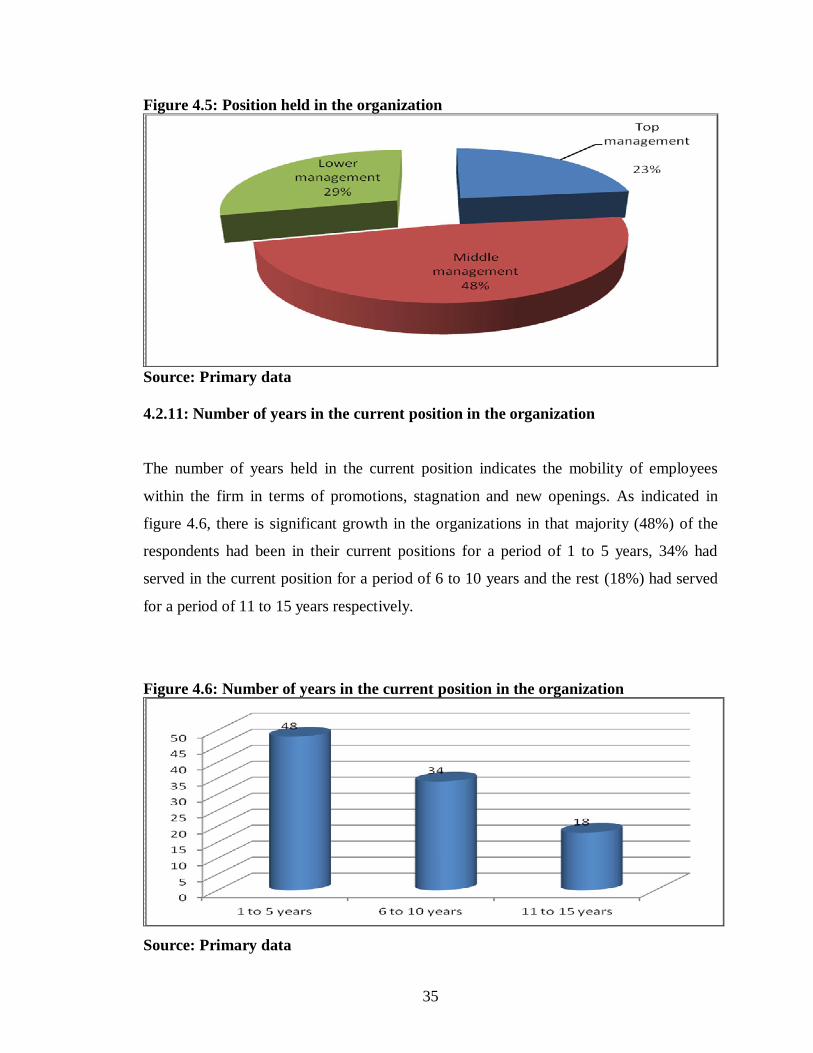
4.2.10: Position held in the organization As can be observed, in figure 4.5, 23% of the respondents were in top management, 48%
were in middle management while the rest 29% were in lower management. The
respondents’ distributions are line with the expected practice in most organization.
35
Figure 4.5: Position held in the organization
Source: Primary data
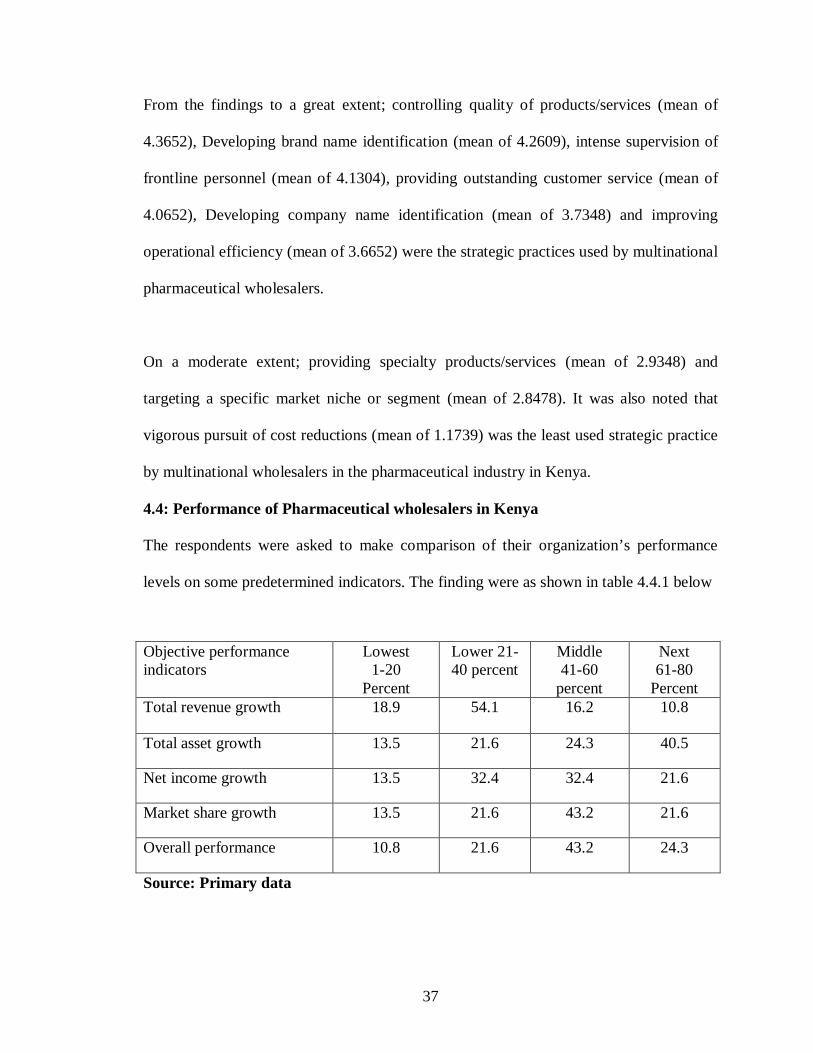
4.2.11: Number of years in the current position in the organization
The number of years held in the current position indicates the mobility of employees
within the firm in terms of promotions, stagnation and new openings. As indicated in
figure 4.6, there is significant growth in the organizations in that majority (48%) of the
respondents had been in their current positions for a period of 1 to 5 years, 34% had
served in the current position for a period of 6 to 10 years and the rest (18%) had served
for a period of 11 to 15 years respectively.
Figure 4.6: Number of years in the current position in the organization
Source: Primary data
36
4.3: Competitive strategies used by pharmaceutical wholesalers in Kenya
This section covers findings from the specific questions posed to the respondent’s to
determine the extent to which some predetermined strategic practices are used by their
respective pharmaceutical firms in Kenya. The range was ‘very great extent’ (5) to ‘not at
all’ (1). The scores of very great extent and great extent have been taken to present a
variable which had an impact to a large extent (L.E) (equivalent to mean score of 3.5 to
5.0 on the continuous Likert scale ;( 3.5≤ L.E <5.0). The scores of ‘moderate extent’ have
been taken to represent a variable that had an impact to a moderate extent (M.E.)
(equivalent to a mean score of 2.5 to 3.4 on the continuous Likert scale (2.5≤M.E. <3.4).
The score of both ‘little extent’ and ‘not at all’ have been taken to represent a variable
which had an impact to a small extent (S.E.) (equivalent to a mean score of 0 to 2.5 on a
continuous Likert scale; 0≤ L.E. <2.5). A standard deviation of >0.9 implies a significant
difference on the impact of the variable among respondents.
Table 4.3.1: Extent to which various strategic practices are used Strategic practices Mean Std. Dev Vigorous pursuit of cost reductions 1.1739 .3767
Providing outstanding customer service 4.0652 .7118
Improving operational efficiency 3.6652 .7717
Controlling quality of products/services 4.3652 .2046
Intense supervision of frontline personnel 4.1304 .8329
Developing brand name identification 4.2609 .8282
Developing company name identification. 3.7348 .2229 Targeting a specific market niche or segment 2.8478 .8936
and business performance: a futures approach. Journal of the Academy of
Marketing Science, 17, 283-295.
Malburg, C. (2000), Competing on costs. Industry Week, 249(17), 31.
McCracken, L. (2002), Differentiation: win new business with less effort. Principal's
Report, 2(4), 1.
McGee, J. & Thomas, H. (1986), Strategic groups: theory, research and taxonomy.
Strategic Management Journal, 7(1), 141-60.
McNamee, P. & McHugh, M. (1989), Competitive strategies in the clothing industry.
Long Range Planning, 22(4), 63-71.
Median, A. & Chin, A.C. (1995), Mortgage-pricing determinants: a comparative
investigation of national regional and local building societies. International
50
Journal of Bank Marketing, 13(3), 3-11.
Miller, A. & Dess, G. (1993), Assessing Porter's (1980) model in terms of its
generalizability, accuracy, and simplicity. Journal of Management Studies, 30,
553-85.
Miller, D. & Friesen, P.H. (1986), Porter's generic strategies and performance: an
empirical examination with American data. Part I: testing porter. Journal of
Management Studies, 7, 37-55.
Mungai, M.A. (2006), Competitive strategies adopted by mainstream daily print media
firms in Kenya. (Unpublished MBA Research Project). University of Nairobi,
Nairobi.
Murage, S. (2001), Competitive strategies adopted by members of the Kenya independent
petroleum dealers association. (Unpublished MBA Research Project).
University of Nairobi, Nairobi.
Murdoch, A. (1999), Future indicative. Accountancy, 123(1270), 48-9.
Murray, A.I. (1988), A contingency view of Porter's generic strategies. Academy of
Management Review, 13(3), 390-400.
Mwakundia (2006), Competitive strategies applied by commercial colleges in Nairobi
CBD. (Unpublished MBA Research Project). University of Nairobi, Nairobi.
Namada, M. (2004), Competitive strategies adopted by small scale enterprises in
exhibition halls in Nairobi. (Unpublished MBA Research Project). University of
Nairobi, Nairobi.
51
Ndubai, N. (2003), Competitive strategies applied by retail sector of the pharmaceutical
industry in Nairobi. (Unpublished MBA Research Project). University of
Nairobi, Nairobi.
Niemira, M.P. (2000), Can Japan compete? Barron's, 80(49), 57-8.
Njoroge, J. (2006), Competitive strategies adopted by LPG marketers in Kenya to cope
with competition. (Unpublished MBA Research Project). University of Nairobi,
Nairobi.
Obado (2005), Competitive strategies employed by the sugar manufacturing firms in
Kenya. (Unpublished MBA research project). University of Nairobi, Nairobi.
Ogolla, M.A. (2005), Application of porter’s strategies by insurance companies in
Kenya. (Unpublished MBA Research Project). University of Nairobi, Nairobi.
Okal, L.D. (2006), Competitive strategies adopted by NGOs dealing with HIV/AIDS in
Kenya to cope with increased competition for funding. (Unpublished MBA
Research Project). University of Nairobi, Nairobi.
Parker, B. & Helms, M.M. (1992), Generic strategies and firm performance in a declining
industry. Management International Review, 32(1), 23-29.
Pharmacy and Poisons Board (2012). Porter, M.E. (1980), Competitive Strategy. Free Press, New York, NY.
Porter, M. (1985), Competitive Advantage Creating and Sustaining Superior
Performance. Free Press, New York, NY.
Porter, M. (1987), From competitive advantage to corporate strategy. Harvard Business
Review, May/June, 43-59.
52
Porter, M. (1996), What is strategy? Harvard Business Review, November/December, 61-
78.
Rajecki, R. (2002), What's your brand? Contracting Business, 59(3), 40.
Richardson, O. & Dennis, C. (2003), UK vineyards sector case study: analysis of retail
activities using exemplar strategic marketing tools. British Food Journal,
105(9), 634.
Ross, D.N. (1999), Culture as a context for multinational business: a framework for
assessing the strategy-culture ‘fit’. Multinational Business Review, 7(1), 13-19.
Saunders, J. & Wong, V. (1985), In search of excellence in the UK. Journal of Marketing
Management, 1, 119-137.
Seth, A. & Thomas, H. (1994), Theories of the firm: implications for strategy research.
Journal of Management Studies, 31(2), 165-91.
United Nations Industrial Development Organization. (2010), Pharmaceutical sector
profile: Kenya. Vienna, Austria: Shahid, H. & Wanyanga, W.
Spanos, Y.E., Zaralis, G. & Lioukas, S. (2004), Strategy and industry effects on
profitability: evidence from Greece. Strategic Management Journal, 25(2), 139.
Stone, M. (1995), Strategic development related to Europeanization of UK logistics and
distribution service suppliers. European Business Review, 95(5), 9-14.
Surowiecki, J. (1999), The return of Michael Porter. Fortune, 139(2), 135-138.
Suutari, R. (1999), Tale of two strategies. CMA Management, 73(6), 12-13.
Sy, D. (2002), The view from Taft. Businessworld, 2, 1.
Theuri (2003), Competitive strategies adopted by branded fast food chains in Nairobi.
53
(Unpublished MBA Research Project). University of Nairobi, Nairobi.
Thompson, A. & Strickland, A. (1998), Crafting and Implementing Strategy. Irwin
McGraw-Hill, New York, NY.
Troy, M. (2002), Below the surface lies a discount core. DSN Retailing Today, 41(7), 57.
Tuminello, R. (2002), The psychology of client selection. Northwest Construction, 5(2),
14.
Venu, S. (2001), India: competitive advantage: alternative scenarios. Businessline, 12, 1.
Walker, O.C. & Ruekert, R.W. (1987), Marketing's role in the implementation of
business strategies: a critical review and conceptual framework. Journal of
Marketing, 51, 15-33.
White, R.E. (1986), Generic business strategies, organizational context, and performance:
an empirical investigation. Strategic Management Journal, 7(2), 217-231.
Wright, P. (1987), A refinement of Porter's strategies. Strategic Management Journal,
8(1), 93-101.
54
APPENDIX II: QUESTIONNAIRE
This questionnaire has been designed to collect information from Business Development managers (or their equivalent) of Multinational Pharmaceutical Wholesalers in Kenya and is meant for academic purposes only. The questionnaire is divided into two sections. Please complete each section as instructed. Do not write your name or any other form of identification on the questionnaire. All the information in this questionnaire will be treated in confidence. SECTION I: BACKGROUND INFORMATION 1. Name of Pharmaceutical Wholesaler (Optional)………………………………………….. 2. Please indicate your organization’s country of
origin…………………………………….. 3. Please indicate the ownership in terms of (local or foreign) of the organization using
the categories below (please tick one) Predominantly local (51% or more) [ ]
Predominantly foreign (51% or more) [ ] Balanced between foreign and local (50/50) [ ] 4. For how long has this firm been in operation in Kenya? (Tick as appropriate) Less than 1 year [ ] 1 to 5 years [ ] 6 to 10 years [ ] 11 to 15 Years [ ] 16 years and above [ ] 5. How many full time employees does the organization have (Pleas tick as appropriate)? Up to 25 [ ] 26 to 50 [ ] 51 to 75 [ ] 76 to 100 [ ] 101 and above [ ] 6. Using the categories below, please indicate the number of branches you have in Kenya Less than 5 [ ] Between 5-10 [ ] Between 11-20 [ ] Above 20 [ ]
55
7. Please indicate the age group to which you belong (Tick as appropriate) Up to 25 years [ ] 26 to 35 years [ ] 36 to 45 years [ ] 46 to 55years [ ] Above 55 years [ ] 8. What is your gender? (Tick as appropriate) Male [ ] Female [ ] 9. What is your highest level of education? Post Graduate Degree [ ] Undergraduate Degree [ ] College Diploma [ ] Secondary School [ ] Primary School [ ] Others please specify in the provided space. ……………………………………………………………………………………………………………………………………………………………………………………………………………………………………………………………………………………………………………………………………………………………………………………………………………………………………………………………………………………………………………………………………………………………………………………………………………………………………………… 10. For how long have you worked in the organization? (Tick as appropriate) Less than 1 year [ ] Between 1 and 5 years [ ] Between 6 and 10 years [ ] Between 11 and 15 years [ ] 16 years and above [ ] 11. Please indicate your position in the
organization………………………………………….. 12. For how long have you been in your current position in the organization? (Tick as
appropriate) Less than 1 year [ ] Between 1 and 5 years [ ] Between 6 and 10 years [ ] Between 11 and 15 years [ ] 16 years and above [ ]
56
SECTION II: THE APPLICATION OF PORTER’S GENERIC STRATEGIES BY PHARMACEUTICAL WHOLESALERS IN KENYA 13. Competitive strategies used by Pharmaceutical Wholesalers in Kenya Listed below are possible strategic practices used by organizations. With respect to your organization, indicate the extent to which each of the listed strategic practice is used. (Tick as appropriate) Strategic practices used Response
To a very great extent
(5)
To a great extent
(4)
To a moderate
extent (3)
To a small extent
(2)
Not at all. (1)
Vigorous pursuit of cost reductions
Providing outstanding customer service
Improving operational efficiency
Controlling quality of products/services
Intense supervision of frontline personnel
Developing brand name identification
Developing company name identification.
Targeting a specific market niche or segment
Providing specialty products/services
Other (Specify)
Other (Specify)
57
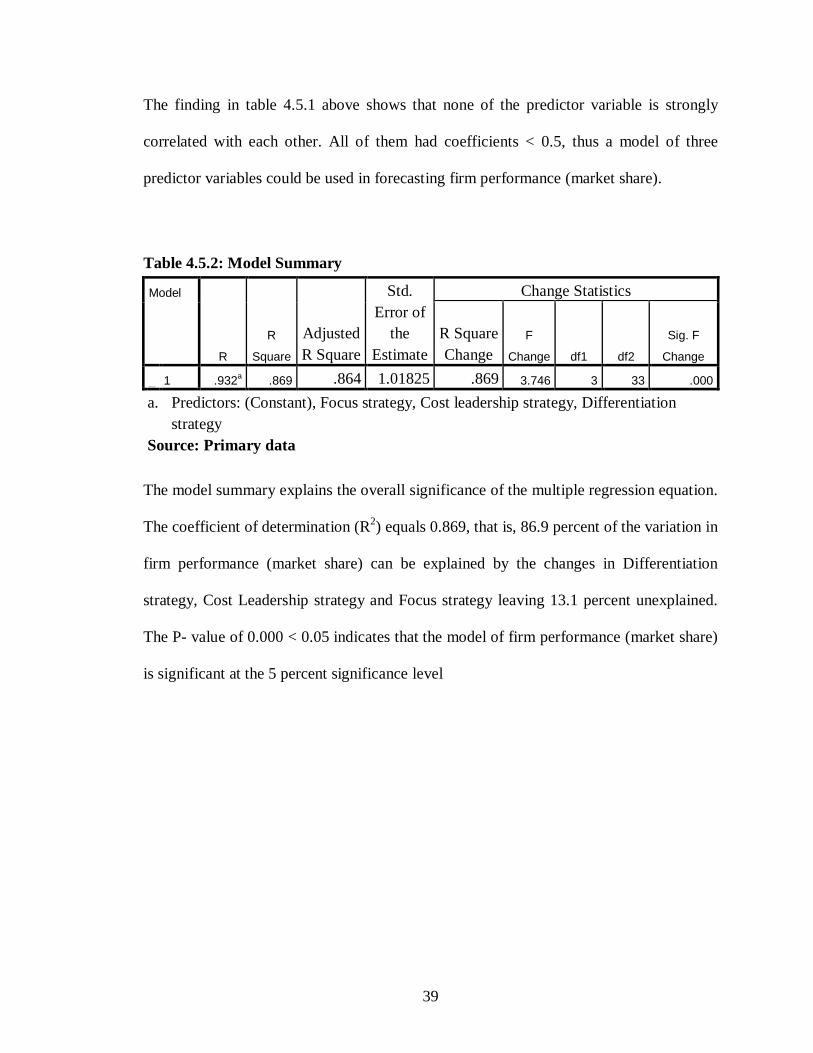
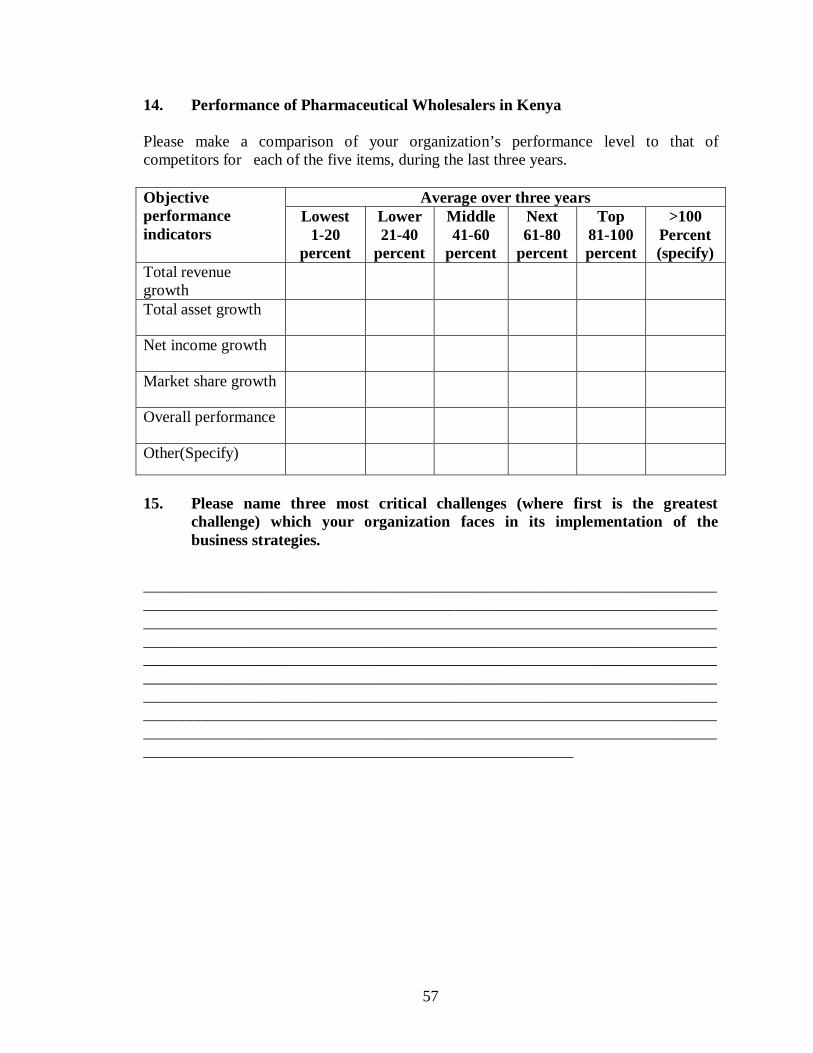
14. Performance of Pharmaceutical Wholesalers in Kenya Please make a comparison of your organization’s performance level to that of competitors for each of the five items, during the last three years. Objective performance indicators
Average over three years Lowest
1-20 percent
Lower 21-40
percent
Middle 41-60
percent
Next 61-80
percent
Top 81-100 percent
>100 Percent (specify)
Total revenue growth
Total asset growth
Net income growth
Market share growth
Overall performance
Other(Specify)
15. Please name three most critical challenges (where first is the greatest
challenge) which your organization faces in its implementation of the business strategies.


![Linking Porter’s generic strategies to firm performance · company strategies [19]. WefocusedonPorter’sgenericstrategies’framework foracoupleofreasons.Firstly,Porter’sframeworkof](https://static.documents.pub/doc/80x56/5fbb542acb32af3f18701ff9/linking-porteras-generic-strategies-to-firm-performance-company-strategies-19.jpg)


