80
The Asian Banker Journal 1

The Asian Banker Journal 1

2 The Asian Banker Journal

The Asian Banker Journal 3
The Asian Banker Journal is published six times a year by
TAB INTERNATIONAL PTE LTD Incorporated in Singapore
Trendwatch Strategic thinking for Chinese banks is less diverse than it appears.
Noteworthy 8A selection of comments made by protagonists in the industry as it faces new challenges and further consolidation.
Current Account 10• Merger activity takes off in Taiwan• Many banks still seen missing ISO15022 deadline
Bank Notes 12• DBS TD Waterhouse expands in China• GE Capital’s latest acquisitions
Personal Account 16Dr Rozali Mohamed Ali, managing director and CEO of Bumiputra-Com-merce Bank discusses the benefi ts of outsourcing operational functions.
Operations & Technology 64Regional survey fi nds that most banks in fact treat CRM as a ‘nice to have.’
Benchmark 75• Chinese investors stay liquid• Internet banking in Australia doubles• Bankruptcies in Hong Kong rocket• Taiwanese regulator gets tough
Regular People 73Ratings Update 77Data File 78
Founder and Editor-In-ChiefEmmanuel Daniel l [email protected]
General EditorMatthew Taylor l [email protected]
Online EditorDiane Jorolan l [email protected]
Senior Researchers, ResearchFahim Uz Zaman l [email protected]
Edwin Basuki l [email protected] Ahmad l [email protected]
Li-May Chew l [email protected] Ee Eu l [email protected] Yih Lin l [email protected]
DirectorMei Fong, Chin Tel: (65) 6295 7302
[email protected], Global Client Services
Cyrus Daruwala Tel: (65) 6295 [email protected]
Business Development ManagersIeuan French Tel: (65) 6295 7310 (Research)
[email protected] Seng Tel: (65) 6295 7307 (Publication)
[email protected] Services
Jodine Phua Tel: (65) 6295 [email protected]
Subscription SalesJenny Kwong Tel: (65) 6295 7300
[email protected] & Database Administrator
Ivy Tan Tel: (65) 6295 [email protected]
Graphics & LayoutValen Siew Tel: (65) 6295 7313
Janet Chan Tel: (65) 6295 [email protected]
Advertising RepresentativesHong Kong: Godfrey Wu (MHI)
Tel: (852) 2591 1077 Fax: (852) 2572 [email protected]
USA: John Barrios (World Publication Services)Tel: 1 (201) 531 0760 Fax: 1 (201) 531 0827
[email protected] in Singapore by
Xpress Print Pte Ltd
MITA (P) 078/10/2002 (Singapore)KDN PPS 1301/9/2001 (Malaysia)
ISSN 02189615
Copyright Protected. Reproduction in any form prohibited except with permission.
For reprints, please call (Singapore) (65) 6295 7314
We are moving!We are pleased to inform our readers that in order to accommodate
the needs of our expanding business, our new address with effect from 1 October 2002 will be:�������������� � �������������������
10, Hoe Ching Road#14-06 Keppel Tower
Singapore 089315Tel: 65-62366500 Fax: 65-62366530
Editorial Offi ce:10 Hoe Chiang Road, #14-06, Keppel Towers, Singapore 089315
Tel: (65) 6295 7301/3/8/9/10 (Editorial); (65) 6295 7302/7 (Marketing); (65) 6295 7300 (Subscriptions); Fax: (65) 6295 4600
www.theasianbanker.com
4 The Asian Banker Journal
Cancellation Policy: • No refunds will be given for cancellation of The Asian Banker subscriptions.
Send in your subscription:By Fax: (65) 6236 6530, Telephone: (65) 6236 6500, E-mail: [email protected] orBy post to: T.A.B. International Pte Ltd 10 Hoe Chiang Road, #14-06 Keppel Tower, Singapore 089315
SUBSCRIPTION FORM
To receive our E-Newsletters, sign up at www.theasianbanker.com
I WISH TO PAY(PLEASE COMPLETE THIS SECTION)
❏ MasterCard ❏ Visa ❏ American Express ❏ Diners Club
Card No.: Expiry Date:
❏ By a non-negotiable cheque made payable to:
“TAB International Pte Ltd”
❏ Please invoice us
Amount: Cheque No.:
(add 4% GST for Singapore subscribers)
Issuing Bank:
Signature: Date:(As in credit card, if applicable.)
Name:
Designation:
Organisation:
Address:
Postal Code: City/Country:
Tel: Fax:
E-mail:
I would like (Please tick the appropriate box): ❏
❏ One-year subscription to THE ASIAN BANKER 300PLUS at US$620 which includes:• CD ROM (Excel format) and online access to database of Asia’s top 300 banks balance sheets• One year subscription to Asian Banker Journal (worth US$240)• Interactive access to Asian Banker Journal online edition for up to fi ve executives (worth US$490)
❏ One-year subscription to THE ASIAN BANKER JOURNAL only at US$240 which includes: • Six issues of Asian Banker Journal (bi-monthly)• Interactive access to online editions (subscribed issues) for up to fi ve executives (worth US$490)
The Asian Banker 300 Asian Banker Research is proud to present its inaugural ranking of the region’s top 300 commercial banks by asset size.
18
Interview Hsu Teh-Nan, President and CEO of Hua Nan Finan-cial Holding Company, discussed how Hua Nan has positioned itself for the future under its new holding company structure, progress on resolving NPLS, and the ongoing challenges of balancing political and commercial necessities.
68
Hsu Teh-Nan, Presi-dent and CEO of Hua Nan Financial Holding Company
The Defi nitive Annual Ranking and Survey of Asia’s Top Banks

The Asian Banker Journal 5
Hong Kong Convention & Exhibition Centre2 - 4 April 2003
w w w . t h e a s i a n b a n k e r . c o m
The summit to identify challenges and opportunities leaders in the fi nancial services industry will face in 2003 and beyond
For more information on sponsorships and exhibition opportunities,
please contact Mr. Cyrus Daruwala, Director, Global Clients Services at
tel: (65) 6236 6522, fax: (65) 6236 6530
or e-mail: [email protected]
“ Excellence in Process and Profi tability ”

6 The Asian Banker Journal
TRENDWATCH
China’s convenient conundrumIn the past year alone, I must have met CEOs of about 12 Chinese banks and countless senior executives, and the one signifi cant observation that I would make is just how synchronized the motivation of so many bankers in China appear to be these days.
All Chinese banks CEOs tell me that they are committed to adopting IAS accounting stand-ards, if they have not already done so. All are committed to transparency, shareholder value, corporate governance and all those darling phrases for investor confi dence.
To a standard question in my interviews and conversations, “which bank do you admire most?” the answer from bankers, whether from Beijing or Shanghai or Shenzen was unequivo-cally, “Citibank.”
Before any Citibanker uses this to fl utter their feathers, let me just say that my suspicion is that many Chinese bankers are spouting safe received opinion rather than bestowing considered admiration. It’s the same thing as associating the pianist Richard Clayderman to good music. A convenient name to swirl a decent conversation around in a pub without the inconvenience of the facts.
However, if the Chinese are still developing their perception of global issues, they are learning and learning very fast. I have seen a greater desire and even ability amongst Chinese bankers to develop proper “domain capabilities” in critical areas such as treasury, risk management and
operations than I have ever seen in non-China Chinese communities like Hong Kong and Taiwan.
I have watched the Chinese take the time to learn, to send their staff for training, to aspire to global best practices and to execute as quickly as their own regulators will allow them to.
In many cases, I have come away awed that many of the same CEOs of many Chinese banks who are so committed to market principles today were just a decade ago languishing as _’professors’ in state-owned universities or civil servants in a very socialist society.
In the development of my own assessment of the quality of Chinese banks and businesses, I am currently straddling two realities. On the one hand, I see the Chinese propensity to be a shameless consumer of global ideas - especially if they are branded ideas from America. To borrow from the title of a V.S Naipaul novel, they are “the mimic men.” On the other hand, I see the ability and the energies for the Chinese to create world class institutions, if they really wanted to.
There is no reason that we should not see such Chinese institutions within the next ten years. The current ambition of ICBC Bank, the country’s largest, to consolidate 1000 data centers into two within the year is a feat that has never been achieved anywhere else in the
world, but symptomatic of the kind of energies that banks in China are exhibiting.But there is the big ‘ what if’. Will we fi nd, after yet another decade of promises, the
Chinese banks in this millennium ending up similar to the Indonesian banks after the promises of the 1990s? Both are large countries. Both lure the rest of the world on the promise of their large population.
But understandably, both have their fair share of suave and self-serving men and women, just like the rest of humanity, no matter what is said about their national aspira-tions. It is a melancholy that I share with every private equity company looking to buy into Chinese banks today.
I guess I would think differently, if I could engage with a Chinese CEO about commitment or excellence, without referring to Citibank, or Richard Clayderman.
Source: State Statistical Bureau, Asian Banker Research
The non-state banks in China are very profi table these days (ROEs of Chinese businesses 2001)

The Asian Banker Journal 7
CALENDAR
• CeBIT Asia~ 2 - 5 September, Shanghai, Hannover Fairs • China Int’l Exhibition on Financial Banking Technology &
Equipment (CIFTEE)~ 15 - 18 September, Beijing • SmartCard Expo~ 18 - 20 September, New Delhi, Electronics Today • Sibos~ 30 September - 4 October, Geneva, S.W.I.F.T • Asia Pacifi c Financial Planning Conference~ 10 - 11 October, Singapore, Asia Financial Planning Journal • Backroom Operations For Financial Institutions~ 28 - 29 October, Singapore, The Asia Business Forum • Customer Retention in Banking & Finance~ 28 - 29 October, Singapore, The Asia Business Forum • Bancassurance~ 7 - 8 November, Singapore, The Asia Business Forum • CHINA Fund Management~ 18 - 19 November, Singapore, The Asia Business Forum • 4th bank.net~ 27 - 28 November, Mumbai, Exhibitions India Pvt. Ltd. • The Fourth Annual “The Asian Banker Summit”~ 2 - 4 April 2003, Hong Kong, The Asian Banker
Visit www.theasianbanker.com for the latest Calendar Updates.
LETTERS TO THE EDI-
I refer to the correction printed in the the Asian Banker Journal Issue 35 regarding our letter (relating to the article “Singapore: Consumer Credit business to share positive repayment informa-tion”). In order to refl ect the charge-off ratio for Singapore, in comparison with those reported for Hong Kong, the correct methodology would be the annualised percentage of “sum total of bad debt written off (for the quarter) against the rollover balance (position at the end of the quarter).
Annabel TanMarket Infrastrusture and risk advisoryMonetary Authority of Singapore (MAS)
EDITORIAL RESPONSE: Making cross border comparisons can be problematic because different countries calculate ratios in different ways and it is important not to compare apples with pears. Our numbers are different only because Hong Kong uses “total billings” as the denominator and Singapore uses “roll over balance”. We understand MAS’s rationale for using roll-over charge-off calculated as a fl ow, but, as we suggested last month, we do not have access to fi gures for Hong Kong calculated this way. Because Hong Kong uses total billings, we needed to compare like with like so we had to use sum total of bad debt against total billings for Singapore.
Singapore’s approximate charge-off for 1Q2002 (using rollover balance):= [Bad debts written off (Jan-Mar)/Rollover balance (Jan-
Mar)]/12 months=(7.8+8.0+8.1)/(2098.5+2193.6+2120.6)]/12 = 4.5% Charge-off ratio (using total billings) - As per Hong Kong’s
method:= [Bad debts written off (Jan-Mar)/Total card billings(Jan-
Mar)]/12 months= [(7.8+8.0+8.1)/(959.8+887.7+938.8)]/12 = 10.29%
LETTERS TO THE EDITOR:Fax to 65-6236 6530 or
e-mail: [email protected]

8 The Asian Banker Journal
NOTEWORTHY
A selection of comments made by protagonists inthe industry in the thick of battle in the past two months.
“ Banks can share their technology instead of each bank trying to re-invent the wheel. ”- Vepa Kamesam, deputy governor of the Reserve Bank of India, encouraging banks to pool in their technology resources instead of each putting up its own IT network
“ We are still at an early stage when it comes to co-operative ventures with the Bank of China on the credit card business. Right now only debit cards are in circulation in mainland China, The credit card product as we know it, is not yet available in this country. ”- Peter Wong, director of Standard Chartered Bank and head of Greater China operations, explaining the status of StanChart’s discussions with Bank of China about cooperative ven-tures, which would include credit cards. (With photo from StanChart)
“ No ... That’s why we decided to get married with a good bank fi rst, before all the pretty girls are married and you only have the ugly girls left. ”- Richard Tsai, Fubon Financial co-chief executive, on whether he would be willing to buy a bad bank and restructure it to realise its remaining value. Fubon Financial recently announced it would include Taipeibank in its holding company through a stock swap.
“ The sky won’t collapse. ”- Liu Jinbao, chief executive of Bank of China (Hong Kong), shaking off thoughts that woes in the US market could have affected the bank’s own IPO launch in July 25 this year.
“ Simply because we are the biggest bank in Singapore with the most customers ... on a probability basis it’s the highest for DBS. ”- Edmund Koh, managing director and head of consumer banking at DBS Bank, explaining why the recent Internet fraud cases in Singapore involved customers from DBS Bank.

The Asian Banker Journal 9

10 The Asian Banker Journal
CURRENT ACCOUNT
Taiwan: Merger news raise consolidation hopes Fubon Financial and Cathay Financial’s merger announcements with Taipeibank and UWCCB, respectively, signal that consolidation in overbanked Taiwan may fi nally be gathering pace.
When Fubon Financial announced its merger arrangement with Taipeibank last week, observers remarked that Taiwan had finally recommenced the consolidation process in its financial sector, which has been seeing slow progress of late. A few days later Cathay Financial Holdings announced its own merger plans with United World Chinese Commercial Bank (UWCCB), boosting sentiments that consolidation in Taiwan’s banking sector was on a roll.
The concept of financial holding companies (FHCs), however, is still under question - especially in Taiwan, where more than a dozen banks and insurance companies have converted to FHCs in late 2001 and early 2002. But not all these FHCs have displayed the progressive cross-selling skills of Fubon Financial, which claims that it sells 2.7 products per customer on average. If these new tales of acquisition result in a new rash of such mergers, Taiwan will fi nally fi nd out if the fi nancial holding structure is the best mechanism to drive consolidation.
”Despite the relatively small size of our existing banking platform, we have already had considerable success in
cross-selling a wide range of products through Fubon Bank, which is now de-riving over 25 percent of its revenue from fee-based products. Similarly, we see very signifi cant opportunities to increase fee-based income at Taipeibank,” said Richard Tsai, Fubon Financial’s co-chief executive offi cer.
”Over time, we expect to be able to increase Taipeibank’s traditional gross fee income ratios from 8 percent in 2001 [excluding gains] to levels more consist-ent with Fubon Bank, which posted a gross fee income ratio of 26 percent in 2001 [excluding gains],” Tsai said.
Taipeibank has 80 branches servic-ing 1.3 million clients, and assets of NT$654 billion.
The $2.4 billion deal between Fubon Financial and Taipeibank was shortly fol-lowed by Cathay Financial’s own merger announcement with UWCCB.
Cathay Financial’s and UWCCB’s merger, based on a stock swap valued at NT$114.6 billion ($3.4 billion), will create the fourth largest fi nancial institution in Asia (excluding Japan) and is the larg-est acquisition for a corporate entity in Taiwan. Cathay Financial, which con-
trols Taiwan’s biggest life insurer, said it expects to fully integrate UWCCB with Cathay United Bank by 2005, and the new company will have combined assets of NT$2,100 billion ($62.2 billion). The share-swap deal will also reportedly create Taiwan’s largest life insurance provider, and third-largest domestic credit card issuer.
”Bot h inst it ut ions wi l l benef it from a more highly developed bancas-surance channel, and from the ability to cross-sell products over a wider distribu-tion platform to more retail and corporate customers,” said UWCCB chairman Gre-gory Wang. Cathay Financial’s cross-sell ratio per customer stands at 1.3.
Doubts about the financial sector’s consol idat ion process were aired earl ier when the planned merger between Taishin Financial and Shin Kong Financial was scrapped less than two weeks after its announce-ment. In July, state-owned Bank of Taiwan, Land Bank of Taiwan and Central Trust of China had also re-jected a government-initiated merger plan, saying they would benefit mini-mally from the consolidation.
S.W.I.F.T. creates MUG for ISO 15022 laggards Currently only 30 percent of the world’s traffi c of S.W.I.F.T. securities messages is on ISO15022.
Too many banks will not be ready for ISO15022 compliance on time, so S.W.I.F.T. have been forced to deploy delaying tactics. Although there will be a big surge as many complete testing in the next three months, at the current rate this only looks like getting to about 50-60 percent by the November 16 deadline rather than the 90 percent plus expected by S.W.I.F.T.
Beyond November 16, users that have not migrated to the new ISO 15022 stand-ard will be charged a higher fee. The group, which will be discontinued on May 31, 2003, will be charged up to 1 euro (98 US cents) per message sent after November 16 this year. These users will be charged a monthly fee starting from 5,000 euros ($4,911), which will increase depending on the size of the institution and the proximity
to the May 31, 2003 closure date. The fee can rise to as high as 45,000 euros ($44,199).
S.W.I.F.T., which announced this month that it would stick to its original deadline for ISO 15022 migration, has created a Messag-ing User Group (MUG) for those that have yet to migrate to the new standard. The ISO 7775 MUG - a closed user group of non-ISO 15022 users - will be created separate from the main S.W.I.F.T. network.

The Asian Banker Journal 11
SPONSORED STATEMENT
Customer Centric Universal Banking
Risk and Profi tabilityBanks are paid to take risk. Yet the abil-ity of banks to monitor risk and return has become impaired, as business lines become more complicated and diverse. Banks need to develop new and effec-tive tools to manage the risks inherent in their various businesses. These risks include market risk, credit risk and operational risk. The risks a bank takes in its lending are intrinsically tied to the bank’s profi tability, as interest and fee income remains the core sources of earnings for banks.
Managing the plethora of information churned out by ever expanding portfolios of different businesses has turned risk management into an increasingly diffi cult task. As different departments of banks have established their own data monitor-ing and processing systems it has become very hard for risk managers to collate a coherent aggregate risk profi le for the banks’ businesses. Banks need now to as-sess the value provided by each customer across multiple channel business lines. This has created a need for better integration of technology infrastructure. Accordingly, bank’s have been driven to seek out inte-grated and extended enterprise customer centric software solutions such as System Access’s SYMBOLS.
SYMBOLSThe SYMBOLS product offers a solution that supports seemless integration of business operations across extended enterprises from back-offi ce operations support to front-end customer relation-ship management and personalized delivery of customer services. For risk management professionals there are specifi c modules, within the SYMBOLS Enterprise Operations Center, to allow bankers to set and monitor limits for individual exposures as well as sophis-ticated knowledge management tools to enable storage and easy retrieval of important information relating to the bank’s risk profi le.
The SYMBOLS Enterprise Operations Center consists of a comprehensive suite of applications that effi ciently support
the transaction processing needs of fi nancial institutions. The Limits control module allows the bank to control and monitor its risk exposures effectively on a client by client basis as well as providing a holistic picture of the risk profi le.
The SYMBOLS Limits Control Module provides the capability to manage credit and currency exposure limits at multiple product and geographic levels across the entire customer relationship. The customer can use many forms of credit and transact in multiple currencies while managing a complete exposure. SYMBOLS Limits Control also allows the fi nancial institution to manage its risk specifi cally with mobile high net worth and corporate customers. Exposures are monitored on-line with corresponding ability to approve or reject limit excesses. Specifi c account limits are maintained in the individual module translations. Client exposures, however, can span multiple credit facilities, across other SYMBOLS modules and including non-SYMBOLS legacy applications. The Symbols Limit Control module enables the user to grant faculties in a four level hierarchy of limits to any client or client group, employ limits against the bank’s total exposure to any product or line of business, and limit exposures in specifi c countries.
As well as monitoring and managing levels of risk, the SYMBOLS Enterprise
Operations Center has knowledge management functions that can help the bank to assess risks more ef-fectively. THE SYMBOLS Knowledge Manager provides an enterprise OLAP data-warehousing framework designed to specifi cally support fi nan-cial institutions in their enterprise data analysis and knowledge management needs. It provides a comprehensive database schema that captures and consolidates financial services op-erational data from other SYMBOLS systems or third party operational systems for further analysis.
The data store schema, with its suite of subject area data marts, supports en-terprise level analysis ot the financial institution and their customers. Based on user-defined rules and parameters, non-technical users can perform multi-dimensional drilldown and analysis of collated data to gather better intelligence to support their business and customers.
About System AccessSystem Access is a leading global fi nancial software provider of customer centric universal banking solutions for fi nancial institutions worldwide. Head-quartered in Singapore, it has regional offi ces in Geneva, London, Bratislava, Prague, Dubai, Manila and Bangkok with a staff of more than 400 to service the needs of customers in over 20 coun-tries across the Asia Pacifi c, Europe, Middle East and Africa.
Its fl agship product, SYMBOLS is the result of more than 800 man-years of extensive research and product develop-ment, and has a solution suite of over 30 modules designed to meet the needs of universal banking.
For more information or a copy of the Customer Centric Univer-sal Banking white paper, please contact System Access: Phone 65 6333-4533Email: [email protected]
The Asian Banker Journal 11

12 The Asian Banker Journal
BANKNOTES
base in its twin markets of Singapore and Hong Kong. Struthers declined to reveal the exact number of customers in each market, but put the total customer base at 45,000 with the bulk of the customer base in Singapore.
“We’ve been experiencing 30 percent annualized growth in the number of customer accounts since the start of the joint venture,” said Struthers. “Experience in other markets tells us that we need to build a customer base of at least 160,000 in the fi rst three years to be successful.”
This growth will primarily come organically, but he does not rule out the possibility of acquiring customer portfolios from other market players. This scenario plays itself out especially in Hong Kong, where the market is, in Struthers’s own words, “a slow, steady build” because of the fragmented nature, but also in Singapore, where analysts have been predicting a market shakeout
China is a market that online broker-age DBS TD Waterhouse is looking at, but the joint venture company be-tween Singapore-based DBS Bank and Canadian-based discount brokerage TD Waterhouse will move cautiously to explore the opportunities, says its CEO Ian Struthers in an interview.
“We’re very excited about the oppor-tunities in China and want to explore them. However, we’re moving cautiously and China is something we’ll build [sic] within the next few years,” he said.
Struthers said that the most obvious way to enter the China market was to tie up with a player that already has a presence and gives access to a sizable customer base. However, this was not the only way and added that DBS TD Waterhouse was “looking at a few dif-ferent models.”
In the meanwhile, DBS TD Waterhouse is concentrating on building its customer
Online Brokerage
China in a few years, says DBS TD WaterhouseDBS TD Waterhouse CEO Ian Struthers thinks long-term about China, even as he builds the franchise in Singapore and Hong Kong.
given the still-low trading volumes and price competition.
“While we are not looking at acquisi-tions as our main growth strategy, we’re very comfortable valuing portfolios, given our experiences in other markets,” he qualifi ed. “If opportunities arise, we’ll look seriously at them.”
When the high-profi le marriage be-tween Merrill Lynch and HSBC dissolved in tears, sceptics were already prepar-ing to sound the death knell for DBS TD Waterhouse, which they viewed as inhabiting a similar business model - a view that Struthers rejects.
He said, “From a business perspective, the joint venture between Merrill Lynch and HSBC failed for a simple reason. The premise of the joint venture was to gain access to a large number of existing custom-ers, which Merrill Lynch and HSBC did not achieve. Merrill Lynch did not afford access to its U.S. customer base, while the joint venture competed with HSBC’s own online brokerage for business in Hong Kong.”
“I don’t see how you can succeed if you can’t gain access to customers in your most important markets.”
Struthers said DBS TD Waterhouse will continue to focus on and leverage on its strengths - the strong presence of DBS Bank in Singapore and Hong Kong, and the ability to trade in multiple markets with a single account.
fi nance company SDL Leasing Singapore from UBS Capital Asia Pacifi c, and AGC from Westpac Banking Corporation. The deals gave GE Capital an increased foot-print in the auto fi nance business in Sin-gapore, and more than doubled its pres-ence in Australia and New Zealand.
Said Steve Bertamini, president of GE Capital Asia: “SDL provides an established platform for the growth of GE Capital in Singapore. We plan to continue to expand its auto fi nance business and to introduce
GE Capital, a unit of General Electric Co. of the US, has followed up its recent acquisitions in Singapore and Australia with a reported negotiation to buy a con-trolling stake in the credit card business of South Korea s Chohung Bank.
A Chohung Bank offi cial named GE Capital as being one of two parties inter-ested in purchasing a controlling stake in the South Korean bank s credit card unit, which it is planning to spin off.
Last month, GE Capital acquired auto
Acquisitions
GE Capital continues expansion in AsiaGE Capital had continued to add key acquisitions to its portfolio in Asia’ including NPL portfolios. It is also actively involved in outsourcing back offi ce operations.
customers to a broader range of consumers and commercial fi nance products.”
He also said GE Capital will “con-sider acquisitions that will fast track our growth in this promising and stable market.”
GE Capital’s business in Asia includes consumer fi nance, commercial fi nance, the acquisition and restructuring of non-performing loans, aircraft leasing and equity business. The company has purchased portfolios of non-performing loans in Thailand and is looking at buy-ing portfolios of such loans in Taiwan, South Korea and China.
Elsewhere in Asia, GE Capital has out-located its back-office operations in India It has 9,000 employees in Delhi and Hyderabad, and has plans to more than double this number to 20,000 by next year. GE Capital is also reportedly planning to outsource jobs such as risk analysis, insurance accounting and bill payment to India.

The Asian Banker Journal 13
14 The Asian Banker Journal
PERSONAL ACCOUNT
Planning for the integration was a major exercise
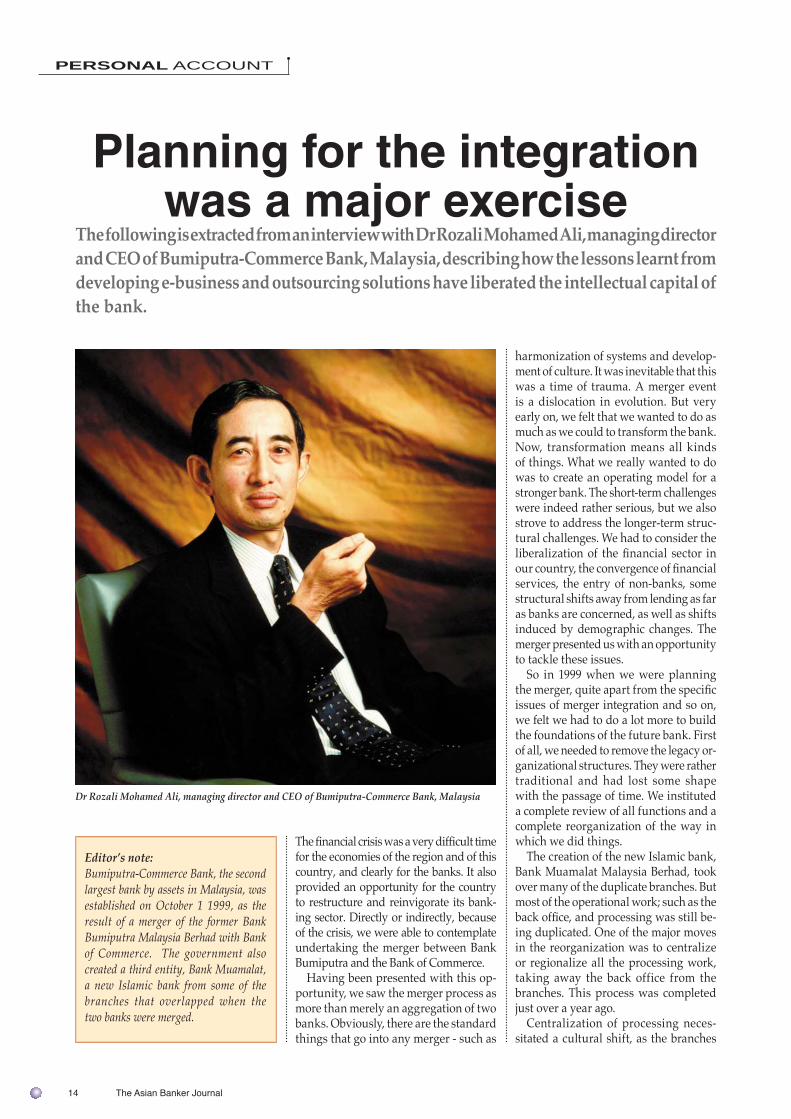
The following is extracted from an interview with Dr Rozali Mohamed Ali, managing director and CEO of Bumiputra-Commerce Bank, Malaysia, describing how the lessons learnt from developing e-business and outsourcing solutions have liberated the intellectual capital of the bank.
harmonization of systems and develop-ment of culture. It was inevitable that this was a time of trauma. A merger event is a dislocation in evolution. But very early on, we felt that we wanted to do as much as we could to transform the bank. Now, transformation means all kinds of things. What we really wanted to do was to create an operating model for a stronger bank. The short-term challenges were indeed rather serious, but we also strove to address the longer-term struc-tural challenges. We had to consider the liberalization of the fi nancial sector in our country, the convergence of fi nancial services, the entry of non-banks, some structural shifts away from lending as far as banks are concerned, as well as shifts induced by demographic changes. The merger presented us with an opportunity to tackle these issues.
So in 1999 when we were planning the merger, quite apart from the specifi c issues of merger integration and so on, we felt we had to do a lot more to build the foundations of the future bank. First of all, we needed to remove the legacy or-ganizational structures. They were rather traditional and had lost some shape with the passage of time. We instituted a complete review of all functions and a complete reorganization of the way in which we did things.
The creation of the new Islamic bank, Bank Muamalat Malaysia Berhad, took over many of the duplicate branches. But most of the operational work; such as the back offi ce, and processing was still be-ing duplicated. One of the major moves in the reorganization was to centralize or regionalize all the processing work, taking away the back office from the branches. This process was completed just over a year ago.
Centralization of processing neces-sitated a cultural shift, as the branches
The fi nancial crisis was a very diffi cult time for the economies of the region and of this country, and clearly for the banks. It also provided an opportunity for the country to restructure and reinvigorate its bank-ing sector. Directly or indirectly, because of the crisis, we were able to contemplate undertaking the merger between Bank Bumiputra and the Bank of Commerce.
Having been presented with this op-portunity, we saw the merger process as more than merely an aggregation of two banks. Obviously, there are the standard things that go into any merger - such as
Dr Rozali Mohamed Ali, managing director and CEO of Bumiputra-Commerce Bank, Malaysia
Editor’s note: Bumiputra-Commerce Bank, the second largest bank by assets in Malaysia, was established on October 1 1999, as the result of a merger of the former Bank Bumiputra Malaysia Berhad with Bank of Commerce. The government also created a third entity, Bank Muamalat, a new Islamic bank from some of the branches that overlapped when the two banks were merged.
The Asian Banker Journal 15
PERSONAL ACCOUNT
moved away from operations towards sales and service, with a greater degree of customer orientation. Quite apart from this cultural shift, which always occurs when two organizations merge, we saw the need for a broader shift, towards a more effective workforce. The typical bank worker of the future will be very, very different from the bank worker of today. The modern bank worker has to be able to exercise initiative much more. He or she will be conversant with some rather sophisticated tools of analysis and marketing as well as being versatile and fl exible.
As is typical in any merger situation, staff morale was rather low. There was a desire to maintain the status quo with the least possible change because anything else is uncomfortable. Through discus-sions with our staff (and also with the unions, which represent them) we were able to reach a common understanding of the need to upgrade all the people who work for us. Not just in the sense of having new certifi cates or getting a few more dollars a month, but really upgrade in terms of their ability and the way in which they approach work and the way in which they feel fulfi lled at the work that they do. Instituting this type of change is a slow process. It has to be managed very sensitively, but basically I think we’re on the right track.
Predictably, there was a fall in the number of staff last year when we em-barked on a voluntary separation exer-cise. We reduced staff numbers by about 20 percent. In any merger, that is essen-tial. More importantly, the age profi le of the staff has changed. It is now a little younger. The profi le of skills in the sense of higher, tertiary level skills and others is also in the process of changing. Now we have a reasonably stable structure, infusing younger and different talents, which was something that was diffi cult before the merger. It has also allowed us to embrace the latest strategic thinking and techniques.
The e-business is one important stra-tegic initiative that we have been devel-oping and leveraging since the date of the merger. Our e-commerce initiative is improving the reach and the ability to deliver of the bank. It has also allowed us to improve the actual running of the bank itself.
We created a group with specifi c and exclusive responsibilities called the
I-Commerce Group for this purpose. Establishing a separate unit was im-portant because activity related to the merging of the IT platforms threatened to submerge other initiatives. It is still a relatively small group of people but they are allowed and they are able to focus on this particular area and actually, they have done extremely well.
The trouble, of course, with building these kind of capabilities is that you are constrained because you have to justify them from a business-case point of view. Many internet banking initiatives tend to fail because the pick-up is too slow or the performance numbers don’t really meet expectations. We focus about 50-50 on products and delivery (like internet banking) and the other half on building an Internet infrastructure.
Developing an e-business platform doesn’t make much sense if we tell eve-rybody it’s so good but we don’t use it ourselves; particularly now that we have a unique and very effective integrated system for procurement and inventory. So we have in fact committed ourselves to using this to run our own business. We can expect good returns from that investment purely on the basis of our own utilization. But, of course, primarily it is for the customers, and the custom-ers are beginning to realize that this is an extremely good way of running their businesses too.
Planning for the IT integration was a major exercise because, in banking, you’re talking about millions of ac-counts, where you cannot afford to have a single mistake when you merge the systems. It’s particularly data intensive and, unfortunately for us, we merged in 1999. So we had to take extra precautions for Y2K and couldn’t really start the inte-gration process until a few months into the year 2000. But around the middle of last year, we achieved full integra-tion. That was another major exercise, because we knew that sooner or later we would have to fi nd a way to manage these areas more effi ciently.
In our organizational structure, the operations and IT unit was essentially autonomous, so we began to look at he possibility of outsourcing this function, almost immediately post-merger. There are many reasons why we wanted to do this. One of them is obvious. Manag-ing IT is a specialist job which banks may not be very good at doing unless
Mancano And Associates
.......The best boutique search fi rm on Boat Quay
Mancano And Associates is an established recruitment fi rm specializing in the fi nancial service and telecommunications industry. We are consistently retained by Fortune 500 institutions throughout South East Asia for our industry expertise. Mancano And Associates discreetly researches and recommends Asian experienced senior management professionals with extraordinary qualifi cations.
•Burma•Cambodia•Hong Kong•India•Indonesia•Malaysia
•Australia•Philippines•Singapore•Sri Lanka•Thailand•Vietnam
Banking & Financial
•Investment Banking•Corporate Finance•Direct Investment•Corporate Banking•Private Banking•Banking Operations•Equities•Fund Management•IT Banking System
Telecommunications
•Wireless Local Loop•Private Telephone & Telegraph•Paging•Cellular / Satellite•Network Management System (NMS)•Radio Network Planning•Installation Planning•Radio Base Station/Transmission Engineers
Mancano And Associates45A Boat Quay Singapore 049834 Tel: 6533 8128 Fax: 6533 0079
e-mail: [email protected]: www.mancano.com
Our consultants have executed assignments in:
Assignments undertaken:
16 The Asian Banker Journal
they buy in skills. But another reason is that, if such functions are integrated within the business units, it tends to be difficult to understand how much they cost and how well these functions are being done. This information is not measured and tends to be lost in the mass of a large organization.
In the past, different kinds of proc-esses were done by discrete groups in each department. The costs of those processes were unknown; because all we had were the departmental reports, and the departmental reports not only included the cost of the operation proc-ess, but other costs as well. So nobody ever knew in detail how muc h t h i ngs cost except at a very ag-gregate level. It was difficult to recognise rising costs and diffi-cult to fix them even if we could identify them.
The move towards centralization was fi rst of all to contain operations and IT, at least in terms of performance infor-mation, and to find out how much it cost. Having determined how to measure and monitor costs, we then considered how best to reduce them. At the time, there were many other larger banks that engaged very actively in out-sourcing, and we undertook a special examination to see whether such a thing would be useful for us.
We engaged in discussions with sev-eral possible partners, we looked at a wide range of possible structures. The eventual structure that we chose and the eventual partner, EDS, is an arrangement which provides benefi ts from our point of view and is also a viable proposition from the EDS point of view. We have structured the deal using a processing company, which is known as EPIC-I. It is a wholly owned subsidiary of Bumiputra Commerce Bank. This entity does the processing work for Bumiputra Com-merce Bank and it on-sources the IT work to EDS Malaysia, which is a separate company, again wholly owned by EDS. At the same time, EDS provides manage-
ment capabilities to help EPIC-I set itself up and re-engineer its processing. At the same time, EDS has undertaken to provide additional work, non-related to the bank’s work, for EPIC-I to undertake. There was a staff transition from the op-erations and IT part of the bank to EPIC-I and also there is ongoing transition also to EDS Malaysia.
We felt strongly that EPIC-I should stand on its own as a positive contribu-tor to the bank’s bottom line. So there is a stipulation in the agreement whereby costs are reduced by 5 percent the fi rst
year, 10 percent the second and 20 per-cent from the third year onwards. In other words, we now have a contractual promise that within three years, our processing and IT costs go down by 20%. We also benefi ted from the discipline of planning and writing the service level agreement that governed the contract which made us specify as precisely as possible what needed to be done.
Finalising the SLA took us quite a long time and it was extremely diffi cult. If you talk about a ten-step process, we probably reached step one or two in identifying our processes and modify-ing them just a little bit. So, it was very rudimentary. Since EpicI was established on January 4th this year, now we can go all the way to step ten. There’s going to be extensive re-engineering of processes with the help of EDS, our management partners. But the SLA approach is quite a shock, especially to bankers. Whilst the process would be familiar to industrial
process engineers, for a banker it is rather novel. Each proposal has to be extremely precisely specifi ed and measured and there are actual contractual obligations.
The bank will continue to retain con-trol of the intellectual process of speci-fying the IT requirements. For example, the current project on decision support systems is done by the bank, not by EDS. When the project is being implemented, there will come a point in time when we can identify which are the operational parts of that system and that will then be passed over to the outsourcer.
Within the bank we have a technol-ogy group. We have, again, the remnants of the IT crew before, so it’s sort of a tiny CIO-type function. Es-sentially a technology planner. But there is a contract, which binds EpicI to use the serv-ices of EDS. So EpicI will become a Siamese twin of EDS. In other words, it will handle the processing-type area and EDS will han-dle the IT-type area.
We have created a new division that manages the interface with EpicI and admin-
isters the contract. Remaining within the bank are certain corporate services we could think of outsourcing in due course; perhaps to EpicI, perhaps to others; and the three business units which are retail, business and corporate. These are the units where the “real” bankers live - the people who understand their custom-ers, who think about interest rates, who manage client relationships, who have a nose for good credit and so on. Now the real bankers are released to do the busi-ness. They don’t have to bother so much about processing and other mechanical administrative tasks.
Within the bank, now that the bread and butter stuff is dealt with, or is being dealt with, a transition is occurring. It should be more or less complete later this year. Now we are free to think of other important projects: such as better risk management systems, customer relationship systems and client manage-ment systems.
PERSONAL ACCOUNT

The Asian Banker Journal 17
The Defi nitive Annual Ranking and Survey of Asia’s Top Banks
Look us up on www.theasianbanker.com
Special Edition
Special EditionDisplay until 31 December, 2002

THE ASIAN BANKER 300
2 The Asian Banker Journal Special Edition

THE ASIAN BANKER 300
The Asian Banker Journal Special Edition 3
This Special Report was researched and written by CHEW LIMAY, CFA, manager, Asian Banker Research and published by The Asian Banker, incorporated as T.A.B. International Pte Ltd. Worldwide Copyright Protected. All rights reserved. ISSN 02189615 Singapore permit: MITA (P) 029/10/2001 Malaysia KDN PPS 1301/9/2001. Reproduction in any form prohibited except with permission. For reprints, please call Singapore 65-62957300. While every precaution is taken to ensure accuracy of the information in this report, The Asian Banker does not provide warranty of any kind for suitability of use of this report.
An intensifi ed will to tackle the problemsAsian Banker Research is proud to present its inaugural ranking of the region’s Top 300 commercial banks by asset size. In researching on our story, two pertinent issues confronting the region’s fi nancial institutions became apparent: the continuing high levels of non performing loans (NPLs), and the ongoing consolidation taking place within the industry.
An intensifi ed will to tackle the problems
Asian Banker Research is proud to present its inaugural ranking of the region’s Top 300 commercial banks. In researching on our story, two pertinent issues confronting the region’s fi nancial institutions became apparent: the continuing high levels of non performing loans (NPLs), and the ongoing consolidation taking place within the industry.
From the Editors
The editors of The Asian Banker Journal are pleased to present what is likely the fi rst extensive study of the balance sheet pro-fi les of the Asian banking industry since the economic crisis of the past few years.
One of the most important discoveries that we made in develop-ing these rankings is that a ranking of 500 banks for Asia is no longer relevant. A ranking of 300 banks is the most credible and usable list. Many smaller banks have either been consolidated or do not have reporting structures that are transparent enough to validate for this study.
This year’s ranking was developed entirely by a team led by Chew Limay, the lead data center and benchmark researcher at The Asian Banker Research. She was of the view that the progress being made by different banks across the region in resolving NPL problems has received less attention than the problem itself.
Limay and her team of course expect to interact extensively with subscribers of this report in order to further develop what has become the most authoritative ranking of fi nancial institutions for Asia.
Table of Contents• Intensifi ed will to tackle the problems w3• Index to The Asian Banker 300 12• The region’s largest banks by Assets 16• The largest banks in Greater China 28• The largest banks in ASEAN 29• Performance Rankings 30• Country Capsules 32
The full edition of this ranking in Excel sheet format, plus updates and analyst support are available by a subscription of only $620 per annum. Details are
available in the related advertisement in this Journal. Alternatively, please contact us at subs@asianbanker.
com.sg or call 65-62957300 or visit www.theasianbanker.com

THE ASIAN BANKER 300
4 The Asian Banker Journal Special Edition
577,939
4,014
1,828,192
503,111
259,725
66,499
6,904,320
148,536
65,982
16,881
33,724
189,009
491,109
2,500
586,982
124,064
11,275
11,813,860
18.5%
0.0%
16.2%
23.9%
7.2%
1.7%
na
3.6%
3.0%
na
0.2%
5.6%
13.6%
0.0%
3.1%
3.1%
0.1%
100.0%
4,833
2
4,226
6,234
1,884
454
-38,785
945
787
-81
50
1,464
3,553
8
810
817
29
-12,770
5.3%
0.0%
15.3%
3.3%
1.6%
0.2%
59.5%
1.4%
0.8%
0.1%
0.2%
1.5%
4.3%
0.0%
5.1%
1.2%
0.1%
100.0%
351,908
1,706
1,017,522
219,990
106,043
14,762
3,966,317
94,277
53,476
8,004
16,082
101,415
289,001
1,204
338,381
79,150
3,767
6,663,004
3.7%
0.0%
17.7%
4.2%
2.6%
0.6%
56.5%
1.3%
0.5%
0.2%
0.3%
1.5%
4.1%
0.0%
5.6%
1.2%
na
100.0%
300,487
3,364
1,448,789
339,538
212,414
50,801
4,619,305
102,487
41,585
14,074
20,533
124,956
335,897
786
458,070
96,032
na
8,169,117
4.9%
0.0%
15.5%
4.3%
2.2%
0.6%
58.4%
1.3%
0.6%
0.1%
0.3%
1.6%
4.2%
0.0%
5.0%
1.1%
0.1%
100.0%
Australia Bangladesh China Hong Kong India Indonesia Japan Malaysia New Zealand Pakistan Philippines Singapore South Korea Sri Lanka Taiwan Thailand Vietnam Total
11
1
16
18
30
8
109
17
5
4
7
3
13
1
43
11
3
300
How did the nations fare in TAB 300?
* excluding losses from Japan and Pakistan
Source: Asian Banker Research
In 2001's Asian Banker 300, the region suffered a total net loss of $12.8 billion. This is at the other end of the spectrum from net earnings of $23.8 billion in 2000. Of this, Japan's red ink stained the darkest, with losses of $38.8 billion as against a turnround of $3 billion the year prior. There is however hope that the losses, largely due to NPLs written off, could herald a new era with stronger recapitalisation and better lending.
CountryBanksin 300
Assets($mn)
Shareof total
Deposits($mn)
Shareof total
Shareof total
Net Profit($mn)
Shareof total *
Loans($mn)
Progress being made by banks in differ-ent parts of Asia to resolve their NPL problems has received less attention than the problem itself. The Asian Banker 300 identifi es the potential winners and losers. The former includes South Korea and India which have made the most decisive moves to root out the NPL problem. Progress however, remains slow in tackling NPLs in Japan, Taiwan, Thailand and Indonesia despite the crea-tion of asset management companies to help banks get NPLs off their books. In Hong Kong the level of NPLs varies from bank to bank dependent on the extent of lending to the mainland, whilst the weakness of the economy in Singapore has seen NPLs continue to rise, albeit from a low level.
This research also shows how the frenetic pace of Asia’s consolidation has taken its toll. A survey originally intended to cover the top 500 regional banks had to be whittled down to 300 as a tsunami of consolidations and occasional exits
wrought radical change on the banking landscape. We expect continuing consoli-dation activity as management strives to tackle the ongoing asset quality problems and address the relatively low profi tability provided by current banking structures.
The aggregated results of the sur-vey make disturbing reading. Whilst the number of banks in the region has shrunk, the benefi ts of this consolidation have yet to be realised and profi tability for most players remains marginal. The combined net profi ts of banks covered by the survey slid from a profi t of $23.8 billion into negative territory with a $12.8 billion loss, despite an anaemic rise in aggregated assets of 1.9% to $11.8 tril-lion. Japanese banks, which accounted for 36% of our coverage (109 banks) in TAB 300, continue to show the folly of earlier lending policies. In 2001, these banks haemorrhaged a staggering $39 billion, erasing a $3 billion bounce bank into the black in 2000. Asia ex-Japan numbers were more encouraging - total
net profi ts improved 25% to $26 billion - with especially inspiring numbers from India and South Korea.
Trying to tackle problem loansNPLs remain a serious problem for Asian Banks, and are likely to impair the speed of economic recovery in the region. Since the fi nancial crisis, local and international regulatory and supervisory bodies have been forced to adopt a pro-active stance to sort out the mess. Financially unsound institutions were subjected to take-overs and mergers, the lucky ones re-capitalised and some less fortunate banks liquidated. Few would disagree that these actions were essential to provide for the survival of the banking industry in Asia.
There is a growing will to tackle the problem. We see evidence of this in retrograde action to deal with existing problem loans. Some loans have simply been written off, but banks have been able to sell portfolios of dubious loans to government sponsored asset management

THE ASIAN BANKER 300
The Asian Banker Journal Special Edition 5
companies (AMCs). International invest-ment banks have acted as intermediaries using sophisticated fi nancial engineering to repackage distressed assets, extracting residual value by using credit derivative structures. Specialised vulture funds have also begun to circle, picking off individual and groups of bad loans, bringing a more pragmatic and short-term perspective to the workout process.
Predicament of major proportions Typically, about 2-3% of loans in a healthy bank will be non-performing - defi ned as those that are not serviced for at least three months - with a percentage of up to 5% considered acceptable. The hangover from the Asian fi nancial crisis means that it is unrealistic to expect a return to below these thresholds for Asian banks any time soon. Regional asset quality has deterio-rated to an extraordinary extent. Apart from Australia, South Korea and Hong Kong, the remaining countries have soured loans above the 5% threshold. In the worst instance, unoffi cial estimates claim that perhaps half of the loan port-folio in China is irretrievable. As such, the offi cial NPL numbers shown in the graph below need to be treated with some caution. Banks in some countries such as Malaysia (gross NPL: 18%), have tackled their non-performing loan problems with greater candour than, for example, Japan (NPL: 7%) although this may not be ap-parent from these numbers.
Whilst the recent history of NPLs in Asia starts in Japan, the Japanese banks can in no way be seen as a role model
in attempting to resolve the NPL issue. Over the last decade, policy-makers have largely ignored the problem, hoping that it would go away. NPLs in Japan are a legacy of asset infl ation in the late 1980s which lured banks into lending trillions of yen to finance asset purchases of property and shares at infl ated prices. When the fi nancial bubble burst, prices collapsed and loans went bad. Japan resolved about $400 billion worth of bad loans between 1998-2001, yet offi cials acknowledge that banking sector NPLs still hover around 40 trillion yen ($305 billion) or 6-7% of the total loan assets of its banking system. Many private sec-tor analysts believe the real level to be 60 trillion yen in EXCESS of this fi gure, depending on how problem loans are classifi ed. This would push the NPL ratio up nearer to 15-18% of total loan book, a surreal fi gure almost similar to Japan’s annual GDP.
China is another country where the level of NPLs has placed the local banks
in a precarious state. There, the problem is largely due to state banks being used as conduits for state spending on projects that yielded insuffi cient returns. NPLs prob-ably amount to as much as $3.2 trillion yuan ($378 billion) or 28% of the total loans outstanding by Chinese banks, with the four ma-jor state-owned banks responsible for 2/3rds of the total value. China’s biggest player, In-
dustrial and Commercial Bank of China (ICBC, No.5 in TAB300) acknowledged an NPL ratio of just under 30%, while Bank of China (BOC, No. 7) admitted recently to the group’s NPLs being 24%. More alarmingly, many foreign observ-ers believe the actual size of NPLs is understated because the way the Chinese categorize bad loans is relatively lenient compared to international accounting standards. Unoffi cial estimates put the banking system’s NPLs closer to 50%, making the banks technically insolvent! With Chinese banks yet to be granted authority to resolve their own NPLs, the growing NPL problem remains a colos-sal drag.
AMCs to the rescue...Elsewhere in the region, the problem ap-pears to pale alongside Japan and China. Nonetheless, NPLs are still an issue and in some cases, the situation is a great deal worse than it appears on the surface. Amongst the nations battered by the Asian crisis, the Philippines still has the worst acknowledged level of banking-system bad debt at 18.4% of total loans in the fi nancial sector. Malaysia comes a close second at 18%, followed by Indone-sia (12%) and Thailand (10.5%). All except the Philippines have been able to make the problem look better‚ via the creation of state-owned or state-supported Asset Management Companies (AMCs) to purchase bad assets from fi nancial insti-tutions at discounted prices, repackage and sell them.
One virtue of shifting NPLs from banks to AMCs is that it creates a transparent sale and disclosure process to make investors more comfortable. This unfortunately does not rectify the problem - in some cases, the sheer size of the residual legacy of bad debts in the aftermath of a fi nancial bubble is so great that even the govern-
Estimates place Japan’s banking sector NPLs at 100 trillion yen ($763 billion) ...almost similar to her annual GDP. Meanwhile, many foreign ob-servers believe the actual size of China’s NPL is understated...unoffi cial extimates put the fi gure closer to 50%.

THE ASIAN BANKER 300
6 The Asian Banker Journal Special Edition
ments are unable to deal with it. The Asian Development Bank (ADB) echoed the limitation of the AMC solution, saying ‘The overhang of NPLs held by AMCs is one factor retarding economic recovery by delaying corporate restructuring.’
...but progess still lackingDigging beneath the surface, we indeed found evidence that some AMCs have not made distinctive inroads into NPL disposal. The Resolution and Collection Corporation in Japan for instance, has so far bought up only a tiny fraction of NPLs in the system. A report released by Ernst & Young (EY) Asia Pacifi c Finan-cial Solutions last No-vember was similarly critical of the govern-ments for their lack of development in tacking NPLs. EY es-timated NPLs to have leaped-frog 33% in the last two years and amounted to some $2 trillion in November. This translates to lev-els of NPLs in Asia at roughly 29% of the re-gion’s combined GDP rather than official estimates of 17.3%.
Thailand and In-donesia have been amongst the slow-est in tackling the NPL problem. Even allowing for AMC purchases of NPLs from banks, progress in restoring finan-cial health has been disappointing. Despite the Financial Restructuring Agency in Thailand enlist-ing the help of foreign NPL advisors like GE Capital and Lend Lease to liquidate failed assets, subsequent disposal of the bad loans by the AMCs themselves have been slow.
In Indonesia, the Indonesian Bank Re-structuring Agency (IBRA) has hitherto merged four ailing state banks to form the biggest Indonesian bank - Bank Mandiri (No.80); sold 51% of Bank Central Asia (BCA, No.163) to hedge fund Farallon Capital of the United States for $540 million; and cleaned up and recapital-ize Bank International Indonesia (BII, No.282), a bank crippled by huge loans
Taiwanese banks into the red this year but prepare the stage for recovery in the coming years.
The key exception to weak reforms in tackling NPLs has been South Korea. Nowhere has the clean up been swifter or more successful. Although the govern-ment still has further to go with privati-sation and consolidation in the sector, reforms are moving along following the creation of the Korea Asset Manage-ment Co. (KAMCO) to tackle roughly 66 trillion won ($50 billion) of troubled debt transferred from Korean fi nancial institutions. With NPLs plummeting 980 basis points from 12.9% in 1999 to
3.1% by 1Q2002, clean up here is definitely seeing meaningful progress. However, giving banks a fresh start comes at a price - the Korean govern-ment has exhausted $117 billion or 25% of its GDP for this purpose, in contrast to Japan’s 14% and Taiwan’s less than 3% and Malaysia’s less than 5%.
Though commend-able efforts have been made via government-led programmes to address financial re-structuring and follow through with NPL disposition strategies, bar exceptions like Korea, the regional economies are gen-erally struggling to
keep on top of the NPL problem. Ernst & Young reckons that the cost of failing to move aggressively to resolve the is-sue will snowball into the “NPL Effect” - reduced economic expansion resulting in slower growth in standards of living, business investment, and tax revenue. There is a need for the different countries in Asia to grasp the bull by the horns and make a concerted and sometimes painful effort to clean up the NPL problem once and for all.
Hopefully, forward looking initia-tives such as the adoption of more so-phisticated lending criteria and better risk management tools that banks have begun implementing will limit the risks
made to a related party. The fi nancial mess is however far from over - next on IBRA’s list of disposal is that of Bank Niaga by October following twice-delayed attempts from unsatisfactory bids earlier. Other banks it is expected to move towards offl oading include Bank Mandiri, Bank Negara Indonesia (BNI) and Bank Rakyat Indonesia (BRI) fol-lowed by BII, Bank Bali, Bank Lippo and Bank Danamon. Although Indonesia has an urgent need to plug its budget defi cit, given the number of banks on offer and the limited investors‚ appetite for Indo-nesia, the completion of these sales will take some time yet.
Despite write-offs amounting to NT$530 billion ($15.1 billion) over the past three years, Taiwan’s has similarly witnessed an acceleration of NPL levels to circa 7.5% (with unoffi cial estimates at twice that), drifting further and further away from the Ministry of Finance’s goal to cut NPL ratios below 2.5% by June 2003. However, signs are surfacing that banks are facing up to the problem - the big 3 commercial banks (First Com-mercial (No.52), Hua Nan (No.56) and Chang Hwa (No.60)) have already begun liquidating billions in NT$ of NPLs, with each intending to dispose off between NT$42-60 billion ($1.2-1.7 billion) this year. Massive write-offs would put most

THE ASIAN BANKER 300
The Asian Banker Journal Special Edition 7
ORACLE ADS (FILM) ...COMPLETE...
THE ASIAN BANKER 300
8 The Asian Banker Journal Special Edition
Holdings (No.4). This follows the mar-riage between Fuji, Dai-ichi Kangyo and Industrial Bank of Japan earlier in 2000 to create the behemoth Mizuho Financial Group, possibly the world’s largest bank with assets exceeding $1.15 trillion.
For many nations, the primary impetus for merger activity is deeply entwined with the NPL problem. Regulators are trying to repair their fi nancial systems and lay the foundation for a strong eco-nomic recovery. The hoped-for results are greater effi ciencies, higher profi ts, streamlined management, better gov-ernance and better risk-management procedures. There is also the possibil-ity that we will see more cross border M&A activity. Although local relevance
remains important, especially in regions with vast rural clientele like China and India, the fact remains that local play-ers are disadvantaged in several arenas. Globalisation brings with it considerable advantages - economies of scale, cheaper cost of funds, resources to embrace technological advancements and inter-national branding expertise.
With government-led integration, the push for internationalisation, and several countries still over-banked, there remains plenty of scope for more consolidation. On that front, Singapore banks are emerging at the top of the consolidation pile in South East Asia. With the island-nation opening the banking market to international players,
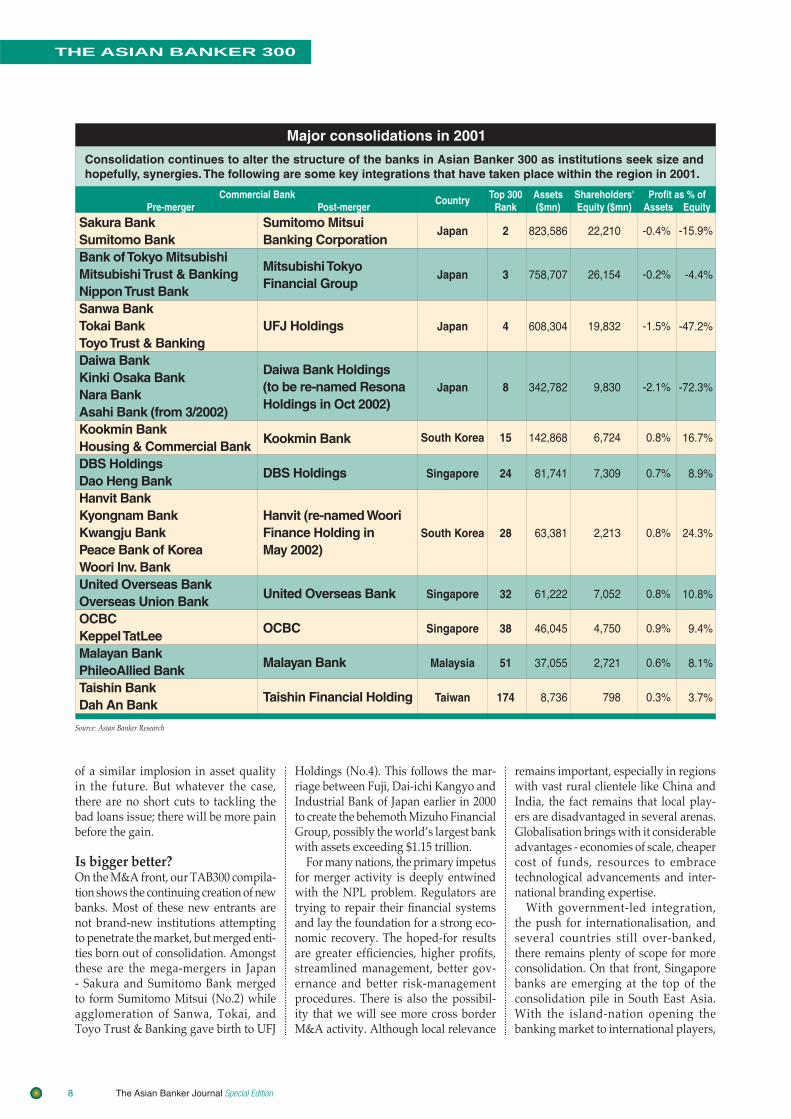
Major consolidations in 2001
Consolidation continues to alter the structure of the banks in Asian Banker 300 as institutions seek size and hopefully, synergies. The following are some key integrations that have taken place within the region in 2001.
Commercial Bank Pre-merger Post-merger
Country Top 300Rank
Assets($mn)
Shareholders'Equity ($mn)
Profit as % ofAssets Equity
Sakura BankSumitomo BankBank of Tokyo MitsubishiMitsubishi Trust & BankingNippon Trust BankSanwa BankTokai BankToyo Trust & BankingDaiwa BankKinki Osaka BankNara BankAsahi Bank (from 3/2002)Kookmin BankHousing & Commercial BankDBS HoldingsDao Heng BankHanvit BankKyongnam BankKwangju BankPeace Bank of KoreaWoori Inv. BankUnited Overseas BankOverseas Union BankOCBC Keppel TatLeeMalayan BankPhileoAllied BankTaishin BankDah An Bank
Sumitomo MitsuiBanking Corporation
Mitsubishi TokyoFinancial Group
UFJ Holdings
Daiwa Bank Holdings(to be re-named ResonaHoldings in Oct 2002)
Kookmin Bank
DBS Holdings
Hanvit (re-named WooriFinance Holding inMay 2002)
United Overseas Bank
OCBC
Malayan Bank
Taishin Financial Holding
Japan
Japan
Japan
Japan
South Korea
Singapore
South Korea
Singapore
Singapore
Malaysia
Taiwan
2
3
4
8
15
24
28
32
38
51
174
823,586��
758,707���
608,304���
342,782���
142,868��
81,741����
63,381���
61,222��
46,045��
37,055��
8,736
22,210���
26,154���
19,832���
9,830���
6,724��
7,309����
2,213���
7,052��
4,750��
2,721��
798
-0.4%���
-0.2%���
-1.5%���
-2.1%���
0.8%��
0.7%����
0.8%���
0.8%��
0.9%��
0.6%��
0.3%
-15.9%���
-4.4%���
-47.2%���
-72.3%���
16.7%��
8.9%����
24.3%���
10.8%��
9.4%��
8.1%��
3.7%
Source: Asian Banker Research
of a similar implosion in asset quality in the future. But whatever the case, there are no short cuts to tackling the bad loans issue; there will be more pain before the gain.
Is bigger better? On the M&A front, our TAB300 compila-tion shows the continuing creation of new banks. Most of these new entrants are not brand-new institutions attempting to penetrate the market, but merged enti-ties born out of consolidation. Amongst these are the mega-mergers in Japan - Sakura and Sumitomo Bank merged to form Sumitomo Mitsui (No.2) while agglomeration of Sanwa, Tokai, and Toyo Trust & Banking gave birth to UFJ

THE ASIAN BANKER 300
The Asian Banker Journal Special Edition 9
THE ASIAN BANKER 300
10 The Asian Banker Journal Special Edition
Average (ex-Japan & Pakistan)Japan
Taiwan�Bangladesh�
China�Philippines�
Sri Lanka�Malaysia�
Singapore�Indonesia�Australia�
India�Thailand�Vietnam�
South Korea�Hong Kong�
New Zealand
-20% -15% -10% -5% 0% 5% 10% 15% 20% 25%
Pakistan
Return on EquityReturn on Assets
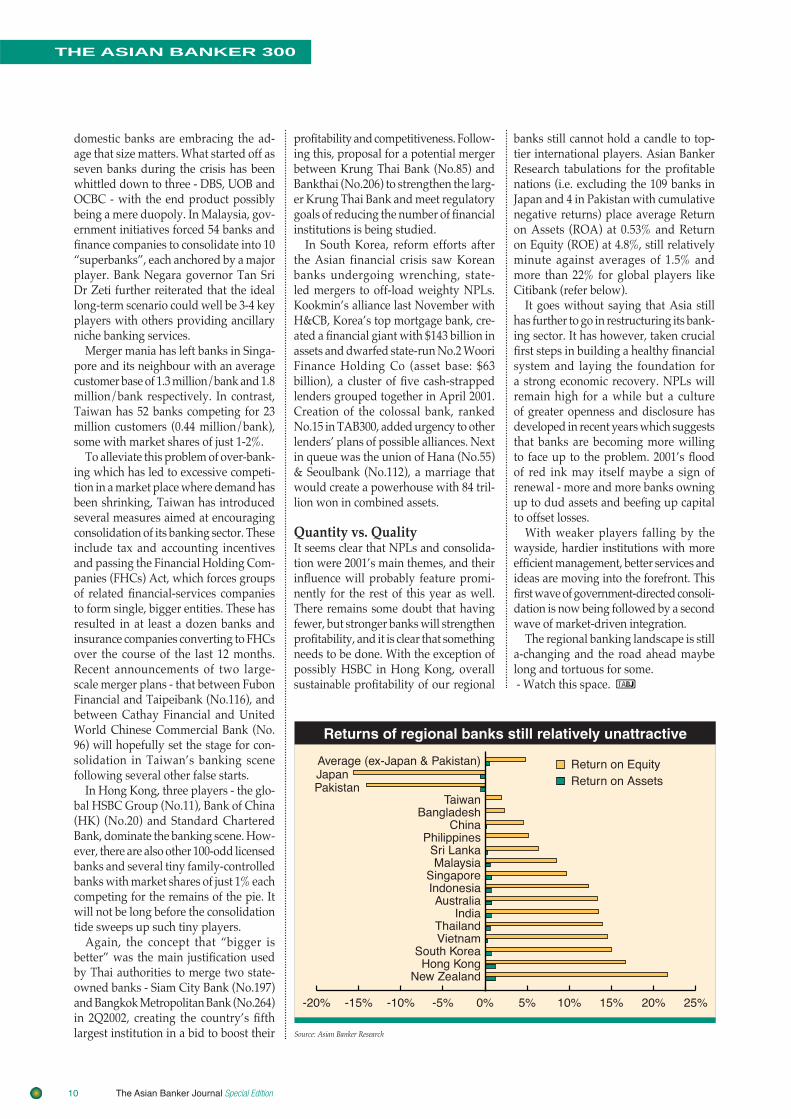
Returns of regional banks still relatively unattractive
Source: Asian Banker Research
domestic banks are embracing the ad-age that size matters. What started off as seven banks during the crisis has been whittled down to three - DBS, UOB and OCBC - with the end product possibly being a mere duopoly. In Malaysia, gov-ernment initiatives forced 54 banks and fi nance companies to consolidate into 10 “superbanks”, each anchored by a major player. Bank Negara governor Tan Sri Dr Zeti further reiterated that the ideal long-term scenario could well be 3-4 key players with others providing ancillary niche banking services.
Merger mania has left banks in Singa-pore and its neighbour with an average customer base of 1.3 million/bank and 1.8 million/bank respectively. In contrast, Taiwan has 52 banks competing for 23 million customers (0.44 million/bank), some with market shares of just 1-2%.
To alleviate this problem of over-bank-ing which has led to excessive competi-tion in a market place where demand has been shrinking, Taiwan has introduced several measures aimed at encouraging consolidation of its banking sector. These include tax and accounting incentives and passing the Financial Holding Com-panies (FHCs) Act, which forces groups of related fi nancial-services companies to form single, bigger entities. These has resulted in at least a dozen banks and insurance companies converting to FHCs over the course of the last 12 months. Recent announcements of two large-scale merger plans - that between Fubon Financial and Taipeibank (No.116), and between Cathay Financial and United World Chinese Commercial Bank (No. 96) will hopefully set the stage for con-solidation in Taiwan’s banking scene following several other false starts.
In Hong Kong, three players - the glo-bal HSBC Group (No.11), Bank of China (HK) (No.20) and Standard Chartered Bank, dominate the banking scene. How-ever, there are also other 100-odd licensed banks and several tiny family-controlled banks with market shares of just 1% each competing for the remains of the pie. It will not be long before the consolidation tide sweeps up such tiny players.
Again, the concept that “bigger is better” was the main justifi cation used by Thai authorities to merge two state-owned banks - Siam City Bank (No.197) and Bangkok Metropolitan Bank (No.264) in 2Q2002, creating the country’s fi fth largest institution in a bid to boost their
profi tability and competitiveness. Follow-ing this, proposal for a potential merger between Krung Thai Bank (No.85) and Bankthai (No.206) to strengthen the larg-er Krung Thai Bank and meet regulatory goals of reducing the number of fi nancial institutions is being studied.
In South Korea, reform efforts after the Asian financial crisis saw Korean banks undergoing wrenching, state-led mergers to off-load weighty NPLs. Kookmin’s alliance last November with H&CB, Korea’s top mortgage bank, cre-ated a fi nancial giant with $143 billion in assets and dwarfed state-run No.2 Woori Finance Holding Co (asset base: $63 billion), a cluster of fi ve cash-strapped lenders grouped together in April 2001. Creation of the colossal bank, ranked No.15 in TAB300, added urgency to other lenders’ plans of possible alliances. Next in queue was the union of Hana (No.55) & Seoulbank (No.112), a marriage that would create a powerhouse with 84 tril-lion won in combined assets.
Quantity vs. Quality It seems clear that NPLs and consolida-tion were 2001’s main themes, and their infl uence will probably feature promi-nently for the rest of this year as well. There remains some doubt that having fewer, but stronger banks will strengthen profi tability, and it is clear that something needs to be done. With the exception of possibly HSBC in Hong Kong, overall sustainable profi tability of our regional
banks still cannot hold a candle to top-tier international players. Asian Banker Research tabulations for the profi table nations (i.e. excluding the 109 banks in Japan and 4 in Pakistan with cumulative negative returns) place average Return on Assets (ROA) at 0.53% and Return on Equity (ROE) at 4.8%, still relatively minute against averages of 1.5% and more than 22% for global players like Citibank (refer below).
It goes without saying that Asia still has further to go in restructuring its bank-ing sector. It has however, taken crucial fi rst steps in building a healthy fi nancial system and laying the foundation for a strong economic recovery. NPLs will remain high for a while but a culture of greater openness and disclosure has developed in recent years which suggests that banks are becoming more willing to face up to the problem. 2001’s fl ood of red ink may itself maybe a sign of renewal - more and more banks owning up to dud assets and beefi ng up capital to offset losses.
With weaker players falling by the wayside, hardier institutions with more effi cient management, better services and ideas are moving into the forefront. This fi rst wave of government-directed consoli-dation is now being followed by a second wave of market-driven integration.
The regional banking landscape is still a-changing and the road ahead maybe long and tortuous for some. - Watch this space.

THE ASIAN BANKER 300
The Asian Banker Journal Special Edition 11

THE ASIAN BANKER 300
12 The Asian Banker Journal Special Edition
Index To The Asian Banker 300
Name, Country and Rank
AAdelaide BankAgricultural Bank of ChinaAichi BankAkita BankAllahabad BankAlliance BankAMP BankAndhra BankANZ Banking Group (NZ)Aomori BankAozora BankArab-Malaysian BankAsahi BankASB Bank – NZAshikaga BankAsia Pacifi c BankAustralia & New Zealand Banking GroupAwa Bank
BBangkok BankBangkok Metropolitan BankBank Central AsiaBank DanamonBank for Foreign Trade of Vietnam (Vietcombank)Bank for Investment and Development (BIDV)Bank Internasional IndonesiaBank Islam MalaysiaBank LippoBank MandiriBank Negara IndonesiaBank of America (Asia)Bank of AsiaBank of AyudhyaBank of BarodaBank of CeylonBank of China (HK)Bank of China GroupBank of CommunicationsBank of East AsiaBank of FukuokaBank of IkedaBank of IndiaBank of IwateBank of KansaiBank of KaohsiungBank of KochiBank of KyotoBank of MaharashtraBank of NagoyaBank of New ZealandBank of OkinawaBank of Overseas ChineseBank of PanhsinBank of SagaBank of ShanghaiBank of TaiwanBank of the Philippine IslandsBank of The RyukyusBank of Western Australia (BankWest)Bank of YokohamaBank RakyatBank Rakyat IndonesiaBank SinopacBank Tabungan NegaraBankthaiBaodao Commercial BankBeijing City Commercial Bank
AustraliaChinaJapanJapanIndiaMalaysiaAustraliaIndiaNew ZealandJapanJapanMalaysiaJapanNew ZealandJapanTaiwanAustraliaJapan
ThailandThailandIndonesiaIndonesiaVietnamVietnamIndonesiaMalaysiaIndonesiaIndonesiaIndonesiaHong KongThailandThailandIndiaSri LankaHong KongChinaChinaHong KongJapanJapanIndiaJapanJapanTaiwanJapanJapanIndiaJapanNew ZealandJapanTaiwanTaiwanJapanChinaTaiwanPhilippinesJapanAustraliaJapanMalaysiaIndonesiaTaiwanIndonesiaThailandTaiwanChina
27110
10810723024727620515211437
28812
17949
24622
104
6926416323423928728227529880
144242266171138293207
238135
13315710617621319057
24995
11916718928312714627
18615415025
297191184292206229151
Bendigo BankBiwako BankBumiputra-Commerce Bank
CCanara Bank Cathay United BankCentral Bank of IndiaCentral Trust of ChinaChang Hwa Commercial BankChekiang First BankChiao Tung BankChiba Bank Chiba Kogyo BankChikuho BankChina Construction BankChina Development Industrial BankChina Everbright BankChina Merchants BankChina Minsheng Banking CorpChinatrust Commercial BankChinese BankChinfon Commercial BankChohung BankChugoku BankChukyo BankChung Shing BankChuo Mitsui Trust & BankingCitibankCitibank IndiaCITIC Industrial BankCITIC Ka Wah BankCommonwealth Bank of AustraliaCorporation BankCosmos Bank
DDaegu BankDah Sing BankDaisan BankDaishi BankDaito BankDaiwa Bank HoldingsDao Heng BankDBS Group HoldingDBS Kwong On BankDena BankDevelopment Bank of the Philippines
EE.Sun Commercial BankEhime BankEighteenth BankEnTie Commercial BankEON BankEquitable PCI Bank
FFar Eastern Intl BankFarmers Bank of ChinaFirst Commercial BankFubon Commercial BankFujian Industrial Bank
AustraliaJapanMalaysia
IndiaTaiwanIndiaTaiwanTaiwanHong KongTaiwanJapanJapanJapanChinaTaiwanChinaChinaChinaTaiwanTaiwanTaiwanSouth KoreaJapanJapanTaiwanJapanMalaysiaIndiaChinaHong KongAustraliaIndiaTaiwan
South KoreaHong KongJapanJapanJapanJapanHong KongSingaporeHong KongIndiaPhilippines
TaiwanJapanJapanTaiwanMalaysiaPhilippines
TaiwanTaiwanTaiwanTaiwanChina
268181110
125250155156
60260118
29121258
9215
6164
10977
207244
4648
145252
19209255
53187
17254218
149198142
66225
8105
24248257270
188143111224199243
222122
52182123

THE ASIAN BANKER 300
The Asian Banker Journal Special Edition 13
Name, Country and Rank
Fukui BankFukuoka Chuo BankFukuoka City BankFukushima Bank
GGifu BankGrand Commerical BankGuangdong Development BankGunma Bank
HHabib BankHachijuni BankHana BankHang Seng BankHanvit (Woori) BankHDFC BankHigashi-Nippon BankHigo BankHiroshima BankHiroshima-Sogo BankHokkaido BankHokkoku BankHokuetsu BankHokuriku BankHong Leong BankHongkong Chinese BankHowa BankHSBCHSBC Bank MalaysiaHsinchu Intl BankHua Nan Commercial BankHua Xia BankHyakugo BankHyakujushi Bank
IICBC (Asia)ICICI Indian BankIndian Overseas BankIndusind BankIndustrial & Commercial Bank of Vietnam (Vietincombank)Industrial and Commercial Bank of ChinaIndustrial Bank of KoreaInternational Bank of AsiaInternational Bank of Taipei Intl Commercial Bank of ChinaIyo Bank
JJammu & Kashmir BankJeonbuk BankJoyo BankJuroku Bank
KKagawa BankKagoshima BankKanto Bank
JapanJapanJapanJapan
JapanTaiwanChinaJapan
PakistanJapanSouth KoreaHong KongSouth KoreaIndiaJapanJapanJapanJapanJapanJapanJapanJapanMalaysiaHong KongJapanHong KongMalaysiaTaiwanTaiwanChinaJapanJapan
Hong KongIndiaIndiaIndiaIndiaVietnamChinaSouth KoreaHong KongTaiwanTaiwanJapan
IndiaSouth KoreaJapanJapan
JapanJapanJapan
11528992
223
2312208244
22643553328
2361407941
1207284
13039
15829125111
20817756
1477074
22190
202195295261
540
2631737663
2772863467
16583
196
Kaohsiung Business BankKeiyo BankKinki Osaka BankKita-Nippon BankKiyo BankKookmin BankKorAm BankKorea Exchange BankKorea First BankKrung Thai BankKumamoto Family BankKyushu Bank
LLand Bank of TaiwanLiu Chong Hing BankLucky Bank
MMacquarie BankMakoto BankMalayan BankingMetropolitan Bank and TrustMichinoku BankMie BankMinami-Nippon BankMinato BankMitsubishi Tokyo Financial GroupMiyazaki BankMiyazaki Taiyo BankMizuho Financial GroupMusashino BankMuslim Commercial Bank
NNagano BankNanto BankNanyang Commercial BankNational Australia BankNational Bank of NZNational Bank of PakistanNippon Trust BankNishi-Nippon BankNorinchukin BankNorth Pacifi c Bank
OOCBC Bank (Malaysia) Ogaki Kyoritsu BankOita BankOriental Bank of CommerceOversea-Chinese Banking Corporation
PPan Asia BankPerwira Affi n BankPhilippine National BankPublic BankPunjab & Sind BankPunjab National BankPusan Bank
TaiwanJapanJapanJapanJapanSouth KoreaSouth KoreaSouth KoreaSouth KoreaThailandJapanJapan
TaiwanHong KongTaiwan
AustraliaTaiwanMalaysiaPhilippinesJapanJapanJapanJapanJapanJapanJapanJapanJapanPakistan
JapanJapanHong KongAustraliaNew ZealandPakistanJapanJapanJapanJapan
MalaysiaJapanJapanIndiaSingapore
TaiwanMalaysiaPhilippinesMalaysiaIndiaIndiaSouth Korea
3009859
175881587479785
160185
45232294
131235
51170129164237
863
141259
194
280
20165
15313
126211193
626
42
21978
100217
38
238253265132284137162

THE ASIAN BANKER 300
14 The Asian Banker Journal Special Edition
Name, Country and Rank
RRHB Bank BerhadRizal Commercial Banking Corp
SSan-In Godo BankSapporo BankSenshu BankSeoulbankSetouchi BankShanghai Commercial & Savings BankShanghai Commercial BankShanghai Pudong Development BankShenzhen Development BankShiga BankShikoku BankShimizu BankShinhan BankShinkin Central BankShinsei BankShinwa BankShizuoka BankShoko Chukin BankShokusan BankSiam City BankSiam Commercial BankSonali BankSouthern BankSt George BankStandard Chartered Bank MalaysiaState Bank of Bikaner & JaipurState Bank of HyderabadState Bank of IndiaState Bank of PatialaState Bank of TravancoreSumitomo Mitsui Banking CorporationSumitomo Trust & BankingSuncorp-MetwaySunny BankSuruga BankSyndicate Bank
TTa Chong BankTaiko BankTainan Business BankTaipeibankTaishin Financial Holding
MalaysiaPhilippines
JapanJapanJapanSouth KoreaJapanTaiwanHong KongChinaChinaJapanJapanJapanSouth KoreaJapanJapanJapanJapanJapanJapanThailandThailandBangladeshMalaysiaAustraliaMalaysiaIndiaIndiaIndiaIndiaIndiaJapanJapanAustraliaTaiwanJapanIndia
TaiwanJapanTaiwanTaiwanTaiwan
134281
7119414811221016116893
1596899
166541431
1393018
23319711325620475
20326924526
267278
216
12427291
212
216172262116174
Taiwan Business BankTaiwan Cooperative BankThai Danu BankThai Farmers BankThai Military BankTochigi BankToho BankTohoku BankTokushima BankTokyo Tomin BankTomato BankTottori BankTowa BankToyama Bank
UUco BankUFJ HoldingsUnion Bank of IndiaUnion Bank of TaiwanUnited Bank LimitedUnited Bank of IndiaUnited Coconut Planters BankUnited Overseas BankUnited World Chinese Com. BankUOB (Malaysia)UTI Bank
VVijaya Bank
WWestpac Banking CorpWestpac Banking Corporation (NZ)Wing Hang BankWing Lung Bank
YYamagata BankYamaguchi BankYamanashi Chuo Bank
77 Bank
TaiwanTaiwanThailandThailandThailandJapanJapanJapanJapanJapanJapanJapanJapanJapan
IndiaJapanIndiaTaiwanPakistanIndiaPhilippinesSingaporeTaiwanMalaysiaIndia
India
AustraliaNew ZealandHong KongHong Kong
JapanJapanJapan
Japan
7336
299103178128
89241183101227214136285
2004
169228290240296
3296
274279
273
21117192180
13558
102
50
Bank-specifi c footnotes: • a - Formed from the merger of Fuji Bank, Dai-ichi Kangyo Bank and Industrial Bank of Japan . The Mizuho stable includes: Mizuho Holdings, Mizuho Corp Bank, Mizuho Securities and Mizuho Trust & Banking. Yasuda Trust & Banking Co., which has been undergoing restructuring under the Mizuho group’s umbrella, has also renamed itself Mizuho Asset Trust & Banking Co. • b - Sumitomo Bank and Sakura Bank merged to form Sumitomo Mitsui Banking Corporation in April 2001. • c - Holding company established in April 2001 to oversee operations of Mitsubishi Trust & Banking, Bank of Tokyo Mitsubishi, and Nippon Trust Bank. • d - UFJ Holdings was formed in April 2001 through the merger of Sanwa Bank, Tokai Bank, and Toyo Trust & Banking. The integration of the UFJ Group reached a key milestone in January 2002 with the birth of UFJ Bank and UFJ Trust Bank. • e - Daiwa Bank Holdings was set up in December 2001 with the merger of Daiwa Bank, Kinki Osaka Bank and Nara Bank. Asahi Bank came under its umbrella in Mar 2002. The hold-ing company will change its name to Resona Holdings Inc. in Oct. 1 2002. • f - Asahi Bank came under Daiwa Bank Holdings’ umbrella in Mar 2002. • g - Kookmin Bank was created in November 2001 by a merger between retail specialist Kookmin Bank and mortgage specialist Housing & Commercial Bank (H&CB). • h - Established on 1 October 2001, Bank of China (Hong Kong) is a Hong Kong incorporated licensed bank which combined the businesses of ten of the twelve banks in Hong Kong originally under the Bank of China Group. It was listed on the Hong Kong stock exchange on July 25th 2002. • i - Hanvit Bank absorbed Kyongnam, Kwangju, Peace Bank of Korea and Woori Inv. Bank. These are placed under the wing of Woori Finance Holdings Co., South Korea’s fi rst fi nancial holding fi rm, with the name changed from Hanvit to Woori Finance Holdings on 20th May 2002. • j - Nippon Credit Bank renamed itself Aozora Bank in January 2001. Net profi t for FY3/2002 was 18,563 million yen ($141.5mn) - other details not available (NA). • k - Malayan Bank merged with Phile-oAllied Bank Bhd (PAB) on 1 March 2001. • l - Shinhan Bank: Net profi t for 2001 was 347 billion won ($262.1mn) - other details NA. • m - China Merchants Bank listed in Feb 2002. • n - Bank Mandiri is formed out of the merger of four state banks: Bank Bumi Daya, Bank Dagang Negara, Bank Pembangunan Indonesia and Bank Exim in July 1999. It listed in 2002. • o - Dao Heng Bank: Data for the 18 months ended Dec 2001. This was changed from June 2001 due to Dao Heng becoming a subsidiary of DBS Bank (Singapore). • p - Bank of Iwate: Net profi t for FY3/2002 was 3.46bn Yen ($26.3mn) - other details NA. • q - Bank of New Zealand is a subsidiary of National Bank of Australia. • r - Punjab National Bank listed in Mar 2002. • s - Bank of Baroda: Net profi t for FY3/2002 was 5,459.3mn rupees ($112.9mn). The net profi t is higher due to the signifi cant increase in other income (+41%) - Other details NA. • t - Shinwa and Kyushu subsequently merged to form Kyushu-Shinwa Holdings in Mar 2002. • u - Bank of The Ryukyus: Net profi t for FY3/2002 was 4.88bn Yen ($34.5mn) - other details NA. • v - Taishin Bank merged with Dah An Bank in Sept 2001 and was renamed Taishin Financial Hldg. Taishin Financial listed in Feb 2002 and is expected to complete the mergers with Taiwan Securities Corp. and Taishin Bills Finance Corp. in Jan 2003. • w - Bank of Kansai: Net profi t for FY3/2002 was 1.452bn Yen ($11mn) - other details NA. • x - CITIC Ka Wah Bank’s fi nancials do not include those of Hongkong Chinese Bank, which it completed the takeover in January. If included, CITIC Ka Wah would have total assets of $10.2 billion. • y - Bangkok Metropolitan Bank merged with Siam City Bank on 1st April 2002. • z - EON Bank group will list in 2H2002 as EON Capital Bhd. • aa - Fukushima Bank: Net loss for FY3/2002 was 17.887bn Yen ($136.4mn) - other details NA. • ab - Gifu Bank: Net loss for FY3/2002 was 3.357bn Yen ($25.6mn) - other details NA. • ac - Makoto Bank was renamed Macoto Bank from 1Jan 2002. • ad - Multi-Purpose Bank successfully completed the merger exercise on 1 January 2001 with International Bank Malaysia, Sabah Bank, Sabah Finance, Bolton Finance, Amanah Merchant Bank and Bumiputera Merchant Bankers. The name was changed to Alliance Bank and year end from Dec to March (3/2001 nos are for 15 months vs 12 months for the period before). • ae - Cathay United Bank: Balance Sheet numbers are from Sept 2001 (Dec numbers were NA). • af - Perwira Affi n Bank: Pre-tax loss of RM747.1 million ($196.6mn) - other details NA. • ag - Corporation Bank: Balance Sheet numbers are from 3/2001 as the 3/2002 numbers are NA. • ah - Bangkok Metropolitan Bank: Balance Sheet items as at March 2001• ai - Development Bank of the Philippines: Balance sheet nos are as at June 2002 as more recent nos are not available. • aj -Fukuoka Chuo Bank: Net profi t for FY3/2002 was 0.167bn Yen ($1.3mn) - other details NA. • ak - CITIC Ka Wah Bank announced the completion of the acquisition of HKCB at a consideration of HK$4.2 billion (1.26X book) on 17 January 2002. The two banks will be operated as separate entities with a view to becoming fully integrated by the end of 2002.
Index To The Asian Banker 300
THE ASIAN BANKER 300
The Asian Banker Journal Special Edition 15
Subscribe to The Asian Banker 300Plus
Today !
Cancellation Policy: • No refunds will be given for any portion of a cancelled subscription whatsoever once the CD-ROM has been sent to the subscriber.
Send in your subscription:By Fax: (65) 6295 4600, Tel: (65) 6295 7300 or By post to: TAB International Pte Ltd, 7500A Beach Road, #06-301 The Plaza, Singapore 199591(w.e.f. 1st October: By Fax: (65) 6236 6530, Tel: (65) 6236 6500 or By post to: TAB International Pte Ltd, 10 Hoe Chiang Road, #14-06 Keppel Towers, Singapore 089315)
√ Yes! I wish to subscribe to The Asian Banker 300Plus at the special offer price of US$480 p.a. before 31st October 2002 (Normal price US$620 p.a.)
I will receive:• A CD-ROM version of the full 2002 datafi le• Password access to the datafi le online and constant updates at www.theasianbanker.com• Analyst support for developing your own benchmarks and paradigms from this Data• An annual subscription to the Asian Banker Journal (worth US$240)
MY DETAILS
Name:
Designation: Organisation:
Address:
Postal Code: City/Country:
Direct Tel: Fax: E-mail:
I WISH TO PAY (PLEASE COMPLETE THIS SECTION)
No of copies (at US$480 per copy): Amount:
(add 3% GST for Singapore subscribers)
❏ American Express ❏ Diners Club ❏ MasterCard ❏ Visa
Card No.: Expiry Date:
❏ By a non-negotiable cheque made payable to: “TAB International Pte Ltd”
Cheque No.: Issuing Bank:
❏ Please invoice us
Signature: Date: (As in credit card, if applicable.)

THE ASIAN BANKER 300
16 The Asian Banker Journal Special Edition
2001Rank
Assets$million Change
Deposits$million Change Rank
Commercial Banks Country Loans$million Change Rank
123456789
1011121314151617181920212223242526272829303132333435363738394041424344454647484950
Mizuho Financial GroupSumitomo Mitsui Banking CorporationMitsubishi Tokyo Financial GroupUFJ HoldingsIndustrial and Commercial Bank of ChinaNorinchukin BankBank of China GroupDaiwa Bank HoldingsChina Construction BankAgricultural Bank of ChinaHSBCAsahi BankNational Australia BankShinkin Central BankKookmin BankSumitomo Trust & BankingCommonwealth Bank of AustraliaShoko Chukin BankChuo Mitsui Trust & BankingBank of China (HK)Westpac Banking CorpAustralia & New Zealand Banking GroupBank of CommunicationsDBS Group HoldingBank of YokohamaState Bank of IndiaBank of TaiwanHanvit (Woori) BankChiba Bank Shizuoka BankShinsei BankUnited Overseas BankHang Seng BankJoyo BankBank of FukuokaTaiwan Cooperative BankAozora BankOversea-Chinese Banking CorporationHokuriku BankIndustrial Bank of KoreaHiroshima BankNorth Pacific Bank Hachijuni BankGunma BankLand Bank of TaiwanChohung BankKorea Exchange BankChugoku BankAshikaga Bank77 Bank
1,153,823.6823,585.5758,706.9608,303.9521,084.5458,874.9405,664.4342,782.4333,662.4262,280.6223,491.4195,899.8191,555.1188,125.9142,867.9127,375.5117,785.0106,854.5
99,223.198,275.797,047.894,823.185,468.781,740.981,141.768,903.266,196.363,381.161,885.261,786.361,534.261,222.160,887.352,320.651,374.351,139.547,086.546,045.545,532.945,349.743,788.543,672.143,628.943,557.443,026.142,769.842,348.641,226.040,321.339,419.6
565,269.6495,546.6456,820.0387,327.2432,074.3278,933.1298,930.0257,908.9273,394.2217,993.9176,731.8155,865.2
97,620.4129,451.2104,185.6
62,313.659,991.318,218.557,488.216,245.046,234.053,611.157,344.957,686.070,759.558,201.954,593.646,147.655,448.453,370.414,220.440,224.653,190.146,722.344,194.140,106.513,565.229,663.440,131.522,736.737,923.639,598.139,470.138,389.938,763.030,674.628,108.436,847.037,166.235,853.4
-7.4%-9.4%6.4%
na8.7%
16.9%-2.3%
na9.2%
-4.5%-1.1%
-17.6%9.0%2.9%
16.2%-6.5%5.6%0.7%
-6.3%na
13.3%7.6%
12.6%36.0%1.0%5.5%4.3%
11.0%3.0%
-1.4%-14.9%70.9%-5.2%-3.1%2.5%7.0%
-26.5%42.7%-1.4%10.9%2.3%3.5%
-1.7%1.0%3.2%
10.7%11.2%4.3%
-4.7%-0.3%
10.1%3.1%
-0.3%na
10.2%9.2%3.6%
na12.7%13.4%-1.3%8.1%3.2%
-2.0%9.3%5.9%4.2%6.8%0.2%
na7.9%4.2%
16.4%32.3%1.5%
15.9%5.8%
15.6%4.0%1.8%
-13.9%71.5%-3.6%-0.6%-0.4%10.2%
-32.6%58.6%-2.5%14.2%2.7%1.8%
-0.9%1.8%5.3%
14.6%13.6%3.7%
-3.5%2.4%
123547698
101112151314171884219529252220161924302326
1063227283134
11147336839353638374452414042
645,063.7485,325.5374,125.3350,957.9320,931.9173,905.0191,504.1228,924.8181,725.7174,203.0
86,506.1131,464.7106,224.8
71,509.481,671.268,037.769,552.775,640.356,551.039,512.263,312.063,212.939,721.538,170.059,040.125,454.036,468.435,935.343,853.438,747.836,616.634,691.728,973.032,638.037,027.832,581.723,591.128,553.133,725.727,142.429,465.528,281.829,399.728,026.629,545.626,351.026,778.820,627.130,376.324,346.1
-8.3%-2.9%2.3%
na10.2%5.8%5.4%
na8.6%
-9.2%3.4%
-16.4%6.3%
44.9%9.4%8.9%2.9%
-3.4%-3.8%-5.4%13.6%6.3%
12.6%30.4%-2.9%8.3%
-7.9%11.7%0.2%
-1.4%-22.4%102.5%
1.8%-4.1%2.1%
-0.8%-24.8%50.0%-0.8%12.1%-1.9%-3.2%0.8%2.3%
-5.3%8.5%9.8%
-8.2%-6.7%0.4%
1234510768913111216141817152225192024272148303123262932403428355141334438423943374745593649
JapanJapanJapanJapanChinaJapanChinaJapanChinaChina
Hong KongJapan
AustraliaJapan
South KoreaJapan
AustraliaJapanJapan
Hong KongAustraliaAustralia
ChinaSingapore
JapanIndia
TaiwanSouth Korea
JapanJapanJapan
SingaporeHong Kong
JapanJapan
TaiwanJapan
SingaporeJapan
South KoreaJapanJapanJapanJapan
TaiwanSouth KoreaSouth Korea
JapanJapanJapan
Generic footnotes: • Except otherwise stated, data pertains to fiscal years ended between June 2001 and March 2002. Asterisk (*) in Notes column denotes data from the 2000 accounting period given that the 2001 financials (or full financials) have yet to be released at the time of compilation of TAB300 (cut-off date up till end-June 2002). • Notes - Numbers (3,6,9,12) refer to the Fiscal Year’s last month (March, June, Sept, Dec). PL, UL, S, and ULS denote Publicly listed, Unlisted, State-Controlled and Unlisted state-controlled respectively. • All values are quoted in US dollars and all % changes are calculated using local currencies. • Conversion rates (unit of currency per US$) as at 31st Dec 2001: Australia, A$1.9562 per US$1; Bangladesh, 59.219 Taka; China, RMB8.2867; Hong Kong, HK$7.7978; India, 48.343 Rupee; Indonesia, 10,505 Rupiah; Japan, 131.14 Yen; Malaysia, 3.8024 Ringgit; New Zealand, NZ$2.4155; Pakistan, 63.002 Rupee; Singapore, $1.8509; South Korea, 1,323.6 Won; Sri Lanka, 93.181 Rupee; Taiwan, NT$35.0915; Thailand, 44.193 Baht; and Vietnam, 15,797 Dong.�• Assets are the sum of cash & bank balances, marketable securities & other short-term investments, net loans & mortgages, long-term investments, fixed assets and other assets.
The Region’s Largest Banks
1TO
50

THE ASIAN BANKER 300
The Asian Banker Journal Special Edition 17
DirectoryIndex & Bank-specifi c Notes
12Largest Banks in Greater China
28Largest Banks in ASEAN
29Perfomance Rank-ings
30Country Capsules
32
BLEEDING: 8 of the top 10 Japanese banks are in the red with largest individual losses ever
Shareholders' Equity$million Rank
Net Profit$million Change Rank
Net Interest Income$million Change Rank
Profit as % ofAssets Equity
Loans as %of deposits
Equity as %of Assets
NotesKey below &
in index
2001Rank
1234567891011121314151617181920212223242526272829303132333435363738394041424344454647484950
-7,442.8-3,537.3-1,161.5-9,359.6
711.1896.0954.3
-7,106.0623.5
35.83,364.7
-4,516.11,064.8
289.91,122.7-323.9
1,225.8-97.7
-2,255.7355.0972.8955.9868.9539.8156.0503.0273.4538.6
-203.958.8
466.8499.8
1,297.0-244.8140.2112.0760.2424.1
-1,034.8371.8
-316.753.3
-116.4-161.7160.1397.0171.6
43.9-976.8175.9
36,079.222,210.026,154.019,832.123,048.316,925.326,357.9
9,829.614,499.715,953.210,660.6
5,699.412,042.2
6,308.96,724.15,030.19,402.4
873.53,933.66,690.34,961.15,393.64,580.97,309.53,413.03,258.15,344.52,212.52,511.54,246.54,754.77,051.95,780.02,806.22,243.51,565.13,505.34,749.51,367.43,831.81,438.71,325.12,671.32,156.31,600.41,936.81,607.92,339.5
991.32,293.3
P-LP-LL-Lna
16%44%2%na
-31%L-P1%L-L
-36%-12%19%P-L
-11%L-LP-L
-47%11%7%
255%-28%-24%52%-9%L-P
-304%-58%-32%
1%1%
-484%L-P
259%88909%
-7%P-L
15%P-L
14%P-LP-L
-32%429%
-147%2%P-L
101%
2982952932991398
29714
1241
2965
264
2853
2622942367
101547172816
2789319182
28152611220
29222
28499
266273462142
11529140
1536472
1298
11201018162313
1142917242127143334224739282515193546623226793172813748615160429743
-0.6%-0.4%-0.2%-1.5%0.1%0.2%0.2%
-2.1%0.2%0.0%1.5%
-2.3%0.6%0.2%0.8%
-0.3%1.0%
-0.1%-2.3%0.4%1.0%1.0%1.0%0.7%0.2%0.7%0.4%0.8%
-0.3%0.1%0.8%0.8%2.1%
-0.5%0.3%0.2%1.6%0.9%
-2.3%0.8%
-0.7%0.1%
-0.3%-0.4%0.4%0.9%0.4%0.1%
-2.4%0.4%
-20.6%-15.9%
-4.4%-47.2%
3.1%5.3%3.6%
-72.3%4.3%0.2%
31.6%-79.2%
8.8%4.6%
16.7%-6.4%13.0%
-11.2%-57.3%
5.3%19.6%17.7%19.0%
8.9%4.6%
15.4%5.1%
24.3%-8.1%1.4%9.8%
10.8%22.4%-8.7%6.3%7.2%
21.7%9.4%
-75.7%9.7%
-22.0%4.0%
-4.4%-7.5%10.0%20.5%10.7%
1.9%-98.5%
7.7%
114.1%97.9%81.9%90.6%74.3%62.3%64.1%88.8%66.5%79.9%48.9%84.3%
108.8%55.2%78.4%
109.2%115.9%415.2%
98.4%243.2%136.9%117.9%
69.3%66.2%83.4%43.7%66.8%77.9%79.1%72.6%
257.5%86.2%54.5%69.9%83.8%81.2%
173.9%96.3%84.0%
119.4%77.7%71.4%74.5%73.0%76.2%85.9%95.3%56.0%81.7%67.9%
3.1%2.7%3.4%3.3%4.4%3.7%6.5%2.9%4.3%6.1%4.8%2.9%6.3%3.4%4.7%3.9%8.0%0.8%4.0%6.8%5.1%5.7%5.4%8.9%4.2%4.7%8.1%3.5%4.1%6.9%7.7%
11.5%9.5%5.4%4.4%3.1%7.4%
10.3%3.0%8.4%3.3%3.0%6.1%5.0%3.7%4.5%3.8%5.7%2.5%5.8%
L/3/aL/3/bL/3/cL/3/d
ULS/12L/*/3
ULS/12L/3/e
ULS/12ULS/*/12
L/12L/3/hL/9L/3
L/12/gL/3L/6
UL/*/3UL/3
UL/12/hL/9L/9
UL/12L/12L/3
LS/3ULS/12L/12/iL/3L/3L/3
L/12L/12L/3L/3
ULS/6L/*/3/jL/12L/3
LS/12L/3L/3L/3L/3
UL/12L/12L/12L/3L/3L/3
10,181.511,055.2
8,427.17,965.35,110.2
744.46,146.04,973.76,676.44,253.75,036.52,946.93,341.7
700.02,917.0
799.52,287.11,007.7
729.51,922.02,096.91,959.4
na1,219.31,262.91,878.5
1.21,449.0
986.3865.6674.2790.3
1,507.2812.4799.5653.0398.3771.6695.4792.1705.6652.8702.3703.0695.8886.3743.8546.6639.9654.4
11.8%9.5%
13.7%na
1.2%-58.1%-4.4%
na10.4%
-11.9%4.3%1.2%
15.4%-9.1%10.3%47.1%7.7%
-13.5%7.1%
-6.6%10.5%0.8%
na10.7%1.8%8.3%
49.8%15.8%-1.9%-1.8%3.0%
21.2%-0.3%-0.5%-2.1%
-19.3%330.4%11.0%1.0%2.9%0.1%4.3%
-4.0%-1.6%
-29.9%11.1%-8.4%1.1%
-8.1%-3.6%
21347
34695
108
1211401329142336
1561516-
212017
2671924264531182728488332423037493938412535575147
• Deposits are demand, savings, time and other deposits received from customers. • Loans are commercial, consumer and other loans lent out to customers. • Net interest income is interest and investment income net of interest expenses. • Net profit is recorded after taxes and provisions for loan losses. • Shareholders’ Equity includes preferred and common equity, minority interest, disclosed reserves and retained earnings. • Profit as a % of Assets is return on assets; Profit as a % of Equity, return on equity; Loans as a % of Deposits, loan-to-deposit ratio; Equity as a % of Assets, equty-to-assets ratio. • In the change in Net Profit column, P-L denotes Net profit from the previous period (2000) deteriorating to losses (in 2001), L-P losses to profits; L-L losses to losses. • na - data not available. Data for rows with incomplete information was primarily complied from several media sources given that financials could not be sourced from the organisations. • All data in this table is collated and updated to the best of our ability and knowledge. We provide this service with no warranty whatsoever as to the currency, accuracy, or applicability or the data for any purposes.

THE ASIAN BANKER 300
18 The Asian Banker Journal Special Edition
2001Rank
Assets$million Change
Deposits$million Change Rank
Commercial Banks Country Loans$million Change Rank
51525354555657585960616263646566676869707172737475767778798081828384858687888990919293949596979899
100
Malayan BankingFirst Commercial BankCITIC Industrial BankShinhan BankHana BankHua Nan Commercial BankBank of KyotoYamaguchi BankKinki Osaka BankChang Hwa Commercial BankChina Everbright BankNishi-Nippon BankIyo BankChina Merchants BankNanto BankDaishi BankJuroku BankShiga BankBangkok BankHyakugo BankSan-In Godo BankHokkaido BankTaiwan Business BankHyakujushi BankSt George BankIntl Commercial Bank of ChinaChinatrust Commercial BankOgaki Kyoritsu BankHigo BankBank MandiriBank of East AsiaGuangdong Development BankKagoshima BankHokkoku BankKrung Thai BankMinato BankKorAm BankKiyo BankToho BankICICI Suruga BankFukuoka City BankShanghai Pudong Development BankMusashino BankBank of NagoyaUnited World Chinese Com. BankKorea First BankKeiyo BankShikoku BankOita Bank
37,054.836,366.236,214.735,895.635,823.235,729.634,848.234,532.933,446.733,149.532,027.832,004.131,431.331,162.031,119.030,909.530,159.829,671.028,256.727,755.227,544.827,497.427,017.826,906.425,970.825,671.125,529.925,271.525,128.624,968.223,309.823,073.323,027.122,651.422,101.722,069.422,050.321,734.921,700.621,535.721,441.521,309.120,960.220,727.820,456.820,154.920,015.119,989.019,980.318,809.4
25,374.729,811.329,456.821,396.026,860.828,750.030,165.230,967.729,077.920,326.121,595.027,247.028,198.425,683.028,016.927,506.127,362.026,681.324,255.025,122.023,861.824,340.623,101.224,108.518,167.415,088.319,123.922,834.622,664.418,129.118,058.515,509.620,130.920,687.119,610.520,173.612,369.120,192.819,975.4
6,637.020,320.817,992.817,859.919,010.118,586.216,486.413,448.218,262.118,062.817,002.4
10.9%3.7%
27.9%20.2%9.7%6.3%
11.9%0.1%
-1.0%5.7%
30.0%-9.0%2.3%
24.7%1.4%2.0%
-1.5%1.6%1.0%3.1%0.2%
-3.1%7.7%2.2%2.4%4.6%
21.4%1.5%2.1%3.5%1.4%
28.5%6.4%5.2%
-1.4%-0.4%1.8%
-10.2%0.4%
427.5%-3.4%-3.7%33.9%3.2%
-1.6%7.0%4.1%0.3%1.6%1.0%
17.9%6.9%
29.9%35.3%17.0%7.7%4.9%0.9%
-5.6%9.0%
57.7%-9.2%4.2%
29.9%1.0%2.6%
-1.1%2.7%3.7%5.0%1.0%
-5.3%7.9%2.1%1.4%
10.2%22.5%2.9%2.3%
16.6%1.5%
34.8%6.8%6.4%2.7%
-0.6%-11.9%-3.8%0.6%
125.9%-2.3%
-10.0%39.5%3.7%
na8.8%5.3%1.4%1.5%2.7%
60464871575045434973705651595354555863616562666485
10080676986889977727976
1227578
181748990818294
116838792
26,648.723,115.216,617.022,137.821,846.423,428.820,431.422,982.023,706.816,643.913,695.822,962.620,587.216,916.918,023.018,135.420,812.617,624.616,250.115,299.616,372.319,127.017,532.919,188.920,293.913,463.0
na17,434.814,630.4
4,587.014,087.511,043.014,562.515,315.015,189.616,004.213,432.414,369.513,482.3
9,729.415,290.716,147.8
9,140.113,618.3
na12,194.711,817.014,885.712,952.111,998.0
18.1%0.5%
14.1%27.6%14.7%8.4%0.3%1.4%
-0.1%-0.8%21.4%
-12.4%1.2%
27.7%-1.9%4.0%
-1.1%-2.1%-8.9%-1.3%0.6%
-4.8%-2.8%0.9%0.6%
-5.0%na
3.6%4.6%
12.0%4.0%
43.5%5.8%2.4%
-3.6%-1.7%8.6%
-3.6%-1.4%
577.7%-4.8%-7.5%8.4%1.3%
na0.4%9.3%
-1.3%-0.5%-1.3%
4653725657526154507186556070666558677478736468636289-
69821758510383778076908488116797512587-
9599819297
MalaysiaTaiwanChina
South KoreaSouth Korea
TaiwanJapanJapanJapan
TaiwanChinaJapanJapanChinaJapanJapanJapanJapan
ThailandJapanJapanJapan
TaiwanJapan
AustraliaTaiwanTaiwanJapanJapan
IndonesiaHong Kong
ChinaJapanJapan
ThailandJapan
South KoreaJapanJapan
IndiaJapanJapanChinaJapanJapan
TaiwanSouth Korea
JapanJapanJapan
Generic footnotes: • Except otherwise stated, data pertains to fiscal years ended between June 2001 and March 2002. Asterisk (*) in Notes column denotes data from the 2000 accounting period given that the 2001 financials (or full financials) have yet to be released at the time of compilation of TAB300 (cut-off date up till end-June 2002). • Notes - Numbers (3,6,9,12) refer to the Fiscal Year’s last month (March, June, Sept, Dec). PL, UL, S, and ULS denote Publicly listed, Unlisted, State-Controlled and Unlisted state-controlled respectively. • All values are quoted in US dollars and all % changes are calculated using local currencies. • Conversion rates (unit of currency per US$) as at 31st Dec 2001: Australia, A$1.9562 per US$1; Bangladesh, 59.219 Taka; China, RMB8.2867; Hong Kong, HK$7.7978; India, 48.343 Rupee; Indonesia, 10,505 Rupiah; Japan, 131.14 Yen; Malaysia, 3.8024 Ringgit; New Zealand, NZ$2.4155; Pakistan, 63.002 Rupee; Singapore, $1.8509; South Korea, 1,323.6 Won; Sri Lanka, 93.181 Rupee; Taiwan, NT$35.0915; Thailand, 44.193 Baht; and Vietnam, 15,797 Dong.�• Assets are the sum of cash & bank balances, marketable securities & other short-term investments, net loans & mortgages, long-term investments, fixed assets and other assets.
The Region’s Largest Banks
51TO
100

THE ASIAN BANKER 300
The Asian Banker Journal Special Edition 19
MONEY-SPINNER: HSBC (No.11) tops the list as Asia’s most profi table fi nancial institution
DirectoryIndex & Bank-specifi c Notes
12Largest Banks in Greater China
28Largest Banks in ASEAN
29Perfomance Rank-ings
30Country Capsules
32
Shareholders' Equity$million Rank
Net Profit$million Change Rank
Net Interest Income$million Change Rank
Profit as % ofAssets Equity
Loans as %of deposits
Equity as %of Assets
NotesKey below &
in index
2001Rank
51525354555657585960616263646566676869707172737475767778798081828384858687888990919293949596979899100
220.889.8
195.5281.7243.1113.2
35.717.3
-164.144.121.2
-428.545.2
166.0-213.0
-53.019.416.7
146.620.925.834.3
-347.912.6
207.0124.7218.4
18.113.3
261.4205.2
33.246.023.2
-99.9-55.6147.3
-505.614.953.4
-174.5-143.3128.1-71.7-15.6149.8169.2
-197.019.9
9.6
2,721.42,397.81,228.82,287.51,554.21,673.72,531.42,281.7
865.01,761.71,512.6
958.52,017.2
592.8888.4
1,405.11,513.61,453.3
977.51,450.31,627.91,198.01,140.31,447.61,853.61,723.42,108.5
991.41,473.31,025.92,340.1
635.71,438.21,379.41,436.6
578.5942.1523.5852.0
1,365.0878.3472.6852.8747.1175.4
1,856.71,153.7
892.3897.8929.2
-38%-24%75%
230%1711%
-17%-16%-66%
L-L-17%-35%
L-L-18%93%P-LP-L
-25%-3%L-P
-28%-57%-27%
P-L-31%14%-4%6%
-11%48%
132%-15%13%5%
-132%P-LP-LL-PP-LL-P
60%P-LL-L
33%L-LP-L
-23%-27%
P-L21%8%
327337273060
12517027411415628811144
27924816117251
158142126286183345633
1641822935
13010915126324950
28917898
27527154
2542354943
277160191
3640844463573845
1165466
10050
15911276656999705986897153554996679241
154737874
16310317011880
1131811171292635288
111109106
0.6%0.2%0.5%0.8%0.7%0.3%0.1%0.1%
-0.5%0.1%0.1%
-1.3%0.1%0.5%
-0.7%-0.2%0.1%0.1%0.5%0.1%0.1%0.1%
-1.3%0.0%0.8%0.5%0.9%0.1%0.1%1.0%0.9%0.1%0.2%0.1%
-0.5%-0.3%0.7%
-2.3%0.1%0.2%
-0.8%-0.7%0.6%
-0.3%-0.1%0.7%0.8%
-1.0%0.1%0.1%
8.1%3.7%
15.9%12.3%15.6%
6.8%1.4%0.8%
-19.0%2.5%1.4%
-44.7%2.2%
28.0%-24.0%
-3.8%1.3%1.1%
15.0%1.4%1.6%2.9%
-30.5%0.9%
11.2%7.2%
10.4%1.8%0.9%
25.5%8.8%5.2%3.2%1.7%
-7.0%-9.6%15.6%
-96.6%1.8%3.9%
-19.9%-30.3%15.0%-9.6%-8.9%8.1%
14.7%-22.1%
2.2%1.0%
105.0%77.5%56.4%
103.5%81.3%81.5%67.7%74.2%81.5%81.9%63.4%84.3%73.0%65.9%64.3%65.9%76.1%66.1%67.0%60.9%68.6%78.6%75.9%79.6%
111.7%89.2%
na76.4%64.6%25.3%78.0%71.2%72.3%74.0%77.5%79.3%
108.6%71.2%67.5%
146.6%75.2%89.7%51.2%71.6%
na74.0%87.9%81.5%71.7%70.6%
7.3%6.6%3.4%6.4%4.3%4.7%7.3%6.6%2.6%5.3%4.7%3.0%6.4%1.9%2.9%4.5%5.0%4.9%3.5%5.2%5.9%4.4%4.2%5.4%7.1%6.7%8.3%3.9%5.9%4.1%
10.0%2.8%6.2%6.1%6.5%2.6%4.3%2.4%3.9%6.3%4.1%2.2%4.1%3.6%0.9%9.2%5.8%4.5%4.5%4.9%
L/6/kL/12
ULS/12L/*/12/l
L/12UL/12
L/3L/3L/3
L/12ULS/12
L/3L/3
L/12/mL/3L/3L/3L/3
L/12L/3L/3L/3
L/12L/3L/9
L/12L/12L/3L/3
LS/12/nL/12
ULS/12L/3L/3
LS/12L/3
L/12L/3L/3L/3L/3L/3
L/12L/3L/3
L/12L/12L/3L/3L/3
1,062.5640.5
na672.3622.0
na361.8493.0625.7452.8305.0586.5521.8685.6465.6471.8499.5429.8536.3400.6482.3447.0394.6439.8631.3449.7765.1389.3386.2676.7510.1272.4369.3350.0440.8385.0401.6356.4369.1122.7420.9452.1273.7332.5
na457.1393.6413.6343.7325.8
5.4%2.3%
na8.7%
15.4%na
-8.3%-3.6%12.1%-1.9%13.4%-3.9%-1.4%28.7%-4.4%0.0%2.5%0.5%3.0%
-4.6%-2.5%-5.1%-5.8%-1.0%5.4%
-2.4%27.5%0.6%0.7%
11.0%7.6%
68.4%-0.8%-5.4%42.2%8.1%
17.9%-1.1%-5.6%46.6%6.3%6.2%
37.4%1.5%
na59.3%-2.8%-2.0%-1.7%-5.6%
2250-
4654-
95625371
1115559436866617758826474857652733387884460
12593997589809694
1957872
124105
-698679
101106
• Deposits are demand, savings, time and other deposits received from customers. • Loans are commercial, consumer and other loans lent out to customers. • Net interest income is interest and investment income net of interest expenses. • Net profit is recorded after taxes and provisions for loan losses. • Shareholders’ Equity includes preferred and common equity, minority interest, disclosed reserves and retained earnings. • Profit as a % of Assets is return on assets; Profit as a % of Equity, return on equity; Loans as a % of Deposits, loan-to-deposit ratio; Equity as a % of Assets, equty-to-assets ratio. • In the change in Net Profit column, P-L denotes Net profit from the previous period (2000) deteriorating to losses (in 2001), L-P losses to profits; L-L losses to losses. • na - data not available. Data for rows with incomplete information was primarily complied from several media sources given that financials could not be sourced from the organisations. • All data in this table is collated and updated to the best of our ability and knowledge. We provide this service with no warranty whatsoever as to the currency, accuracy, or applicability or the data for any purposes.

THE ASIAN BANKER 300
20 The Asian Banker Journal Special Edition
2001Rank
Assets$million Change
Deposits$million Change Rank
Commercial Banks Country Loans$million Change Rank
101102103104105106107108109110111112113114115116117118119120121122123124125126127128129130131132133134135136137138139140141142143144145146147148149150
Tokyo Tomin BankYamanashi Chuo BankThai Farmers BankAwa BankDao Heng BankBank of IwateAkita BankAichi BankChina Minsheng Banking CorpBumiputra-Commerce BankEighteenth BankSeoulbankSiam Commercial BankAomori BankFukui BankTaipeibankWestpac Banking Corporation (NZ)Chiao Tung BankBank of New ZealandHiroshima-Sogo BankChiba Kogyo BankFarmers Bank of ChinaFujian Industrial BankSuncorp-MetwayCanara Bank National Bank of NZBank of SagaTochigi BankMichinoku BankHokuetsu BankMacquarie BankPublic BankBank of IkedaRHB Bank BerhadYamagata BankTowa BankPunjab National BankBank of BarodaShinwa BankHigashi-Nippon BankMiyazaki BankDaisan BankEhime BankBank Negara IndonesiaChukyo BankBank of ShanghaiHua Xia BankSenshu BankDaegu BankBank of Western Australia (BankWest)
18,256.118,107.517,527.617,397.417,335.117,330.717,159.316,766.216,700.716,628.516,595.216,418.416,361.916,320.316,275.316,208.215,805.315,701.515,668.415,377.215,371.015,329.615,193.015,162.614,937.314,921.514,845.114,833.814,649.414,487.314,235.714,002.313,718.413,669.313,642.113,484.513,136.413,098.513,012.312,843.912,693.712,537.712,112.611,733.711,665.811,624.011,477.011,469.611,388.911,339.0
16,047.216,647.115,037.017,141.911,936.815,611.715,705.015,034.212,622.611,772.114,505.511,707.413,712.115,064.314,910.213,624.3
9,449.19,059.69,705.2
13,646.613,496.311,923.110,366.0
8,643.313,244.9
7,424.113,510.913,918.913,327.513,470.8
3,208.710,462.4
8,862.99,633.8
12,429.813,518.913,264.210,493.911,725.111,876.011,638.911,145.710,860.5
8,838.410,683.1
9,163.18,268.69,604.78,300.66,898.4
0.3%1.0%0.9%
-8.1%-4.8%4.0%
-1.0%-0.4%97.8%-3.1%4.8%
13.3%0.4%1.8%
-1.2%-1.5%9.0%
-1.2%7.2%
-2.3%-1.5%0.8%
47.0%13.1%8.6%
16.0%-1.6%2.9%1.4%
-3.4%19.1%17.7%2.7%2.6%3.4%1.6%0.0%
121.2%1.0%0.5%1.2%2.7%2.9%5.2%
-1.6%25.9%55.6%1.9%
13.8%10.5%
-3.3%1.5%
-0.1%1.3%
-8.7%0.6%
-0.3%0.5%
98.4%0.3%5.7%
20.4%1.3%1.9%2.8%
-3.9%24.4%1.0%
21.1%-3.0%-1.5%0.8%
68.0%16.5%8.4%
16.2%2.6%4.3%1.5%
-2.4%-3.7%17.4%
-23.4%3.6%4.1%7.0%
14.2%5.1%2.1%0.5%1.2%0.2%1.8%
-15.1%-1.6%21.3%47.9%-2.8%18.5%9.5%
9693
10291
1249897
103120127105129108101104110142148139109114125136152119171113107117115251135149140121112118134128126130131132150133145157141156176
13,032.010,794.010,736.7
1,862.39,179.68,376.89,944.3
na8,876.9
10,852.911,340.9
9,195.610,407.610,902.011,269.310,514.512,779.211,612.412,131.611,860.110,766.010,730.7
9,038.610,298.5
6,852.512,922.8
9,682.79,752.6
10,328.09,269.23,746.58,077.39,093.49,530.17,747.49,525.67,109.42,413.39,084.82,452.48,525.4
na9,158.72,737.69,036.24,954.95,345.88,294.45,960.09,613.6
-3.3%3.5%
-4.4%-85.3%
9.6%0.2%0.9%
na96.0%9.3%0.7%
44.7%-6.4%4.2%1.7%
-8.8%16.3%1.0%5.8%
-1.4%1.2%0.8%
110.0%11.5%19.0%20.6%-1.6%-0.4%0.3%
-4.7%31.6%25.9%-1.0%8.7%0.5%1.9%
22.6%13.2%-1.5%
-76.7%1.2%
na1.5%1.3%
-0.8%26.8%53.2%1.5%
14.6%13.1%
91106108252123133114
-13110510112211110410211094100969810710912811314493117115112121200135126119139120143237127234132
-124227129169165134155118
JapanJapan
ThailandJapan
Hong KongJapanJapanJapanChina
MalaysiaJapan
South KoreaThailand
JapanJapan
TaiwanNew Zealand
TaiwanNew Zealand
JapanJapan
TaiwanChina
AustraliaIndia
New ZealandJapanJapanJapanJapan
AustraliaMalaysia
JapanMalaysia
JapanJapan
IndiaIndia
JapanJapanJapanJapanJapan
IndonesiaJapanChinaChinaJapan
South KoreaAustralia
Generic footnotes: • Except otherwise stated, data pertains to fiscal years ended between June 2001 and March 2002. Asterisk (*) in Notes column denotes data from the 2000 accounting period given that the 2001 financials (or full financials) have yet to be released at the time of compilation of TAB300 (cut-off date up till end-June 2002). • Notes - Numbers (3,6,9,12) refer to the Fiscal Year’s last month (March, June, Sept, Dec). PL, UL, S, and ULS denote Publicly listed, Unlisted, State-Controlled and Unlisted state-controlled respectively. • All values are quoted in US dollars and all % changes are calculated using local currencies. • Conversion rates (unit of currency per US$) as at 31st Dec 2001: Australia, A$1.9562 per US$1; Bangladesh, 59.219 Taka; China, RMB8.2867; Hong Kong, HK$7.7978; India, 48.343 Rupee; Indonesia, 10,505 Rupiah; Japan, 131.14 Yen; Malaysia, 3.8024 Ringgit; New Zealand, NZ$2.4155; Pakistan, 63.002 Rupee; Singapore, $1.8509; South Korea, 1,323.6 Won; Sri Lanka, 93.181 Rupee; Taiwan, NT$35.0915; Thailand, 44.193 Baht; and Vietnam, 15,797 Dong.�• Assets are the sum of cash & bank balances, marketable securities & other short-term investments, net loans & mortgages, long-term investments, fixed assets and other assets.
Generic footnotes: • Except otherwise stated, data pertains to fiscal years ended between June 2001 and March 2002. Asterisk (*) in Notes column denotes data from the 2000 accounting period given that the 2001 financials (or full financials) have yet to be released at the time of compilation of TAB300 (cut-off date up till end-June 2002). • Notes - Numbers (3,6,9,12) refer to the Fiscal Year’s last month (March, June, Sept, Dec). PL, UL, S, and ULS denote Publicly listed, Unlisted, State-Controlled and Unlisted state-controlled respectively. • All values are quoted in US dollars and all % changes are calculated using local currencies. • Conversion rates (unit of currency per US$) as at 31st Dec 2001: Australia, A$1.9562 per US$1; Bangladesh, 59.219 Taka; China, RMB8.2867; Hong Kong, HK$7.7978; India, 48.343 Rupee; Indonesia, 10,505 Rupiah; Japan, 131.14 Yen; Malaysia, 3.8024 Ringgit; New Zealand, NZ$2.4155; Pakistan, 63.002 Rupee; Singapore, $1.8509; South Korea, 1,323.6 Won; Sri Lanka, 93.181 Rupee; Taiwan, NT$35.0915; Thailand, 44.193 Baht; and Vietnam, 15,797 Dong.�• Assets are the sum of cash & bank balances, marketable securities & other short-term investments, net loans & mortgages, long-term investments, fixed assets and other assets.
The Region’s Largest Banks
101TO
150

THE ASIAN BANKER 300
The Asian Banker Journal Special Edition 21
EXTRA-ORDINARY DRAG: Exposure to failed businesses muted bottomlines for Australians banks
DirectoryIndex & Bank-specifi c Notes
12Largest Banks in Greater China
28Largest Banks in ASEAN
29Perfomance Rank-ings
30Country Capsules
32
Shareholders' Equity$million Rank
Net Profit$million Change Rank
Net Interest Income$million Change Rank
Profit as % ofAssets Equity
Loans as %of deposits
Equity as %of Assets
NotesKey below &
in index
2001Rank
101102103104105106107108109110111112113114115116117118119120121122123124125126127128129130131132133134135136137138139140141142143144145146147148149150
-40.126.922.816.5
229.514.8
-73.15.0
78.046.6
5.576.6
9.210.916.482.7
192.6130.8182.2
28.522.111.890.7
201.9153.4172.2
-127.0-116.2
17.8-83.7123.7
51.9-182.9
91.424.7
-158.6116.3
56.8-20.017.9
3.0-122.9
2.880.7
-226.9101.8
91.151.023.370.7
479.11,002.6
620.9989.9
1,721.2740.7904.5895.7685.5
1,078.7995.2517.9
1,422.8669.0677.1
1,281.31,159.31,539.2
741.5666.1730.7715.0724.1
1,388.9718.1901.3685.1601.3723.8457.0560.3
1,654.0386.2
1,225.7800.0496.9665.2694.3650.1646.9657.6413.7537.4728.0488.6675.3409.9391.8447.6543.4
L-L-21%-20%-37%
4%-69%
P-L41%
171%-61%
L-PL-P
-89%-3%L-P
-44%14%
-45%13%
1144%3%
-52%50%18%
160%8%P-LP-L
-27%P-L
15%-11%
P-L-11%-23%
L-L21%
-45%L-LL-PL-PP-L
-72%1%P-L
13%47%L-P
96%2%
24614115217531
17925621079
10820581
19218617676385339
13715418572364841
26926516625857
10127670
1472725895
23716521926822177
2806671
10315083
17994
1559856
1321071101409195
17175
144142828764
13114513313813577
13710814115713618616658
20685
124173146139149151148195169134176143197204187168
-0.2%0.1%0.1%0.1%1.3%0.1%
-0.4%0.0%0.5%0.3%0.0%0.5%0.1%0.1%0.1%0.5%1.2%0.8%1.2%0.2%0.1%0.1%0.6%1.3%1.0%1.2%
-0.9%-0.8%0.1%
-0.6%0.9%0.4%
-1.3%0.7%0.2%
-1.2%0.9%0.4%
-0.2%0.1%0.0%
-1.0%0.0%0.7%
-1.9%0.9%0.8%0.4%0.2%0.6%
-8.4%2.7%3.7%1.7%
13.3%2.0%
-8.1%0.6%
11.4%4.3%0.6%
14.8%0.6%1.6%2.4%6.5%
16.6%8.5%
24.6%4.3%3.0%1.6%
12.5%14.5%21.4%19.1%
-18.5%-19.3%
2.5%-18.3%22.1%
3.1%-47.3%
7.5%3.1%
-31.9%17.5%
8.2%-3.1%2.8%0.4%
-29.7%0.5%
11.1%-46.4%15.1%22.2%13.0%
5.2%13.0%
81.2%64.8%71.4%10.9%76.9%53.7%63.3%
na70.3%92.2%78.2%78.5%75.9%72.4%75.6%77.2%
135.2%128.2%125.0%
86.9%79.8%90.0%87.2%
119.2%51.7%
174.1%71.7%70.1%77.5%68.8%
116.8%77.2%
102.6%98.9%62.3%70.5%53.6%23.0%77.5%20.7%73.2%
na84.3%31.0%84.6%54.1%64.7%86.4%71.8%
139.4%
2.6%5.5%3.5%5.7%9.9%4.3%5.3%5.3%4.1%6.5%6.0%3.2%8.7%4.1%4.2%7.9%7.3%9.8%4.7%4.3%4.8%4.7%4.8%9.2%4.8%6.0%4.6%4.1%4.9%3.2%3.9%
11.8%2.8%9.0%5.9%3.7%5.1%5.3%5.0%5.0%5.2%3.3%4.4%6.2%4.2%5.8%3.6%3.4%3.9%4.8%
L/3L/3
L/12L/3
UL/12/oL/*/3/p
L/3L/3
L/12UL/12
L/3L/12L/12L/3L/3
L/12UL/9L/12
UL/9/qL/3L/3
ULS/12UL/12
L/6LS/3
UL/12L/3L/3L/3L/3L/3
L/12L/3L/6L/3L/3
L/3/rLS/*/3/s
L/3/tL/3L/3L/3L/3
LS/3L/3
ULS/*/12ULS/*/12
L/3L/12L/12
344.3277.3397.7334.3554.8302.5282.6274.7351.0454.6301.8254.8370.8274.3256.8261.9343.3
na311.7325.7282.2150.9
na262.8376.5335.7262.0288.8270.5268.0
87.5126.3210.0351.9144.0248.7474.8400.8251.1239.4224.7228.9238.0
91.9203.7172.9216.8215.6264.3183.7
-2.5%-4.3%14.4%-4.2%37.7%-0.6%-8.4%-5.6%81.0%-2.1%1.4%
-12.9%7.6%2.5%
-3.6%-30.4%-4.2%
na13.2%2.7%3.8%9.9%
na8.2%
-3.3%11.1%-2.9%-1.9%1.4%
-6.7%-2.5%7.2%2.5%1.1%
-38.0%-2.2%12.6%15.9%-1.5%-6.5%-1.6%-3.5%1.3%
19.8%-2.5%21.1%85.1%2.7%
14.1%-9.5%
10012084
10456
1131171229870
11413392
123132131102
-110107118178
-12991
10313011612612723519114697
1841356581
134137142140138227148162143144128159
• Deposits are demand, savings, time and other deposits received from customers. • Loans are commercial, consumer and other loans lent out to customers. • Net interest income is interest and investment income net of interest expenses. • Net profit is recorded after taxes and provisions for loan losses. • Shareholders’ Equity includes preferred and common equity, minority interest, disclosed reserves and retained earnings. • Profit as a % of Assets is return on assets; Profit as a % of Equity, return on equity; Loans as a % of Deposits, loan-to-deposit ratio; Equity as a % of Assets, equty-to-assets ratio. • In the change in Net Profit column, P-L denotes Net profit from the previous period (2000) deteriorating to losses (in 2001), L-P losses to profits; L-L losses to losses. • na - data not available. Data for rows with incomplete information was primarily complied from several media sources given that financials could not be sourced from the organisations. • All data in this table is collated and updated to the best of our ability and knowledge. We provide this service with no warranty whatsoever as to the currency, accuracy, or applicability or the data for any purposes.
• Deposits are demand, savings, time and other deposits received from customers. • Loans are commercial, consumer and other loans lent out to customers. • Net interest income is interest and investment income net of interest expenses. • Net profit is recorded after taxes and provisions for loan losses. • Shareholders’ Equity includes preferred and common equity, minority interest, disclosed reserves and retained earnings. • Profit as a % of Assets is return on assets; Profit as a % of Equity, return on equity; Loans as a % of Deposits, loan-to-deposit ratio; Equity as a % of Assets, equty-to-assets ratio. • In the change in Net Profit column, P-L denotes Net profit from the previous period (2000) deteriorating to losses (in 2001), L-P losses to profits; L-L losses to losses. • na - data not available. Data for rows with incomplete information was primarily complied from several media sources given that financials could not be sourced from the organisations. • All data in this table is collated and updated to the best of our ability and knowledge. We provide this service with no warranty whatsoever as to the currency, accuracy, or applicability or the data for any purposes.

THE ASIAN BANKER 300
22 The Asian Banker Journal Special Edition
2001Rank
Assets$million Change
Deposits$million Change Rank
Commercial Banks Country Loans$million Change Rank
151152153154155156157158159160161162163164165166167168169170171172173174175176177178179180181182183184185186187188189190191192193194195196197198199200
Beijing City Commercial BankANZ Banking Group (NZ)Nanyang Commercial BankBank of The RyukyusCentral Bank of IndiaCentral Trust of ChinaBank of IndiaHong Leong BankShenzhen Development BankKumamoto Family BankShanghai Commercial & Savings BankPusan BankBank Central AsiaMie BankKagawa BankShimizu BankBank of OkinawaShanghai Commercial BankUnion Bank of IndiaMetropolitan Bank and TrustBank of AyudhyaTaiko BankInternational Bank of Taipei Taishin Financial HoldingKita-Nippon BankBank of KansaiHsinchu Intl BankThai Military BankASB Bank – NZWing Lung BankBiwako BankFubon Commercial BankTokushima BankBank SinopacKyushu BankBank of the Philippine IslandsCITIC Ka Wah BankE.Sun Commercial BankBank of Overseas ChineseBank of KochiBank Rakyat IndonesiaWing Hang BankNippon Trust BankSapporo BankIndian Overseas BankKanto BankSiam City BankDah Sing BankEON BankUco Bank
11,319.311,256.511,236.311,016.210,883.410,735.310,446.210,399.610,279.310,186.110,046.110,003.1
9,824.59,805.89,482.59,454.39,420.09,188.99,179.29,108.59,051.29,007.59,002.98,736.38,723.88,711.78,379.18,352.08,330.38,259.48,198.58,010.57,988.07,934.47,929.47,697.37,621.07,576.67,508.07,419.47,253.27,061.26,982.46,862.96,846.26,768.76,763.36,659.76,501.46,491.4
10,221.27,239.19,254.89,228.89,750.64,927.7
12,351.58,197.18,306.29,135.67,631.37,798.38,618.79,075.78,612.48,761.77,999.07,831.88,231.67,102.6
na8,233.17,823.26,694.87,891.18,045.87,717.86,781.67,767.76,503.77,528.66,469.97,336.66,194.37,153.96,127.65,900.16,555.16,744.26,641.15,789.16,179.23,279.66,383.36,401.36,329.65,932.04,817.04,552.85,553.8
25.7%0.9%2.9%2.6%
11.3%13.6%
-15.2%11.8%26.7%-0.2%3.7%9.9%7.3%0.9%
-0.8%1.9%
-0.1%9.5%
13.8%6.5%
na25.1%-0.3%11.1%-1.0%1.8%8.7%9.6%
16.5%-1.6%-6.0%6.4%1.9%
18.5%-7.5%1.1%4.9%
12.5%1.2%0.4%
14.9%1.0%
-11.9%-3.4%9.2%0.7%
15.7%7.9%
38.9%14.8%
29.9%10.2%2.5%4.2%
13.5%-3.8%10.1%7.7%
31.7%0.2%2.8%
11.4%5.2%1.4%0.4%2.2%3.0%
10.8%15.4%5.6%
na27.7%2.3%
20.4%-2.8%2.2%9.9%
12.0%16.7%-0.7%-4.9%
na2.9%9.2%
-9.2%7.1%
-4.7%13.1%4.5%0.7%
18.9%0.3%
76.5%-3.1%14.4%-0.9%12.6%0.2%
46.3%24.7%
137173143144138206123160155146169166153147154151162164159175
-158165179163161168177167183170184172188174190192182178180195189250186185187191212222196
7,747.48,946.44,409.47,849.14,403.45,372.07,924.86,106.66,059.47,941.63,097.25,402.81,309.06,190.37,559.56,250.96,622.63,740.74,423.24,314.97,670.95,744.65,862.85,525.35,581.16,700.15,768.16,170.76,695.73,729.06,126.54,559.65,950.74,650.66,137.63,638.54,191.24,984.34,012.05,530.62,814.44,591.54,436.44,999.72,851.95,011.31,350.03,798.44,572.82,648.9
21.4%0.5%
-5.8%2.7%
13.0%-8.4%19.0%8.9%
120.4%-2.5%
-43.9%18.5%66.5%1.5%
-0.4%0.0%1.6%2.7%
22.2%-4.4%
na15.3%-5.1%8.9%
-2.4%2.9%
11.6%1.1%
12.3%2.5%
-6.0%na
0.3%7.3%0.4%5.0%1.4%4.3%
-17.3%1.7%
21.9%5.6%7.2%
-8.2%9.2%
-2.7%-65.2%-2.0%49.1%27.0%
140130181138182164137153154136216163277149142148147201180183141159157162160145158150146203152177156171151205185168190161225174179167224166274199176230
ChinaNew Zealand
Hong KongJapan
IndiaTaiwan
IndiaMalaysia
ChinaJapan
TaiwanSouth Korea
IndonesiaJapanJapanJapanJapan
Hong KongIndia
PhilippinesThailand
JapanTaiwanTaiwanJapanJapan
TaiwanThailand
New ZealandHong Kong
JapanTaiwanJapan
TaiwanJapan
PhilippinesHong Kong
TaiwanTaiwanJapan
IndonesiaHong Kong
JapanJapan
IndiaJapan
ThailandHong Kong
MalaysiaIndia
Generic footnotes: • Except otherwise stated, data pertains to fiscal years ended between June 2001 and March 2002. Asterisk (*) in Notes column denotes data from the 2000 accounting period given that the 2001 financials (or full financials) have yet to be released at the time of compilation of TAB300 (cut-off date up till end-June 2002). • Notes - Numbers (3,6,9,12) refer to the Fiscal Year’s last month (March, June, Sept, Dec). PL, UL, S, and ULS denote Publicly listed, Unlisted, State-Controlled and Unlisted state-controlled respectively. • All values are quoted in US dollars and all % changes are calculated using local currencies. • Conversion rates (unit of currency per US$) as at 31st Dec 2001: Australia, A$1.9562 per US$1; Bangladesh, 59.219 Taka; China, RMB8.2867; Hong Kong, HK$7.7978; India, 48.343 Rupee; Indonesia, 10,505 Rupiah; Japan, 131.14 Yen; Malaysia, 3.8024 Ringgit; New Zealand, NZ$2.4155; Pakistan, 63.002 Rupee; Singapore, $1.8509; South Korea, 1,323.6 Won; Sri Lanka, 93.181 Rupee; Taiwan, NT$35.0915; Thailand, 44.193 Baht; and Vietnam, 15,797 Dong.�• Assets are the sum of cash & bank balances, marketable securities & other short-term investments, net loans & mortgages, long-term investments, fixed assets and other assets.
The Region’s Largest Banks
151TO
200

THE ASIAN BANKER 300
The Asian Banker Journal Special Edition 23
TURN-AROUND: South Korean banks posted record profi ts after half-decade of losses. NPLs are also at all-time lows
DirectoryIndex & Bank-specifi c Notes
12Largest Banks in Greater China
28Largest Banks in ASEAN
29Perfomance Rank-ings
30Country Capsules
32
Shareholders' Equity$million Rank
Net Profit$million Change Rank
Net Interest Income$million Change Rank
Profit as % ofAssets Equity
Loans as %of deposits
Equity as %of Assets
NotesKey below &
in index
2001Rank
151152153154155156157158159160161162163164165166167168169170171172173174175176177178179180181182183184185186187188189190191192193194195196197198199200
85.7164.4
na39.633.820.2
104.5103.7
45.924.948.939.9
296.98.03.66.7
-95.6126.7
65.040.9
-60.48.3
61.429.5
-33.424.710.516.575.9
108.5-111.2
68.421.044.2
-66.2101.6
79.154.9
-87.48.4
101.3100.1-32.4
5.147.8
5.4839.7113.8
52.834.0
639.6493.5
1,470.1591.6413.0161.6
1,009.5763.3598.8579.3949.6336.0930.3442.9645.2474.2389.6
1,249.2435.8
1,080.4na
395.4818.7798.2385.3317.8480.9308.2339.4950.4225.6835.0407.8664.6219.8936.0827.9649.8273.3383.4458.2778.1265.7242.9287.0321.0399.2579.5545.8571.2
na24%
naL-P
251%-46%100%-12%18%L-PL-P
405%73%
173%-83%-46%
P-L-8%
102%40%L-L
-3%16%
-46%P-L
182%15178%
L-P22%
-16%P-L8%4%
-9%L-L
72%16%36%L-LL-P
214%-13%
L-L-20%99%
-25%L-P
17%-23%399%
15317568
16019626693
12815816210221510518915218020583
19290-
203121125207221178224214101245119198147248104120150230208185127233240228220201161167164
0.8%1.5%
na0.4%0.3%0.2%1.0%1.0%0.4%0.2%0.5%0.4%3.0%0.1%0.0%0.1%
-1.0%1.4%0.7%0.4%
-0.7%0.1%0.7%0.3%
-0.4%0.3%0.1%0.2%0.9%1.3%
-1.4%0.9%0.3%0.6%
-0.8%1.3%1.0%0.7%
-1.2%0.1%1.4%1.4%
-0.5%0.1%0.7%0.1%
12.4%1.7%0.8%0.5%
13.4%33.3%
na6.7%8.2%
12.5%10.3%13.6%
7.7%4.3%5.2%
11.9%31.9%
1.8%0.6%1.4%
-24.5%10.1%14.9%
3.8%na
2.1%7.5%3.7%
-8.7%7.8%2.2%5.4%
22.4%11.4%
-49.3%8.2%5.2%6.7%
-30.1%10.9%
9.6%8.5%
-32.0%2.2%
22.1%12.9%
-12.2%2.1%
16.7%1.7%
210.3%19.6%
9.7%6.0%
75.8%123.6%
47.6%85.1%45.2%
109.0%64.2%74.5%72.9%86.9%40.6%69.3%15.2%68.2%87.8%71.3%82.8%47.8%53.7%60.8%
na69.8%74.9%82.5%70.7%83.3%74.7%91.0%86.2%57.3%81.4%70.5%81.1%75.1%85.8%59.4%71.0%76.0%59.5%83.3%48.6%74.3%
135.3%78.3%44.6%79.2%22.8%78.9%
100.4%47.7%
5.7%4.4%
13.1%5.4%3.8%1.5%9.7%7.3%5.8%5.7%9.5%3.4%9.5%4.5%6.8%5.0%4.1%
13.6%4.7%
11.9%na
4.4%9.1%9.1%4.4%3.6%5.7%3.7%4.1%
11.5%2.8%
10.4%5.1%8.4%2.8%
12.2%10.9%
8.6%3.6%5.2%6.3%
11.0%3.8%3.5%4.2%4.7%5.9%8.7%8.4%8.8%
UL/12UL/9
UL/12L/*/3/u
L/3UL/12
L/3L/6
L/12L/3
UL/12L/12L/12L/3L/3L/3
L/*/3L/12
ULS/3L/12L/12L/3
L/12L/12/v
L/3L/*/3/wL/12L/12UL/6L/12L/3
L/12L/3
L/12L/3/tL/12
L/12/xL/12L/12L/*/3
ULS/12L/12L/*/3L/3L/3
L/*/3L/12/yUL/12
UL/12/zUL/3
na278.6
na191.5317.5116.6380.5312.9
na224.7161.1242.6487.9161.5202.3150.8197.5194.4276.5200.4
na163.1125.2304.4168.8197.0147.2103.1189.4159.4155.6
94.1172.5135.7178.9290.1161.2150.5
98.4na
468.0195.0
85.3127.4200.2151.3
na213.9209.8151.0
na8.4%
na0.2%5.9%
-49.7%11.2%7.5%
na-1.5%13.4%20.5%
113.7%-5.2%-1.5%1.8%
-7.4%-4.3%9.7%
41.5%na
8.6%5.3%9.0%1.7%3.2%1.4%
134.2%19.0%
-10.6%1.3%
na-1.7%11.5%-3.0%6.6%8.4%
29.6%-35.7%
na76.0%-8.5%
-37.0%-3.6%9.9%
-1.8%na
8.9%29.9%10.2%
-119
-15710820290
109-
14117013663
168149179152155121150
-167192112166153182210158172173222163186161115169181218
-67
154236190151175
-145147177
7445
2321211291596365
11014510412025
1962162032615588
11925219589
1362441461891748262
26485
157113253677896
2601946869
2432071062061159
100127
• Deposits are demand, savings, time and other deposits received from customers. • Loans are commercial, consumer and other loans lent out to customers. • Net interest income is interest and investment income net of interest expenses. • Net profit is recorded after taxes and provisions for loan losses. • Shareholders’ Equity includes preferred and common equity, minority interest, disclosed reserves and retained earnings. • Profit as a % of Assets is return on assets; Profit as a % of Equity, return on equity; Loans as a % of Deposits, loan-to-deposit ratio; Equity as a % of Assets, equty-to-assets ratio. • In the change in Net Profit column, P-L denotes Net profit from the previous period (2000) deteriorating to losses (in 2001), L-P losses to profits; L-L losses to losses. • na - data not available. Data for rows with incomplete information was primarily complied from several media sources given that financials could not be sourced from the organisations. • All data in this table is collated and updated to the best of our ability and knowledge. We provide this service with no warranty whatsoever as to the currency, accuracy, or applicability or the data for any purposes.

THE ASIAN BANKER 300
24 The Asian Banker Journal Special Edition
2001Rank
Assets$million Change
Commercial Banks Country Loans$million Change Rank
201202203204205206207208209210211212213214215216217218219220221222223224225226227228229230231232233234235236237238239240241242243244245246247248249250
Nagano BankIndian BankStandard Chartered Bank MalaysiaSouthern BankAndhra BankBankthaiChinese BankHSBC Bank MalaysiaCitibankSetouchi BankNational Bank of PakistanSyndicate BankBank of KaohsiungTottori BankChina Development Industrial BankTa Chong BankOriental Bank of CommerceCosmos BankOCBC Bank (Malaysia) Grand Commerical BankICBC (Asia)Far Eastern Intl BankFukushima BankEnTie Commercial BankDaito BankHabib BankTomato BankUnion Bank of TaiwanBaodao Commercial BankAllahabad BankGifu BankLiu Chong Hing BankShokusan BankBank DanamonMakoto BankHDFC BankMinami-Nippon BankPan Asia BankBank for Foreign Trade of Vietnam (Vietcombank)United Bank of IndiaTohoku BankBank of America (Asia)Equitable PCI BankChinfon Commercial BankState Bank of HyderabadAsia Pacific BankAlliance Bank GroupDBS Kwong On BankBank of MaharashtraCathay United Bank
6,288.76,260.06,222.06,166.26,152.16,151.56,122.86,084.95,964.75,941.85,884.75,842.35,833.25,787.65,722.85,701.15,600.15,586.65,582.05,579.45,578.15,557.65,491.75,428.55,392.65,351.05,334.25,280.55,204.95,183.85,098.95,060.85,036.45,001.74,930.84,920.54,899.74,803.14,747.74,711.44,699.34,655.14,642.44,578.44,575.84,555.04,502.34,443.24,441.34,213.6
5,865.24,972.64,786.0
na3,825.03,824.05,389.64,855.73,868.65,363.95,023.54,752.54,649.75,242.41,086.84,960.75,893.04,969.33,995.44,867.93,809.44,253.25,110.04,803.64,990.04,333.24,846.44,556.14,558.34,688.64,838.74,191.74,648.83,788.74,332.92,411.54,561.24,379.5
0.04,062.84,361.63,422.52,729.83,885.43,599.84,868.63,726.93,676.53,957.3
na
-0.2%13.6%0.0%0.0%
69.8%15.5%0.5%
-5.5%12.8%-0.2%5.8%4.0%
na0.9%
13.4%3.8%
10.3%8.9%5.5%
-6.8%110.6%15.4%-1.8%-1.5%-0.8%-3.2%
-70.2%-2.7%14.8%14.7%-7.3%1.2%0.7%0.7%
16.3%52.3%-2.9%1.7%
14.3%6.0%0.0%0.6%
-14.4%-1.1%20.6%2.1%
83.5%6.5%
12.8%16.8%
0.6%10.8%0.8%
na1.1%
-2.0%-0.4%-2.9%11.2%0.1%7.4%9.0%
na1.6%
14.0%6.1%
15.4%9.4%
-5.4%-3.8%84.4%3.0%
-0.7%na
0.0%7.6%
-70.4%2.2%
17.5%12.7%-6.8%5.0%1.5%
29.9%14.4%5.4%
-2.6%6.6%
na6.3%1.1%4.0%
-10.0%na
17.3%24.4%82.2%11.4%12.4%
na
194203214
-236237197209234198201215217199288205193204230208238227200213202225210221220216211228218239226272219223
-229224247264233244207240242232
-
4,644.02,256.54,312.0
na2,064.63,190.54,677.13,616.33,871.24,520.32,227.32,255.84,597.53,872.22,377.7
na2,928.63,739.53,995.44,048.83,593.43,873.74,136.14,097.93,912.73,158.63,960.93,405.53,819.92,273.93,912.32,473.13,592.91,009.02,898.51,409.53,715.03,333.21,076.21,411.33,410.92,871.92,041.72,479.51,742.33,553.63,280.43,075.11,707.6
na
-0.4%15.6%-4.3%
na69.8%
-37.5%-1.2%17.4%15.8%-4.7%14.5%12.7%
na-0.2%13.9%
na27.8%-1.6%16.0%-7.2%
129.1%6.9%
-0.1%na
-0.3%-2.5%
-62.0%-14.5%20.2%14.7%-5.0%2.0%0.0%
88.2%-0.3%62.6%-4.6%-9.2%
na18.9%-3.2%-3.7%
-24.4%na
18.8%19.7%94.9%14.4%-6.6%
na
172240184
-245214170206197178243241173196238
-220202191188207195186187193215192211198239194232208287221272204212286271210222246231256209213218258
-
JapanIndia
MalaysiaMalaysia
IndiaThailand
TaiwanMalaysiaMalaysia
JapanPakistan
IndiaTaiwanJapan
TaiwanTaiwan
IndiaTaiwan
MalaysiaTaiwan
Hong KongTaiwanJapan
TaiwanJapan
PakistanJapan
TaiwanTaiwan
IndiaJapan
Hong KongJapan
IndonesiaTaiwan
IndiaJapan
TaiwanVietnam
IndiaJapan
Hong KongPhilippines
TaiwanIndia
TaiwanMalaysia
Hong KongIndia
Taiwan
Deposits$million Change Rank
Generic footnotes: • Except otherwise stated, data pertains to fiscal years ended between June 2001 and March 2002. Asterisk (*) in Notes column denotes data from the 2000 accounting period given that the 2001 financials (or full financials) have yet to be released at the time of compilation of TAB300 (cut-off date up till end-June 2002). • Notes - Numbers (3,6,9,12) refer to the Fiscal Year’s last month (March, June, Sept, Dec). PL, UL, S, and ULS denote Publicly listed, Unlisted, State-Controlled and Unlisted state-controlled respectively. • All values are quoted in US dollars and all % changes are calculated using local currencies. • Conversion rates (unit of currency per US$) as at 31st Dec 2001: Australia, A$1.9562 per US$1; Bangladesh, 59.219 Taka; China, RMB8.2867; Hong Kong, HK$7.7978; India, 48.343 Rupee; Indonesia, 10,505 Rupiah; Japan, 131.14 Yen; Malaysia, 3.8024 Ringgit; New Zealand, NZ$2.4155; Pakistan, 63.002 Rupee; Singapore, $1.8509; South Korea, 1,323.6 Won; Sri Lanka, 93.181 Rupee; Taiwan, NT$35.0915; Thailand, 44.193 Baht; and Vietnam, 15,797 Dong.�• Assets are the sum of cash & bank balances, marketable securities & other short-term investments, net loans & mortgages, long-term investments, fixed assets and other assets.
The Region’s Largest Banks
201TO
250
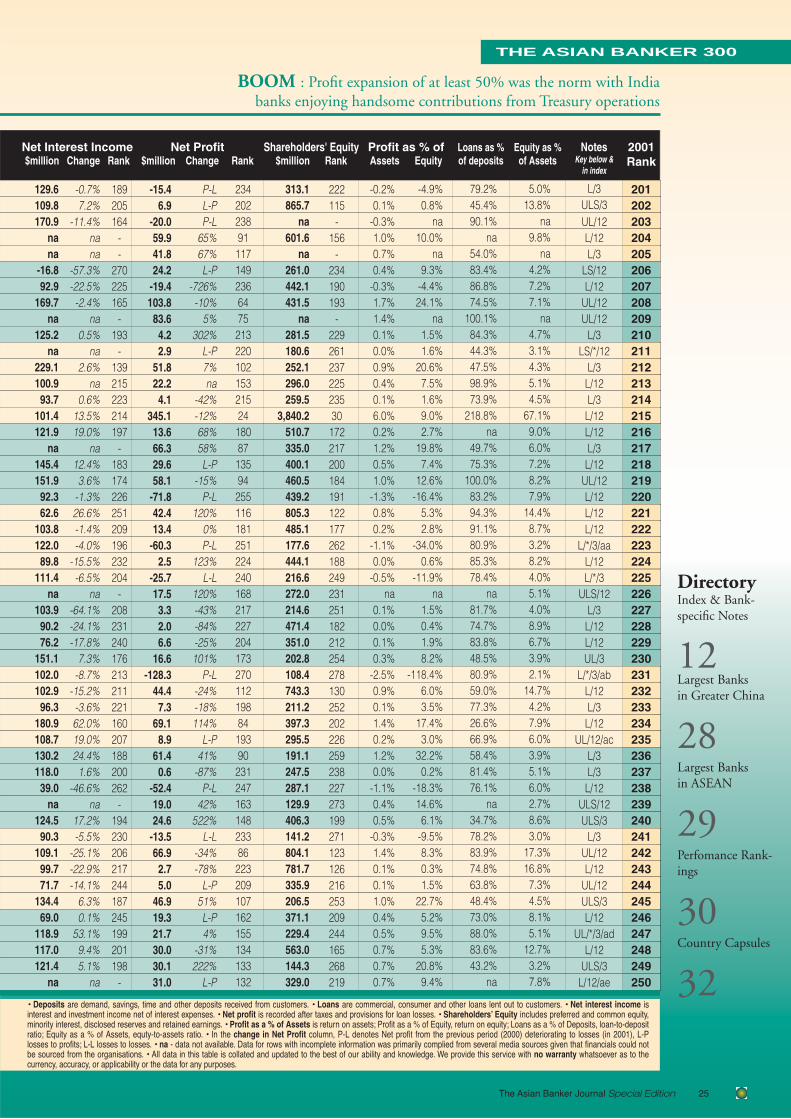
THE ASIAN BANKER 300
The Asian Banker Journal Special Edition 25
DirectoryIndex & Bank-specifi c Notes
12Largest Banks in Greater China
28Largest Banks in ASEAN
29Perfomance Rank-ings
30Country Capsules
32
Shareholders' Equity$million Rank
Net Profit$million Change Rank
Net Interest Income$million Change Rank
Profit as % ofAssets Equity
Loans as %of deposits
Equity as %of Assets
NotesKey below &
in index
2001Rank
201202203204205206207208209210211212213214215216217218219220221222223224225226227228229230231232233234235236237238239240241242243244245246247248249250
-15.46.9
-20.059.941.824.2
-19.4103.8
83.64.22.9
51.822.2
4.1345.1
13.666.329.658.1
-71.842.413.4
-60.32.5
-25.717.5
3.32.06.6
16.6-128.3
44.47.3
69.18.9
61.40.6
-52.419.024.6
-13.566.9
2.75.0
46.919.321.730.030.131.0
313.1865.7
na601.6
na261.0442.1431.5
na281.5180.6252.1296.0259.5
3,840.2510.7335.0400.1460.5439.2805.3485.1177.6444.1216.6272.0214.6471.4351.0202.8108.4743.3211.2397.3295.5191.1247.5287.1129.9406.3141.2804.1781.7335.9206.5371.1229.4563.0144.3329.0
P-LL-PP-L
65%67%L-P
-726%-10%
5%302%
L-P7%na
-42%-12%68%58%L-P
-15%P-L
120%0%P-L
123%L-L
120%-43%-84%-25%101%
P-L-24%-18%114%
L-P41%
-87%P-L
42%522%
L-L-34%-78%
L-P51%L-P4%
-31%222%
L-P
222115
-156
-234190193
-22926123722523530
172217200184191122177262188249231251182212254278130252202226259238227273199271123126216253209244165268219
-0.2%0.1%
-0.3%1.0%0.7%0.4%
-0.3%1.7%1.4%0.1%0.0%0.9%0.4%0.1%6.0%0.2%1.2%0.5%1.0%
-1.3%0.8%0.2%
-1.1%0.0%
-0.5%na
0.1%0.0%0.1%0.3%
-2.5%0.9%0.1%1.4%0.2%1.2%0.0%
-1.1%0.4%0.5%
-0.3%1.4%0.1%0.1%1.0%0.4%0.5%0.7%0.7%0.7%
-4.9%0.8%
na10.0%
na9.3%
-4.4%24.1%
na1.5%1.6%
20.6%7.5%1.6%9.0%2.7%
19.8%7.4%
12.6%-16.4%
5.3%2.8%
-34.0%0.6%
-11.9%na
1.5%0.4%1.9%8.2%
-118.4%6.0%3.5%
17.4%3.0%
32.2%0.2%
-18.3%14.6%
6.1%-9.5%8.3%0.3%1.5%
22.7%5.2%9.5%5.3%
20.8%9.4%
79.2%45.4%90.1%
na54.0%83.4%86.8%74.5%
100.1%84.3%44.3%47.5%98.9%73.9%
218.8%na
49.7%75.3%
100.0%83.2%94.3%91.1%80.9%85.3%78.4%
na81.7%74.7%83.8%48.5%80.9%59.0%77.3%26.6%66.9%58.4%81.4%76.1%
na34.7%78.2%83.9%74.8%63.8%48.4%73.0%88.0%83.6%43.2%
na
5.0%13.8%
na9.8%
na4.2%7.2%7.1%
na4.7%3.1%4.3%5.1%4.5%
67.1%9.0%6.0%7.2%8.2%7.9%
14.4%8.7%3.2%8.2%4.0%5.1%4.0%8.9%6.7%3.9%2.1%
14.7%4.2%7.9%6.0%3.9%5.1%6.0%2.7%8.6%3.0%
17.3%16.8%
7.3%4.5%8.1%5.1%
12.7%3.2%7.8%
L/3ULS/3UL/12L/12L/3
LS/12L/12
UL/12UL/12
L/3LS/*/12
L/3L/12L/3
L/12L/12L/3
L/12UL/12L/12L/12L/12
L/*/3/aaL/12L/*/3
ULS/12L/3
L/12L/12UL/3
L/*/3/abL/12L/3
L/12UL/12/ac
L/3L/3
L/12ULS/12ULS/3
L/3UL/12L/12
UL/12ULS/3L/12
UL/*/3/adL/12
ULS/3L/12/ae
129.6109.8170.9
nana
-16.892.9
169.7na
125.2na
229.1100.9
93.7101.4121.9
na145.4151.9
92.362.6
103.8122.0
89.8111.4
na103.9
90.276.2
151.1102.0102.9
96.3180.9108.7130.2118.0
39.0na
124.590.3
109.199.771.7
134.469.0
118.9117.0121.4
na
-0.7%7.2%
-11.4%nana
-57.3%-22.5%-2.4%
na0.5%
na2.6%
na0.6%
13.5%19.0%
na12.4%3.6%
-1.3%26.6%-1.4%-4.0%
-15.5%-6.5%
na-64.1%-24.1%-17.8%
7.3%-8.7%
-15.2%-3.6%62.0%19.0%24.4%1.6%
-46.6%na
17.2%-5.5%
-25.1%-22.9%-14.1%
6.3%0.1%
53.1%9.4%5.1%
na
189205164
--
270225165
-193
-139215223214197
-183174226251209196232204
-208231240176213211221160207188200262
-194230206217244187245199201198
-
23420223891
1171492366475
21322010215321524
18087
13594
25511618125122424016821722720417327011219884
19390
23124716314823386
223209107162155134133132
• Deposits are demand, savings, time and other deposits received from customers. • Loans are commercial, consumer and other loans lent out to customers. • Net interest income is interest and investment income net of interest expenses. • Net profit is recorded after taxes and provisions for loan losses. • Shareholders’ Equity includes preferred and common equity, minority interest, disclosed reserves and retained earnings. • Profit as a % of Assets is return on assets; Profit as a % of Equity, return on equity; Loans as a % of Deposits, loan-to-deposit ratio; Equity as a % of Assets, equty-to-assets ratio. • In the change in Net Profit column, P-L denotes Net profit from the previous period (2000) deteriorating to losses (in 2001), L-P losses to profits; L-L losses to losses. • na - data not available. Data for rows with incomplete information was primarily complied from several media sources given that financials could not be sourced from the organisations. • All data in this table is collated and updated to the best of our ability and knowledge. We provide this service with no warranty whatsoever as to the currency, accuracy, or applicability or the data for any purposes.
BOOM : Profi t expansion of at least 50% was the norm with Indiabanks enjoying handsome contributions from Treasury operations

THE ASIAN BANKER 300
26 The Asian Banker Journal Special Edition
2001Rank
Assets$million Change
Commercial Banks Country Loans$million Change Rank
251252253254255256257258259260261262263264265266267268269270271272273274275276277278279280281282283284285286287288289290291292293294295296297298299300
Howa BankChung Shing BankPerwira Affin BankCorporation BankCitibank IndiaSonali BankDena BankChikuho BankMiyazaki Taiyo BankChekiang First BankIndustrial & Commercial Bank of Vietnam (Vietincombank)Tainan Business BankInternational Bank of AsiaBangkok Metropolitan BankPhilippine National BankBank of AsiaState Bank of PatialaBendigo BankState Bank of Bikaner & JaipurDevelopment Bank of the PhilippinesAdelaide BankSunny BankVijaya BankUOB (Malaysia)Bank Islam MalaysiaAMP BankJammu & Kashmir BankState Bank of TravancoreUTI BankMuslim Commercial BankRizal Commercial Banking CorpBank Internasional IndonesiaBank of PanhsinPunjab & Sind BankToyama BankJeonbuk BankBank for Investment and Development (BIDV)Arab-Malaysian BankFukuoka Chuo BankUnited Bank LimitedHongkong Chinese BankBank Tabungan NegaraBank of CeylonLucky BankIndusind BankUnited Coconut Planters BankBank RakyatBank LippoThai Danu BankKaohsiung Business Bank
4,194.24,116.74,114.94,075.74,026.64,013.63,897.63,891.03,883.73,814.23,734.93,696.83,669.33,659.03,623.43,598.43,595.93,568.93,475.23,392.23,369.93,357.63,339.63,293.23,291.73,081.03,038.52,995.82,973.52,969.02,952.02,927.62,916.32,845.02,830.62,797.02,792.02,782.62,685.02,676.52,564.12,523.52,499.62,474.02,316.82,308.02,275.82,266.62,240.62,172.7
3,858.83,963.53,159.83,425.62,906.73,363.93,176.23,557.13,603.62,833.6
na3,336.02,852.83,725.8
na3,153.52,846.53,184.32,412.1
612.22,927.83,047.23,036.82,082.32,360.8
na2,670.72,784.22,541.62,453.02,139.12,379.02,371.52,582.12,611.12,163.6
na1,723.62,472.72,263.92,102.91,350.6
785.82,274.91,737.61,822.01,934.61,907.7
nana
-2.8%-19.3%
4.2%17.5%38.0%11.2%5.2%1.3%
-2.5%-2.0%25.0%2.6%
-2.2%nana
2.0%20.9%42.1%21.2%
na15.4%19.9%13.3%2.9%
23.8%16.9%15.5%16.5%33.5%7.1%
22.2%-17.6%
5.9%2.6%2.0%6.6%0.0%
-9.8%3.5%4.2%
-18.7%10.7%30.4%3.5%
29.4%-17.5%20.9%5.0%
13.3%-9.4%
-2.9%-12.6%
4.3%16.0%38.0%17.6%11.1%1.3%
-2.1%-0.2%
na2.8%
-4.9%nana
3.4%20.6%41.7%17.4%
na24.9%
na16.2%8.8%
24.3%na
15.6%21.2%35.1%13.6%30.6%
-12.6%7.9%4.9%2.6%8.6%
na7.6%3.2%
10.7%-19.3%28.4%
113.9%na
16.9%-11.3%20.5%7.2%
nana
235231254246259248253245243262
-249260241
-255261252271290258256257281275
-265263268270279273274267266278
-286269277280287289276285284282283
--
3,078.71,715.42,444.61,792.61,918.21,705.51,556.22,983.82,715.61,636.6
na2,430.52,101.14,027.31,554.92,453.7
na2,869.81,294.31,577.72,783.62,228.71,281.81,919.81,525.5
na1,328.81,538.11,165.01,215.61,776.0
446.41,838.81,153.61,919.41,330.62,690.41,971.51,997.31,402.91,520.51,477.31,203.81,601.51,153.11,178.01,551.9
381.41,702.8
na
-0.5%-42.0%-3.5%11.4%40.0%4.1%8.2%
-0.4%-0.2%2.2%
na-0.4%-6.0%
nananana
42.0%21.2%
na18.7%
na8.3%2.2%
28.9%na
34.9%16.3%15.7%
-11.3%22.5%
-71.9%-2.8%7.6%
-3.1%6.9%
26.0%4.1%1.4%
19.1%-8.3%9.2%
27.0%na
29.4%-15.1%22.8%4.8%
11.8%na
217257235254251259264219228261
-236244189265233
-223278263226242279249268
-276267283280255288253284250275229248247273269270281262285282266289260
-
JapanTaiwan
MalaysiaIndiaIndia
BangladeshIndia
JapanJapan
Hong KongVietnamTaiwan
Hong KongThailand
PhilippinesThailand
IndiaAustralia
IndiaPhilippines
AustraliaTaiwan
IndiaMalaysiaMalaysiaAustralia
IndiaIndiaIndia
PakistanPhilippinesIndonesia
TaiwanIndia
JapanSouth Korea
VietnamMalaysia
JapanPakistan
Hong KongIndonesiaSri Lanka
TaiwanIndia
PhilippinesMalaysia
IndonesiaThailand
Taiwan
Deposits$million Change Rank
Generic footnotes: • Except otherwise stated, data pertains to fiscal years ended between June 2001 and March 2002. Asterisk (*) in Notes column denotes data from the 2000 accounting period given that the 2001 financials (or full financials) have yet to be released at the time of compilation of TAB300 (cut-off date up till end-June 2002). • Notes - Numbers (3,6,9,12) refer to the Fiscal Year’s last month (March, June, Sept, Dec). PL, UL, S, and ULS denote Publicly listed, Unlisted, State-Controlled and Unlisted state-controlled respectively. • All values are quoted in US dollars and all % changes are calculated using local currencies. • Conversion rates (unit of currency per US$) as at 31st Dec 2001: Australia, A$1.9562 per US$1; Bangladesh, 59.219 Taka; China, RMB8.2867; Hong Kong, HK$7.7978; India, 48.343 Rupee; Indonesia, 10,505 Rupiah; Japan, 131.14 Yen; Malaysia, 3.8024 Ringgit; New Zealand, NZ$2.4155; Pakistan, 63.002 Rupee; Singapore, $1.8509; South Korea, 1,323.6 Won; Sri Lanka, 93.181 Rupee; Taiwan, NT$35.0915; Thailand, 44.193 Baht; and Vietnam, 15,797 Dong.�• Assets are the sum of cash & bank balances, marketable securities & other short-term investments, net loans & mortgages, long-term investments, fixed assets and other assets.
The Region’s Largest Banks
251TO
300
Source: Asian Banker Research

THE ASIAN BANKER 300
The Asian Banker Journal Special Edition 27
MERGER MANIA: Government directed consolidations trimmed Malaysia’s core banks to 10 but benefi ts have yet to materialise
DirectoryIndex & Bank-specifi c Notes
12Largest Banks in Greater China
28Largest Banks in ASEAN
29Perfomance Rank-ings
30Country Capsules
32
Shareholders' Equity$million Rank
Net Profit$million Change Rank
Net Interest Income$million Change Rank
Profit as % ofAssets Equity
Loans as %of deposits
Equity as %of Assets
NotesKey below &
in index
2001Rank
251252253254255256257258259260261262263264265266267268269270271272273274275276277278279280281282283284285286287288289290291292293294295296297298299300
-36.3-720.5
-27.677.259.0
2.22.42.74.3
28.49.85.1
37.91.1
-79.9-86.348.217.034.033.217.516.027.139.2
7.0-23.853.725.027.717.6
7.2-393.2
3.34.81.0
-29.4na
10.61.6
-118.54.1
11.97.57.1
10.5-55.841.425.8
3.9-270.6
174.2105.9351.7256.4
na95.3
202.0220.8186.4496.2
69.6234.4468.8
-256.6na
195.5236.2216.1126.0334.5143.4198.3137.2344.8370.9
na193.8106.5127.2
79.1312.0
-209.3239.9
92.0156.0
92.5na
84.7142.8
38.9415.2
79.1119.3162.2116.2220.9245.4266.2
89.6-245.4
P-LL-LP-L
43%41%5%L-P0%L-P
-49%7%L-P
21%L-PL-LL-L
45%56%56%
na26%94%85%
-29%-45%
L-L55%24%56%51%-9%P-L
27%74%
-63%P-Lna
-11%-43%
P-L-66%
-109%-66%-20%25%P-L
86%10%
-101%L-L
264280211236
-281255247260174288243183292
-257242250275218269256272213210
-258279274286223290241283267282
-285270289194287276265277246239232284291
-0.9%-17.5%
-0.7%1.9%1.5%0.1%0.1%0.1%0.1%0.7%0.3%0.1%1.0%0.0%
-2.2%-2.4%1.3%0.5%1.0%1.0%0.5%0.5%0.8%1.2%0.2%
-0.8%1.8%0.8%0.9%0.6%0.2%
-13.4%0.1%0.2%0.0%
-1.0%na
0.4%0.1%
-4.4%0.2%0.5%0.3%0.3%0.5%
-2.4%1.8%1.1%0.2%
-12.5%
-20.8%-680.6%
-7.9%30.1%
na2.3%1.2%1.2%2.3%5.7%
14.1%2.2%8.1%
nana
-44.1%20.4%
7.9%27.0%
9.9%12.2%
8.1%19.7%11.4%
1.9%na
27.7%23.5%21.8%22.3%
2.3%na
1.4%5.2%0.7%
-31.7%na
12.6%1.1%
-304.6%1.0%
15.0%6.3%4.4%9.0%
-25.3%16.9%
9.7%4.3%
na
79.8%43.3%77.4%52.3%66.0%50.7%49.0%83.9%75.4%57.8%
na72.9%73.7%
108.1%na
77.8%na
90.1%53.7%
257.7%95.1%73.1%42.2%92.2%64.6%
na49.8%55.2%45.8%49.6%83.0%18.8%77.5%44.7%73.5%61.5%
na114.4%
80.8%62.0%72.3%
109.4%153.2%
70.4%66.4%64.7%80.2%20.0%
nana
4.2%2.6%8.5%6.3%
na2.4%5.2%5.7%4.8%
13.0%1.9%6.3%
12.8%-7.0%
na5.4%6.6%6.1%3.6%9.9%4.3%5.9%4.1%
10.5%11.3%
na6.4%3.6%4.3%2.7%
10.6%-7.2%8.2%3.2%5.5%3.3%
na3.0%5.3%1.5%
16.2%3.1%4.8%6.6%5.0%9.6%
10.8%11.7%
4.0%-11.3%
L/3L/12
UL/*/12/afL/3/agUL/3
UL/*/12L/3L/3L/3
L/12ULS/12
L/12L/12
LS/12/y&ahL/12L/12
ULS/3L/6L/3
ULS/12/aiL/6
UL/12L/3
UL/12L/6
UL/12L/3
LS/3L/3
L/12L/12L/12
UL/12UL/3L/3
L/12ULS/12
L/*/3L/*/3/ajULS/12
UL/12/akULS/12
ULS/*/12L/12L/3
ULS/*/12UL/*/12
L/12L/12L/12
92.9-41.4102.0136.6159.7-15.791.680.389.772.8
na65.097.2
na-7.974.4
na82.2
na113.8
17.564.4
100.476.251.2
na90.787.841.3
150.658.2
3.845.865.547.547.5
na66.060.881.566.621.361.745.733.7
nana
97.648.7
na
224271212185171269228239233243
-249220
-268242
-237
-203265250216241255
-229234261180254266259248257258
-247253238246264252260263
--
219256
-
2452902418092
22622522221213819020812323025725910517112813116917714012220123997
144139167199287218211229242
-187228267214184197200188250118143282283
Net Interest Income$million Change Rank
6.8%-165.4%
21.4%13.6%20.0%28.4%8.5%0.2%2.7%
-26.6%na
-16.3%10.6%
na-16.5%21.4%
na37.5%
nana
-68.5%34.2%5.4%
-10.7%19.0%
na22.8%9.4%
103.1%37.8%
-14.9%-94.2%-10.4%-5.8%-5.8%8.5%
na9.4%
-0.4%7.8%
-8.9%-146.2%-13.3%25.3%2.2%
nana
55.6%18.3%
na
• Deposits are demand, savings, time and other deposits received from customers. • Loans are commercial, consumer and other loans lent out to customers. • Net interest income is interest and investment income net of interest expenses. • Net profit is recorded after taxes and provisions for loan losses. • Shareholders’ Equity includes preferred and common equity, minority interest, disclosed reserves and retained earnings. • Profit as a % of Assets is return on assets; Profit as a % of Equity, return on equity; Loans as a % of Deposits, loan-to-deposit ratio; Equity as a % of Assets, equty-to-assets ratio. • In the change in Net Profit column, P-L denotes Net profit from the previous period (2000) deteriorating to losses (in 2001), L-P losses to profits; L-L losses to losses. • na - data not available. Data for rows with incomplete information was primarily complied from several media sources given that financials could not be sourced from the organisations. • All data in this table is collated and updated to the best of our ability and knowledge. We provide this service with no warranty whatsoever as to the currency, accuracy, or applicability or the data for any purposes.

THE ASIAN BANKER 300
28 The Asian Banker Journal Special Edition
Commercial Banks CountryRankReturn onEquity (%)
Return onAsset (%)
Net Profits($mn)
Assets($mn)
Top 300Rank
1234567891011121314151617181920212223242526272829303132333435363738394041424344454647484950
579
101120232733364552535660616473767781829396
105109116118122123146147151153156159161168173174177180182184187188189192198207
Industrial and Commercial Bank of ChinaBank of China GroupChina Construction BankAgricultural Bank of ChinaHSBCBank of China (HK)Bank of CommunicationsBank of TaiwanHang Seng BankTaiwan Cooperative BankLand Bank of TaiwanFirst Commercial BankCITIC Industrial BankHua Nan Commercial BankChang Hwa Commercial BankChina Everbright BankChina Merchants BankTaiwan Business BankIntl Commercial Bank of ChinaChinatrust Commercial BankBank of East AsiaGuangdong Development BankShanghai Pudong Development BankUnited World Chinese Com. BankDao Heng BankChina Minsheng Banking CorpTaipeibankChiao Tung BankFarmers Bank of ChinaFujian Industrial BankBank of ShanghaiHua Xia BankBeijing City Commercial BankNanyang Commercial BankCentral Trust of ChinaShenzhen Development BankShanghai Commercial & Savings BankShanghai Commercial BankInternational Bank of Taipei Taishin Financial HoldingHsinchu Intl BankWing Lung BankFubon Commercial BankBank SinopacCITIC Ka Wah BankE.Sun Commercial BankBank of Overseas ChineseWing Hang BankDah Sing BankChinese Bank
China
China
China
China
Hong Kong
Hong Kong
China
Taiwan
Hong Kong
Taiwan
Taiwan
Taiwan
China
Taiwan
Taiwan
China
China
Taiwan
Taiwan
Taiwan
Hong Kong
China
China
Taiwan
Hong Kong
China
Taiwan
Taiwan
Taiwan
China
China
China
China
Hong Kong
Taiwan
China
Taiwan
Hong Kong
Taiwan
Taiwan
Taiwan
Hong Kong
Taiwan
Taiwan
Hong Kong
Taiwan
Taiwan
Hong Kong
Hong Kong
Taiwan
521,085 405,664 333,662 262,281 223,491 98,279 85,469 66,196 60,887 51,140 43,026 36,366 36,215 35,730 33,150 32,028 31,162 27,018 25,671 25,530 23,310 23,073 20,960 20,155 17,335 16,701 16,208 15,702 15,330 15,193 11,624 11,477 11,319 11,236 10,735 10,279 10,046 9,189 9,003 8,736 8,379 8,259 8,010 7,934 7,621 7,577 7,508 7,061 6,660 6,123
71195462436
3,365355869273
1,29711216090
1951134421
166-34812521820533
1281502307883
1311291
1029186na204649
127613010
10868447955
-87100114-19
0.14%
0.24%
0.19%
0.01%
1.51%
0.4%
1.02%
0.41%
2.13%
0.22%
-0.37%
0.25%
0.54%
0.32%
0.13%
0.07%
0.53%
-1.29%
0.49%
0.86%
0.88%
0.14%
0.61%
0.74%
1.32%
0.47%
0.51%
0.83%
0.08%
0.60%
0.88%
0.79%
0.76%
na
0.19%
0.45%
0.49%
1.38%
0.68%
0.34%
0.13%
1.31%
0.85%
0.56%
1.04%
0.73%
-1.16%
1.42%
1.71%
-0.32%
3.1%
3.6%
4.3%
0.2%
31.6%
5.3%
19.0%
5.1%
22.4%
7.2%
-10.0%
3.7%
15.9%
6.8%
2.5%
1.4%
28.0%
-30.5%
7.2%
10.4%
8.8%
5.2%
15.0%
8.1%
13.3%
11.4%
6.5%
8.5%
1.6%
12.5%
15.1%
22.2%
13.4%
na
12.5%
7.7%
5.2%
10.1%
7.5%
3.7%
2.2%
11.4%
8.2%
6.7%
9.6%
8.5%
-32.0%
12.9%
19.6%
-4.4%
The Largest Banks In Greater China
Source: Asian Banker Research
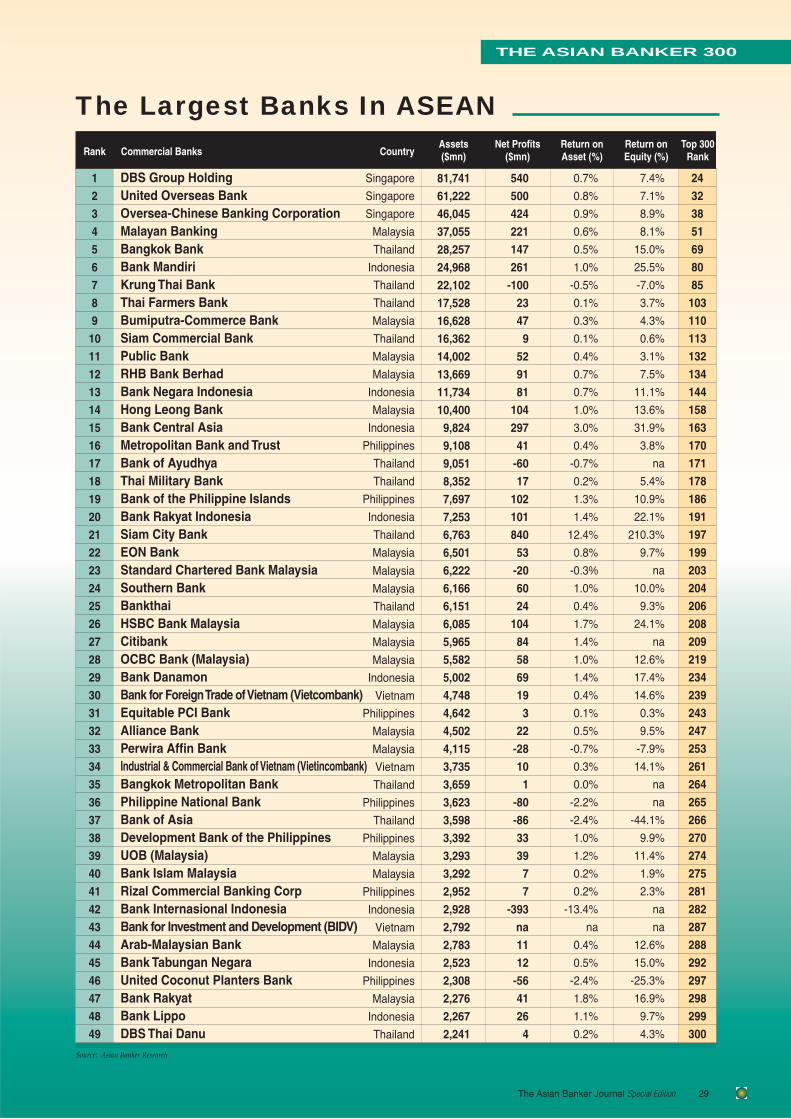
THE ASIAN BANKER 300
The Asian Banker Journal Special Edition 29
Commercial Banks CountryRankReturn onEquity (%)
Return onAsset (%)
Net Profits($mn)
Assets($mn)
Top 300Rank
1
2
3
4
5
6
7
8
9
10
11
12
13
14
15
16
17
18
19
20
21
22
23
24
25
26
27
28
29
30
31
32
33
34
35
36
37
38
39
40
41
42
43
44
45
46
47
48
49
24
32
38
51
69
80
85
103
110
113
132
134
144
158
163
170
171
178
186
191
197
199
203
204
206
208
209
219
234
239
243
247
253
261
264
265
266
270
274
275
281
282
287
288
292
297
298
299
300
DBS Group HoldingUnited Overseas BankOversea-Chinese Banking CorporationMalayan BankingBangkok BankBank MandiriKrung Thai BankThai Farmers BankBumiputra-Commerce BankSiam Commercial BankPublic BankRHB Bank BerhadBank Negara IndonesiaHong Leong BankBank Central AsiaMetropolitan Bank and TrustBank of AyudhyaThai Military BankBank of the Philippine IslandsBank Rakyat IndonesiaSiam City BankEON BankStandard Chartered Bank MalaysiaSouthern BankBankthaiHSBC Bank MalaysiaCitibankOCBC Bank (Malaysia) Bank DanamonBank for Foreign Trade of Vietnam (Vietcombank)Equitable PCI BankAlliance BankPerwira Affin BankIndustrial & Commercial Bank of Vietnam (Vietincombank)Bangkok Metropolitan BankPhilippine National BankBank of AsiaDevelopment Bank of the PhilippinesUOB (Malaysia)Bank Islam MalaysiaRizal Commercial Banking CorpBank Internasional IndonesiaBank for Investment and Development (BIDV)Arab-Malaysian BankBank Tabungan NegaraUnited Coconut Planters BankBank RakyatBank LippoDBS Thai Danu
81,741
61,222
46,045
37,055
28,257
24,968
22,102
17,528
16,628
16,362
14,002
13,669
11,734
10,400
9,824
9,108
9,051
8,352
7,697
7,253
6,763
6,501
6,222
6,166
6,151
6,085
5,965
5,582
5,002
4,748
4,642
4,502
4,115
3,735
3,659
3,623
3,598
3,392
3,293
3,292
2,952
2,928
2,792
2,783
2,523
2,308
2,276
2,267
2,241
540
500
424
221
147
261
-100
23
47
9
52
91
81
104
297
41
-60
17
102
101
840
53
-20
60
24
104
84
58
69
19
3
22
-28
10
1
-80
-86
33
39
7
7
-393
na
11
12
-56
41
26
4
0.7%
0.8%
0.9%
0.6%
0.5%
1.0%
-0.5%
0.1%
0.3%
0.1%
0.4%
0.7%
0.7%
1.0%
3.0%
0.4%
-0.7%
0.2%
1.3%
1.4%
12.4%
0.8%
-0.3%
1.0%
0.4%
1.7%
1.4%
1.0%
1.4%
0.4%
0.1%
0.5%
-0.7%
0.3%
0.0%
-2.2%
-2.4%
1.0%
1.2%
0.2%
0.2%
-13.4%
na
0.4%
0.5%
-2.4%
1.8%
1.1%
0.2%
7.4%
7.1%
8.9%
8.1%
15.0%
25.5%
-7.0%
3.7%
4.3%
0.6%
3.1%
7.5%
11.1%
13.6%
31.9%
3.8%
na
5.4%
10.9%
22.1%
210.3%
9.7%
na
10.0%
9.3%
24.1%
na
12.6%
17.4%
14.6%
0.3%
9.5%
-7.9%
14.1%
na
na
-44.1%
9.9%
11.4%
1.9%
2.3%
na
na
12.6%
15.0%
-25.3%
16.9%
9.7%
4.3%
Singapore
Singapore
Singapore
Malaysia
Thailand
Indonesia
Thailand
Thailand
Malaysia
Thailand
Malaysia
Malaysia
Indonesia
Malaysia
Indonesia
Philippines
Thailand
Thailand
Philippines
Indonesia
Thailand
Malaysia
Malaysia
Malaysia
Thailand
Malaysia
Malaysia
Malaysia
Indonesia
Vietnam
Philippines
Malaysia
Malaysia
Vietnam
Thailand
Philippines
Thailand
Philippines
Malaysia
Malaysia
Philippines
Indonesia
Vietnam
Malaysia
Indonesia
Philippines
Malaysia
Indonesia
Thailand
The Largest Banks In ASEAN
Source: Asian Banker Research

THE ASIAN BANKER 300
30 The Asian Banker Journal Special Edition
Performance Rankings
Commercial BanksRank
123456789
1011121314151617181920212223242526272829303132333435363738394041424344454647484950
HSBCHang Seng BankCommonwealth Bank of AustraliaKookmin BankNational Australia BankWestpac Banking CorpAustralia & New Zealand Banking GroupBank of China GroupNorinchukin BankBank of CommunicationsSiam City BankAozora BankIndustrial and Commercial Bank of ChinaChina Construction BankDBS Group HoldingHanvit (Woori) BankState Bank of IndiaUnited Overseas BankShinsei BankOversea-Chinese Banking CorporationChohung BankIndustrial Bank of KoreaBank of China (HK)China Development Industrial BankBank Central AsiaShinkin Central BankShinhan BankBank of TaiwanBank MandiriHana BankDao Heng BankMalayan BankingChinatrust Commercial BankSt George BankBank of East AsiaSuncorp-MetwayCITIC Industrial BankWestpac Banking Corporation (NZ)Bank of New Zealand77 BankNational Bank of NZKorea Exchange BankKorea First BankChina Merchants BankANZ Banking Group (NZ)Land Bank of TaiwanBank of YokohamaCanara Bank United World Chinese Com. BankKorAm Bank
The Largest Profits
Net Profits($mn)
Top 300Rank
3,364.71,297.01,225.81,122.71,064.8
972.8955.9954.3896.0868.9839.7760.2711.1623.5539.8538.6503.0499.8466.8424.1397.0371.8355.0345.1296.9289.9281.7273.4261.4243.1229.5220.8218.4207.0205.2201.9195.5192.6182.2175.9172.2171.6169.2166.0164.4160.1156.0153.4149.8147.3
1133171513212276
231973759
242826323138464020
2151631454278055
10551777581
12453
11711950
126479764
1524525
1259687
Commercial BanksRank
123456789
1011121314151617181920212223242526272829303132333435363738394041424344454647484950
Hanvit (Woori) Bank *Siam City Bank *Aozora BankBank of Fukuoka *Bank of CommunicationsThai Military Bank *Bangkok Bank *Senshu Bank *Korea Exchange Bank *Seoulbank *KorAm Bank *Chohung BankThai Danu Bank *Norinchukin BankHana BankFukui Bank *Fukuoka City Bank *Bank of The Ryukyus *Shinhan BankKookmin BankKumamoto Family Bank *State Bank of IndiaToho Bank *Bank Tabungan Negara *Bank MandiriShanghai Commercial & Savings Bank *Cathay United Bank *Bank of Ayudhya *Bank Central AsiaBankthai *Cosmos Bank *Industrial and Commercial Bank of ChinaHokkoku Bank *Westpac Banking CorpCanara Bank 77 BankCITIC Industrial BankEighteenth BankTaiwan Cooperative Bank *China Merchants BankAgricultural Bank of China *Nippon Trust Bank *Bank Rakyat IndonesiaIndian Bank *Australia & New Zealand Banking GroupDena Bank *Bank of IndiaAsia Pacific Bank *China Minsheng Banking CorpIndustrial Bank of Korea
The Largest Gain In Profits
Gain inProfits ($mn)
Top 300Rank
2,810.01,004.2
759.3726.1623.9583.6569.8564.5539.4469.3446.6322.0289.6272.9229.7217.9207.4203.4196.2182.8173.9171.2169.0150.6148.6144.8133.8132.6125.4123.3120.797.396.696.194.488.284.081.180.880.178.772.069.063.562.957.452.452.349.247.8
28197373523178691484711287463006551159215454151602689292801612501711632062185842112550531113664101931912022225715724610940
* movement from losses to profits (L-P)Source: Asian Banker Research Source: Asian Banker Research

THE ASIAN BANKER 300
The Asian Banker Journal Special Edition 31
Performance Rankings
Commercial BanksRank
123456789
1011121314151617181920
Mizuho Financial GroupSumitomo Mitsui Banking CorporationMitsubishi Tokyo Financial GroupUFJ HoldingsIndustrial and Commercial Bank of ChinaDaiwa Bank HoldingsBank of China GroupChina Construction BankAgricultural Bank of ChinaNorinchukin BankAsahi BankNational Australia BankHSBCKookmin BankShoko Chukin BankShinkin Central BankCommonwealth Bank of AustraliaSumitomo Trust & BankingWestpac Banking CorpAustralia & New Zealand Banking Group
The Largest in Loans
Loans$mn
Top 300Rank
645,064485,325374,125350,958320,932228,925191,504181,726174,203173,905131,465106,22586,50681,67175,64071,50969,55368,03863,31263,213
12345879
106
12131115181417162122
Commercial BanksRank
123456789
1011121314151617181920
Mizuho Financial GroupSumitomo Mitsui Banking CorporationMitsubishi Tokyo Financial GroupIndustrial and Commercial Bank of ChinaUFJ HoldingsBank of China GroupNorinchukin BankChina Construction BankDaiwa Bank HoldingsAgricultural Bank of ChinaHSBCAsahi BankShinkin Central BankKookmin BankNational Australia BankBank of YokohamaSumitomo Trust & BankingCommonwealth Bank of AustraliaState Bank of IndiaDBS Group Holding
The Largest in Deposits
Deposits$mn
Top 300Rank
565,270495,547456,820432,074387,327298,930278,933273,394257,909217,994176,732155,865129,451104,186
97,62070,75962,31459,99158,20257,686
1235476981011121415132516172624
# Note - Siam City Bank reported a net profi t of Bt37,110 million ($840mn), up 610% from a loss of Bt7,270 million after transferring all of its NPLs to its own asset management company. The bank also recorded Bt45,229 million ($1.02bn) in revenues as a result of conversion of doubtful loan reserves set aside earlier. These are one-off items that skewed performance upwards for 2001.
Commercial BanksRank
123456789
1011121314151617181920
Siam City Bank #China Development Industrial BankBank Central AsiaHang Seng BankCorporation BankBank RakyatJammu & Kashmir BankDah Sing BankHSBC Bank MalaysiaAozora BankHSBCCitibank IndiaANZ Banking Group (NZ)Bank of America (Asia)Wing Hang BankCitibankBank Rakyat IndonesiaBank DanamonShanghai Commercial BankState Bank of Patiala
The Highest Return on Assets
Growth inAssets (%)
Top 300Rank
ROA%
15.7%13.4%
7.3%-5.2%17.5%20.9%15.5%
7.9%-5.5%
-26.5%-1.1%38.0%
0.9%0.6%1.0%
12.8%14.9%
0.7%9.5%
20.9%
12.42%6.03%3.02%2.13%1.89%1.82%1.77%1.71%1.71%1.61%1.51%1.46%1.46%1.44%1.42%1.40%1.40%1.38%1.38%1.34%
197215163332542972771982083711255152242192209191234168267
Commercial BanksRank
123456789
1011121314151617181920
Siam City Bank #ANZ Banking Group (NZ)HDFC BankBank Central AsiaHSBCCorporation BankChina Merchants BankJammu & Kashmir BankState Bank of Bikaner & JaipurBank MandiriBank of New ZealandHanvit (Woori) BankHSBC Bank MalaysiaState Bank of TravancoreState Bank of HyderabadHang Seng BankASB Bank – NZMuslim Commercial BankHua Xia BankBank Rakyat Indonesia
The Largest Return on Equity
ROE%
Top 300Rank
210.3%33.3%32.2%31.9%31.6%30.1%28.0%27.7%27.0%25.5%24.6%24.3%24.1%23.5%22.7%22.4%22.4%22.3%22.2%22.1%
1971522361631125464277269801192820827824533179280147191
Source: Asian Banker Research Source: Asian Banker Research
Source: Asian Banker Research Source: Asian Banker Research

THE ASIAN BANKER 300
32 The Asian Banker Journal Special Edition
Country CapsulesJAPAN: A Sea Of Red Ink
Japan109 banks in TAB300. Total assets: $6,904.3bn. Total profits: -$38.8bn. Return on assets (ROA): -0.6%. �Return on Equity (ROE): -15.6%
1,153,824
823,585
758,707
608,304
458,875
342,782
195,900
188,126
127,375
106,855
-7,443
-3,537
-1,161
-9,360
896
-7,106
-4,516
290
-324
-98
1
2
3
4
6
8
12
14
16
18
1
2
3
4
5
6
7
8
9
10
Mizuho Financial GroupSumitomo Mitsui Banking CorporationMitsubishi Tokyo Financial GroupUFJ Holdings ^Norinchukin Bank *Daiwa Bank HoldingsAsahi BankShinkin Central BankSumitomo Trust & BankingShoko Chukin Bank *
Commercial BankRank
-0.6%
-0.4%
-0.2%
-1.5%
0.2%
-2.1%
-2.3%
0.2%
-0.3%
-0.1%
-20.6%
-15.9%
-4.4%
-47.2%
5.3%
-72.3%
-79.2%
4.6%
-6.4%
-11.2%
6.5%
10.2%
8.9%
4.0%
3.4%
7.3%
5.1%
0.9%
5.3%
4.9%
ProfitabilityROA (%) ROE (%)
Profits($mn)
Assets($mn)
Top 300Rank
NPLRatio *
* Denotes data from 2000 (FY3/2001) given that the 2001 financials were not available at time of compilation.* All NPL numbers in TAB 300 refer to the gross non-performing loans as a percentage of the total loan book, unless otherwise stated.^ UFJ Holdings: NPL ratio for FY3/2001Source: Asian Banker Research
For the fi scal year to March 2002, eight of the top ten Japanese banks went into the red, principally driven by an economy in recession, weak loan demand, souring loans from corporate bank-ruptcies and lacklustre management. The 109 banks covered in our report averaged a dismal return on equity (ROE) of -15.6%.
Japan’s 4 mega-banking giants - Mizuho, Sumitomo Mitsui, Mitsubishi Tokyo Financial Group (MTFG) and UFJ (No.1-4 in TAB300) - formed from absorbing 10 of the largest banks - have yet to see consolidation synergies and savings fi lter through. Acceleration of NPL disposals saw the quartet end the fi scal year with an aggregated net loss of 2.8 trillion Yen ($21.5 bil-lion), and the top 10 banks Japanese at 4.2 trillion Yen ($32.4 billion) poorer, with a majority moving into the red with the largest individual losses ever. With an increasing NPL tide and fall in gross lending, net interest income at the bank level remained stagnant.
On the balance sheet, loan assets declined by 8% on average as write-off of problem loans exacerbated. Creditworthy borrow-ers took the opportunity to repay loans to avoid rolling-over at higher spreads whilst banks‚ stricter criteria for the renewing of fi nance for weak borrowers also muted loans growth.
Offi cial reports of problem loans - tip of the ice-berg? Results of an inspection done by the FSA (Financial Services Agency) in April on banks’ lending surprisingly gave the banking system a virtually clean bill of health. This was possibly because the probe focused only on loans made to bankrupt borrowers (which have largely been accounted for) and not on the huge volume of grey‚ loans that many believe could still trigger further collapses among Japanese banks. Another reason is political - Prime Minister Koizumi’s political future depends heavily on the success in starving off a banking crisis. As such, regulators are saying that the amount of debts is manageable with FSA suggest-ing that Japan’s leading banks should be able to dispose of their worst bad loans within the space of about two years.
We are less optimistic - although FSA estimates that Japan’s banks have circa 40 trillion Yen ($305 billion) of bad debts in their books, some private estimates run to as high as 100 trillion Yen, with the FSA themselves admitting that the total potential problem loans, including those on watchlist, could be as much as 150 trillion Yen ($1.14 trillion).
The FY3/2002 fi nancial year results already showed that the combined outstanding NPLs for major banks grew at 30% in the 6 months to March, up 45% from a year ago. This stands at 26.8 trillion Yen ($204.2 billion) in March 2002 even after the Big Four Group wrote off 6.6 trillion Yen ($51 billion) in loans against just 3 trillion Yen in net business profi ts in the FY3/2002 fi scal year.
Although offi cial bad loans accounted for 6-7% of the outstand-ing lending as at the end of the last fi scal year, it is highly probable that this percentage is skewed towards the lower end.
Banks in Japan must seek profi ts not size Banks are projecting a combined operating profi t in the region of 3.7 trillion Yen, down circa 10% from FY3/2002 with many pointing to an expected less profi table environment in the Treasury operations. Top banks are also expecting a return to net profi t this year (with the 4 largest banks expecting 475 billion Yen) but an overhaul of the banking system will not be an easy task with retained earnings and capital being depleted.
With growth of bad loans showing no signs of abating and the government’s increasing reluctance to reach into the coffers to provide extensive assistance to tackle the balance sheet problems, Japanese banks now need to look beyond the pursuit of size to the pursuit of profi ts. The government has to provide a clear sched-ule for the fi nancial revitalisation and set the stage for further consolidation of the banking sector. Whatever the case, with the Japanese banks not accepting the pain of real structure change and NPL disposal absorbing future years of profi ts, do not expect the banking sector to turn the corner in the near future.

THE ASIAN BANKER 300
The Asian Banker Journal Special Edition 33

THE ASIAN BANKER 300
34 The Asian Banker Journal Special Edition
China16 banks in TAB300. Total assets: $1,828.2bn. Total profits: $4.2bn. ROA: 0.2%. ROE: 4.5%
521,085
405,664
333,662
262,281
85,469
36,215
32,028
31,162
23,073
20,960
711
954
624
36
869
195
21
166
33
123
5
7
9
10
23
53
61
64
82
93
1
2
3
4
5
6
7
8
9
10
Industrial and Commercial Bank of ChinaBank of China GroupChina Construction BankAgricultural Bank of China *Bank of CommunicationsCITIC Industrial BankChina Everbright BankChina Merchants BankGuangdong Development BankShanghai Pudong Development Bank ^
Commercial BankRank
0.1%
0.2%
0.2%
0.0%
1.0%
0.5%
0.1%
0.5%
0.1%
0.6%
3.1%
3.6%
4.3%
0.2%
19.0%
15.9%
1.4%
28.0%
5.2%
20.1%
29.8%
24.0%
18.1%
35.0%
27.5%
na
na
na
na
15.9%
ProfitabilityROA (%) ROE (%)
Profits($mn)
Assets($mn)
Top 300Rank
NPLRatio
* Denotes data from 2000 given that the 2001 financials were not available at time of compilation. NPL figure for ABC as at Sept 2001.^ Shanghai Pudong: NPL ratio for 2000Source: Asian Banker Research
CHINA: Yet Another Bad Loan Story
China Banks turned in fairly healthy profi ts in 2001,with at least 2 out of the big 4 state-owned banks (Industrial and Commercial Bank of China (ICBC, No.5) and Bank of China (BOC, No.7) - churning in profi t improvements. On the top-line numbers, fi nancial institutions maintained double-digit deposits and loans growth - the former was up 16% to 14.4 trillion yuan ($1.7 trillion) while loans expanded 11.6% to 11.2 trillion yuan ($1.3 trilllion).
Bad loans and ineffi ciencies clogging up the system But with loans growing rapidly, NPLs remain one of the major areas of concern. Statistics show that the Big Four banks, which control about two-thirds of the market, have divested 1.4 trillion yuan ($168.9 billion) in NPLs in 1999 but still have a hefty 28% bad-debt ratio at the end 2001. If credit cooperatives are included, unofficial estimates by Standard and Poor’s puts the figure closer to 50%, and projects that China is unlikely to cut banks’ NPLs to 15% within five years as per central bank directive. Instead, this mammoth task will take a decade and cost $518 billion (equivalent to half of China’s estimated gross domestic product of $1.1 trillion for 2001).
Another worry is the capital adequacy ratio, a gauge for a bank’s capital security and capacity to withstand risks. This ratio for the Big Four, already low at the 1.44% (ABC) to 6.38% range (BOC) in early 2001, continues to move away from The Basel Agreement’s mandatory 8%.
Although the Big Four have shifted towards a profit-maximisation objective, they still make government-directed loans to state-owned enterprises due to the state-owned structure. While they dominate China’s banking sector with 70% of total assets and a huge domestic network, these giants are largely overstaffed, poorly managed behemoths ill-equipped to compete with foreign companies. Size has no direct correlation with profitability here with state banks averaging ROAs of 0.14% and ROEs of 2.81% in contrast
against collectively-owned (shareholding) banks at 4-5 times higher returns.
Quicker reform progress requiredAlthough China’s banks have begun to improve internal controls and adopt a more commercial focus, they face tougher market conditions this year with jostling from foreign banks and domestic interest rate cuts squeezing margins. Even one of the best-regarded newly-listed Chi-nese banks, China Merchants Bank (No.64), expects net growth to decelerate to 10-15% in 2002 from 93% in 2001. Chinese banks need to improve their commercial footing, and authorities need to push for better corporate govern-ance. All these have to be completed before fully opening up the industry - under the country’s World Trade Organi-sation commitments, overseas competition is due to enter the Chinese market in five years time.
Country Capsules

THE ASIAN BANKER 300
The Asian Banker Journal Special Edition 35

THE ASIAN BANKER 300
36 The Asian Banker Journal Special Edition
TAIWAN: Banking Reforms Of Utmost Importance
Taiwanese banks posted mixed, but principally weak results in 2001 with only 2 out top 10 (by Assets) boasting profi t im-provements. The norm unfortunately, was for a double-digit decline in earnings. For instance, Bank of Taiwan (No.27), the largest Taiwanese bank by assets, recorded a 9% decline in profi ts to NT$9.6 billion ($273 million) while No.45 (Land Bank of Taiwan) saw a more dramatic 32% plunge to NT$5.6 billion ($160 million).
Record bad loans written off in 2001...2001 saw banks working hard to rid themselves of bad debt - statistics released by the Central Bank showed that they wrote off a staggering NT$285.7 billion ($8.1 billion) in soured loans, a steep rise from NT$129.4 billion ($3.7 billion) in 2000. The fi nance ministry expects banks to write off another NT$300 bil-lion ($8.5 billion) this year. Even then, the aggregate amount of
NPLs at domestic banks topped NT$1.08 trillion ($30.8 billion) or 7.5% of total outstanding loans by end 2001, up from 5.3% at the end of 2000.
...But plague of bad loans linger Already high, the actual loan numbers may even be understated - fi gures from Standard & Poor’s records Taiwan bank’s NPL ratio at 15% at the end of 2001 with expectations of a rise to 18% of all loans some time this year.
Taiwan’s chronic NPL problem seems not to have improved despite strenuous efforts to contain it. In all, a total of 12 local banks recorded an NPL of over 10% at the end of last year, with the debt-ridden Chung Shing Bank (No.253), a smallish bank with total assets of NT$144 billion ($4.1 billion), topping the list with a staggering overdue loan ratio of 57.2%!
Let weaker banks fail The failure of the government to sell the troubled Chung Shing, the fi rst bad-loan plagued bank that the government is offering to investors, underscores diffi culties in cleaning up its banking system. This development is being closely monitored by inves-tors who criticize the government for its reluctance to bite the bullet and allow the weaker banks to fail, but instead continuing to fi nance their losses through its bank restructuring fund. In contrast, offi cials in countries like South Korea and Malaysia have implemented aggressive fi nancial reforms in the wake of the 1997/98 regional fi nancial crisis.
With little signs of a recovery in the local property market, banks will bear large losses from bad loan write-offs and con-tinue to witness high NPLs in 2002. This arises because some 80% to 90% of the banks’ NPLs were extended on collateral of properties but prices have fallen by about 40% from the 1980s peak. Though banks have turned more aggressive in tackling the NPL tide, with the likes of First Commercial (No.52) and Hua Nan (No.56) beginning to make substantial write-offs - the bad debt problem is a well-ingrained one that will not go away anytime soon.
Taiwan43 banks in TAB300. Total assets: $587.0bn. Total profits: $810mn. ROA: 0.14%. ROE: 2.0%
66,196
51,140
43,026
36,366
35,730
33,150
27,018
25,671
25,530
20,155
273
112
160
90
113
44
-348
125
218
150
27
36
45
52
56
60
73
76
77
96
1
2
3
4
5
6
7
8
9
10
Bank of Taiwan ^Taiwan Cooperative Bank ^Land Bank of TaiwanFirst Commercial BankHua Nan Commercial BankChang Hwa Commercial BankTaiwan Business BankIntl Commercial Bank of ChinaChinatrust Commercial BankUnited World Chinese Com. Bank ^
Commercial BankRank
0.4%
0.2%
0.4%
0.2%
0.3%
0.1%
-1.3%
0.5%
0.9%
0.7%
5.1%
7.2%
10.0%
3.7%
6.8%
2.5%
-30.5%
7.2%
10.4%
8.1%
3.9%
7.5%
8.5%
8.7%
8.6%
13.1%
12.1%
3.8%
2.9%
6.9%
ProfitabilityROA (%) ROE (%)
Profits($mn)
Assets($mn)
Top 300Rank
NPLRatio
^ NPL ratio as at end 1Q2002Source: Asian Banker Research
Taiw
an b
ank
NPLs extremely high at several Taiwanese banks
Source: Asian Banker Research
Pan Asia Bk�
Tainan Biz Bk�
Bk of Panhsin�
Farmers Bk of China�
Taichung Biz Bk�
Bk of Overseas Chinese�
Kao Shin Com. Bk�
ChinFon Com. Bk�
Medium Biz Bk of Hualien�
Taitung Biz Bk�
Kaohsiung Biz Bk�
Chung Shing Bk
0% 10% 20% 30% 40% 50% 60%NPLs
Country Capsules

THE ASIAN BANKER 300
The Asian Banker Journal Special Edition 37
South Korea13 banks in TAB300. Total assets: $491.1bn. Total profits: $3.6bn. ROA: 0.7%. ROE: 15.0%
142,868
63,381
45,350
42,770
42,349
35,896
35,823
22,050
20,015
16,418
1,123
539
372
397
172
282
243
147
169
77
15
28
40
46
47
54
55
87
97
112
1
2
3
4
5
6
7
8
9
10
Kookmin BankHanvit Bank (Woori)Industrial Bank of KoreaChohung BankKorea Exchange BankShinhan Bank *Hana BankKorAm BankKorea First Bank ^Seoulbank
Commercial BankRank
0.8%
0.8%
0.8%
0.9%
0.4%
0.8%
0.7%
0.7%
0.8%
0.5%
16.7%
24.3%
9.7%
20.5%
10.7%
12.3%
15.6%
15.6%
14.7%
14.8%
3.6%
2.1%
2.3%
3.3%
3.6%
2.4%
2.4%
2.7%
10.5%
2.4%
ProfitabilityROA (%) ROE (%)
Profits($mn)
Assets($mn)
Top 300Rank
NPLRatio
* Denotes data from 2000 given that the 2001 financials were not available at time of compilation.^ Korea First Bank: NPL ratio has since been reduced to 5.3% (1Q2002)Source: Asian Banker Research
SOUTH KOREA: Financial Health In Recovery Mode
Testament to its reform efforts and strong macroeconomic performance, banks in South Korea turned in improved performances last year, posting record profits after five consecutive years of losses. Altogether, the domestic banks chalked up a cumulative profit of 5.2 trillion won ($3.9 bil-lion), a massive turnaround from the losses of 4.2 trillion won ($3.5 billion) in 2000. Reflecting this improvement is top consumer lender Kookmin Bank (No.15), created in November 2001 by a merger between retail specialist Kookmin Bank and mortgage specialist Housing & Com-mercial Bank (H&CB). Kookmin saw a net profit growth of 19.5% to 1.49 trillion won ($1.12 billion), powered by a resurgent economy and lower interest spurring mortgage and consumer loans, credit card commissions and profit from trust operations.
Such significant achievements were possible due to a change in practices and a conscious effort at moving to-wards greater shareholder value and transparency. Some of the key efforts include the implementation of painful downsizing and restructuring measures that saw 16 un-profitable banks merged or dissolved altogether and the re-orientation in the lending strategy of South Korean banks with greater emphasis on consumer banking. Changes at top saw the emergence of a younger breed of western-educated CEOs like Kim Jung-tae (Kookmin Bank) and Kang Chung-won (Seoul Bank) who are market-oriented and driven by value-maximisation.
Reforms a good example for banks elsewhereCommercial banks saw their NPLs ratio drop from 12.9% in 1999, to 3.4% in 2001, to an all-time low of 3.1% as the end of 1Q2002. Some South Korean banks NPLs (as at 1Q2002) have shrunk to globally respectable levels - Shinhan is at 1.8% (No.54 in TAB300), Hana 2.1% (No.55), Seoul 2.2% (No.112), and Hanvit (renamed Woori in May 2002) 2.3% (No.28). With the banking system previously almost crippled by heavy
borrowing by the country’s bloated chaebol or conglomer-ates, South Korean banks deserves high marks for cleaning up their act.
Entering an era of sustainable profi ts? After half a decade of being in the red, 2001 was a commendable renaissance for South Korean banks. With private consumption growth of 4.5% in 2001 and projected to expand by 6.5% in 2002, banks‚ expansion into consumer lending is well timed.
Meanwhile, given the recovery of corporate profi tability following restructuring efforts, debt to equity ratios in the manufacturing sector have fallen to their lowest level since the early 1970s, whilst interest coverage ratios have risen to an average to 1.7 times from 1.1 times in 1996. Since South Korean industries are now faring better, corporate lending headaches are also receding. The profi t outlook for South Korean banks is certainly looking more sustainable.

THE ASIAN BANKER 300
38 The Asian Banker Journal Special Edition
HONG KONG - Tough Times In 2001
As the economy worsened, Hong Kong banks felt the heat from lower margins, higher bad debt provision and weak loan de-mand. Key amongst these decline was the Bank of China (Hong Kong)’s (No.20) 47% drop in net profi ts to HK$2.8 billion ($355
million) from restructuring charges for the merger of 12 banks under the group, lower interest income and asset revaluation losses from an adverse market environment. BOC (HK)’s NPLs accounted for nearly 11% of the loan book at end-2001 against the industry average of 4.09 %.
Figures by the HKMA (Hong Kong Monetary Authority) showed the banking sector assets contracting 7.6% last year with customer loans shrinking 11.2% and deposits 3.6%. Even with their interest rate-cutting spree, with the property market
down 60% from the peak, mortgage lending (which accounts for circa 40% of loans) still dipped 1%.
With the decline in traditional banking businesses, banks turned to credit card operations to boost bottomlines. Credit
card accounts soared 16.4% to average 1.4 cards/capita. But along with aggressively card is-suance came credit card charge-off rates of 9% as surging un-employment pushed personal bankruptcy fi lings from 4,066 to 9,151, up 1.25X.
Consolidation progressing2001 saw further consolidation with CITIC Ka Wah’s (No.187) takeover of Hong Kong Chinese Bank in 4Q01 hot at the heels of DBS’s (No.24) acquisition of Dao Heng in the earlier part of 2001. With some 150 licensed banks in the territory’s crowded bank-ing sector and the small players competing with giants like HSBC, BOC and Standard Chartered, we expect more integration to reap economies of scale. This will how-ever be at a slower pace, as ongo-ing reluctance to relinquish family
control and low prices will deter shareholders from selling.
Growth prospects remain unexciting for 2002 Although pressure on margins should ease as the central banks halts rate cuts this year, Hong Kong banks will continue to grap-ple with fl imsy loans growth and a fi ercely competitive consumer banking market. We expect further pain to come for Hong Kong banks given continued weak asset prices and a rising level of bankruptcies. Growth prospects remain unexciting for 2002.
Country Capsules
Hong Kong18 banks in TAB300. Total assets: $503.1bn. Total profits: $6.2bn. ROA: 1.2%. ROE: 16.7%
223,491
98,276
60,887
23,310
17,335
11,236
9,189
8,259
7,621
7,061
3,365
355
1,297
205
230
na
127
108
79
100
11
20
33
81
105
153
168
180
187
192
1
2
3
4
5
6
7
8
9
10
HSBC Bank of China (HK)Hang Seng BankBank of East AsiaDao Heng Bank Nanyang Commercial BankShanghai Commercial Bank Wing Lung BankCITIC Ka Wah BankWing Hang Bank
Commercial BankRank
1.5%
0.4%
2.1%
0.9%
1.3%
na
1.4%
1.3%
1.0%
1.4%
31.6%
5.2%
22.4%
8.8%
13.3%
na
10.1%
11.4%
9.6%
12.9%
4.2%
10.9%
2.7%
3.1%
2.9%
na
2.1%
3.6%
4.5%
3.8%
ProfitabilityROA (%) ROE (%)
Profits($mn)
Assets($mn)
Top 300Rank
NPLRatio
Source: Asian Banker Research

THE ASIAN BANKER 300
The Asian Banker Journal Special Edition 39
WINCOR NIXDORF(CD TO XPRESS PRINT)

THE ASIAN BANKER 300
40 The Asian Banker Journal Special Edition
INDIA: Banking On A Turnaround
2001 marked the turnaround for India’s public sector banks. At the close of the FY3/2002 reporting season, 27 state banks reported a 92% net profi t expansion, erasing 2 consecutive years of contraction. In absolute terms, the bottomline was a stellar 83.1 billion rupees ($1.7 billion) as against 43.2 billion rupees in 2000/01. Of these, State Bank of India (No.26), the nation’s largest commercial bank, fl aunted a 54% y-o-y growth in profi ts. This accounted for circa 30% of the aggregated in-dustry fi gure. Others were equally impressive with 20 of the 27 banks boasting profi t gains of at least 50%. Erstwhile weak banks also posted impressive growth - for instance, Indian Bank (No.202) which last recorded profi ts in 1996, bounced back with a modest 330 million rupees ($7 million). Meanwhile, NPLs are reportedly down from 6.7% to 5.8%.
Huge windfall from treasuryCloser examination revealed a common reason for the profi t explosion - the hand-some contribution from Treasury opera-tions from a softer interest rate environ-ment in the government securities market. Higher bond trades in Indian banks boosted trading profi ts by an average 80-100%, with revenues from this component exceeding net profi ts in some instances. In contrast, net interest income growth averaged 11.3% whilst on the deposits and loans front, expansion was 13.2% and 16.7% respectively, lower than in 2000/01. Instead of extending credit to borrowers, Indian banks have been deploying deposits into government bond investments, resulting in the lowest loan-deposit ratio (mid-40% range) amongst the countries the region.
But sustainability is a moot question With a rising interest rate regime and bond yields slowly creeping up this year, this brings us to question the sus-tainability of revenues from treasury operations. This is especially the case for the state banks where trading profits dominated earnings at 30-40% of banks’ pre-provision profits as against a lower 20% for private sector banks like HDFC (No.236). Last year’s significant profit expansion would be a tough act to follow.
India30 banks in TAB300. Total assets: $259.7bn. Total profits: $1.9bn. ROA: 0.7%. ROE: 13.5%
68,903
21,536
14,937
13,136
13,098
10,883
10,446
9,179
6,846
6,491
503
53
153
116
57
34
104
65
48
34
26
90
125
137
138
155
157
169
195
200
1
2
3
4
5
6
7
8
9
10
State Bank of India ^ICICI Canara Bank Punjab National Bank ^Bank of Baroda * Central Bank of India Bank of IndiaUnion Bank of IndiaIndian Overseas BankUco Bank
Commercial BankRank
0.7%
0.2%
1.0%
0.9%
0.4%
0.3%
1.0%
0.7%
0.7%
0.5%
15.4%
3.9%
21.4%
17.5%
8.2%
8.2%
10.3%
14.9%
16.7%
6.0%
13.0%
4.7%
6.2%
11.7%
5.1%
8.0%
9.4%
10.8%
na
9.5%
ProfitabilityROA (%) ROE (%)
Profits($mn)
Assets($mn)
Top 300Rank
NPLRatio
* Denotes data from 2000 (FY3/2001) given that the 2001 financials were not available at time of compilation. NPL ratio for FY3/2002.^ NPL ratios: FY3/2001 for nos. 1, 4. Source: Moody’s Credit Opinions (March 2002)Source: Asian Banker Research
India - Sterling improvement in Public Sector Banks' (PSB) profits
*Note: The financial year ends in March (e.g. 1997: year to 3/1998)
Source: Asian Banker Research
-40%
-20%
0%
20%
40%
60%
80%
100%
Com
bine
d N
et P
rofit
gro
wth
1997 1998 1999 2000 2001
Country Capsules

THE ASIAN BANKER 300
The Asian Banker Journal Special Edition 41
AUSTRALIA: Write-Downs Down Under
2001 fi scal year saw Australia’s major banks, NAB (No.13), CBA (No.17), Westpac (No.21), ANZ (No.22) and St George (No.75) record combined net earnings of A$8.7 billion ($4.4 billion), a decrease of 11.3% from 2000. The key culprit here was invest-ment writedowns. For instance, NAB made a A$3.6 billion ex-traordinary writedown on its U.S.-based mortgage-servicing unit (HomeSide Lending) and substantial provisions for its exposure to Ansett’s collapse that resulted in bad debt charge soaring 73% to $897 million. These caused in a 36% plunge in net profit to A$2.1 billion ($1.1 billion). Along the same grain, CBA reported bad-debt rising 24% to A$385 million from the failure of major busi-nesses such as the NSW Grains Board and Pasminco which reduced its profi ts by 11% to A$2.4 billion.
Omitting these writedowns, the banks actually maintained a steady growth in underlying earnings from strong net interest and fee income, and con-tinued focus on cost control which saw cost-to-income ratios (CIRs) reduced from 58.6% to 53.2%. For instance, discounting the HomeSide provision, NAB’s earnings would have actually surged 19% to a record A$4 billion.
Interims for 2002 point to a more buoyant future Moving forth, Australian banks have defi ed tough global con-ditions to post record 1H2002 profi ts with CBA, NAB, Westpac
and ANZ making a combined underlying net profi t of A$5.5 billion ($3.1 billion), up 11%. Fuelling growth were house buyers and consumers taking advantage of low interest rates
which resulted in consumer lending portfolios growing 5% compared to a 2.6% decrease for the corporate sector. Also backing profi t expansion were tight control of costs translating to a further decline in CIRs to 50.9%, and a lift in non-interest income from fees or funds management operations. NPLs have also begun easing - NAB saw the fi gure dip from 0.8% to 0.75% in 1H, well off the last sector peak of 2.0% recorded during the early 1990s and even as their provisioning cover im-proved to 33.7% of gross NPLs from 30.6% previously.
No major NPL problemsAustralian banks weathered the Asia crisis without a signifi cant impact on their asset quality and maintain below average
levels of NPLs compared to global banks. Recent high profi le corporate collapses such as OneTel and Pasminco have rattled some observers, but are unlikely to blow out NPL ratios signifi -cantly given the ongoing quality of retail loan books.
While the economic downturn will no doubt decelerate revenue growth, Australian banks’ continued focus on credit control and cost reduction, combined with enhanced product offerings such as managed funds products to customers will minimise the impact.
191,555
117,785
97,048
94,823
25,971
15,805
15,668
15,163
14,922
14,236
1,065
1,226
973
956
207
193
182
202
172
124
13
17
21
22
75
117
119
124
126
131
1
2
3
4
5
6
7
8
9
10
National Australia BankCommonwealth Bank of AustraliaWestpac Banking Corp Australia & New Zealand Banking GroupSt George BankWestpac Banking Corporation (NZ)Bank of New ZealandSuncorp-Metway National Bank of NZ ^Macquarie Bank
Australia and New Zealand11 Australian and 5 New Zealand banks in TAB300. Total assets of banks in top 300: Aust $577.9bn; N.Z. $66.0bn.Total profits: Aust $4.8bn; N.Z. $787mn. ROA: Aust 0.8%; N.Z. 1.2%. ROE: Aust 13.3%; N.Z. 21.7%
Commercial BankRank
0.6%
1.0%
1.0%
1.0%
0.8%
1.2%
1.2%
1.3%
1.2%
0.9%
8.8%
13.0%
19.6%
17.7%
11.2%
16.6%
24.6%
14.5%
19.1%
22.1%
0.8%
0.7%
1.1%
1.3%
0.5%
na
na
1.1%
0.5%
0.6%
ProfitabilityROA (%) ROE (%)
Profits($mn)
Assets($mn)
Top 300Rank
NPLRatio
^ NPL ratios: FY99/00 for National Bank of NZ. Source: Moody’s Credit Opinions (March 2002)Source: Asian Banker Research

THE ASIAN BANKER 300
42 The Asian Banker Journal Special Edition
SINGAPORE: Unimpressive Report Card
Singapore’s worst recession since independence muted profi t-ability for the city-state’s 3 banks (DBS, UOB and OCBC; No.24, 32 and 38 in TAB300 respectively) with increased provisioning to cover declines in the collateral value of NPLs. In 2001, ag-gregate provisions rose three-fold to S$1.06 billion ($0.57 billion) from S$284 million the previous year, paring total net profi t by 14% to S$2.71 billion ($1.46 billion). Of the 3, UOB trumped its two rivals with a minute 1.3% rise in net profi ts to S$925 mil-lion ($500 million) but with the growth due to a three-month inclusion of Overseas Union Bank (OUB) which it acquired last year. The other 2 suffered profi t fall, with DBS down 28% and OCBC 7%.
This occurred even as the 3 banks saw net interest income growth of 11-21% from three key mergers that have taken place - DBS Bank acquisition of Hong Kong’s Dao Heng; UOB of OUB; and OCBC of Keppel Tatlee. Bottomlines would have looked worse if not for the government-driven integration which shrunk fi ve banking groups into three. On that front, DBS defended the S$9.4 billion ($5.1 billion) purchase price of Dao Heng (a whopping 3.2X book value) arguing that it generates meaningful access to north-east Asia and direct ac-cess to China. The bank is also targeting $72 million in annual cost savings, with OCBC aiming for $55 million by 2004 from the full integration of Keppel Tatlee, and UOB targeting $135 million by 2003.
Time to justify recent M&A activity Against the background of lacklustre economic expansion, we do not expect substantial earnings growth this year. Singapore banks will need to look for new streams of income like fee-based and Treasury income or sell non-core assets as organic net interest income growth stagnates. Combined NPLs for the three banks already hovers at 8.0% of total loans and climbing. DBS’s new chief executive Jackson Tai sees the bank as being in
“consolidation and effi ciency mode” this year. It will be interest-ing to see how contributions from newly acquired businesses and tighter cost controls can boost profi tability further down the line as the economy recovers.
Competition heating up Singapore banks will also have to deal with aggressive forays into the market by foreign banks. The central bank brought the total number of full bank licenses to six with the granting of two additional licenses to HSBC (No.11) and Malayan Banking (No.51), allowing them wider access to the retail market. With domestic banks digesting integration efforts following the M&A binge last year and possibly more consolidation in store with the government envisaging two (not three) banks, foreign banks will meanwhile make more inroads into Singapore’s consumer banking arena.
Singapore3 banks in TAB300. Total assets: $189.0bn. Total profits: $1.5bn. ROA: 0.8%. ROE: 9.7%
81,741
61,222
46,045
540
500
424
24
32
38
1
2
3
DBS Group HoldingUnited Overseas BankOversea-Chinese Banking Corporation
Commercial BankRank
0.7%
0.8%
0.9%
8.9%
10.8%
9.4%
5.7%
9.3%
9.7%
ProfitabilityROA (%) ROE (%)
Profits($mn)
Assets($mn)
Top 300Rank
NPLRatio
Source: Asian Banker Research
Country Capsules

THE ASIAN BANKER 300
The Asian Banker Journal Special Edition 43

THE ASIAN BANKER 300
44 The Asian Banker Journal Special Edition
MALAYSIA: 2001 A Watershed Year
To prepare Malaysian banks for eventual liberalisation, Ma-laysia merged its 54 banking institutions into 10 core groups ahead of market opening to incumbent foreign banks by 2004 and new entrants by 2007. Out of these 10 anchor banks, 2001 saw profi t deterioration for 8, underscoring high overhead and merger-related costs following an industry-wide consolidation and diffi culties faced as bad debts rose and competition inten-sifi ed in the retail segment amidst slowing economic growth. Instead of abating following the consolidation, gross NPLs are still high at 18% of all loans in late 2001.
Maybank (No.51), the nation’s largest bank and barometer for health, was similarly hit and saw net profi ts tumble 38% to MYR840 million ($221 million) in fi scal 2001. Net NPLs rose from 7.7% in 2000 to 8.4% (gross: 16.2%) whilst overhead costs rose 33% after the take over of PhileoAllied and Pacifi c Bank.
And now - the gain after the (merger) pain Though many merged entities are still grappling with teeth-
ing problems, 2002 will fortunately see progress as economic recovery takes hold. Performance is expected to improve in fi nancial year 2002 as better asset quality and thinner loan losses, improving Cost-to-income ratios (CIRs) and recoveries under-pin earnings outlook. This optimistic outlook is backed by the recent release of Maybank’s interim results to December 2001 where the group turned round with a 7.4% rise in net profi t to MYR753 million ($198 million) from lower loan loss provisions and rise in non-interest income.
Corporate debt restructuring is key The government also appears to be taking aggressive steps to restructure the country’s huge corporate debt. By end-2001, Danaharta, the state-owned asset management company set up to assist in recapturing loan values after the Asian fi nancial crisis, had cleared the bulk of its bad loans portfolio of MYR47.7 billion on an average recovery rate at 56%. Malaysian banks are beginning to reap the gains of the merger pain.
Country Capsules
Malaysia17 banks in TAB300. Total assets: $148.5bn. Total profits: $945mn. ROA: 0.6%. ROE: 8.5%
37,055
16,628
14,002
13,669
10,400
6,501
6,222
6,166
6,085
5,965
221
47
52
91
104
53
-20
60
104
84
51
110
132
134
158
199
203
204
208
209
1
2
3
4
5
6
7
8
9
10
Malayan Banking Bumiputra-Commerce Bank Public Bank RHB Bank BerhadHong Leong BankEON Bank Standard Chartered Bank MalaysiaSouthern Bank HSBC Bank MalaysiaCitibank
Commercial BankRank
0.6%
0.3%
0.4%
0.7%
1.0%
0.8%
-0.3%
1.0%
1.7%
1.4%
8.1%
4.3%
3.1%
7.5%
13.6%
9.7%
na
10.0%
24.1%
na
16.2%
10.8%
6.4%
13.9%
13.3%
8.1%
na
22.6%
na
na
ProfitabilityROA (%) ROE (%)
Profits($mn)
Assets($mn)
Top 300Rank
NPLRatio
Source: Asian Banker Research
INDONESIA: Bleeding Slowly Abating
Indonesia8 banks in TAB300. Total assets: $66.5bn. Total profits: $454mn. ROA: 0.7%. ROE: 12.3%
24,968
11,734
9,824
7,253
5,002
2,928
2,523
2,267
261
81
297
101
69
-393
12
26
80
144
163
191
234
282
292
298
1
2
3
4
5
6
7
8
Bank MandiriBank Negara IndonesiaBank Central AsiaBank Rakyat IndonesiaBank DanamonBank Internasional Indonesia Bank Tabungan NegaraBank Lippo
Commercial BankRank
1.0%
0.7%
3.0%
1.4%
1.4%
-13.4%
0.5%
1.1%
25.5%
11.1%
31.9%
22.1%
17.4%
na
15.0%
9.7%
9.7%
20.0%
3.2%
5.0%
5.0%
62.0%
5.0%
9.0%
ProfitabilityROA (%) ROE (%)
Profits($mn)
Assets($mn)
Top 300Rank
NPLRatio
Note: All NPL ratios from Fitch RatingsSource: Asian Banker Research

THE ASIAN BANKER 300
The Asian Banker Journal Special Edition 45
With the recapitalisation of Indonesian banks with specially-issued government bonds and the removal and restructuring of NPLs, banks saw their underlying profi tability substantially improve over 2001. Combined ROAs for the top 13 banks (ac-counting for 75% of the total banking assets) doubled to 0.78% even as aggregated asset grew at a faster 6%. Improvement arose from high levels of net interest and non-interest income coupled with reasonable cost containment. For instance, an increase in central bank paper rates (14.8% to 17.6%) and gross loan growth of 15% (IDR24 trillion or $2.28 billion) resulted in net interest income for the likes of Bank Central Asia (BCA, No.163) and Bank Rakyat Indonesia (BRI, No.191) soaring 114% and 76% respectively. Strongest organic loans growth came from mid-sized banks like Panin and Niaga which saw SME lending rise.
Though loan book situation still tentative Following IDR14 trillion ($1.3 billion) in write-offs, banks ended 2001 with NPLs declining from 17% to 12%, with BCA,
Buana and Bali apparently boasting a low 3%. But at the other end of the spectrum lies Bank Negara Indonesia (BNI, No.144) with 20% and Bank Internasional Indonesia (BII, No.282) a whopping 62%. This is despite a IDR11 trillion ($1 billion) bad-loan transfer to the Indonesian Bank Restructuring Agency (IBRA) and IDR14.4 trillion recapitalisation in late 2001 to cover BII’s related party exposure to the collapse of Asia Pulp & Paper Group.
The worst is over but the outlook is muted Restructuring and write-offs were less substantial in 2001 as against the prior year with much of the NPL improvement due to the booking in of new loans. With write-off constrained by the banks’ limited capital bases, worry remains that banks will fi nd it increasingly diffi cult to rid off the remaining NPLs. And unless we see substantial cuts in NPLs, banks’ appetites to absorb new credit risks will be muted. Indonesian banks are out of intensive care but the recuperation process is far from over.
PHILIPPINES: Mixed Bag Of Results
Philippine Banks concluded 2001 with varied fortunes. For instance, Metrobank (No.170), Philippines‚ top bank saw a 40% surge in net income to P2.1 billion ($41 million) while Bank of the Philippine Islands (BPI, No.186), the country’s second largest bank, posted a more impressive 72% rise to P5.3 billion ($102 million) from higher interest (+7%) and commission income (+23%) buoyed by higher trading gains. In contrast, No.3 Equitable PCI (No.243 in TAB300) suffered a 78% deceleration in earnings to P140 million and a 14% decline in interest income. Credit however, has to be given for its successful deposit recovery program which enabled it to fully pay off the P30 billion emergency loan from the Bangko Sentral ng Pilipinas (Central Bank of Philippines).
Banking at cross-roads with a clearer way forward In recent months, the prevailing low-interest-rate regime has borne down on the net margins of banks. In spite of the lower rates, loans growth remained problematic with Philippine cor-porates reluctant to make signifi cant new investments given patchy economic conditions both at home and abroad. Total loans in 1Q2002 dropped 1% during the period to P1.378 trillion ($26.7 billion) from P1.392 trillion in the comparative period a year ago. Hopefully with the local currency stable, infl ation at modest levels and interest rates at historical lows to spur consumption, prospects will turn more promising. With the government providing the environment for banks to address their problematic loans, profi tability and sustainable growth will become more achievable.
Philippines7 banks in TAB300. Total assets: $33.7bn. Total profits: $50mn. ROA: 0.1%. ROE: 5.1%
9,108
7,697
4,642
3,623
3,392
2,952
2,308
41
102
3
-80
33
7
-56
170
186
243
265
270
281
296
1
2
3
4
5
6
7
Metropolitan Bank and TrustBank of the Philippine IslandsEquitable PCI BankPhilippine National BankDevelopment Bank of the PhilippinesRizal Commercial Banking CorpUnited Coconut Planters Bank *
Commercial BankRank
0.4%
1.3%
0.1%
-2.2%
1.0%
0.2%
-2.4%
3.8%
10.9%
0.3%
na
9.9%
2.3%
-25.3%
10.8%
14.6%
22.1%
49.0%
13.7%
19.3%
31.8%
ProfitabilityROA (%) ROE (%)
Profits($mn)
Assets($mn)
Top 300Rank
NPLRatio
* Denotes data from 2000 given that the 2001 financials were not available at time of compilation.Note: All NPL ratios as at end 1Q2002Source: Asian Banker Research

THE ASIAN BANKER 300
46 The Asian Banker Journal Special Edition
Country Capsules
Thailand11 banks in TAB300. Total assets: $124.1bn. Total profits: $817mn. ROA: 0.6%. ROE: 13.7%
28,257
22,102
17,528
16,362
9,051
8,352
6,763
6,151
3,659
3,598
147
-100
23
9
-60
17
840
24
1
-86
69
85
103
113
171
178
197
206
264
266
1
2
3
4
5
6
7
8
9
10
Bangkok Bank ^Krung Thai Bank ^Thai Farmers Bank ^Siam Commercial Bank ^Bank of Ayudhya ^Thai Military Bank ^Siam City BankBankthaiBangkok Metropolitan BankBank of Asia ^
Commercial BankRank
0.5%
-0.5%
0.1%
0.1%
-0.7%
0.2%
12.4%
0.4%
0.0%
-2.4%
15.0%
-7.0%
3.7%
0.6%
na
5.4%
210.3%
9.3%
na
-44.1%
15.3%
8.1%
12.9%
18.8%
15.7%
12.1%
na
3.2%
na
18.6%
ProfitabilityROA (%) ROE (%)
Profits($mn)
Assets($mn)
Top 300Rank
NPLRatio
^ NPL ratio as at end 1Q2002Source: Asian Banker Research
THAILAND: Show Of Profi t From Reduced Provisions
Performance results of Thailand’s commercial banks improved signifi cantly last year as the combined earnings of the 11 banks in TAB300 surged 9X from net losses of Bt4.6 billion ($104 mil-lion) in 2000 to net profi ts of Bt36.1 billion ($817.5 million). Siam City Bank (SCIB, No.197) topped its peers, reporting a hefty net profi t of Bt37.11 billion ($840 million) for 2001, compared to a loss of Bt7.27 billion in 2000 (albeit principally due to one-off items) whilst Bangkok Bank (No.69), Thailand’s largest commercial bank, was also amongst the best performers with a net profi t of Bt6.48 billion ($147 million), erasing prior years’ losses.
Most profi t increments were attributed to signifi cant reduc-tion of loan-loss provisioning reserves from the disposal of NPLs to the state-owned Thai Asset Management Corporation
(TAMC) or other asset management vehicles. SCIB for instance, disposed bad loans to its own asset management company and saw NPLs down 97% within a month to Bt146.3 million in December. Total NPLs in the fi nancial system was Bt458.5 bil-lion ($10.4 billion or a ratio of 10.5%) at year-end, a contraction of Bt34 billion from Bt492 billion in 2000.
But abating reforms slowing growth As evident by the continued aggregated net profi ts surge of 426% to Bt9.8 billion ($222 million) in 1Q2002, earnings
outlook continues to improve this year. Unfortunately, Thailand has somewhat lost the momentum for fi nancial reforms it had started during the 1997-98 crisis. The com-mercial banks are sitting on some Bt500-600 billion ($11.3-13.6 billion) in excess funds, yet remain averse to lending in an environment where borrowers are already mired in debt or declaring bankruptcy. Even the govern-ment prodding to help jump-start economic growth has yielded little results - growth projected by IMF is just 2.7% this year (the slowest among the emerging economies of Asia).
TAMC only part of the solution To remain attractive to its key source of growth, the foreign investors, more structural reforms and transparency are required. For instance, the TAMC should not be a panacea to the NPL problem or become a vehicle to “warehouse” the remaining NPLs forever. The inherent problems which make NPLs thrive remain - Thailand’s weak
foreclosure and bankruptcy laws, limited security/collateral laws and weak corporate governance standards. These have to be addressed.
-30,000
-25,000
-20,000
-15,000
-10,000
-5,000
0
5,000
10,000
15,000
20,000
25,000
30,000
35,000
40,000
Several Thai banks witness profit improvement in 2001
Net
pro
fit (
Mill
ion
Bah
t)
Ban
k of
Asi
a�
Ban
k of
Ayu
dhya
�
Ban
gkok
Met
ropo
litan
Ban
k�
Thai
Dan
u B
ank�
Thai
Milit
ary
Ban
k�
Ban
ktha
i�
Ban
gkok
Ban
k�
Sia
m C
ity B
ank
20002001
Source: Asian Banker Research

THE ASIAN BANKER 300
The Asian Banker Journal Special Edition 41
AUSTRALIA: Write-Downs Down Under
2001 fi scal year saw Australia’s major banks, NAB (No.13), CBA (No.17), Westpac (No.21), ANZ (No.22) and St George (No.75) record combined net earnings of A$8.7 billion ($4.4 billion), a decrease of 11.3% from 2000. The key culprit here was invest-ment writedowns. For instance, NAB made a A$3.6 billion ex-traordinary writedown on its U.S.-based mortgage-servicing unit (HomeSide Lending) and substantial provisions for its exposure to Ansett’s collapse that resulted in bad debt charge soaring 73% to $897 million. These caused in a 36% plunge in net profit to A$2.1 billion ($1.1 billion). Along the same grain, CBA reported bad-debt rising 24% to A$385 million from the failure of major busi-nesses such as the NSW Grains Board and Pasminco which reduced its profi ts by 11% to A$2.4 billion.
Omitting these writedowns, the banks actually maintained a steady growth in underlying earnings from strong net interest and fee income, and con-tinued focus on cost control which saw cost-to-income ratios (CIRs) reduced from 58.6% to 53.2%. For instance, discounting the HomeSide provision, NAB’s earnings would have actually surged 19% to a record A$4 billion.
Interims for 2002 point to a more buoyant future Moving forth, Australian banks have defi ed tough global con-ditions to post record 1H2002 profi ts with CBA, NAB, Westpac
and ANZ making a combined underlying net profi t of A$5.5 billion ($3.1 billion), up 11%. Fuelling growth were house buyers and consumers taking advantage of low interest rates
which resulted in consumer lending portfolios growing 5% compared to a 2.6% decrease for the corporate sector. Also backing profi t expansion were tight control of costs translating to a further decline in CIRs to 50.9%, and a lift in non-interest income from fees or funds management operations. NPLs have also begun easing - NAB saw the fi gure dip from 0.8% to 0.75% in 1H, well off the last sector peak of 2.0% recorded during the early 1990s and even as their provisioning cover im-proved to 33.7% of gross NPLs from 30.6% previously.
No major NPL problemsAustralian banks weathered the Asia crisis without a signifi cant impact on their asset quality and maintain below average
levels of NPLs compared to global banks. Recent high profi le corporate collapses such as OneTel and Pasminco have rattled some observers, but are unlikely to blow out NPL ratios signifi -cantly given the ongoing quality of retail loan books.
While the economic downturn will no doubt decelerate revenue growth, Australian banks’ continued focus on credit control and cost reduction, combined with enhanced product offerings such as managed funds products to customers will minimise the impact.
191,555
117,785
97,048
94,823
25,971
15,805
15,668
15,163
14,922
14,236
1,065
1,226
973
956
207
193
182
202
172
124
13
17
21
22
75
117
119
124
126
131
1
2
3
4
5
6
7
8
9
10
National Australia BankCommonwealth Bank of AustraliaWestpac Banking Corp Australia & New Zealand Banking GroupSt George BankWestpac Banking Corporation (NZ)Bank of New ZealandSuncorp-Metway National Bank of NZ ^Macquarie Bank
Australia and New Zealand11 Australian and 5 New Zealand banks in TAB300. Total assets of banks in top 300: Aust $577.9bn; N.Z. $66.0bn. �Total profits: Aust $4.8bn; N.Z. $787mn. ROA: Aust 0.8%; N.Z. 1.2%. ROE: Aust 13.3%; N.Z. 21.7%
Commercial BankRank
0.6%
1.0%
1.0%
1.0%
0.8%
1.2%
1.2%
1.3%
1.2%
0.9%
8.8%
13.0%
19.6%
17.7%
11.2%
16.6%
24.6%
14.5%
19.1%
22.1%
0.8%
0.7%
1.1%
1.3%
0.5%
na
na
1.1%
0.5%
0.6%
ProfitabilityROA (%) ROE (%)
Profits($mn)
Assets($mn)
Top 300Rank
NPLRatio
^ NPL ratios: FY99/00 for National Bank of NZ. Source: Moody’s Credit Opinions (March 2002)Source: Asian Banker Research

64 The Asian Banker Journal
The Asian Banker Journal 65
Survey: Implementing CRM strategies progressing more
slowly than expectedThe initial fi ndings of a forthcoming regional survey by Asian Banker Research reveals that the IT architecture of many Asian banks is still failing to provide an adequate platform for effective, multi-channel Customer Relationship Management (CRM)
Asian Banker Research has developed a comprehensive research report – IT Infrastructure Profile, Benchmarks and Trends of Financial Institutions in Asia Pacifi c – profi ling the technologi-cal landscape, IT spending, investment justifi cation processes and key strategic challenges for the banking sector in the region. It also identifi es the perceived
future technological trends as seen through the eyes of CEOs, CIOs and senior managers of 50 banks who shape the strategic decisions vis-à-vis future IT infrastructure needs of fi nancial institu-tions in the region.
The survey reveals that many Asian banks have yet to build adequate IT plat-forms to support multi-product customer
relationship management. Banks’ IT ar-chitecture is not able to provide a unifi ed coherent real time customer view across different channels. IT platforms must improve for banks before banks can of-fer customers a genuine enterprise-wide CRM capability.
As in any other service-related in-dustry today, we are seeing a distinct evolution in the banking sector towards customer-centricity driven by increasing competitive pressure and diminishing margins. CRM is at the core of this propo-sition - the ability to identify customer segments, determine their worth and customize around their needs.
Unfortunately, for Asian banks, the drive to achieve an enterprise-wide CRM capability has been fraught with unfore-seen challenges. The survey findings identifi ed the biggest obstacles for banks in the region to a successful implementa-tion of CRM technology.
Challenges in implementing CRM technology...• The central challenge that many banks
face is in updating existing IT architec-ture, with limited or no consolidation of their customer information files (CIFs) on the core systems level.
• Once suitable architecture is in place the (often patchy) quality of the data held by banks on individual custom-ers can be improved through checking and cross-referencing across the differ-ent channels.
OPERATIONS & TECHNOLOGY
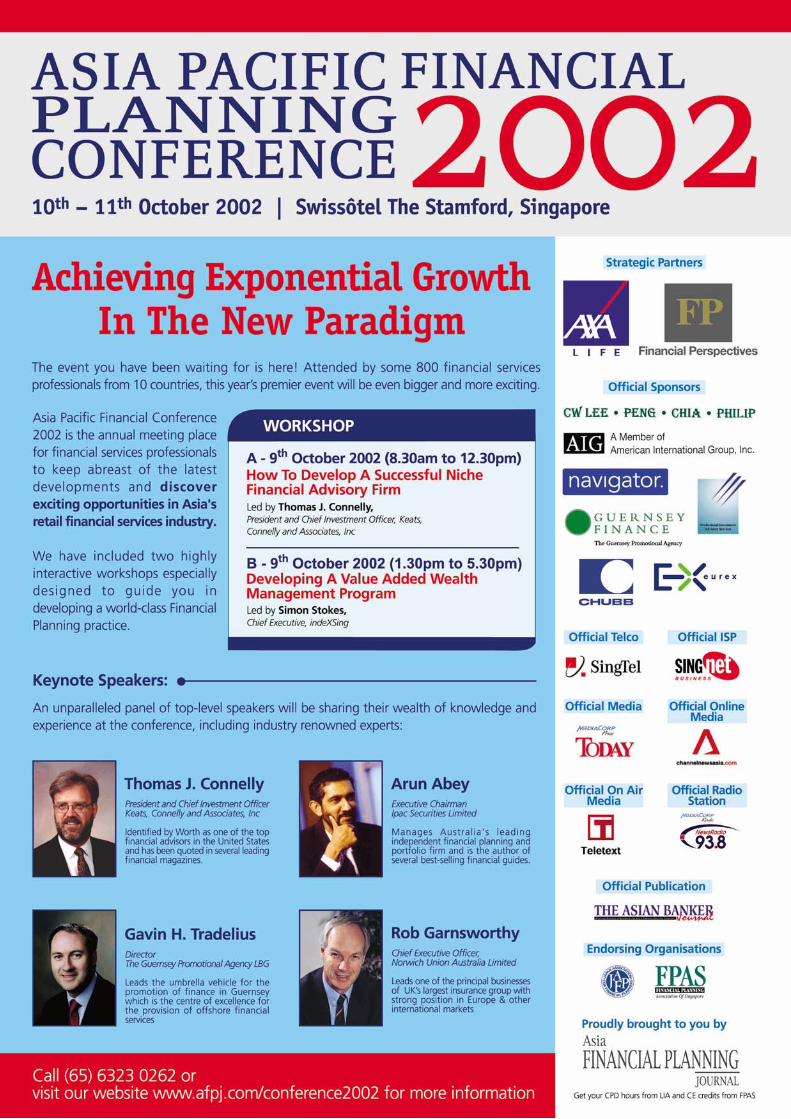
66 The Asian Banker Journal

The Asian Banker Journal 67
“Most banks still
view CRM as being an
excessive want rather
than an operational
necessity. Coupled by
its relatively high cost
of implementation
and long term
realization of returns,
it is often left on the
‘nice-to-have’ shelf in
many banks.“
Source: Asian Banker Research
No consensus on the nature of the biggest challenge
• The banks most likely to succeed are implementing a defi ned organizational structure to support the CRM initia-tive. Centralised senior management supervision of CRM solutions can minimize the confl icts between dif-ferent partiesin the process which are bound to arise.
• Regardless of the level of sophistication of the implemented CRM solution, the training and convincing of employees to utilize the technology for their benefi t is central to fully realize its potential.
• Banks often fail to appreciate the com-plexities and effort involved in pushing through a CRM initiative. The process involves endless rounds of data migra-tion, cleansing and testing.
• In these times of global economic uncertainties and depressed capital expenditures, most banks still view CRM as being an excessive want rather than an operational necessity. Coupled by its relatively high cost of implementation and long term realiza-tion of returns, it is often left on the ‘nice-to-have’ shelf in many banks.
There is evidence that some banks are starting to tackle the problem in a respon-sive way. When The Bank of Philippine Islands (BPI) first embarked on their CRM project, it took them some six to nine months to unify data from seven different sources before they were able
to begin extracting information, under-stand the quality of data and do round after round of cleansing. It was a painful exercise on its own, but BPI avoided the pitfall that many banks fall into thinking that they can go it alone own without external help, and usually ending up spending years trapped building their enterprise data warehouse and model. In BPI’s case, they engaged IBM, learning and understanding the processes before beginning to analyse their applications.
In addition to the initial challenges, they were also faced with debates on how the business side should organise themselves. There were the channel managers - who were transaction, vol-ume and sales-oriented, and then there were the marketing managers - who held the clients and were more relationship-oriented. Throw in a CRM solution that straddle the two parties, the conflicts inevitably arose. Thus to resolve such dis-putes, BPI appointed a project manager to oversee the entire process.
The concept of being able to integrate CRM technology is very appealing, unfortunately many banks are falling short of achieving unifi ed enterprise-wide implementation. Getting the fun-damental infrastructure in place, whilst important, is just the fi rst step. Banks have to realise that CRM is a collective effort, involving not just a piece of fan-tastic solution package, but the cultural and corroborative effort of the business units and distribution channels. This is where things get diffi cult.
OPERATIONS & TECHNOLOGY

68 The Asian Banker Journal
INTERVIEW
Hua Nan: Little incentive to pick up
small banksAs the pace of consolidation speeds up in Taiwan, Hsu Teh-Nan, president and CEO of Hua Nan Financial Holding Company (Hua Nan), discussed how it is positioned for the future under its new structure, NPLs, and the ongoing challenges of balancing political and commercial necessities.
“Banking used to be a comfortable kind line of business for a man to be in back in the early days”, reminisced Hsu Teh-Nan, president and CEO of Hua Nan. Hsu is a career veteran, who rose in the ranks from state-owned banks, private domestic banks and the Ministry of Finance (MoF). For banks like Hua Nan, whose clientele mirrors the competitive make-up of Taiwan, having collateral in real estate and other tangible assets were entrenched practices.
“With our small landmass and the cultural psyche of the Taiwanese towards owning land, collateral in real estate was a valid way to mitigate risk”. Now, it has become clearer that the practice is vulnerable to market risk as the economic landscape changes.
Hua Nan is the second largest listed domestic bank in Taiwan with total as-sets of $36 billion. The Taiwanese bank-ing market remains ripe for consolida-tion as, at the time of writing, there were no less than 53 domestic banks and over 400 credit unions and co-operatives. Un-der Hsu’s leadership, the bank has been transforming itself rapidly, grasping the need for reform with an urgency that has eluded some of its competitors in Taiwan. Hua Nan was one of the fi rst banks to re-structure itself under a fi nancial holding company. The bank has a clear strategy for how Hua Nan will participate in the overdue consolidation of the Taiwanese financial services industry. Hua Nan has developed a blueprint to build up its fi nancial services capabilities to become a super-market style, one-stop shop for customers through alliance partnerships
with overseas fi nancial institutions and through acquisitions.
Given his strong domestic customer base, Hsu is not particularly interested in acquisitions of smaller Taiwanese banks. Instead he feels that the bank should devote its energies and resources to broadening its lines of business by considering acquisitions in the insurance and securities market. Hua Nan is also taking steps to improve its CRM capabili-ties, enhancing its abilities to innovate and cross-sell new products.
Hsu’s vision is also apparent in Hua Nan’s pragmatic and proactive approach to resolving its NPL problems. The bank says that it has learnt from early mistakes and, working with other banks, has de-veloped a potent in-house capability to clear the remaining bad loans at improv-ing residual values and guard against the NPL problem rearing its ugly head in the future.
Hsu sees one of the bank’s core strengths as its customer base - ebul-liently referred to as a “gold mine” – many of whom are the small and me-dium enterprises (SMEs) that formed the backbone of Taiwan’s economy. The bank harbours ambitions of diversifying into retail banking, not contented with being merely a leader in trade fi nancing, and commercial deposits and loans. Change is also being stimulated by the MoF, who clearly understands the need to shape up the banking industry – fast – in the face of competition from across the straits in mainland China.
Despite the Financial Holding Com-pany Law, enacted in late 2001, and
other legislative reforms, Hsu acknowl-edged that consolidation got off to a slow start in Taiwan, but sees the proc-ess moving forward as inevitable. “The fi nancial holding companies will have no choice but to consolidate. The market will force the people to change because there will be no place for them if they do not.” Smaller banks, keen on holding out for better valuations, “will also have little choice but to sell off because their space in the market will slip once the full legal and regulatory infrastructure come in place.”
Hua Nan has become one of MoF’s few potential showcases for reform. It was one of the earliest to take the cue, and to be approved, to form a fi nancial holding company, following a share swap with EnTrust Securities. From Hsu’s perspec-tive, the success and failure of a fi nancial holding company depends on whether cross-management of the subsidiary companies is centred, like Hua Nan, around a strong bank. “That is why both Fubon and Cathay Financial Holding Companies, have been on the look-out for bank targets.” Both Fubon and Cathay are two of the larger domestic insurance centred financial groups in Taiwan. “They need to strengthen their exist-ing banks to become serious fi nancial services players. Even after integrating, cross-selling and scaling up will still be tough if their business culture and com-petence remain insurance or securities driven,” he explained.
“That is why Hua Nan is not inter-ested in acquiring another bank. We have already a big, outstanding bank

The Asian Banker Journal 69
Hsu Teh-Nan, President and CEO, Hua Nan Financial Holding Company

70 The Asian Banker Journal
to work on – there is little incentive for us to pick a smaller bank and really not worth the trouble of integrating two culturally different banks in that sense. What we need is an insurance or securi-ties target,” Hsu said rather candidly. Last year Hua Nan Bank contributed to some 90 percent of the holding com-pany’s consolidated revenue.
Hsu now faces new challenges cross-managing the bank and other subsidi-aries under the holding structure and allocating group resources to build up a portfolio of consumer fi nancing serv-ices. Incorporating a strong insurance company under its ambit would allow the bank to expand and diversify more effectively into the franchise and into fee-based income - a particularly attrac-tive avenue given that interest rate mar-gins in loans and deposits are shrinking. Hsu hinted, but could not reveal in full, that they are in the fi nal phase of discussions with a well-regarded Euro-pean fi nancial institution on a possible bancassurance alliance to beef up Hua Nan’s consumer banking capabilities. In order to test the readiness of the bank for multi-channel delivery, forty-eight branches have already been selected to pioneer cross selling.
Hsu said that Hua Nan is starting to leverage its core strengths more effec-tively, including its existing customer base, the deep spread of its collections franchise from its commercial accounts clearance business and and its long-established trade financing business. Hsu also wants to diversify away from these established franchises into con-sumer banking and challenge the major credit players already saturated in the market. Foreign players like Citibank, which has an estimated 1.5 million cardholders in the premium spending tier, have found fi erce competition from Chinatrust Commercial Bank, which leads the pack with more than 4 million cards in circulation.
Hsu is not intimidated by the competi-tion: “Remember, Chinatrust managed to transform itself within 5 years. We can do the same as well. We will bring in expertise to establish a sales culture - we already have a training centre to work on that, we have put in place performance target setting, evaluation and compensa-tion systems. We are not ruling out bring-ing external consultants to strengthen our system and, perhaps, reforming our
branches. We want to move aggressively into consumer credit card business and we want to grow our current credit card circulation of 409,000 by 24 percent, and then 30 percent and another 50 percent to reach a million within a year.”
Hsu acknowledged the need to pro-vide proper back-end support for these ambitious plans. “We are building our CRM capability, which will be ready within two years, and we plan to have a call centre at some point in time. We have been working jointly with IBM consultants to decide what kind of in-formation would we need for a CRM system, and in integrating our database.” In addition, we were told that the bank’s B-to-B, supplier management system which was embarked upon three years ago, will be linked to other banks and integrated with the national informa-tion infrastructure. Possibly because of their experiences in the designing of the system, Hsu has since been asked by the Ministry of Economic Affairs to chair a similar project comprising a consortium of nine other banks to design the same system for completion by June 2003.
Questions remain as to how these initiatives will be funded, considering that Hua Nan has a problem with NPLs and had recently announced its intention to write off NT$52.4 billion. The write of will send ROE deep into negative terri-tory (estimated at - 41.3 percent) despite a net profi t of NT$113 million. “That is why we will be writing-off such a large amount, rather than amortising it,” Hsu explained. Without the baggage of wres-tling with non-performing loans over too long a period, and with provisions nor-malising, Hua Nan can concentrate on working its ROE to a targeted average of 18 percent in the subsequent years. Hua Nan will seek to recapitalise and improve its capital adequacy ratio to above 8 per-cent through sub-debts issues.
These should fi nd a reasonable appe-tite from bond investors given that Hua
INTERVIEW
Nan’s credit quality remains good as refl ected by its A3 long-term senior debt rating from Moody’s. Hua Nan would be likely to receive a subordinated debt rat-ing at least as good as ChinaTrust’s Baa1 long-term bank deposit and senior debt ratings and a notch above Chinatrust’s Baa2 subordinated debt rating.
Of course, the NPL problem is not unique to Hua Nan, neither was it the only bank in Taiwan to write off such a huge amount to confront its bad debts issue. By March of 2002, the average ratio of NPL in Taiwanese banks was 8.04 percent. Market speculation has been rife that the NPL ratios were really higher than indicated by the Central Bank of China due to the defi nition of overdue loans in Taiwan being twice the 90 days required by international standards.
Behind the scenes, dealing with the NPL problem had been “very trying” for management. Together with earlier write-offs, the total write-offs amounted to 76 percent of Hua Nan’s total NPLs. Such a massive fi gure will drag its tier one ratio down to 5.9 percent in 2002 from 9.9 percent in 2001, even though it will be able to take advantage of tax savings. Hsu has had a particularly strong incentive to tackle the NPL problem as many of Hua Nan’s NPLs come from its core client base of SMEs. It was very important therefore to clear the decks. The exercise was clearly a learning process and the bank has done well to pull through success-fully after some early wrong turns. Hsu became quite animated on the subject.
“Why had it been tough?” Hsu asked rhetorically. “The reason why NPLs accu-mulated and why Taiwanese banks took so long to write off the debts was the lack of infrastructure available. Without a proper entity, auctioning off the NPLs re-quired us to go through the government, which took a long time. So, at that time, we engaged a team from Lehman Broth-ers to auction off NT$10 billion worth of NPLs. The task took about a year so we did not get very good returns from the sale, despite the fact that a good majority of our loans have very strong collaterals. Lehman Brothers told us that because of the time cost involved, it was not possible to redeem the NPLs at better returns. We need to account for that loss to our shareholders. And moreover, we had to pay 20 percent in commission.”
“So we formed our own team of expe-rienced professionals. We did numerous
“We are building our
CRM capability, which
will be ready within
two years.“

The Asian Banker Journal 71

72 The Asian Banker Journal
analyses and scenario studies.” This included studying the practices of other banks such as the widely viewed success of Korea’s Kookmin Bank in getting rid of NPLs in post-crisis Asia. But it was likewise recognised that the market conditions in Korea might be different from Hua Nan’s experiences in Taiwan as well as the lack of subsidies from the Taiwanese government to address the NPL issues. “There were many op-tions for us: outright sales to a foreign AMC, or to domestic AMCs, or dealing with it in-house. By which time, the Legislative Yuan had approved banks to form our own AMC equivalents. So we submitted the scenario analyses to the Chairman for consideration.” The board reached a unanimous consensus to write off the NPL in one sweeping act rather than to amortize it over a stretch of time periods.
“So by then, after gaining approval, some of us banks came together to form our own Financial Auction Serv-ices Company (FASC).” Hsu continued, “Without the pressure of time cost, we were able, through the FASC, to redeem a better value of between 60 percent and 100 percent from the collaterised loans for our shareholders.” Hsu added: “Cer-tainly, the FASC clearly turned out to be a better alternative.” Compared to past attempts at simply reclassifying restruc-tured loans, the use of FASC might also offer greater transparency in improving Hua Nan’s asset quality.
The experience with NPLs convinced management of the need for fresh talent. Staff, “qualifi ed by postgraduate degrees or pedigreed exposures and experiences in international fi nancial services and consultancies like KPMG and Andersen”, will be involved in building the group’s strategy and policies. Having overcome union objections, an early retirement programme for more than 350 senior employees has been implemented suc-
cessfully. A more performance-driven compensation structure has replaced the old seniority-based model.
Risk management short-comings are also being addressed. “The biggest chal-lenge in putting in place a risk manage-ment system is to know the source and level of risk and to be able to deal with it immediately.” Hsu attributed the im-petus to work on the system to Dresdner Bank, from whom they adopted a list of to suit their own operating environ-ment. In all likelihood, Dresdner (and its parent Allianz) could be just the sort of European partners that Hsu has hinted at.
“The whole system will be computer-ised and enable risk to be measured and handled at real-time.” The management had formed a team of experts to study credit risk, not just in the bank to meet the Basel II requirements by 2006 and prevent NPLs from rising above the na-tional 2.5 percent target, but to institute independent risk management units in all the subsidiaries of the holding com-pany. Three experts from Chinatrust Commercial were recruited to roll out the complete risk control and capital management system. “We are in the process of installing the funds transfer pricing system and the cost of funds will be rationalised.”
Rationalising the strategic and man-agement processes has helped Hsu to push the pace of change at Hua Nan. Hsu has been able to achieve this partly because Hua Nan is now less vulner-able to political interference and policy influences. The government has been reducing its controlling stake in Hua Nan, via its state-owned Bank of Taiwan, to less than 34 percent since 1997, and is expected to continue to down it to 20 percent in over fi ve years. This means that the days where government has a hand in the bank’s budgeting process is over. This has given Hua Nan a competi-
tive advantage because Bank of Taiwan, despite being the largest bank in Taiwan given its asset size, is still operating with all the appendages of a state bank. As Hua Nan’s largest shareholder (his-torically a mechanism of the then ruling party, Kuomingtan to control the private banks) this does not present a confl ict of interest for Bank of Taiwan. Rather, there remains a spirit of co-operation demon-strated by cross support in underwriting syndicate loans.
However, the bank’s remaining ties to government does mean that politi-cal issues will remain a thorn in Hsu’s side. In the larger Taiwanese banking institutions, a close circle of friendship and collegiate networking still remains among the policy makers, board mem-bers and senior career executives like Hsu. In a scenario where politically driven directives risk interfering with decision-making and pose a risk to the bank, executives like Hsu need to pro-tect the interest of the banks. Sensible terms will need to be struck to refl ect the risk of such ventures, possibly, in some cases, by persuading the govern-ment to help to underwrite that risk. The bureaucrats must be taught to rec-ognise that it is a commercial decision whether the bank should accept such a risk. Recently for instance, Hua Nan was asked to take over fi ve credit unions and cooperatives, laden with overdue debts, but was able to restructure and salvage the debt situation.
Going forward, one of Hsu’s greatest challenges will be the need to balance the implementation of contemporary business practices with an ability to negotiate with political policy makers, and well-connected family patrons. Executives like Hsu, with experience of the old ways and the new have the unique skills required to succeed in this tricky process.
During the interview, Hsu professed to be conservative, given his back-ground in credit auditing, which was apparent to us, despite what he char-acterised as an aggressive demeanour. Nonetheless, underlying the cultivated conservatism of a man groomed as a career bureaucrat in the state-owned banks, is an astute, politically savvy and well-connected businessman who is now professionally engaged in and committed to the running of a modern fi nancial institution.
”We were able through the FASC
to redeem a better value of between
60 percent and 100 percent from the
collaterised loans for our shareholders.”
INTERVIEW

The Asian Banker Journal 73
Andrew Long works towards a central processing culture at HSBC
Andrew Long, head of HSBC opera-tions and processing in Asia Pacifi c is building HSBC’s in-house centralised processing capability to pave way towards “central processing culture” within the organisation.
Last month, global banking giant HSBC rolled out its third Global Service Centre (GSC) in Shanghai. In addition to the service centres in Guangzhou, and in Hyderabad and Bangalore in India, HSBC also recently announced plans to open a sixth GSC in Malaysia in 2003.
According to the bank, its strategy is centred on keeping the ownership of core banking transaction processing. It has set up fully owned non-bank companies - run by HSBC management, system and staff resources - to carry out centralised processing.
In order to maintain high efficiencies in the centralised processing arrange-ment, these companies and business units incorporated performance bench-marks in their service level agreements. HSBC said these performance indica-tors were better than the indicators released when the same processing activities were carried separately in individual countries.
”The bank plans to build a total of fi ve or six GSCs to carry out centralised processing and act as contingency sites for each other,” says Andrew Long, head of HSBC operations and processing in Asia Pacifi c.
Long adds, “These initiatives will pave the way for the development of a central processing culture that will be differ-ent from the current country-specific processing culture.”
Currently, there are two centres working in Guangzhou and Hyderabad in addition to separate IT applications development centres in Guangzhou and Pune, India.
HSBC started working on a cen-tralised processing centre back in late 1998 when it decided to establish its first central processing centre in Guangzhao. This centre was later transferred to Hyderabad, which cur-
Andrew Long, HSBC, head of operations and processing, Asia Pacifi c
rently has a staff of 1,200. Work on the recently established processing centres in Shanghai and Bangalore was started in late 2000.
The bank said that in the next five years it would be increasing the number of staff in these GSCs as more workload is expected to f low into these centres due to greater process-ing centralisation.
Currently, these centres carry out basic banking transaction processing such as cross-border payments, funds transfer and check clearing. In the future, the bank plans to undertake a higher level of processing activities in addition to simple data entry work such as executive reporting from cen-tralised locations.
For non-core activities, HSBC is look-ing at outsourcing possibilities for a range of projects and processes on a case-by-case and country-by-country basis. The decision to outsource these activities is based on considerations of reputational risk, economic and contin-gency perspectives.
Currently, centres in India mostly process operations coming out of the UK, while Guangzhao is focused on Shanghai’s processing requirements. However, the bank said it will build com-mon processes and common platforms across different centres.
Long says that these centres will be increasing their share of work coming out of different locations. Such steps will also enable the sites to act as mutual back-ups so that if there would be problems with one site, work could be channelled to the other.
”It’s all paperless, it’s all image-based, with remote access to the systems. And it allows us to bring the economies of scale by bringing proc-esses together from different entities and from different countries. We can also achieve significant economies in terms of the wage differentials between high cost countries from which we’re taking work out to low cost countries where we’re putting the work,” Long explains.
PEOPLE
”It’s all paperless,
it’s all image-based,
with remote access
to the systems. And
it allows us to bring
the economies of scale
by bringing processes
together from different
entities and from
different countries.

74 The Asian Banker Journal
PARTNERS
Visa’s new CIO driving more powers down to regional centres
Inder P. Singh who was appointed to the newly created position of CIO at Visa International has been working on the dis-tributed processing environment strategy. A game plan to delegate six regional offi ce more powers to customise their solutions according to the local needs.
Inder P. Singh, CIO, Visa International
This will involve empowering the individual countries to modify the ap-plications to refl ect these changes.
“Over the years, Visa operated a closed loop Visanet system. What we are now implementing is a distributed process-ing environment, which will be tightly integrated with our existing Visanet system. The aim is to give the regions more fl exibility in offering customised local products”, Singh explained.
“We are harnessing the scale and ef-fi ciency of Visanet to drive more process-ing down to the regional level,” he added. “This approach will improve our ability to rapidly customise solutions.”
Singh joined Visa in November 2001 and was elevated to the newly created position of CIO in June this year.
He will be responsible for coordinat-ing IT processes and standards in four strategic directions: to ensure global interoperability of all Visa technology, maintain global service standards for transaction processing and data man-agement, and deliver system integrity and guide ongoing strategic initiatives including the deployment of Visa’s new
distributed systems architecture. Explaining his role in the new posi-
tion, Singh said, “it is my job to ensure the seamless continuity of products and services.”
For the local processing centres, Visa will use Unix machines and TCP/IP net-working with updated solutions.
Talking about the possibility of Visa outsourcing its transaction processing operation Singh said, “we are looking at opportunities for outsourcing where it makes sense.”
“Outsourcing brings value in terms of customer service and software develop-ment, but we have to see what will give best value to our members.”
Before joining Visa, Singh worked from 1978 to 1999 at SeaFirst Bank and later at Bank of America. There he de-veloped BOA’s overall delivery strategy for expansion in Asia and established the global retail business/technology and payment strategies for the bank. He also founded and headed Exlservices.com, a company that offered outsourc-ing services for customer care and backroom operations.
IBM will acquire PwC Consulting in a $3.5 bi l l ion deal, which IBM said would potentially expand its computer-services operation. IBM’s computer-services operation, already the world’s largest, made up 41 percent of the company’s total revenue last year. In 2000, Hewlett Packard negoti-ated for PwC Consulting in a reported $18 billion bid, but talks broke down when the companies were unable to agree on certain areas.
MALAYAN BANKING BHD (MAY-BANK) has signed a 10 million ringgit
($2.6 million) agreement with CL Com-puters, Opensys and Interdeals Auto-mation for the supply and installation of new high-capacity cash and cheque deposit self-service terminals (SSTs) at its e-Kawanku centres. Maybank said the enhanced protection features detect forged notes.
System Access has recently launched netSYMBOLS v8, the latest release of its fl agship product. System Access said that netSYMBOLS v8 is designed to incorporate cross-segment banking func-tionalities around a customer centric de-sign. System Access are re-branding the netSYMBOLS product as “SYMBOLS.”
STATE BANK OF INDIA has drawn up an IT strategy for the next fi ve years with plans to integrate online, real-time transactions processing, multiple deliv-ery channels, automated treasury and risk management systems into the core
News from partner organi-sations serving the fi nancial services community
PARTNER NEWS banking system. The bank said it has selected Datacraft to roll out the network connecting 1,500 branches, while Tata Consultancy Services will implement the core banking solution.
HSBC has signed a three-year, $2 million agreement with SAS Institute to provide HSBC’s Hong Kong operations with strategic decision-support applications for customer and business intelligence, management information reporting and advanced analytics.
UNION BANK OF INDIA (UBI) has implemented CashTech Solutions India’s cash management product, CashIn, to launch the bank’s collection product UnionSpeed, and its payment product UnionPrompt. CashTech says CashIn will allow UBI’s corporate clients to ef-fi ciently manage their cash fl ows through speedy and effi cient collections from all over the country.
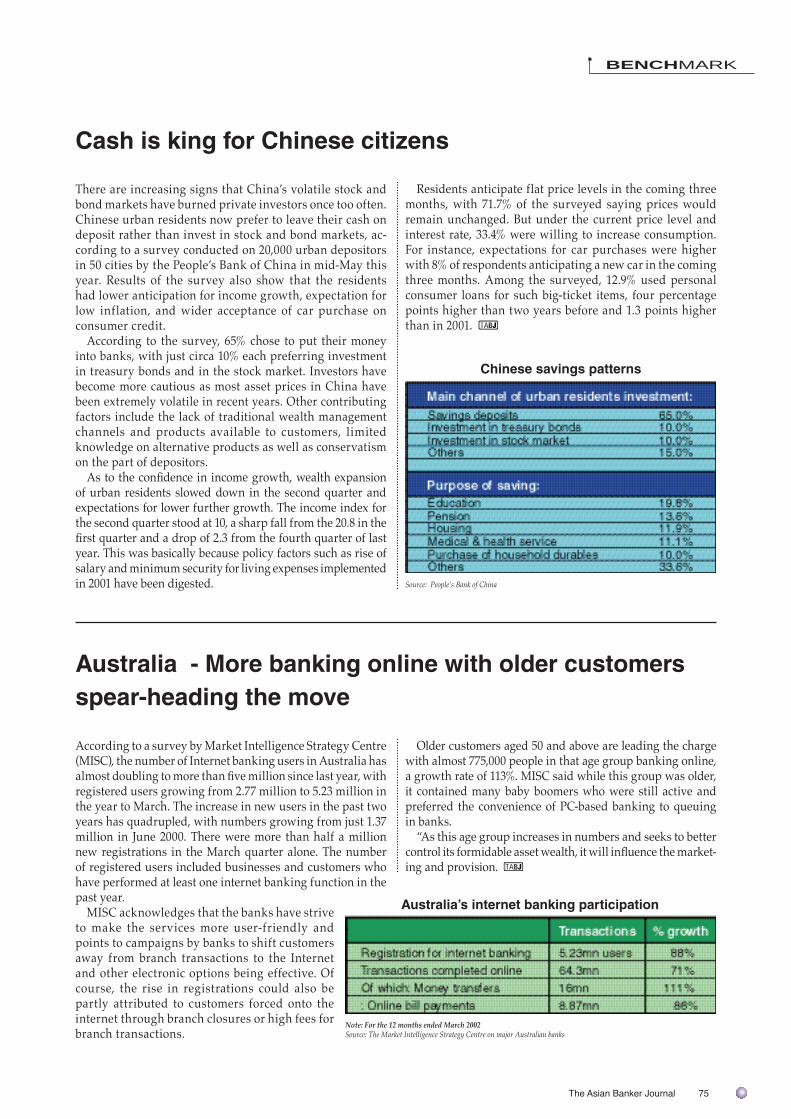
The Asian Banker Journal 75
BENCHMARK
Cash is king for Chinese citizens
There are increasing signs that China’s volatile stock and bond markets have burned private investors once too often. Chinese urban residents now prefer to leave their cash on deposit rather than invest in stock and bond markets, ac-cording to a survey conducted on 20,000 urban depositors in 50 cities by the People’s Bank of China in mid-May this year. Results of the survey also show that the residents had lower anticipation for income growth, expectation for low inflation, and wider acceptance of car purchase on consumer credit.
According to the survey, 65% chose to put their money into banks, with just circa 10% each preferring investment in treasury bonds and in the stock market. Investors have become more cautious as most asset prices in China have been extremely volatile in recent years. Other contributing factors include the lack of traditional wealth management channels and products available to customers, limited knowledge on alternative products as well as conservatism on the part of depositors.
As to the confi dence in income growth, wealth expansion of urban residents slowed down in the second quarter and expectations for lower further growth. The income index for the second quarter stood at 10, a sharp fall from the 20.8 in the fi rst quarter and a drop of 2.3 from the fourth quarter of last year. This was basically because policy factors such as rise of salary and minimum security for living expenses implemented in 2001 have been digested.
Chinese savings patterns
Source: People’s Bank of China
Residents anticipate flat price levels in the coming three months, with 71.7% of the surveyed saying prices would remain unchanged. But under the current price level and interest rate, 33.4% were willing to increase consumption. For instance, expectations for car purchases were higher with 8% of respondents anticipating a new car in the coming three months. Among the surveyed, 12.9% used personal consumer loans for such big-ticket items, four percentage points higher than two years before and 1.3 points higher than in 2001.
Australia - More banking online with older customers spear-heading the move
According to a survey by Market Intelligence Strategy Centre (MISC), the number of Internet banking users in Australia has almost doubling to more than fi ve million since last year, with registered users growing from 2.77 million to 5.23 million in the year to March. The increase in new users in the past two years has quadrupled, with numbers growing from just 1.37 million in June 2000. There were more than half a million new registrations in the March quarter alone. The number of registered users included businesses and customers who have performed at least one internet banking function in the past year.
MISC acknowledges that the banks have strive to make the services more user-friendly and points to campaigns by banks to shift customers away from branch transactions to the Internet and other electronic options being effective. Of course, the rise in registrations could also be partly attributed to customers forced onto the internet through branch closures or high fees for branch transactions.
Older customers aged 50 and above are leading the charge with almost 775,000 people in that age group banking online, a growth rate of 113%. MISC said while this group was older, it contained many baby boomers who were still active and preferred the convenience of PC-based banking to queuing in banks.
“As this age group increases in numbers and seeks to better control its formidable asset wealth, it will infl uence the market-ing and provision.
Australia’s internet banking participation
Note: For the 12 months ended March 2002 Source: The Market Intelligence Strategy Centre on major Australian banks

76 The Asian Banker Journal
Hong Kong bankruptcies and jobless rates hit record
The number of bankruptcies in Hong Kong hit a record high in the fi rst half of 2002 as the territory struggled to emerge from recession and battled mounting unemployment. Hong Kong recorded 10,173 personal and corporate bankruptcies in the fi rst six months of the year, surpassing a record 9,151 cases in the whole of 2001 and 2 times more than the 3,395 cases seen in the fi rst half of 2001. Hong Kong has been battered by two recessions in four years with unemployment swelling to a record high of 7.7% by end of 2nd quarter 2002, bringing the number of unemployed to 264,000. Labour demand remained slack with employers still cautious about staffi ng and many forecasters now expect the jobless rate to hit 8% before year-end.
Although higher bankruptcies can be attributable to the government’s decision to change bankruptcy laws and allow bankrupt individuals to start borrowing again after four years instead of the previous eight, analysts have also attributed the sharp rise to banks themselves. Heated competition has seem banks aggressively increasing consumer lending and giving away credit cards with all kinds of discounts and freebies in a bid to offset weak mort-gage demand. Hong Kong, which has a population of nearly seven million peo-ple, had 9.38 mil-lion credit cards in circulation (1.34 per capita) at the end of March, the Hong Kong Monetary Au-thority said.
Over-due card loans up
As bankruptcies mount, expired credit card loans soared. Overdue loans totalled HK$1.15 billion ($147 million) at end-March, up 44% from December 2001. The annualised credit card write-off ratio rose to 9.04% in the fi rst quarter of the year from 8.27% in the last quarter of 2001, with warnings that the numbers could hit double digits this year.
However, Hong Kong banks have stepped up measures to contain the runaway bankruptcy cases. For instance, Standard Chartered Bank, one of the leading credit card players in Hong Kong with 21% of the market, has cut credit limit on some 130,000 cardholders. Hang Seng Bank, Hong Kong’s third largest bank, is jacking up credit card interest rates to 35% and hiking late payment fees for clients who fail to make payments on time starting in August. Bankers have also been lobbying the govern-ment to allow them to share consumer credit data in a bid to stave off the growing number of bankruptcies.
BENCHMARK
Hong Kong - Unemployment rate (seasonally adjusted)
Source: HKMA
0.0
1.0
2.0
3.0
4.0
5.0
6.0
7.0
8.0
May
-97�
Aug
-97�
Nov
-97�
Feb-
98�
May
-98�
Aug
-98�
Nov
-98�
Feb-
99�
May
-99�
Aug
-99�
Nov
-99�
Feb-
00�
May
-00�
Aug
-00�
Nov
-00�
Feb-
01�
May
-01�
Aug
-01�
Nov
-01�
Feb-
02�
May
-02
%
Taiwan - government to penalize banks with high NPLs
According to a Financial Reform Committee draft plan, Tai-wanese banks might not be allowed to open new branches and simple banking units and give fi nancial rewards to board directors and supervisors if their overdue loan ratios cannot be shaved to below 8 percent by the end of 2002. The banks will also face restrictions on distributing profi ts to shareholders and employees whilst their reinvestment activities will be curbed.
This set of draft measures will be presented to Premier Yu Shyi-kun in early September. It is part of an overall fi nancial reform program, which aims to take concrete steps to cut the fi nancial institutions’ bad loan ratios.
In addition to beefi ng up the capital of the Cabinet’s Resolu-tion Trust Committee (RTC) fund, the panel has tentatively set a
target of lowering the average NPL ratio at all Taiwan banks to under 5 percent by the end of 2003. Banks will also be required to raise their capital adequacy ratio to 8 percent in two years. Moving to achieve that aim, the capital of the RTC fund will be raised to NT$ 900 billion from the original estimation of NT$150 billion made last year.
Under the principle of treating various banks according to their different levels of bad loan ratios, the banks with their ratios of NPLs reaching the level set by the government will see relaxed supervision of their business operations. On the contrary, those saddled with exceptionally high ratios will be subject to restrictions, including the closure of a certain percent-age of branches.

The Asian Banker Journal 77
RATINGS UPDATE
AU
STR
ALI
A
Sun
corp
Met
way
Ban
k W
este
rn A
ustr
alia
HO
NG
KO
NG
Hon
g K
ong
and
Sha
ngha
i Ban
k
IND
ON
ES
IA
P.T.
Ban
k N
egar
a In
done
sia
JAPA
N
Ban
k of
Tok
yo M
itsub
ishi
Sum
itom
o M
itsui
Ban
king
Cor
p
Miz
uno
Ban
k
Miz
uno
Cor
pora
te B
ank
UFJ
Ban
k
UFJ
Tru
st B
ank
KO
RE
A
Indu
stri
al B
ank
of K
orea
TAIW
AN
Fubo
n C
omm
erci
al B
ank
Chi
natr
ust F
inan
cial
Hol
ding
s
Chi
natr
ust C
omm
erci
al B
ank
Ch
an
ge
s in
Ba
nk
Rati
ng
s fo
r A
sia
as
at
Ju
ly 3
1,
20
02
Mood
y’s In
vest
ors S
ervic
eSt
anda
rd &
Poo
r’s
Fore
ign
Curre
ncy
Outlo
okLo
ng-T
erm
Deb
tFi
nanc
ial
Bk D
epos
it
Long
Ter
mSh
ort T
erm
Stre
ngth
Seni
orSu
bord
inat
eLT
Deb
tST
Deb
tOu
tlook
A2
Nega
tive
P1C+
A2A3
Aa3
B-C
D-
BBB
Coun
terp
arty
LT D
ebt
Cred
it
ST D
ebt
Wat
ch
Not
e: S
hade
d ar
eas
repr
esen
t adj
uste
d ra
tings
.
Stab
le
CP1
A1
A1St
able
E E E E E
Posit
ive
BBB-
BBB-
BBB+
A-2
A-3
A-3
A-2
Stab
le
Stab
le
Stab
le

78 The Asian Banker Journal
DATAFILES

The Asian Banker Journal 79

80 The Asian Banker Journal


