25


The Asseco Group’s ResultsQ1-Q3 2018
Warsaw, November 21, 2018 2

1.Summary of the Group's operations
3

Key events in Q1-Q3 2018
• Further growth at the level of revenues and operating profit in all business segments.
• The banking sector is the engine of growth in Poland.
• Continued increase in sales of Polish products abroad.
• Stronger position on the US market thanks to acquisitions of the Formula Group's companies.
4

Consolidated financial highlights for Q1-Q3 2018(vs. Q1-Q3 2017*)
PLN 6,678 mSales revenues
+24%
PLN 747 mEBIT non-IFRS
+48%
PLN 270 mNet profit non-IFRS
+41%
PLN 5,452 mProprietary software and services
+25%
PLN 902 mEBITDA
+41%
5* NOTE: Revenues, EBITDA, EBIT non-IFRS of Formula Group for August and September 2017 were not consolidated.

Consolidated financial highlights for Q1-Q3 2018(vs. Q1-Q3 2017 pro forma figures*)
PLN 6,678mSales revenues
+6%
PLN 747 mEBIT non-IFRS
+28%
PLN 270 mNet profit non-IFRS
+41%
PLN 5,452 mProprietary software and services
+6%
PLN 902 mEBITDA
+25%
6* Figures including Formula Group’s results for August and September 2017

Revenue structure – strong diversification into sectors
39%
40%
21%
Revenues
6,678 mPLN 1,762 2,073 2,238 2,478 2,602
1,581 1,9062,216 2,485 2,6521,056
1,0821,219
1,3241,424
Q1-Q3 2014 Q1-Q3 2015 Q1-Q3 2016 Q1-Q3 2017 PF* Q1-Q3 2018
General business Banking and finance Public institutions
7
* Data including Formula Group's revenues for August and September 2017; reported results, i.e. excluding Formula Group's revenues for August and September 2017 were as follows: General business PLN 2,141 million, Banking and finance PLN 2,111 million, Public Institutions PLN 1,152 million.

1,097 1,053 1,085 942 977
2,118 2,684 3,167 2,9353,914
8831,190
1,3471,464
1,555 1,805
Q1-Q3 2014 Q1-Q3 2015 Q1-Q3 2016 Q1-Q3 2017 Q1-Q3 2018
Asseco Poland Segment Formula Systems Segment
Formula Systems Segment VIII-IX 2017 Asseco International Segment
Significant share of foreign markets in the Group’s revenues
27%
15%
58%
Revenues
6,678mPLN
mPLN
Data for 2014-2017 after taking into account the changes in the structure of the Group, i.e. according to the structure of segments in 2018.Figures do not include consolidation adjustments. 8

Increase in the Group’s non-IFRS operating profit
26%
25%
49%747
mPLN
mPLN
9Data for 2014-2017 after taking into account the changes in the structure of the Group, i.e. according to the structure of segments in 2018.Figures do not include consolidation adjustments.
225 201 179 121186
189 257 308
215
36976
122148
162170
190
Q1-Q3 2014 Q1-Q3 2015 Q1-Q3 2016 Q1-Q3 2017 Q1-Q3 2018
Asseco Poland Segment Formula Systems Segment
Formula Systems Segment VIII-IX 2017 Asseco International Segment

* Additionally: consolidation adjustments resulting from transactions between sectors : -PLN 17.9 m,comparison to Q1-Q3 2017 pro forma data, i.e. including revenues of Formula Group VIII-IX 2017.
Asseco Group in Q1-Q3 2018 – geographical regions
977
3,914
1,805
6,678mPLN+6%
Asseco Poland Segment
• Continued increase in sales in the banking sector.• Development of sales of Polish products abroad - central banking systems,
omnichannel solutions in banking, solutions for the utilities sector.• ADS’s focus on cloud integration, digitization and offer for local governments.
Formula Systems Segment
• Increase in sales in Formula Group’s companies.• Positive results of Sapiens - improved profitability, dynamic growth on the US
market.• Acquisitions on the American and Israeli markets.
Asseco International Segment
• Significantly higher sales in the Asseco Central Europe Group, supported by the acquisition of CEIT and DWC Slovakia.
• Dynamic development on the South Eastern European market, especially in the area of payments.
10
Asseco Poland Segment
Formula Systems Segment
Asseco International Segment
+4%
+3%
+16%
Sales revenues*

The Group’s development – new acquisitions in Q1-Q3 2018
Alius Corp provides IT services in the areaof regulatory compliance and security forfinancial entities in the US market.
Purchase of stake by
a company from the Matrix
Group
PVBS LLC deals, among other things, with
the implementation and integration of ERP
systems for governmental entities or
entities providing services to the state,
operating on the American market.
Purchase of stake by a
company from the
Matrix IT Group
Purchase of stake by
Sapiens International
US software producer specializing insolutions for insurance companies.
11
Purchase of stake by
Asseco Central Europe
Prosoft analyzes, designs, develops and implementsIT systems for the healthcare sector.
Purchase of stake by
Asseco Central Europe
DWC is engaged in the implementation of processmanagement and document management systems,providing solutions related to ERP systems anddatabases.
Acquisitions on the US market::
Acquisitions on the Israeli market:
Cambium develops Internet and mobile applications in the field of customer service and information management systems in the General Business segment, mainly on the Israeli market.
Purchase of stake by
Matrix IT
Integrity Software provides IT solutions in the field of information security, content management systems and infrastructure for companies on the Israeli market.Purchase of stake by
Matrix IT
Acquisitions on the Central European market:

Banking and finance sector
1,5811,906
2,2162,485 2,652
Q1-Q3 2014 Q1-Q3 2015 Q1-Q3 2016 Q1-Q3 2017* Q1-Q3 2018
Revenues (in mPLN) Formula Systems Segment VIII-IX 2017
Q1-Q3 2018 Q1-Q3 2017 PF*
Change
Asseco Poland Segment 356.5 331.0 +8%
Formula Systems Segment 1,687.8 1,567.2 +8%
Asseco International Segment 617.2 608.1 +1%
Asseco Group** 2,652.2 2,484.6 +7%
Revenues (in mPLN)
* Data including Formula Group's revenues for August and September 2017; reported results, i.e. excluding Formula Group's revenues for August and September 2017 reached 2,110.5 and the change +26%.** Data including consolidation adjustment.
• Increase in sales in Poland - modifications aimed at adjusting to legal changes, sales of banking solutions abroad.
• Development of the Formula Systems Group on the American market.
• Growth in South Eastern Europe, especially in the area of payments.
12
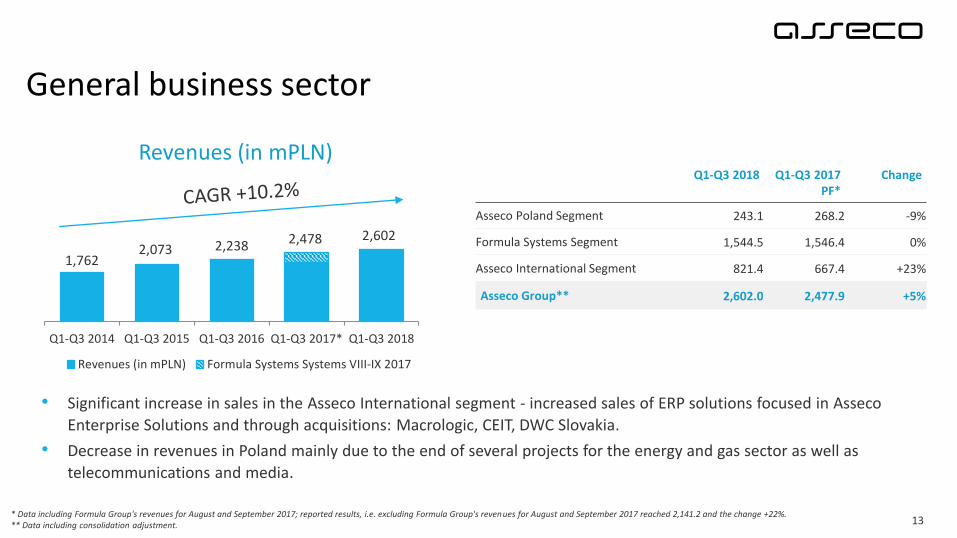
General business sector
1,7622,073 2,238 2,478 2,602
Q1-Q3 2014 Q1-Q3 2015 Q1-Q3 2016 Q1-Q3 2017* Q1-Q3 2018
Revenues (in mPLN) Formula Systems Systems VIII-IX 2017
• Significant increase in sales in the Asseco International segment - increased sales of ERP solutions focused in Asseco
Enterprise Solutions and through acquisitions: Macrologic, CEIT, DWC Slovakia.
• Decrease in revenues in Poland mainly due to the end of several projects for the energy and gas sector as well as
telecommunications and media.
Q1-Q3 2018 Q1-Q3 2017 PF*
Change
Asseco Poland Segment 243.1 268.2 -9%
Formula Systems Segment 1,544.5 1,546.4 0%
Asseco International Segment 821.4 667.4 +23%
Asseco Group** 2,602.0 2,477.9 +5%
13* Data including Formula Group's revenues for August and September 2017; reported results, i.e. excluding Formula Group's revenues for August and September 2017 reached 2,141.2 and the change +22%.** Data including consolidation adjustment.
Revenues (in mPLN)

Public institutions sector
1,0561,082 1,219
1,324 1,424
Q1-Q3 2014 Q1-Q3 2015 Q1-Q3 2016 Q1-Q3 2017* Q1-Q3 2018
Revenues (in mPLN) Formula Systems Segment VIII-IX 2017
• Significant increase in revenues in the Asseco International segment, mainly thanks to higher sales of Asseco Central
Europe.
• New contracts in the public sector (Poland, Czech Republic), increased revenues in the area of health (Poland, Slovakia).
Q1-Q3 2018 Q1-Q3 2017 PF*
Change
Asseco Poland segment 377.0 342.7 +10%
Formula Systems segment 682.2 704.2 -3%
Asseco International segment 366.5 279.2 +31%
Asseco Group** 1,424.1 1,323.7 +8%
14* Data including Formula Group's revenues for August and September 2017; reported results, i.e. excluding Formula Group's revenues for August and September 2017 reached 1,151.8 and the change +24%** Data including consolidation adjustment.
Revenues (in mPLN)

Consolidated order backlog for 2018 vs. 2017
1,093 1,118
4,462 4,606
1,368 1,598
2017 2018
Proprietary software and services
6,923 7,322
+3%
+17%
+2%1,374 1,325
4,985 5,154
1,936 2,307
Sales revenues
8,294 8,786
+3%
+19%
-4%Asseco Poland Segment
Formula Systems Segment
Asseco International Segment
Figures in mPLN;When calculating the backlog for 2018 according to the exchange rates used for calculating the backlog for 2017, the change amounts to: +8% in total revenues/+8% in proprietary software and services.Value of the backlog for 2018 as at November 15, 2018; value of the backlog for 2017 as at November 10, 2017. 15

Financial Information
16

Revenues and operating result of the Asseco Group
Figures in millions of PLN* Revenues. EBITDA. EBIT non-IFRS of Formula Group for August and September 2017 were not consolidated.**Non-IFRS figures including adjustments for amortization charges on intangible assets recognized in purchase price allocation (PPA) as well as for the costs of share-based payment (SBP) transactions with employees.
Q1-Q3 2018
Q1-Q3 2017*
Δ Q3
2018Q3
2017* Δ
Revenues 6,678.3 5,403.5 +24% 2,218.4 1,241.5 +79%
Proprietary software and services 5,452.1 4,363.7 +25% 1 852.9 972.3 +91%
EBITDA 902.1 641.3 +41% 301.3 172.7 +74%
EBITDA margin 13.5% 11.9% +1.6 p.p. 13.6% 13.9% -0.3 p.p.
Operating profit non-IFRS** 746.8 505.7 +48% 247.1 132.6 +86%
Operating profit marginn non-IFRS 11.2% 9.4% +1.8 p.p. 11.1% 10.7% +0.5 p.p.
PPA & SBP** -188.1 -79.3 +137% -59.5 -15.4 +287%
Operating profit 558.7 426.4 +31% 187.6 117.2 +60%
Operating profit margin 8.4% 7.9% +0.5 p.p. 8.5% 9.4% -1 p.p.
17

Revenues and operating result of the Asseco Group
Figures in millions of PLN* Data including Formula Group's results for August and September 2017.**Non-IFRS figures including adjustments for amortization charges on intangible assets recognized in purchase price allocation (PPA) as well as for the costs of share-based payment (SBP) transactions with employees.
Q1-Q3 2018
Q1-Q3 2017 PF*
Δ Q3
2018Q3
2017 PF* Δ
Revenues 6,678.3 6,286.2 +6% 2,218.4 2,124.2 +4%
Proprietary software and services 5,452.1 5,129.6 +6% 1,852.9 1,738.2 +7%
EBITDA 902.1 721.5 +25% 301.3 252.9 +19%
EBITDA margin 13.5% 11.5% +2 p.p. 13.6% 11.9% +1.7 p.p.
Operating profit non-IFRS** 746.8 581.7 +28% 247.1 208.6 +18%
Operating profit marginn non-IFRS 11.2% 9.3% +1.9 p.p. 11.1% 9.8% +1.3 p.p.
PPA & SBP** -188.1 -128.1 +47% -59.5 -64.2 -7%
Operating profit 558.7 453.6 +23% 187.6 144.4 +30%
Operating profit margin 8.4% 7.2% +1.2 p.p. 8.5% 6.8% +1.7 p.p.
18

19
Reconciliation of operating profit and net profit
Q1-Q3 2018 Q1-Q3 2017 Δ Q3 2018 Q3 2017 Δ
Operating profit non-IFRS* 746.8 505.7 +48% 247.1 132.6 +86%
Operating profit 558.7 426.4 +31% 187.6 117.2 +60%
Interest expense -34.1 -25.9 -12.6 -6.1
Foreign currency transactions 26.3 -36.0 7.5 0.1
Other -14.4 286.2 -4.5 295.7
of which: gain/loss on transactions associated with company acquisitions
-7.2 -24.3 0.5 -20.4
gain/loss on transactions associated with company sales -4.0 318.8 -3.6 317.8
dividends paid to non-controlling shareholders -3.6 -5.0 -3.0 -0.7
Pre-tax profit 536.5 650.8 -18% 178.0 406.9 -56%
Income tax -125.4 -111.8 +12% -37.0 -50.4 -27%
effective tax rate 23.4% 17.2% +6.2 p.p. 20.8% 12.4% +8.4 p.p.
Share of profits/losses of associates -1.8 -40.5 - 0.3 -39.8 -
Net profit 409.3 498.5 -18% 141.3 316.7 -55%
Net profit attributable to shareholders of the parent company 235.3 398.6 -41% 78.0 285.3 -73%
Net profit attributable to shareholders of the parent company non-IFRS*
269.7 191.1 +41% 88.3 64.3 +37%
Figures in mPLN*Non-IFRS figures including adjustments for: the cost of amortization of intangible assets recognized under the combination settlement (PPA). the costs of share-based payment transactions with employees (SBP). the costs and financial revenues resulting from the transactions of purchase and sales of companies (M&A) and tax effects associated with them.
359.0: result due to loss of control over the Formula Group before tax and less transaction costs
-42.4: write-down of deferred payment from the sale of shares in R-Style Softlab
2.2: Other transactions
-16.0: write-down on investment in Sintagma-2.1: write-down on investment in Asseco Georgia-1.0: write-down on investment in Asseco
Kazakhstan-0.9: write-down on investment in Asseco Nigeria-4.3: Other transactions
-38.8: write-down on the investment in R-Style Softlab’s associated entity
-1.7: Other

Financial results of regions and subsidiaries*Sales revenues Operating profit non-IFRS**
Net profit – contribution toAsseco Poland non-IFRS**
Q1-Q3 2018
Q1-Q3 2017 PF
Q1-Q3 2018
Q1-Q3 2017 PF
Q1-Q3 2018
Q1-Q32017
Asseco Poland Segment 976.6 941.9 186.1 120.8 134.5 79.3Asseco Poland (without dividends) 641.8 602.1 145.2 94.2 116.6 40.3
Asseco Data Systems 259.0 228.8 23.7 17.6 19.0 13.3Other companies 117.4 153.2 18.4 13.4 6.9 1.9
adjustments -41.6 -42.2 -1.2 -4.4 -8.1 23.8Formula Systems Segment 3,914.5 3,817.8 368.7 291.4 32.4 24.4
Matrix IT 2,299.7 2,226.6 168.3 161.7 15.2 21.1
Magic Software 756.9 738.0 102.9 99.2 8.7 12.6
Sapiens Int. 772.3 759.7 95.4 29.9 8.3 2.0Other companies 100.1 102.9 2.1 2.9 0.3 -10.8
adjustments -14.5 -9.3 0.0 -2.2 0.0 -0.4
Asseco International Segment 1,805.1 1,554.7 190.5 169.9 101.3 87.6Central European Market 857.5 683.1 109.5 87.7 57.8 51.2
South Eastern European Market 448.9 410.6 51.7 44.6 23.8 20.1Western European Market 496.2 450.8 36.8 40.3 26.4 18.8Eastern European Market 5.5 8.9 0.2 -2.5 0.7 -2.8
Other companies 4.2 2.3 -7.5 -1.0 -7.2 -0.4adjustments -7.3 -1.0 -0.2 0.8 -0.2 0.8
Consolidation adjustment -17.9 -28.2 1.5 -0.4 1.5 -0.1
Asseco Group 6,678.3 6,286.2 746.8 581.7 269.7 191.1
20
Figures in mPLN*Results of segments in 2018 and 2017 according to the structure as at 30.09.2018; data 2017 - pro forma, i.e. including Formula Group for August and September 2017. **Non-IFRS figures including adjustments for: the cost of amortization of intangible assets recognized under the combination settlement (PPA). the costs of share-based payment transactions with employees (SBP). the costs and
financial revenues resulting from the transactions of purchase and sales of companies (M&A) and tax effects associated with them.

Cash generated
Figures in mPLN*Free cash flow (FCF) (CFO+CAPEX) (CAPEX excluding investments in investment properties, less financing)** Free cash flow FCF / EBIT non-IFRS
213.8
84.1
184.5
369.5
229.5
44.1
246.5 301.1
121.0 106.9
-6.2
426.7
133.2 148.3 137.8
102%
83%91%
100% 99%93%
100%93%
82%
92%
71%
87% 85% 81%86%
25%
45%
65%
85%
105%
125%
-50
0
50
100
150
200
250
300
350
400
450
Q1 2015 Q2 2015 Q3 2015 Q4 2015 Q1 2016 Q2 2016 Q3 2016 Q4 2016 Q1 2017 Q2 2017 Q3 2017 Q4 2017 Q1 2018 Q2 2018 Q3 2018
Asseco Group
55.4
21.1
73.5
134.4
22.0
-14.2
75.6 68.4
-…
39.6
-19.0
77.0
11.6
87.7
50.3
114%
83%
106%
156%143%
127%136%
75% 68%
110%
60%73% 75% 94%
124%
0%
25%
50%
75%
100%
125%
150%
-40
-20
0
20
40
60
80
100
120
140
160
Q1 2015 Q2 2015 Q3 2015 Q4 2015 Q1 2016 Q2 2016 Q3 2016 Q4 2016 Q1 2017 Q2 2017 Q3 2017 Q4 2017 Q1 2018 Q2 2018 Q3 2018
Asseco Poland
FCF* cash conversion ratio 12 mths**
21

1,544.7
+586.4
-104.4 -306.2
-149.9
+34.8
1,484.0
Środkipieniężne na01.01.2018*
CFO CIT CFI CFF FX Środkipieniężne na30.09.2018*
Cash balance as at 30.09.2018*
22
Explanation of change in cash balance*
Cash from investment activity:
M&A acquisitions -164.0
CAPEX+R&D -154.9
Borrowings +21.7
Other -9.0
Total -306.2
1
1 2
Cash from finance activity:
Dividend paid by Asseco Poland -249.8
Dividends for minority shareholders -155.6
Debt +175.0
Capital issue +90.7
M&A -12.9
Other +2.7
Total -149.9
2
*Net cash and cash equivalents include bank credits on current account used for current liquidity management
Cash balance as at 01.01.2018*

Stable liquidity position (Asseco Poland)As at 30.09.2018
ST LT
Cash and financial assets 208.3 14
Debt and finance lease: -38.3 111.0
Bank loans -15.3 -42.5
Assets serving as bank loan collateral* - 181.2
Finance lease liabilities -23.0 -27.7
Net cash (ST) 170.0
Inventories + ST receivables – ST liabilities KT** 210.5
Net operating assets (ST) 380.5
Available bank loan facilities 570.0
Figures in millions of PLN* The book value of real estate serving as bank loan collateral.** Inventories + short-term receivables + short-term prepayments – short-term liabilities excluding bank loans and finance lease liabilities. 23

Legal disclaimerThe contents of this presentation are copyright protected and constitute proprietary information. All texts, graphics,photographs, sound, animations and videos, as well as their layout in the presentation are protected under the Acton copyright and related rights as well as by other applicable regulations. Unauthorized use of any materialscontained in this presentation may constitute an infringement of copyright, trademark or other laws. Materialsavailable in this presentation cannot be modified, reproduced, disclosed or performed in public, distributed or usedfor other public or commercial purposes, unless it is expressly permitted in writing by Asseco Poland S.A. Copying forcommercial use, distribution, modification or acquisition of the contents of this presentation by third parties isstrictly prohibited. This presentation may include references to product and service offerings of third parties. Theterms and conditions for the use of third-party products and services are defined by such third parties. AssecoPoland S.A. will in no way be responsible or liable for the conditions or consequences of using such third-partyproducts and services. The data and information contained herein constitute general information only.
The name and logo graphic of Asseco Poland S.A. are registered trademarks. Any use of these trademarks shallrequire prior express consent of Asseco Poland S.A.
2015 © Asseco Poland S.A. 24

25


