The assessment of automatic irrigation scheduling techniques on tomato yield and water productivity under a subsurface drip irrigation system in a hyper arid region
H. M. Al-Ghobari Agricultural Engineering Department, College of food and Agriculture sciences, King Saud University, Saudi Arabia
Abstract
Water research studies in Saudi Arabia clearly showed the severe depletion of groundwater, therefore the necessity to water saving and conservation in agriculture is essential, especially in Saudi Arabia, where the water resources are scarce and the climatic condition is hyper arid. The irrigators are looking for more efficient scheduling and methods of irrigation than the traditional sprinkler and surface irrigation. Subsurface drip irrigation (SDI) with efficient irrigation scheduling can be a viable alternative where water is limited or when the irrigation capacity is insufficient with traditional methods. The scheduling methods used to irrigate the cop were evapotranspiration ET controllers (ET controller), soil moisture sensors (watermark sensor) and control irrigation (control treatment) based on weather data. These irrigation scheduling methods have not been evaluated for field crop under severe arid condition common to Saudi Arabia. This study indicates that there was a saving in irrigation water by 5.84% and 20.8% in the case of the ET controller compared to the other two methods respectively. Also, there was an increase in the yield by using ET controllers compared to watermark (Wmark) sensors and control treatments by 7.89% and 11.33%, respectively. However, the control treatment showed relatively high water uniformity and this could be due to high water application compared to other treatments. The ET controller technique may provide a valuable tool for scheduling irrigation in tomato farming and may be extendable for use in other similar agricultural crops. Hence, the ET controller irrigation technique could be
WIT Transactions on Ecology and The Environment, Vol 185, www.witpress.com, ISSN 1743-3541 (on-line)
recommended due to its easy application and greater water savings in areas experiencing severe drought, such as Saudi Arabia. Keywords: subsurface irrigation, scheduling methods, water uniformity, water use efficiency, ET controller, smart irrigation.
1 Introduction
Efficient utilization of available water resources is crucial for a country like the Kingdom of Saudi Arabia, where water consumption in agriculture could constitute more than 85% of the total annual water consumption. The sustainability of agricultural production depends on conservation and appropriate use and management of scarce water resources especially in arid and semi-arid areas, where irrigation is required for the production of food and cash crops (Douh and Boujelben [1, 2] and Douh et al. [3]). With increasing demands on limited water resources and need to minimize adverse environmental consequences of irrigation, hence, irrigation systems will need to become more efficient to minimize the use of increasingly limited water resources, while maintaining crop yield of acceptable quality to consumers. Subsurface drip irrigation (SDI) is a relatively new technology that can be very efficient in terms of water use (Lamm and Trooien [4]) and will undoubtedly play an important role in the Saudi Arabia agriculture. SDI is used to provide water to a substantial portion of the plant root system while maintaining a relatively dry soil surface (Hanson and May [5]). Subsurface drip irrigation system may increase water use efficiency due to reduced soil and plant surface evaporation and because only the root zone or the partial root zone is irrigated as opposed to sprinkler irrigation where the entire field area is wetted. Lamm and Trooien [4] reviewed 10 years of SDI research on corn in the Great Plains of USA and reported that water savings of 35% to 55% were possible compared to traditional forms of irrigation such as sprinkler and furrow. It was found that when crops were irrigated by SDI yields were equal to or greater than those obtained by surface drip system (Strange [6]; Singh et al. [7]). This can be attributed to factors affecting evaporation from top soil (Camp [8]), as burying of the lateral pipe in SDI reduces the evaporation from top soil surface (Phene et al. [9]). Automation of SDI systems based on evapotranspiration controllers or soil moisture sensors may further improve water use efficiency. A wide range of scheduling techniques can contribute to save water and improve the water use efficiency and productivity (Castilla [10]). Sousa [11] found that the use of SDI with soil moisture balance resulted in significantly less irrigation water applied (129 mm) compared to a surface drip irrigation (220 mm). Irrigation events may be scheduled based on, measured soil moisture, climatic parameters and estimated evapotranspiration (ET) coupled with crop coefficients specific to the region. Many methods of irrigation scheduling have been proposed in order to measure the amount of water the crops need. There are three methods for matching irrigation with crop water requirements: the weather-based methods using ETr, the soil water-based methods using soil moisture sensors and the soil–water-balance calculations and plant stress-sensing techniques (Jones [12]). Evapotranspiration-
WIT Transactions on Ecology and The Environment, Vol 185, www.witpress.com, ISSN 1743-3541 (on-line)
based irrigation controllers, also known as ET controllers, use ET information or estimation to schedule irrigation. Mayer et al. [13] found that ET controllers reduced irrigation by 6.1%; and it was found that 56.7% of the sites were responsible for a significant decrease in irrigation application, while 41.8% were responsible for a significant increase. Davis and Dukes [14] demonstrated that that the ET controllers applied only half of the irrigation calculated for the theoretical requirement for each irrigation event, on average, irrigation adequacy decreased when the ET controllers were allowed to irrigate any day of the week. Davis et al. [15] found that ET controllers can match irrigation application with seasonal demand and in particular reduce irrigation in the winter when plant demands are dramatically reduced. In addition, they point out that when ET controllers are applied to sites irrigating at levels less than plant demand, those controllers will likely increase irrigation. Automation of SDI systems based on evapotranspiration controllers or soil moisture sensors may further improve water use efficiency. Commercially available irrigation controllers that use evapotranspiration (ET) data to apply the proper amount of irrigation water to a landscape are being used in United States of America. However, this technology has not been tested with field crops in a hyper arid region such as Saudi Arabia. The main objective of the study was to investigate the effectiveness of the subsurface drip irrigation system with different scheduling techniques on tomato yield, water application uniformity and water use efficiency
2 Materials and methods
2.1 Experimental layout
The experiments were conducted during the two seasons of 2011 and 2012 at the Experimental Farm of the College of Food and Agriculture Sciences of King Saud University, Riyadh. The experimental site was irrigated by a subsurface irrigation system. The field was further divided into three plots (Figure 1a). Before the start of the experiment, intact soil cores were collected from different locations in the field to determine soil physical properties including soil mechanical analysis. Locations were selected to represent the dominant soil conditions in the field. Three soil samples were taken from the field at three different depths (0–20, 20–30 and 30–50 cm) to determine soil texture. The soil was loamy sand (85.9% sand, 6% silt and 8.1% clay). Subsurface irrigation systems were installed in the field. Buffer distances of approximately 3 m separated each plot to reduce environmental influences between them. The SDI systems consisted of 16 mm inside diameter, thin-wall drip lines with welded-on emitters (GR, 50 cm dripper spacing) with a nominal emitter discharge of 4 L/h. Drip lines were buried 20 cm deep directly under the soil beds in plots 1, 2 and 3 (Figure 1a). After the SDI installation, the soil surface was leveled and firmed. Irrigation amounts were metered separately in each plot using commercial municipal-grade flow accumulators. The irrigation time varied between treatments because of the three different methods of irrigation scheduling
WIT Transactions on Ecology and The Environment, Vol 185, www.witpress.com, ISSN 1743-3541 (on-line)
used. The hydraulic aspects of SDI design for each plot aimed to obtain uniform application of irrigation water. The uniformity of water application for each scheduling method below the soil surface through the soil profile was determined by measuring gravimetric moisture contents from soil samples taken 24 hours after three irrigations. The samples were collected parallel and perpendicular to the lateral irrigation line at distances of 0, 5, 10, 15, 20 and 25 cm from the emitter location as shown in (Figure 1b). The gravimetric soil samplings at each depth (0, 10, 20, 30, 40, and 50 cm) were repeated three times after irrigation (24 hour). These measurements were taken from each plot three times during mid-season of tomato crop.
Figure 1: Field experimental layout (a) and diagram showing sampling for soil moisture contents parallel and perpendicular for the direction of the irrigation line (b).
Three methods of irrigation scheduling were used to determine both the timing and amount of water to be applied to a tomato crop by subsurface irrigation system. The irrigation scheduling in plots 1 was controlled by evapotranspiration controller (ET controller), the ET-based controllers are irrigation scheduling devices that consider weather based parameters when determining irrigation events. Depending on the manufacturer, each controller functions differently but typically can be programmed with various conditions specific to the field. These conditions could include soil type, plant type, root depth, sun and shade, etc. The ET controller has the ability to add water to the crop when it was needed based on controlled evapotranspiration and weather data. The ET controller (Hunter pro-c – note, the use of the trade name does not imply promotion of this product; it is mentioned for research purposes only) was purchased as commercially-available equipment and was programmed using the manuals provided by the manufacturers according to site specific conditions. Plots 2 was controlled by automatic watermark soil moisture sensors, the initiation and termination of irrigation in this scheduling technique was based on
WIT Transactions on Ecology and The Environment, Vol 185, www.witpress.com, ISSN 1743-3541 (on-line)
soil moisture measured by watermark sensors installed 5 cm above the drip line. Automatic scheduling for plot 2 was set at 10% soil moisture content as the low limit and 20% as the high limit (on–off). The other scheduling treatment for plot 3 (control treatment) was manually irrigated based on weather data collected from an automatic weather station installed at the experimental site and Penman–Monteith equation (Monteith [16]) was used to calculate evapotranspiration (ET). Each plot was approximately 4.5 m wide and 7 m long and had 5 rows of drip lines spaced 0.9 m apart. Tomato plants were spaced 0.50 m apart in each row, the 5 drip lines in each plot were connected to a common sub-main irrigation line at the inlet side of the plot and a common flush line and flush valve at the distal end of the plot (Figure 1a).
2.2 Water use efficiency and uniformity
Irrigation water used efficiency (IWUE) was calculated as the ratio between the total fresh yield of crop (Y) and the seasonal applied irrigation water (Dg)t, (Michael [17]). The IWUE was calculated using the following equation:
tgDYIWUE (1)
In this equation, Y is the tomato fresh yield (kg m-3and (Dg)t is the amount of seasonally applied irrigation water (mm). To calculate the ETc and the irrigation water requirements of tomato, daily ETo values were first determined using the meteorological station and then multiplied by the crop coefficient. The irrigation system in each plot was operated based on the scheduling method used; turned on and off manually in control treatment and automatically in ET controller and watermark sensor treatments. The depths of irrigation water (Dg) applied each irrigation event for all plots were calculated separately from the differences of flow meter readings before and after irrigation. Assessment of the uniformity of water redistribution in the soil profile was carried out under subsurface system. The coefficient of uniformity developed by Christiansen [18] applied to soil gravimetric moisture contents measured at six soil depths (0, 10, 20, 30, 40, and 50 cm), and at different distances from emitter (10, 15, 20 and 25 cm) in parallel and perpendicular directions to the drip line as shown in Figure 1b. The soil water contents were measured 24 hours after water application ceased. The evaluation tests were carried out three times starting from the beginning until the end of season. The equation used to evaluate the uniformity (Cus) of water redistribution below the soil surface was determined gravimetrically using eqn (2):
NCu i1100s (2)
NN
ii /
1
WIT Transactions on Ecology and The Environment, Vol 185, www.witpress.com, ISSN 1743-3541 (on-line)
where: Cus = Christiansen’s coefficient of uniformity of soil water content below soil surface θi = the measured gravimetric soil water content at depth i θ = the mean gravimetric soil water content, and N = number of measured points
3 The results and discussions
3.1 Crop evapotranspiration (ETc)
The daily and weekly averages of the ETc rates for tomato crops under control treatment in plot 3 were calculated using the daily records during the two growing seasons (Table 1). The values of ETc were derived by the product of the reference evapotranspiration (ETo) and the crop coefficient (Kc) for different stages of tomato crop development. From this table, it can be noted that the weekly and seasonally values of ETc for tomato crop under control treatment in plot 3 were shown in Table 1. It is obvious that ETc values were small in early 2 weeks and then increased with the development of plants.
Table 1: Average weekly ETc for tomato under subsurface drip system for control treatment during the two seasons.
Average ETc (mm/day) 5.12 Total ETc/season (mm) 609.38
3.2 Irrigation management
The averages of weekly and seasonally of total water applied (m3), irrigation depth (Dg) and the accumulated Dg to the tomato crops by three scheduling techniques were calculated and tabulated in Table 2. It can be noticed that the averages of
WIT Transactions on Ecology and The Environment, Vol 185, www.witpress.com, ISSN 1743-3541 (on-line)
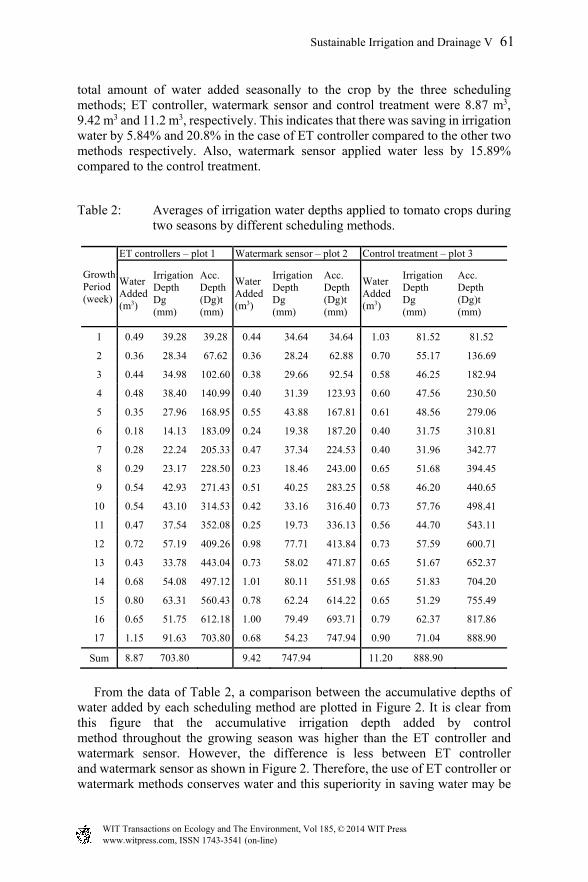
total amount of water added seasonally to the crop by the three scheduling methods; ET controller, watermark sensor and control treatment were 8.87 m3, 9.42 m3 and 11.2 m3, respectively. This indicates that there was saving in irrigation water by 5.84% and 20.8% in the case of ET controller compared to the other two methods respectively. Also, watermark sensor applied water less by 15.89% compared to the control treatment.
Table 2: Averages of irrigation water depths applied to tomato crops during two seasons by different scheduling methods.
Growth Period (week)
ET controllers – plot 1 Watermark sensor – plot 2 Control treatment – plot 3
Sum 8.87 703.80 9.42 747.94 11.20 888.90 From the data of Table 2, a comparison between the accumulative depths of water added by each scheduling method are plotted in Figure 2. It is clear from this figure that the accumulative irrigation depth added by control method throughout the growing season was higher than the ET controller and watermark sensor. However, the difference is less between ET controller and watermark sensor as shown in Figure 2. Therefore, the use of ET controller or watermark methods conserves water and this superiority in saving water may be
WIT Transactions on Ecology and The Environment, Vol 185, www.witpress.com, ISSN 1743-3541 (on-line)
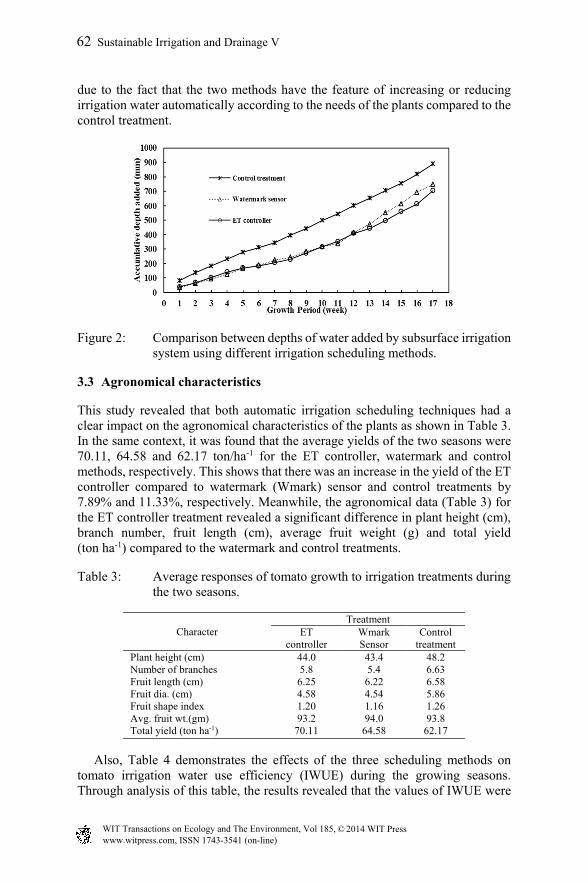
due to the fact that the two methods have the feature of increasing or reducing irrigation water automatically according to the needs of the plants compared to the control treatment.
Figure 2: Comparison between depths of water added by subsurface irrigation system using different irrigation scheduling methods.
3.3 Agronomical characteristics
This study revealed that both automatic irrigation scheduling techniques had a clear impact on the agronomical characteristics of the plants as shown in Table 3. In the same context, it was found that the average yields of the two seasons were 70.11, 64.58 and 62.17 ton/ha-1 for the ET controller, watermark and control methods, respectively. This shows that there was an increase in the yield of the ET controller compared to watermark (Wmark) sensor and control treatments by 7.89% and 11.33%, respectively. Meanwhile, the agronomical data (Table 3) for the ET controller treatment revealed a significant difference in plant height (cm), branch number, fruit length (cm), average fruit weight (g) and total yield (ton ha-1) compared to the watermark and control treatments.
Table 3: Average responses of tomato growth to irrigation treatments during the two seasons.
Character Treatment
ET controller
Wmark Sensor
Control treatment
Plant height (cm) 44.0 43.4 48.2 Number of branches 5.8 5.4 6.63 Fruit length (cm) 6.25 6.22 6.58 Fruit dia. (cm) 4.58 4.54 5.86 Fruit shape index 1.20 1.16 1.26 Avg. fruit wt.(gm) 93.2 94.0 93.8 Total yield (ton ha-1) 70.11 64.58 62.17
Also, Table 4 demonstrates the effects of the three scheduling methods on tomato irrigation water use efficiency (IWUE) during the growing seasons. Through analysis of this table, the results revealed that the values of IWUE were
WIT Transactions on Ecology and The Environment, Vol 185, www.witpress.com, ISSN 1743-3541 (on-line)
higher in the ET controller treatment (Table 4). The tomato yield, in the case of ET controller treatment, was resulted more yield (70.11 ton h-1) compared to the yield of the two other scheduling methods for average of two seasons (Table 3). Similar trend was observed for IWUE, the average values of IWUE were 9.97, 8.64 and 6.99 kg m-3 for ET controller, watermark sensor and control methods, respectively (Table 4). However, the results indicated that irrigation water was used more effectively through ET controller treatment.
Table 4: Average of IWUE under different scheduling methods during the two seasons.
Irrigation treatments
Subsurface irrigation
Total water applied Total yield (ton ha-1)
IWUE (kg m-3) (mm) m-3 h-1
ET Controller 703.80 7038.0 70.11 9.97 Watermark sensor 747.49 7474.9 64.58 8.64 Control treatment 888.90 8889.0 62.17 6.99
Hence, the results in Tables 3 and 4 indicated that Scheduling method of ET controller gave the highest values of total yield and IWUE and applied less irrigation water compared to watermark sensor method and control method, respectively. The lower amounts of water used with ET controller method correspond inversely with higher water use efficiency, this agrees with the results noted by Faberio et al. [19], Topak et al. [21] and Almarshadi and Ismail [20]. Similar findings were also obtained by Wan and Kang [22], who found that a low irrigation frequency resulted in higher water use efficiency values when compared to a high irrigation frequency. The decreased of IWUE observed under the watermark sensor and control methods can be attributed to the increasing level of applied irrigation water.
3.4 Water uniformity distribution
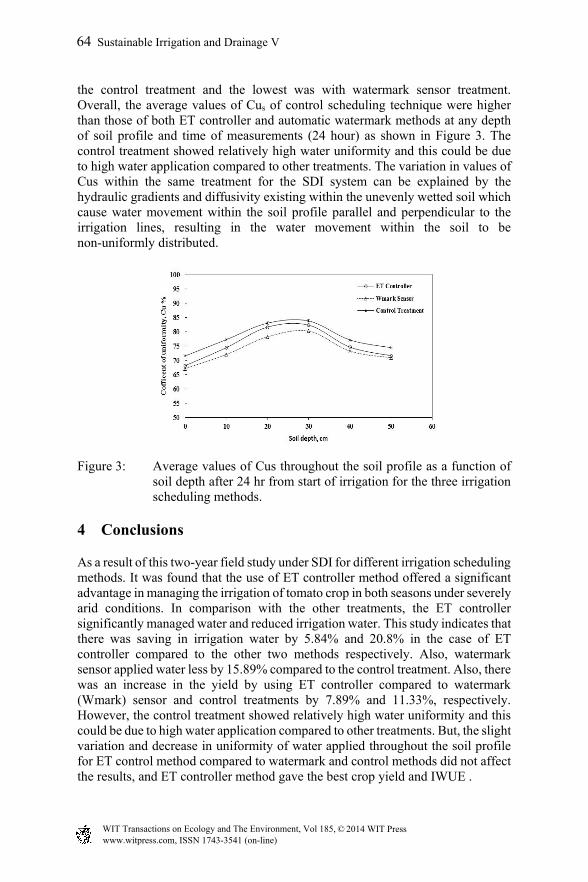
An essential amount of work has been done to evaluate the uniformity of water redistribution below the soil surface. The water redistribution patterns under subsurface irrigation systems for the three scheduling methods were determined at different depths below the soil surface as shown in Figure 3. Uniformity data of water distribution in the root zone area for all treatments after 24 from irrigation in parallel and perpendicular direction to the lateral irrigation line at distances of 0, 5, 10, 15, 20 and 25 cm from the emitter location and at various depths from soil surface (0, 10, 20, 30, 40, and 50 cm) were shown in Figure 3. It indicated that water uniformity distributions show clear distribution trend. This trend is a decrease in uniformity of water redistribution near the soil surface layer (0–10 cm) and the gradual increase with depth with maximum distribution uniformity near the emitter (20–30 cm) and hence decreased gradually with depth to the lowest values at 50 cm depth for all treatments. The highest uniformity was obtained with
WIT Transactions on Ecology and The Environment, Vol 185, www.witpress.com, ISSN 1743-3541 (on-line)
the control treatment and the lowest was with watermark sensor treatment. Overall, the average values of Cus of control scheduling technique were higher than those of both ET controller and automatic watermark methods at any depth of soil profile and time of measurements (24 hour) as shown in Figure 3. The control treatment showed relatively high water uniformity and this could be due to high water application compared to other treatments. The variation in values of Cus within the same treatment for the SDI system can be explained by the hydraulic gradients and diffusivity existing within the unevenly wetted soil which cause water movement within the soil profile parallel and perpendicular to the irrigation lines, resulting in the water movement within the soil to be non-uniformly distributed.
Figure 3: Average values of Cus throughout the soil profile as a function of soil depth after 24 hr from start of irrigation for the three irrigation scheduling methods.
4 Conclusions
As a result of this two-year field study under SDI for different irrigation scheduling methods. It was found that the use of ET controller method offered a significant advantage in managing the irrigation of tomato crop in both seasons under severely arid conditions. In comparison with the other treatments, the ET controller significantly managed water and reduced irrigation water. This study indicates that there was saving in irrigation water by 5.84% and 20.8% in the case of ET controller compared to the other two methods respectively. Also, watermark sensor applied water less by 15.89% compared to the control treatment. Also, there was an increase in the yield by using ET controller compared to watermark (Wmark) sensor and control treatments by 7.89% and 11.33%, respectively. However, the control treatment showed relatively high water uniformity and this could be due to high water application compared to other treatments. But, the slight variation and decrease in uniformity of water applied throughout the soil profile for ET control method compared to watermark and control methods did not affect the results, and ET controller method gave the best crop yield and IWUE .
WIT Transactions on Ecology and The Environment, Vol 185, www.witpress.com, ISSN 1743-3541 (on-line)
Hence, it can be concluded that an economic amount benefit can be achieved with saving large amounts of irrigation water when applying advance scheduling irrigation techniques using subsurface irrigation systems with ET controller under arid conditions. These outcomes indicate the importance of adopting the ET controller due to its effectiveness in providing irrigation water, which requires extraordinary effort to obtain especially in arid regions which suffer from water scarcity, such as Saudi Arabia. As well, this system will improve irrigation practices and ultimately minimize labor efforts.
Acknowledgements
The researchers wish to thank The National Plan for Science and Technology (King Saud University in cooperation with King Abdul-Aziz City for sciences and Technology) for providing funds to undertake this study through Grant No. 11-AGR1476-02.
References
[1] Douh, B. and Boujelben, A. Improving water use efficiency for a sustainable productivity of agricultural systems with using subsurface drip irrigation for maize (Zea mays L.), Journal of Agricultural Science and Technology B1 (JAST), pp. 881-888, 2011.
[2] Douh, B. and Boujelben, A. Subsurface drip irrigation and water management under semiarid climate. pp. 181-198, In Advances in Environmental Research, Eds: Justin A. Daniels, Nova Publisher Vol. 22, p. 249, 2012.
[3] Douh B., Boujelben A., Khila S., Mguidiche, B.A. Effect of subsurface drip irrigation system depth on soil water content distribution at different depths and different times after irrigation. Larhyss Journal, No. 13, pp. 7-16, 2013.
[4] Lamm, F. R. and Trooien, T. P. Subsurface irrigation for corn production: a review of 10 years of research in Kansas Irrigation Science 22: 195-200, 2003.
[5] Hanson, B. and May, D. Effect of subsurface drip irrigation on processing tomato yield, water table depth, soil salinity, and profitability. Agric Water Manage 68, 1-17, 2004, 2004.
[6] Strange M.L. Newsletter for onions and garlic for Fresno, Tulare and Kings Counties. University of California Cooperative Extension. No. 4437, 2005.
[7] Singh, D.K., Rajput, T.B.; Sikarwar, H.S; Sahoo, R.N; Ahmed, T. Simulation of soil wetting pattern with subsurface drip irrigation from line source. Agric Water Manag 83:130-134, 2006.
[8] Camp, C. R. Subsurface drip irrigation: A review. Transactions of the ASAE, 41: 1353-1367, 1998.
[9] Phene CJ, Hutmacher RB, Ayers JE, Davis KR, Mead RM, Schoneman, R.A. Maximizing water use efficiency with subsurface drip irrigation. ASAE Paper No. 92-2059, presented at International Summer Meeting, Charlotte, NC, 21-24 June, p. 27, 1992.
WIT Transactions on Ecology and The Environment, Vol 185, www.witpress.com, ISSN 1743-3541 (on-line)
[10] Castilla, N. Greenhouse drip irrigation management and water saving. Cahiers Options Mediterranean’s Vol. 31: 21-26, 2000.
[11] Soussa, H. K. Effects of drip irrigation water amount on crop yield, productivity and efficiency of water use in desert regions in Egypt. Nile Basin Water Science& Engineering Journal, Vol. 3, Issue 2, 96-109, 2010.
[12] Jones, H. Irrigation scheduling: advantages and pitfalls of plant based methods. J Exp Bot 55(407): 2427-2436, 2004.
[13] Mayer, P., W. DeOreo, M. Hayden, R. Davis, E. Caldwell, T. Miller, and Bickel, P. J. Evaluation of California weather-based “smart” irrigation controller programs. Final report for the California Department of Water Resources. Sacramento, Cal.: California Urban Water Conservation Council. Available at: www.aquacraft.com/sites/default/files/pub/ Aquacraft, 2009.
[14] Davis, S. L. and Dukes, M. D. Landscape irrigation with evapotranspiration controller in a humid climate. Trans. ASABE 55(2): 571-580, 2012.
[15] Davis, S.L., Dukes, M.D., Miller, G.L. Irrigation scheduling performance by evapotranspiration-based controllers. Agr. Water Manage. 98 (1):19-28, 2010.
[16] Monteith J. L. Evaporation from land surfaces: progress in analysis and prediction since 1948. In: Advances in evapotranspiration, proceedings of the national conference on advances in evapotranspiration, Chicago, IL, Am SocAgricEng, St. Joseph, Michigan, pp 4-12, 1985.
[17] Michael, A. Irrigation and theory practice. Vikas Pub. House PVT LTD, New Delihi, 1978.
[18] Christiansen J.E. Irrigation by Sprinkling. California Agriculture Experiment Station Bulletin, No. 670. University of California, Berkley, USA. 1942.
[19] Fabeiro, C.; de Santa Olalla F. Martin; de Juan, J. A. Production of muskmelon (Cucumis mela L.) under controlled deficit irrigation in a semi-arid climate, Agricultural Water Management, 54, 93-105, 2002.
[20] Almarshadi M.H. and Ismail S.M. Effects of precision irrigation on productivity and water use efficiency of alfalfa under different irrigation methods in Arid Climates. J. Appl Sci Res, 7(3): 299-308, 2011.
[21] Topak R; Suheri, S; Acar B. Effect of different drip irrigation regimes on sugar beet (Beta vulgaris L.) yield, quality and water use efficiency in Middle Anatolian, Turkey. Irrig Sci (2011) 29: 79-89, 2011.
[22] Wan, S. and Kang, Y. Effect of drip irrigation frequency on radish (Raphanus sativus L.) growth and water use. Irrigation Science. 24: 161-174, 2006.
WIT Transactions on Ecology and The Environment, Vol 185, www.witpress.com, ISSN 1743-3541 (on-line)