An Investigation on User Communication Behavior in an Interactive Whiteboard Technology Environment CHIA-CHENG SHEN 1 , HUAN-MING CHUANG 2 1,2 Department of Information Management National Yunlin University of Science and Technology 123 University Road, Section 3, Douliou, Yunlin 64002, Taiwan, R.O.C. TAIWAN [email protected]http://www.mis.yuntech.edu.tw/ Abstract: - Interactivity is the key characteristic in interactive whiteboard technology (IWT). This study aims to provide a better understanding of communication behavior in IWT. This research’s objective is to investigate the effects of the interactivity level on a user’s attitude and intention toward the use of IWT. As a result, we cite the technology acceptance model (TAM) to support this research. Specifically speaking, our test consisted of system characteristics (interactivity) and extrinsic motivation (TAM), in an integrated theoretical framework of IWT behavior. A survey of 340 elementary school students found strong support for the model. We used the confirmatory factor analysis (CFA) to examine the measurement model, and applied structure equation modeling to access the empirical strength of the relationships in the proposed framework. Overall, the conclusions were placed into two categories: methodological and theoretical. On the methodological front, we demonstrate the development of a reliable and valid measure that captures a critical construct to understand IWT behaviors. On the theoretical front, the results reveal that attitude and behavioral intention are directly/indirectly affected by interactivity, perceived ease of use, and perceived usefulness. Key-Words: - Interactive whiteboard technology (IWT), Interactivity, Technology Acceptance Model (TAM) 1 Introduction E-learning has recently become a promising alternative to traditional classroom learning, helping society move toward a vision of lifelong and on- demand learning [23]. It has become one of the fastest-moving trends and aims to provide a configurable infrastructure that integrates learning material, tools, and services into a single solution to create and deliver training or educational content quickly, effectively, and economically [20]. In a small-scale study of Information and Communication Technology in primary schools, interactive whiteboard technology (IWT) was found to be the predominant information communication technology (ICT) tool used by teachers [16]. Many studies reported on the significance of IWT in classrooms [4], [6]. IWT can help teachers, students, trainers, and school district office personnel with their work. It can save every step of student's work, which can be played back and used for assessment. It cites that collaboration on complicated problems have become much easier to understand when it is done with a whiteboard [4]. Furthermore, it points out that some interactive whiteboard software can hide portions of the screens to be revealed at one's discretion [4]. The early interactivity studies, however, did not propose a complete theoretical framework and only concerned the perception of its users. Some studies primarily offered guidelines [31], but waited for others to specify their findings. Moreover, other studies solely focused on the characteristics or dimensions of interactivity [32], [33]. Teo et al. offered a structure model, but didn’t concern the interactivity of uses’ perceptions [38]. However, McMillan and Hwang validated the measures of perceived interactivity (MPI) offering researchers a tool for measuring a consumer perception [19]. As the results mentioned above, in this research, we adopted MPI to measure the user perceived interactivity, and proposed an integrated model combined with a technology acceptance model [5] to provide a better understanding of IWT. In this paper, we use a quantitative modeling framework to develop a structure model that embodies the components of a compelling IWT experience. We use data collection from a sample which is an experienced elementary school student’s WSEAS TRANSACTIONS on COMMUNICATIONS Chia-Cheng Shen, Huan-Ming Chuang ISSN: 1109-2742 184 Issue 1, Volume 8, January 2009
Transcript
An Investigation on User Communication Behavior in an InteractiveWhiteboard Technology Environment
CHIA-CHENG SHEN 1, HUAN-MING CHUANG 2
1,2 Department of Information ManagementNational Yunlin University of Science and Technology
123 University Road, Section 3, Douliou, Yunlin 64002, Taiwan, R.O.C.TAIWAN
Abstract: - Interactivity is the key characteristic in interactive whiteboard technology (IWT). This study aimsto provide a better understanding of communication behavior in IWT. This research’s objective is to investigatethe effects of the interactivity level on a user’s attitude and intention toward the use of IWT. As a result, we citethe technology acceptance model (TAM) to support this research. Specifically speaking, our test consisted ofsystem characteristics (interactivity) and extrinsic motivation (TAM), in an integrated theoretical framework ofIWT behavior. A survey of 340 elementary school students found strong support for the model. We used theconfirmatory factor analysis (CFA) to examine the measurement model, and applied structure equationmodeling to access the empirical strength of the relationships in the proposed framework. Overall, theconclusions were placed into two categories: methodological and theoretical. On the methodological front, wedemonstrate the development of a reliable and valid measure that captures a critical construct to understandIWT behaviors. On the theoretical front, the results reveal that attitude and behavioral intention aredirectly/indirectly affected by interactivity, perceived ease of use, and perceived usefulness.
1 IntroductionE-learning has recently become a promisingalternative to traditional classroom learning, helpingsociety move toward a vision of lifelong and on-demand learning [23]. It has become one of thefastest-moving trends and aims to provide aconfigurable infrastructure that integrates learningmaterial, tools, and services into a single solution tocreate and deliver training or educational contentquickly, effectively, and economically [20].
In a small-scale study of Information andCommunication Technology in primary schools,interactive whiteboard technology (IWT) was foundto be the predominant information communicationtechnology (ICT) tool used by teachers [16]. Manystudies reported on the significance of IWT inclassrooms [4], [6]. IWT can help teachers, students,trainers, and school district office personnel withtheir work. It can save every step of student's work,which can be played back and used for assessment.It cites that collaboration on complicated problemshave become much easier to understand when it isdone with a whiteboard [4]. Furthermore, it pointsout that some interactive whiteboard software can
hide portions of the screens to be revealed at one'sdiscretion [4].
The early interactivity studies, however, didnot propose a complete theoretical framework andonly concerned the perception of its users. Somestudies primarily offered guidelines [31], but waitedfor others to specify their findings. Moreover, otherstudies solely focused on the characteristics ordimensions of interactivity [32], [33]. Teo et al.offered a structure model, but didn’t concern theinteractivity of uses’ perceptions [38]. However,McMillan and Hwang validated the measures ofperceived interactivity (MPI) offering researchers atool for measuring a consumer perception [19].
As the results mentioned above, in this research,we adopted MPI to measure the user perceivedinteractivity, and proposed an integrated modelcombined with a technology acceptance model [5]to provide a better understanding of IWT.
In this paper, we use a quantitative modelingframework to develop a structure model thatembodies the components of a compelling IWTexperience. We use data collection from a samplewhich is an experienced elementary school student’s
WSEAS TRANSACTIONS on COMMUNICATIONS Chia-Cheng Shen, Huan-Ming Chuang
ISSN: 1109-2742 184 Issue 1, Volume 8, January 2009
survey. We use this sample to measure theseconstructs and fit a series of structural equationmodels that test related prior theories includinginteractivity, and technology acceptance model(TAM).
2 Theoretical foundation andhypotheses2.1 E-learningExtensive research has shown that students benefitfrom e-learning [21]. Some of the benefits are that it:provides time and place flexibility; results in costand time savings for educational institutions; fostersself-directed and self-paced learning by enablinglearner-centered activities; creates a collaborativelearning environment by linking each learner withphysically dispersed experts and peers; and allowsknowledge to be maintained and updated in amoretimely and efficient [8].
2.2 Interactive whiteboard technology (IWT)Most IWT literatures are highly positive about theimpact and the potential of the technology [14], [24],[30]. Therefore, some of the advantages associatedwith the use of IWT that it identifies are: (a) itfacilitates the effective integration of multimedia inthe traditional ICT classroom [14], it facilitates thedesign of activities/materials which are tailored tomeet the needs of students with diverse learningstyles [30], (b) its use to enhance motivation,interaction and collaborative learning in theclassroom [25], and (c) it has a positive impact onstudents’ and teachers’ developments of ICT skillsand attitudes towards the use of computers forteaching– learning [10]. However, these studiesalso mention some drawbacks of IWBs technology,such as (a) teachers’ concern about making lessonsmore teacher-centered if too much focus is given tothe IWBs technology [9] and (b) teachers’feeling ofineptitudes and lacks of competence concerningtheir knowledge of ICT [9].
2.3 InteractivityInteractivity is a person-to-person or person-to-technology exchange designed to effect a change inknowledge or behavior of at least one person [35].The degree to which a communication system canallow one or more end users to communicatealternatively as senders or receivers with one ormany other users or communication devices, eitherin real time or on a store-and-forward basis, or to
seek and gain access to information on an on-demand basis where the content, timing andsequence of the communication are under control ofthe end users, as opposed to a broadcast basis [36].Hoffman and Novak identified two levels ofinteractivity: machine interactivity at the low endand person interactivity at the high end [37].Machine interactivity refers to the extent to whichusers can participate in modifying the form andcontent of a mediated environment in real time.Person interactivity is defined as interactivitybetween people that occurs through a medium or isunmediated, such as in the case of face-to-facecommunication [38].
Therefore, machine interactivity is interactivitywith the medium, while people interactivity is theinteractivity through the medium. Szuprowicz [39]further divides machine interactivity into twodifferent levels: user-document interactivity atwhich level users are not able to influence ormanipulate file contents and user-systeminteractivity at which level users can manipulate thecontent by changing its characteristics. At the levelof user-user interactivity defined by Szuprowicz[39], users operate real time to create responseamong two or more users.
Prior research has identified an additionaldimension of perceived interactivity called“direction of communication”. These studies haveapplied either the traditional organizationalcommunication model [12] or the interpersonalcommunication model [22]. Direction ofcommunication is the extent to which users believethat the site facilitates two-way communication. Insummary, perceived interactivity includes threedimensions: (1) control (internally based efficacy),(2) responsiveness (externally based systemefficacy), and (3) communication [18], [19].
2.4 Technology Acceptance Model (TAM)Technology acceptance model (TAM) wasconceived to explain and predict the individual’sacceptance of IT. TAM is based on Fishbein andAjzen’s Theory of Reasoned Action (TRA), whichsuggests that social behavior is motivated by anindividual’s attitude toward carrying out thatbehavior, a function of one’s beliefs about theoutcome of performing that behavior, and anevaluation of the value of each of those outcomes.
According to TRA, behavior is determineddirectly by the intention to perform, because people,in general, behave as they intend to do withinavailable context and time.TAM adopts TRA’scausal links to explain individual’s IT acceptance
WSEAS TRANSACTIONS on COMMUNICATIONS Chia-Cheng Shen, Huan-Ming Chuang
ISSN: 1109-2742 185 Issue 1, Volume 8, January 2009
behaviors. It suggests that perceived usefulness andperceived ease of use of IT are major determinantsof its usage. Davis defined perceived usefulness as“the degree of which a person believes that using aparticular system would enhance his/her jobperformance” and perceived ease of use as “thedegree of which a person believes that using aparticular system would be free of effort” [5].Consistent with TRA, user’s beliefs determine theattitudes toward using the system. Behavioralintentions to use, in turn, are determined by theseattitudes toward using the system.
Finally, behavioral intentions to use lead toactual system use. Previous research hasdemonstrated the validity of this model across awide variety of corporate IT [5], [42], [43]. Oneobstacle to TAM usage is applying it beyond theworkplace. This is because TAM’s fundamentalconstructs do not fully reflect the variety of usertask environments. Recently, Dishaw and Strongpointed out that a weakness of TAM is its lack oftask focus [40]. Therefore, to increase externalvalidity of TAM, it is necessary to further explorethe nature and specific influences of technologicaland usage-context factors that may alter the user’sacceptance.
2.5 Development of hypothesesSystem characteristics have the potential to directlyaffect both perceived ease of use and perceivedusefulness of information system (IS) [5]. Studiesthat included system features such as externalvariables of TAM have found significantrelationships between the system variables and theTAM’s beliefs constructs [41]. There is a need toidentify specific system characteristics and examineits effects on both perceived ease of use andperceived usefulness in IWT environments. In thisstudy, we define the interactivity as the mostimportant in system characteristics. Perceivedinteractivity includes three dimensions: (1) control(internally based efficacy), (2) responsiveness(externally based system efficacy), and (3)communication [18], [19]. As the result, we willdiscuss the relationship of interactivity with othervariables. We propose the hypothesis as follows:
We propose the hypothesis as follows:Hypothesis 1: Greater control interactivitycorresponds to greater perceived ease of use.Hypothesis 2: Greater responsiveness interactivitycorresponds to greater perceived ease of use.Hypothesis 3: Greater communication interactivitycorresponds to greater perceived ease of use.
In the literature reviewed, several authors haveemphasized the potential of IWT for facilitatingmore interactive lessons [2], [9], [11]. An ideal classusing IWT would feature students and teachersworking together to construct the content of thelesson by using the resources available by thetechnology and relying on the expertise of the wholeclass [2], [9], [11]. They argue that teachers shouldadopt a more interactive approach to teaching if theywant the IWT to become a transformative device toenhance learning. Bell also emphasized the potentialof IWT for promoting higher levels of interactivity[2].
We propose the hypothesis as follows:Hypothesis 4: Greater control interactivitycorresponds to greater perceived usefulness.Hypothesis 5: Greater responsiveness interactivitycorresponds to greater perceived usefulness.Hypothesis 6: Greater communication interactivitycorresponds to greater perceived usefulness.
Perceived ease of use is one majordetermination of attitude toward use in the TAMmodel, and many empirical studies confirmed theeffect of ease of use on attitude toward using [5],[42], [43]. This internal belief ties to an individual’sassessment of the mental effort involved in using asystem [5]. Perceived usefulness and perceived easeof use are distinct but related constructs.Improvements in perceived ease of use willcontribute to improved performance. Sinceimproved performances define perceived usefulnessthat is equivalent to usefulness, perceived ease ofuse will have a direct and positive effect onperceived usefulness.Extensive research over the past decade providesevidence of the significant effect of perceived easeof use on intention, either directly or indirectlythrough its effect on perceived usefulness [42], [43],[44], [45].
Accordingly, the following hypotheses wereproposed:Hypothesis 7: Greater perceived ease of usecorresponds to greater perceived usefulness.Hypothesis 8: Greater perceived ease of usecorresponds to greater attitude toward using.
Perceived usefulness in the TAM modeloriginally referred to job related productivity,performance, and effectiveness [5]. This is also animportant belief identified as providing diagnosticinsight into how user attitude toward using andintention to use are influenced - perceivedusefulness has a direct effect on intentions to useover and above its influence via attitude [5], [43],[44], [45], [46].
WSEAS TRANSACTIONS on COMMUNICATIONS Chia-Cheng Shen, Huan-Ming Chuang
ISSN: 1109-2742 186 Issue 1, Volume 8, January 2009
Accordingly, the following hypotheses wereproposed:Hypothesis 9: Greater perceived usefulnesscorresponds to greater attitude toward using.Hypothesis 10: Greater perceived usefulnesscorresponds to greater behavioral intention.
Attitude has long been identified as a cause ofintention. Attitude toward using in the TAM modelis defined as the mediating affective responsebetween usefulness and ease of use and behavioralintention to use a target system. In other words, a
prospective user’s overall attitude toward using agiven system is an antecedent to intention to adopt[5], [42], [43], [44], [45].
Accordingly, the following hypothesis wasproposed:Hypothesis 11: Greater attitude toward usingcorresponds to greater behavioral intention.
Fig. 1 illustrates our model, which is based onTAM and related literature.
Fig.1 Research model
3 Methodology3.1 SampleTo test the hypotheses, an online field survey wasconducted. It used a questionnaire designed to beplaced on a web site. Javascript and asp.netprogramming was developed to handle the datacollection process. Our research subjects were fifthand sixth grade elementary school students IWTusers in Taiwan. The formal questionnaire surveywas expected to generate 300 respondents at least,with around 100 respondents for each onlinecommunication tool.
Telecommunication Laboratories and thequestionnaire collection were kept runningcontinuously for two weeks of the survey period. Theonline questionnaire’s web address was first sent tostudents. The contents of this message requestedthem to fill out the questionnaire and also forwardedthe web address in hopes of increasing the samplesize of study. The online survey generates raw dataautomatically in a database. It saved a lot of time andavoided the possibility of human mistakes duringdata coding. Table 1 summarizes the respondents’profile.
WSEAS TRANSACTIONS on COMMUNICATIONS Chia-Cheng Shen, Huan-Ming Chuang
ISSN: 1109-2742 187 Issue 1, Volume 8, January 2009
Table 1. Demographic profile
Measure Items Frequency PercentMale 182 53.5GenderFemale 158 46.5Generalclass
215 63.2Place ofIWT
ICT class 125 36.8Under 3months
70 20.6
3 months–6months
140 41.2
6 months–1year
95 27.9
Experiencein IWT
Over 1 years 35 10.3Under 10 h 200 58.911–20 h 105 30.8
Time inIWT perweek Over 21 h 35 10.3
3.2 Measurement developmentThe questionnaires were developed from materialdiscussed and tested previously; the list of items isdisplayed in Appendix A. The items were slightlymodified to suit the context of IWT. Our scale itemsfor perceived ease of use, perceived usefulness,attitude, and behavioral intention to IWT were from[5], [17], [29]. Interactivity was measured by itemsadapted from Liu, McMillan and Hwang [19]. Eachitem was measured on a seven-point Likert scale,ranging from ‘‘disagree strongly’’ (1) to ‘‘agreestrongly’’ (7). Before conducting the main survey,we performed a pretest and a pilot to validate theinstrument. The pre-test included thirty-fiveelementary school students who were experiencedIWT participants. Respondents were asked tocomment on list items that corresponded to theconstructs, including scales wording, questionnaireformat, and instrument length. Finally, to reduce anypossible ambiguity, a pilot test was performed.
4 Results4.1 Descriptive statisticsDescriptive statistics were calculated and shown inTable 2. These show that, on average, our sampleresponded positively to participating in IWT (theaverages of all constructs were greater than 5 out of6).
Table 2. Descriptive statistics (means and S.D.)
N=340 Means S.D.Control 5.43 1.00
Responsiveness 5.57 1.08Communication 5.54 1.10
Usefulness 5.52 0.98Ease of use 5.27 1.08
Attitude 5.53 1.11Behavioralintention
5.46 1.14
4.2 Analytic strategy for assessing the modelThe proposed model was evaluated using SEManalysis, which is a powerful second-generationmultivariate technique for analyzing causal modelswith an estimation of the two components of a causalmodel, measurement and structural models. Themeasurement model is estimated using confirmatoryfactor analysis (CFA) to test whether the constructspossess sufficient reliability and validation. Thestructural model is used to investigate the strengthand direction of the relationship between thetheoretical constructs. Such analyzed technique hasbeen widely applied in recent years. In our study,LISREL 8.7 was the software used to assess theconfirmatory factor analysis (CFA) and the structuralmodels [15].
4.3 The measurement modelThe measurement model was tested usingconfirmatory factor analysis (CFA). Segars andGrover [27] suggested that the measurement modelshould be evaluated first and then changed asnecessary to generate the ‘best fit’ model. The initialassessment of the model indicated that some itemsshould be removed. So, after changing theinstruments, 20 items were retained, as shown inTable 3. Item reliability ranged from 0.73 to 1.06,which exceeded the acceptable value of 0.50recommended by Hair et al. [13]. The internalconsistency of the measurement model was assessedby computing the composite reliability (CR).Consistent with the recommendations of Bagozzi andYi [1], all composite reliabilities were above the 0.60benchmark. The average variance extracted allconstructs exceeded the threshold value of 0.5recommended by Fornell and Larcker [7].
Additionally, the values of reliability wereabove the recommended thresholds, and the scalesfor evaluating the constructs were deemed to exhibitconvergence reliability. Variances extracted by
WSEAS TRANSACTIONS on COMMUNICATIONS Chia-Cheng Shen, Huan-Ming Chuang
ISSN: 1109-2742 188 Issue 1, Volume 8, January 2009
constructs were greater than any squared correlationamong constructs; this implied that constructs wereempirically distinct, and as shown in Table 4. Insummary, the measurement model testing, includingconvergent and discriminate validity measures, wassatisfactory. The fitness measures for themeasurement models as shown in Table 5. χ2 , GFI(goodness-of-fit index), AGFI (adjusted GFI), NFI(normalized fit index), CFI (an incremental fit indexof improved NFI) and RMSEA (root-mean-squareerror of approximation) were used to test thegoodness of fit of the proposed model. It is suggested
that χ2/d.f. should not exceed 3 [3] while GFI andAGFI should be greater than the recommended valueof 0.8 [26], [28]. Bentler further suggested thatmodel fit indices should be used, and scores of 0.9 orhigher on NFI and CFI should be consideredevidence of a good fit. Accordingly, all the fitnessmeasures in this study fell into acceptable ranges.Consequently, the proposed model provided asuitable fit condition.
Table 3. Reliability (Notes: R = Reverse coding.)
Item Measure Itemreliablity
Compositereliablity
Average varianceextracted
COM1 This IWT facilitates two-way communication. 1.04 0.84 0.62COM2 The IWT gives me the opportunity to talk back. 1.06COM5 The IWT does not encourage visitors to talk back.R 0.91CON2 While I was on the IWT, I always knew where I
was going.0.94 0.75 0.65
CON3 While I was on the IWT, I was always able to gowhere I though I was going.
0.91
CON4 I was delighted to be able to choose which link andwhen to click.
0.73
RES1 The IWT processed my input very quickly. 1.03 0.88 0.51RES3 I was able to obtain the information I want without
any delay.0.95
RES5 The IWT was very slow in responding to myrequest.R
1.05
PU2 Using IWT enables me to accomplish purposemore quickly
0.90 0.75 0.53
PU3 It enables me to satisfy the purpose of using IWTeasier
0.88
PU4 Overall, it will be useful using IWT 0.76PE1 Learning to operate IWT is easy for me 1.01 0.77 0.64PE3 It is easy to remember how to use IWT 0.98PE4 Overall, it will be easy to use IWT 0.85AT1 I’ll like to use IWT 1.02 0.85 0.50AT2 Using IWT will bring profit for me 1.04AT4 Using IWT is a pleasant idea 1.02BI2 I will strongly recommend others to use IWT 1.02 0.77 0.72BI4 It is worth to using IWT 0.97
WSEAS TRANSACTIONS on COMMUNICATIONS Chia-Cheng Shen, Huan-Ming Chuang
ISSN: 1109-2742 189 Issue 1, Volume 8, January 2009
Table 4. Discriminant validity of users
COM CON RES PU PE AT BICOM 0.80CON 0.12 0.71RES 0.14 0.26 0.85PU 0.13 0.36 0.17 0.71PE 0.17 0.24 0.08 0.68 0.73AT 0.15 0.08 0.01 0.41 0.30 0.81BI 0.06 0.11 0.01 0.34 0.29 0.75 0.79
Table 5. Overall fits of models
Fit index Recommendedcriteria Results Suggested
by authors
χ2/d.f. <3 1.03 Bentler andBonett [3]
GFI >0.8 0.96 Seyal et al.[28]
AGIF >0.8 0.94 Scott [26]
NFI >0.9 0.96 Bentler andBonett [3]
NNFI >0.9 0.99 Bentler andBonett [3]
RMSEA <0.08 0.01 Hair et al.[13]
CFI >0.9 0.99 Bentler andBonett [3]
4.4 Tests of the structural modelWe examined the structural equation model bytesting the hypothesized relationships among theresearch variables; see Fig. 2. The results show thatattitude and perceived usefulness identification hadsignificant effects on the intention to use (β= 0.70, p< 0.001; β= 0.16, p < 0.05), supporting hypotheses10 and 11. Together, these two paths accounted for60% of the variance in intent to use.
Fig.2 Hypotheses Testing Results: Structural Equation Model
WSEAS TRANSACTIONS on COMMUNICATIONS Chia-Cheng Shen, Huan-Ming Chuang
ISSN: 1109-2742 190 Issue 1, Volume 8, January 2009
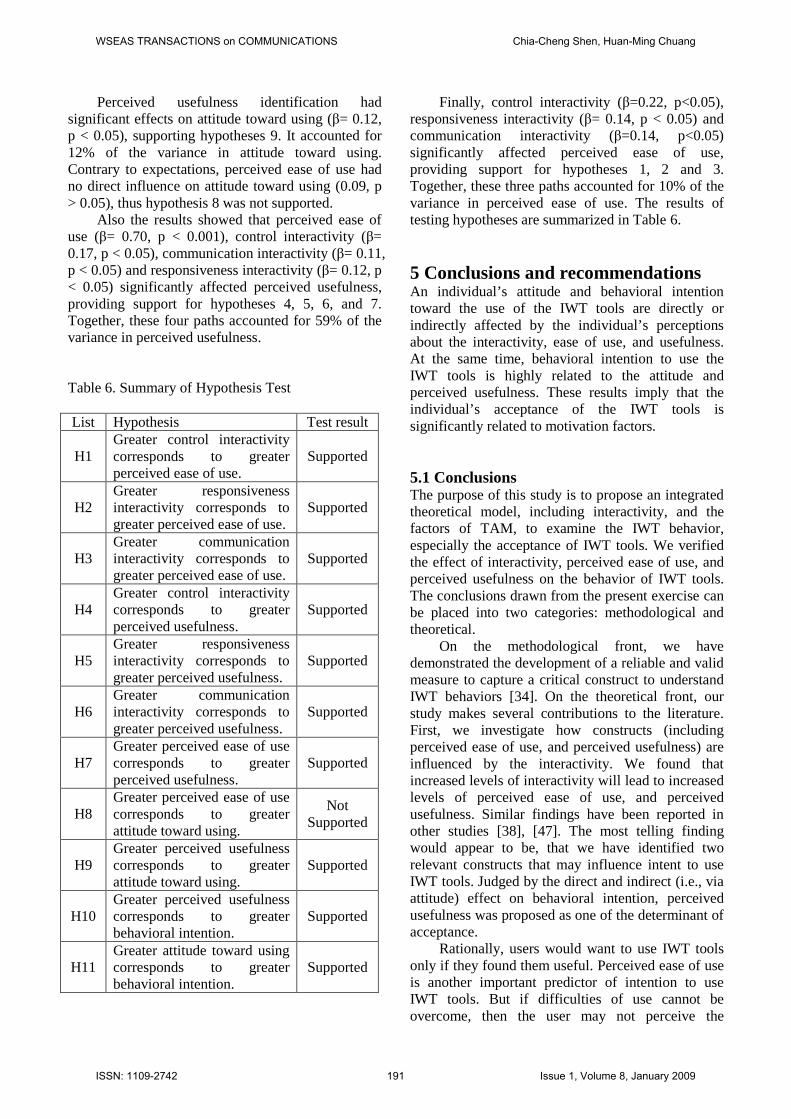
Perceived usefulness identification hadsignificant effects on attitude toward using (β= 0.12,p < 0.05), supporting hypotheses 9. It accounted for12% of the variance in attitude toward using.Contrary to expectations, perceived ease of use hadno direct influence on attitude toward using (0.09, p> 0.05), thus hypothesis 8 was not supported.
Also the results showed that perceived ease ofuse (β= 0.70, p < 0.001), control interactivity (β=0.17, p < 0.05), communication interactivity (β= 0.11,p < 0.05) and responsiveness interactivity (β= 0.12, p< 0.05) significantly affected perceived usefulness,providing support for hypotheses 4, 5, 6, and 7.Together, these four paths accounted for 59% of thevariance in perceived usefulness.
Table 6. Summary of Hypothesis Test
List Hypothesis Test result
H1Greater control interactivitycorresponds to greaterperceived ease of use.
Supported
H2Greater responsivenessinteractivity corresponds togreater perceived ease of use.
Supported
H3Greater communicationinteractivity corresponds togreater perceived ease of use.
Supported
H4Greater control interactivitycorresponds to greaterperceived usefulness.
H7Greater perceived ease of usecorresponds to greaterperceived usefulness.
Supported
H8Greater perceived ease of usecorresponds to greaterattitude toward using.
NotSupported
H9Greater perceived usefulnesscorresponds to greaterattitude toward using.
Supported
H10Greater perceived usefulnesscorresponds to greaterbehavioral intention.
Supported
H11Greater attitude toward usingcorresponds to greaterbehavioral intention.
Supported
Finally, control interactivity (β=0.22, p<0.05),responsiveness interactivity (β= 0.14, p < 0.05) andcommunication interactivity (β=0.14, p<0.05)significantly affected perceived ease of use,providing support for hypotheses 1, 2 and 3.Together, these three paths accounted for 10% of thevariance in perceived ease of use. The results oftesting hypotheses are summarized in Table 6.
5 Conclusions and recommendationsAn individual’s attitude and behavioral intentiontoward the use of the IWT tools are directly orindirectly affected by the individual’s perceptionsabout the interactivity, ease of use, and usefulness.At the same time, behavioral intention to use theIWT tools is highly related to the attitude andperceived usefulness. These results imply that theindividual’s acceptance of the IWT tools issignificantly related to motivation factors.
5.1 ConclusionsThe purpose of this study is to propose an integratedtheoretical model, including interactivity, and thefactors of TAM, to examine the IWT behavior,especially the acceptance of IWT tools. We verifiedthe effect of interactivity, perceived ease of use, andperceived usefulness on the behavior of IWT tools.The conclusions drawn from the present exercise canbe placed into two categories: methodological andtheoretical.
On the methodological front, we havedemonstrated the development of a reliable and validmeasure to capture a critical construct to understandIWT behaviors [34]. On the theoretical front, ourstudy makes several contributions to the literature.First, we investigate how constructs (includingperceived ease of use, and perceived usefulness) areinfluenced by the interactivity. We found thatincreased levels of interactivity will lead to increasedlevels of perceived ease of use, and perceivedusefulness. Similar findings have been reported inother studies [38], [47]. The most telling findingwould appear to be, that we have identified tworelevant constructs that may influence intent to useIWT tools. Judged by the direct and indirect (i.e., viaattitude) effect on behavioral intention, perceivedusefulness was proposed as one of the determinant ofacceptance.
Rationally, users would want to use IWT toolsonly if they found them useful. Perceived ease of useis another important predictor of intention to useIWT tools. But if difficulties of use cannot beovercome, then the user may not perceive the
WSEAS TRANSACTIONS on COMMUNICATIONS Chia-Cheng Shen, Huan-Ming Chuang
ISSN: 1109-2742 191 Issue 1, Volume 8, January 2009
usefulness and may not enjoy the IWT. Therefore,the user friendly interface of an IWT tool also playeda critical role in determining perceptions ofusefulness and attitude toward using. However,according to the analytical results, perceived ease ofuse did not appear to drive attitude toward using.
This study assumes that ease of use in IWTtools doesn’t matter when the user attitude isconcerned. Hence, attitude toward using is not drivenby ease of use. However, our study still indicates thatinteractivity, perceived ease of use, and perceivedusefulness are salient beliefs about IWT, whichsupport our hypotheses and such results reinforceprevious findings [5], [42], [43], [44], [45].
5.2 Implications: Theoretical and Practical5.2.1 Theoretical ImplicationsFrom the standpoint of individual-level technologyacceptance research, this study extends TAM withthe interactivity theory. Although TAM-relatedhypotheses are supported here, the results challengesome of the basic tenets of TAM. TAM emphasizedthe importance of perceived usefulness as the keydeterminant of user acceptance of IT, and our studyhad the same result. Besides, interactivity factors hada significant effect on perceived ease of use andperceived usefulness. This means that motivationalfactors have a powerful effect in building positiveattitudes.
As a result, for academic researchers, this studycontributes to a theoretical understanding of factorsthat promote not only task-oriented IT but alsoentertainment-oriented IT. Entertainment-oriented ITdiffers from task-oriented IT in terms of the reason touse it. Task-oriented IT usage is concerned withimproving organization productivity. Therefore,TAM emphasizes the importance of perceivedusefulness and perceived ease of use as keydeterminants. However, concerning entertainment-oriented IT, this study demonstrated the importanceof an individual intentions to need the other variable,such as an interactivity experience. Furthermore, thisdominance was strong, and explained most of thevariance in technology usage.
5.2.2 Practical ImplicationsThis study has provided support to the research inconfirming the positive effects of interactivityincluding user-machine interactivity and user-userinteractivity. When user-user interactivity isincorporated into an IWT environment, designersneed to be aware of the highly dynamic interactionbetween social and technological factors and howthey influence technology acceptance. Although ease
of use and usefulness are conceived as importantissues in traditional IT environments; interactivityexperience plays an important role in increasingusability in the IWT environment, which containsentertainment-oriented applications. Therefore, forIWT tool practitioners, the results suggest thatdevelopers should endeavor to emphasizeinteractivity on IWT using [45]. The level should beoptimized for the constraints of users’ neuralbandwidth and skills. If too much interactivity isprovided than the users can take, it is unlikely tokeep their attentions very long. Furthermore, thebandwidth of the infrastructure delivering theinteractivity must be taken into consideration toensure that the access speed is not hampered by theincreased interactivity. In conclusion, designersshould keep users in a flow state.
The results also have significant implicationsfor advertisers. Because IWT environments could betaken as a new media, it has the capacity of makingand impact on attitude formation and change, andtherefore can be interesting and potentially powerfuloutlets for learner communication. However, inconventional vehicles, the “more-is-better” approachdoes not necessarily lead to enhancedcommunication effectiveness. As complexity the ofthe advertisement increases, the challenge increases,and users feel it is hard to use, therefore, thepossibility of returns on its effectiveness diminishes.However, if the interactive features and designelements are properly balanced, the new media hasthe ability to impact favorably on involvement,which has been traditionally hard to achieve inconventional media.
5.3 Research LimitationsAlthough our findings provide meaningfulimplications for IWT environment, our study doeshave some limitations. First, the use of self-reportingscales to measure study variables suggests thepossibility of a common method bias for some of theresults. In order to pursue further investigation, itwould be appropriate to develop a more direct andobjective measure for user acceptance of the IWTtools.
Second, although the structured equationmodeling technique used was able to handle smallsamples, more statistical conclusion validity could beachieved with a larger population. Furthermore, thisstudy was conducted with one-shot experimentaldesign, so a longitudinal approach should also beconsidered.
Third, we used students in a Taiwan elementaryschool, who were appropriate for this research.
WSEAS TRANSACTIONS on COMMUNICATIONS Chia-Cheng Shen, Huan-Ming Chuang
ISSN: 1109-2742 192 Issue 1, Volume 8, January 2009
Results should be able to be generalized acrossdifferent populations. However, currently, we cannotoffer empirical support that they do.
Finally, we investigate how beliefs, includingperceived ease of use, and perceived usefulness areinfluenced by interactivity; but there are still a lot ofother externally controllable factors that we didn’tdiscuss, such as individual and task characteristics,and cultural factors which would allow us to betterunderstand the usage of communication technology.
Appendix A. List of items by constructCommunication1. This IWT facilitates two-way communication.*2. The IWT gives me the opportunity to talk back.*3. The IWT facilitates concurrent communication.4. The IWT enables conversation.5. The IWT does not encourage visitors to talk back.R*
Control1. While I was on the IWT, I was always awarewhere I was.2. While I was on the IWT, I always knew where Iwas going.*3. While I was on the IWT, I was always able to gowhere I though I was going.*4. I was delighted to be able to choose which linkand when to click.*5. I feel that I have a great deal of control over myvisiting experience at this IWT.
Responsiveness1. The IWT processed my input very quickly.*2. Getting information from the IWT is very fast.3. I was able to obtain the information I want withoutany delay.*4. When I clicked on the links, I felt I was gettinginstantaneous information.5. The IWT was very slow in responding to myrequest. R*
Perceived ease of use1. Learning to operate IWT is easy for me.*2. I find it easy to get IWT to do what I want to do.3. It is easy to remember how to use IWT.*4. Overall, it will be easy to use IWT.*
Perceived usefulness1. Using IWT improves my purpose quality.2. Using IWT enables me to accomplish purposemore quickly.*3. It enables me to satisfy the purpose of using IWTeasier.*4. Overall, it will be useful using IWT.*
Attitude toward using1. I’ll like to use IWT.*2. Using IWT will bring profit for me.*3. I’ll be positive about using IWT.4. Using IWT is a pleasant idea.*
Behavioral intentions to use1. I will frequently use IWT in the future.2. I will strongly recommend others to use IWT.*3. I’ll intend to use IWT as soon as possible.4. It is worth to using IWT.*
Notes: R = Reverse coding.*:Denotes the retained items for data analysis.
References:[1] R. P. Bagozzi and Y. Yi, On the evaluation of
structural equation models, Journal of theAcademy of Marketing Science, Vol. 16, 1998,pp. 74-94.
[2] M. A. Bell, Impact of the electronic interactivewhiteboard on students attitudes andachievement in eighth-grade writing instruction,Baylor University, 2000.
[3] P.M. Bentler and D.G. Bonett, Significance testsand goodness of fit in the analysis of covariancestructures, Psychological Bulletin, 1989.
[4] J. Branzburg, Whiteboards at Your Service,Technology & Learning, Vol. 28, 2007, pp. 38-39.
[5] F.D. Davis, Perceived usefulness, perceivedease of use, and user acceptance of informationtechnology, MIS Quarterly, Vol. 13, No. 3,1989 , pp. 319-340.
[6] S. W. Draper and M. I. Brown, Increasinginteractivity in lectures using an electronicvoting system, Journal of Computer AssistedLearning, Vol. 20, 2004, pp. 81-94.
[7] C. R. Fornell and D.F. Larcker, Structuralequation models with unobservablevariables andmeasurement error, Journal of MarketingResearch, Vol. 18, 1981, pp. 39-50.
[8] K. Pituch and Y. Lee, The influence of systemcharacteristics on e-learning use, Computers &Education, Vol. 47, 2006, pp.222-244.
[9] D. Glover and D. Miller, Running withtechnology: the pedagogic impact of the large-scale introduction of interactive whiteboards inone secondary school, Journal of InformationTechnologies for Teacher Education, Vol. 10,No. 3, 2001, pp. 257-278.
[10] T. Goodison, Enhancing learning with ICT atprimary level, British Journal of EducationalTechnology, Vol. 33, 2002, pp. 215-228.
WSEAS TRANSACTIONS on COMMUNICATIONS Chia-Cheng Shen, Huan-Ming Chuang
ISSN: 1109-2742 193 Issue 1, Volume 8, January 2009
[11] C. Greiffenhagen, From traditional blackboardsto interactive whiteboards: a pilot study toinform technology design, In Proceedings of the24th international conference psychology ofmathematics education, Vol. 24, No. 2, 2000, pp305-312.
[12] J. E. Grunig, and L. A. Grunig, Toward aTheory of Public Relations Behavior ofOrganizations: Review of a Program ofResearch, New Jersey: Lawrence ErlbaumAssociates, 1989.
[13] J.F. Hair, R.E. Anderson, R.L. Tatham, andW.C. Black, Multivariate Data Analysis withReadings, New York: MacMillan, 1992.
[14] I. Hall and S. Higgins, Primary school students’perceptions of interactive whiteboard, Journalof Computer Assisted Learning, Vol. 2, 2005, pp.102-117.
[15] K.G. Joreskog and D. Sorbom, LISREL 8:Users’Reference Guide, Chicago: ScientificSoftware International, 1996.
[16] S. Kennewell and G. Beauchamp, The featuresof interactive whiteboards and their influence onlearning, Learning, Media, & Technology, Vol.32, 2007, pp. 227-241.
[17] V.S. Lai and H. Li, Technology acceptancemodel for internet banking: an invarianceanalysis, Information & Management, Vol. 42,2005, pp. 373-386.
[18] Y. Liu, Developing a Scale to Measure theInteractivity of Websites, Journal of AdvertisingResearch, Vol. 43, No. 3, 2003, pp. 207-216.
[19] S. J. McMillan and J.-S. Hwang, Measures ofPerceived Interactivity: An Exploration of theRole of Direction of Communication, UserControl, and Time in Shaping Perceptions ofInteractivity, Journal of Advertising, Vol. 31,No. 3, 2002, pp. 29–41.
[20] C.-S. Ong, J.-Y. Lai, and Y.-S. Wang, Factorsaffecting engineers' acceptance of asynchronouse-learning systems in high-tech companies,Information & Management, Vol. 41, 2004, pp.795-804.
[21] G. Piccoli, R. Ahmad, and B. Ives, Web-basedvirtual learning environments: a researchframework and a preliminary assessment ofeffectiveness in basic IT skills training, MISQuarterly, Vol. 25, 2001, pp. 401-426.
[22] S. Rafaeli, Interactivity: From New Media toCommunication, California: Sage Publications,1988.
[23] J. C. Rivera and M. K. McAlister, A comparisonof student outcomes and satisfaction betweentraditional and Web based course offerings,Proceedings of the 2001 Information Resources
Management Association InternationalConference, 2001, pp. 770-772.
[24] E. C. Schmid, Investigating the use ofinteractive whiteboard technology in thelanguage classroom through the lens of a criticaltheory of technology, Computer AssistedLanguage Learning, Vol. 19, 2006, pp. 47-62.
[25] E. C. Schmid, Using a voting system inconjunction with interactive whiteboardtechnology to enhance learning in the Englishlanguage classroom, Computers & Education,Vol. 50, 2008, pp. 338-356.
[26] J.E. Scott, The measurement of informationsystems effectiveness: Evaluating a measuringinstrument, Proceedings of the FifteenthInternational Conference on Information System.Vancouver, 1994, pp. 111-128.
[27] A.H. Segars and V. Grover, Re-examiningperceived ease of use and usefulness: aconfirmatory factor analysis, MIS Quarterly,Vol. 17, 1993, pp. 517-252.
[28] A.H. Seyal, M.N. Rahman, and M.M. Rahim ,Determinants of academic use of the Internet: astructural equation model, Behaviour andInformation Technology, Vol. 21, No. 1, 2002,pp. 71-86.
[29] H.P. Shih, Extended technology acceptancemodel of Internet utilization behavior,Information & Management, Vol. 41, No. 6,2004, pp. 719-729.
[30] K. Wall, S. Higgins, and H. Smith, The visualhelps me understand the complicated things’:pupils views of teaching and learning withinteractive whiteboards, British Journal ofEducational Technology, Vol. 36, 2005, pp.851-867.
[31] D.W. Stewart and P.A. Pavlou, From ConsumerResponse to Active Consumer: Measuring theEffectiveness of Interactive Media, Academy ofMarketing Science Journal, Vol. 30, No. 4,2002, pp. 376-396.
[32] R. Sims, Interactivity : A Forgotten Art ?,Computer in Human Behavior, Vol. 13, No. 2,pp. 157-180.
[33] K. Chen and D.C. Yen, Improving the Qualityof Online Presence through Interactivity,Information & Management, Vol. 42, 2004, pp.217-226.
[34] R.P. Bagozzi, Y. Yi, and L.W. Philips,Assessing construct validity in organizationalresearch, Administrative Science Quarterly, Vol.36, 1991, pp. 421-458.
[35] S.H. Haeckel, About the Nature and Future ofInteractive Marketing, Journal of InteractiveMarketing, Vol. 12, No. 1, 1998, pp. 63-71.
WSEAS TRANSACTIONS on COMMUNICATIONS Chia-Cheng Shen, Huan-Ming Chuang
ISSN: 1109-2742 194 Issue 1, Volume 8, January 2009
[36] D.R. Fortin and R.R. Dholakia, Interactivity andVividness Effects on Social Presence andInvolvement with a Web-Based Advertisement,Journal of Business Research, Vol. 58, 2005, pp.387-396.
[37] D.L. Hoffman and P.N. Thomas, Marketing inHypermedia Computer-Mediated Environments:Conceptual Foundations, Journal of Marketing,Vol. 60, No. 3, 1996, pp. 50-68.
[38] H.H. Teo, L.B. Oh, C. Liu and K.K. Wei, AnEmpirical Study of the Effects of Interactivityon Web User Attitude, International Journal ofHuman-Computer Studies, Vol. 58, 2003, pp.281-305.
[39] B.O. Szuprowicz, Interactive Communications:New Technologies and Future Directions,Computer Technology Research Corp, 1996.
[40] M.T. Dishaw and D.M. Strong, Extending thetechnology acceptance model with task-technology fit constructs, Information andManagement, Vol. 36, No. 1, 1999, pp. 9-21.
[41] W. Hong, J.Y.L. Thong, W.M. Wong and K.Y.Tam, Determinants of User Acceptance ofDigital Libraries: An Empirical Examination ofIndividual Differences and SystemCharacteristics, Journal of ManagementInformation Systems, Vol. 18, No. 3, 2002,pp.97-124.
[42] J.W. Moon and Y.G. Kim, Extending the TAMfor a World-Wide-Web context, Informationand Management, Vol. 38, 2001, pp. 217-230.
[43] C.L. Hsu and H.P. Lu, Why do people play on-line games? An extended TAM with socialinfluences and flow experience, Information &Management, Vol. 41, 2004, pp. 853-868.
[44] I.L. Wu and J.L. Chen, An extension of Trustand TAM model with TPB in the initialadoption of on-line tax: An empirical study,Human-Computer Studies, Vol. 62, 2005, pp.784-808.
[45] J. Yu, I. Ha, M. Choi and J. Rho, Extending theTAM for a t-commerce, Information andManagement, Vol. 42, 2005, pp. 965-976.
[46] J. Lu, C.S. Yu, C. Liu and J.E. Yao, TechnologyAcceptance Model for Wireless Internet,Internet Research, Vol. 13, No. 3, 2003, pp.206-222.
[47] T.P. Novak, D.L. Hoffman and Y.-F. Yung,Measuring the Customer Experience in OnlineEnvironments: A Structural Modeling Approach,Marketing Science, Vol. 19, No. 1, pp. 22-42.
WSEAS TRANSACTIONS on COMMUNICATIONS Chia-Cheng Shen, Huan-Ming Chuang
ISSN: 1109-2742 195 Issue 1, Volume 8, January 2009