THE BALANCED SCORECARD AND TABLEAU DE BORD: A GLOBAL PERSPECTIVE ON TRANSLATING STRATEGY INTO ACTION by M. J. EPSTEIN* and J. F. MANZONI** 97/63/AC/SM Price Waterhouse Visiting Professor of Accounting and Control at INSEAD, Boulevard de Constance, 77305 Fontainebleau Cedex, France. Assistant Professor of Accounting and Control at INSEAD, Boulevard de Constance, 77305 Fontainebleau Cedex, France. A working paper in the INSEAD Working Paper Series is intended as a means whereby a faculty researcher's thoughts and findings may be communicated to interested readers. The paper should be considered preliminary in nature and may require revision. This version of the paper is intended for a practitioner audience. Printed at INSEAD, Fontainebleau, France.
Transcript
THE BALANCED SCORECARD ANDTABLEAU DE BORD:
A GLOBAL PERSPECTIVE ON TRANSLATINGSTRATEGY INTO ACTION
by
M. J. EPSTEIN*and
J. F. MANZONI**
97/63/AC/SM
Price Waterhouse Visiting Professor of Accounting and Control at INSEAD, Boulevard de Constance,77305 Fontainebleau Cedex, France.
Assistant Professor of Accounting and Control at INSEAD, Boulevard de Constance, 77305Fontainebleau Cedex, France.
A working paper in the INSEAD Working Paper Series is intended as a means whereby a faculty researcher'sthoughts and findings may be communicated to interested readers. The paper should be considered preliminaryin nature and may require revision.
This version of the paper is intended for a practitioner audience.
Printed at INSEAD, Fontainebleau, France.
The Balanced Scorecard and Tableau de Bord: A Global Perspective onTranslating Strategy into Action
by Marc J. Epstein and Jean-Francois ManzoniINSEAD, The European Institute of Business Administration, Bd. de Constance, F-77300 Fontainebleau, France(P) 33 1 6072 40 00 (F) 33 1 64 22 77 31 (E) epstein@inseadfr or manzoni@inseadfr
Abstract
Over twenty years ago Steven Kerr wrote an article entitled "On the folly of hoping for Aand rewarding B". The paper, now considered a "classic", described how manycompanies' performance measurement systems were rewarding different behaviors thanthe ones they hoped to obtain from their employees. This issue has received muchattention over the last few years. In particular, Robert Kaplan and David Norton havepublished a series of three Harvard Business Review articles proposing a specificframework, called Balanced Scorecard, to facilitate the translation of strategy into action.The idea of having some form of balanced picture of company performance is not new initself. Many companies have for years tracked and reported multiple indicators. Further,many countries have also had particular traditions. In France, for example, companieshave been using a related tool called "Tableau de Bord" for over fifty years. The paperreviews and compares Tableau de Bord and Balanced Scorecard. We conclude thatKaplan and Norton's Balanced Scorecard represents a welcome addition and goesfurther than what most companies and countries were doing.
For years, companies have found that achievement of long term goals typically
requires clearly focused corporate and functional strategies. James Collins and Jerry
Porras, for example, found in their best selling book Built to Last, that companies that
have a clear understanding of who they are and what they are trying to achieve also
enjoy the greatest long-term success. This issue has been around for a long time.
Over twenty years ago Steven Kerr wrote an article that summarized many
companies' practices in "On the folly of rewarding A, while hoping for B". 1 The
article described how many companies' performance measurement systems were
rewarding different behaviors than the ones they hoped to obtain from their
employees.
This concern has been echoed in the accounting literature; over the last few years,
Management Accounting and other publications have published numerous articles
emphasizing three key points:
• Companies should establish performance measurement systems that
support their strategies
• Performance measurement systems should contain many non-financial
indicators to complement financial ones, particularly with respect to customer
perceptions and performance of internal processes.
• The company's overall performance measurement system should then be
broken down into sets of local measurements for lower-level units, to translate
(cascade) the firm's objectives into more actionable sub-sets.
Five years ago, in the first of three Harvard Business Review articles on the
subject, Robert Kaplan and David Norton proposed a specific framework, called
'Steven Kerr, "On the Folly of Rewarding A, while Hoping for B", Academy of Management Journal
(1975, pp. 769-783).
2
Balanced Scorecard, to facilitate the translation of strategy into action.2 The
Balanced Scorecard is a short document summarizing succinctly a set of leading and
lagging performance indicators grouped into four different perspectives: financial,
customer, internal processes, and learning and growth (see Figure 1).
The idea of having some form of balanced picture of company performance is not
new in itself. Many companies have for years tracked and reported multiple
indicators. Further, many countries have also had particular traditions. In France,
for example, companies have been using a related tool called "Tableau de Bord" for
over fifty years. Still, Kaplan and Norton's Balanced Scorecard represents a welcome
addition and goes further than what most companies and countries were doing.
Tableau de Bord in France
A Tableau de Bord is a "dashboard", such as the one on which plane pilots and car
drivers can observe the speed at which they are going, how many miles they have
covered so far, and how much fuel they are consuming. The Tableau de Bord
emerged in France at the turn of this century. It was first developed by process
engineers who were looking for ways to improve their production process by better
understanding cause-effect relationships (the relationships between actions and
process performance). The same principle was then applied at the top management
level, to give senior managers a set of indicators allowing them to monitor the
progress of the business, compare it to the goals that had been set, and take
corrective actions.
This initial objective, giving managers a succinct overview of key parameters to
support decision making, had two important implications: First, the Tableau de Bord
cannot be a single document applying equally well to the whole firm; because each
sub-unit, and in fact each manager, has different responsibilities and objectives, there
2 See "The Balanced Scorecard - Measures that Drive Performance" (Harvard Business Review,January-February 1992), "Putting the Balanced Scorecard to Work" (HBR, September-October 1993),and "Using the Balanced Scorecard as a Strategic Management System" (HBR, January-February1996). Kaplan and Norton recently expanded on their ideas in a book called The Balanced Scorecard:
Translating Strategy into Action (Harvard Business School Press, 1996).
3
should be one Tableau de Bord for each sub-unit. These "dashboards" should be
integrated in a nested structure, like the one illustrated by a set of Russian dolls. In
this context, the firm's overall Tableau de Bord would translate into a series of
documents supporting local decision making.
Secondly, the various Tableaux de Bord used within the firm should not be limited to
financial indicators. Operational measures often give better information on the
impact of "local" events and decisions, and thus on cause-effect relationships, than
overall financial indicators.
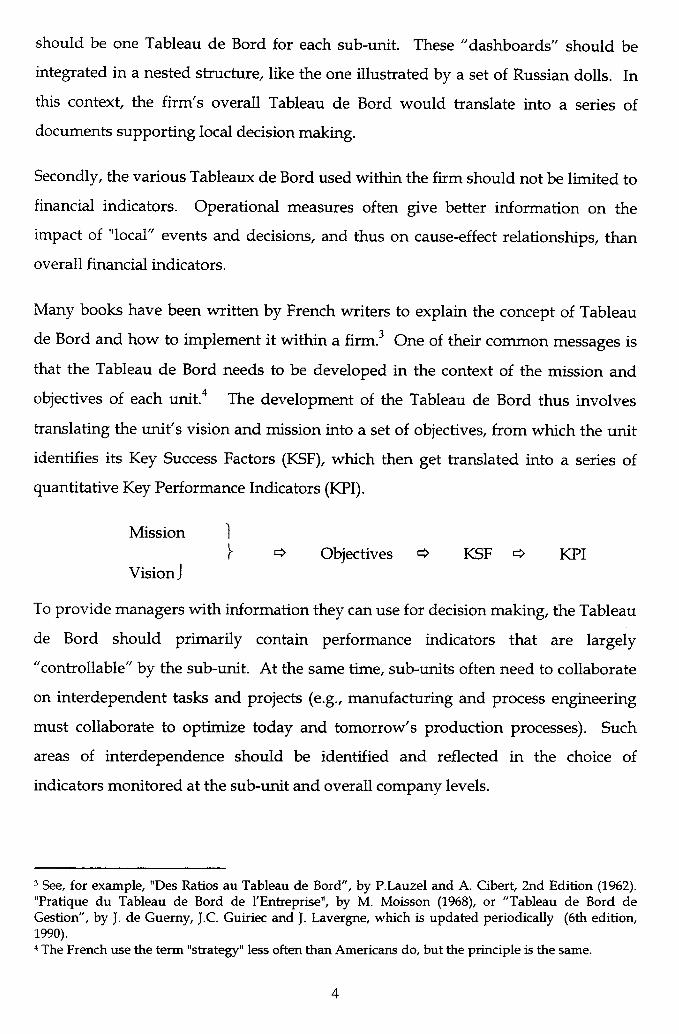
Many books have been written by French writers to explain the concept of Tableau
de Bord and how to implement it within a firm. 3 One of their common messages is
that the Tableau de Bord needs to be developed in the context of the mission and
objectives of each unit. 4 The development of the Tableau de Bord thus involves
translating the unit's vision and mission into a set of objectives, from which the unit
identifies its Key Success Factors (KSF), which then get translated into a series of
quantitative Key Performance Indicators (KPI).
Mission 1=> Objectives 12? KSF => KPI
Vision i
To provide managers with information they can use for decision making, the Tableau
de Bord should primarily contain performance indicators that are largely
"controllable" by the sub-unit. At the same time, sub-units often need to collaborate
on interdependent tasks and projects (e.g., manufacturing and process engineering
must collaborate to optimize today and tomorrow's production processes). Such
areas of interdependence should be identified and reflected in the choice of
indicators monitored at the sub-unit and overall company levels.
3 See, for example, "Des Ratios au Tableau de Bord", by P.Lauzel and A. Cibert, 2nd Edition (1962)."Pratique du Tableau de Bord de l'Entreprise", by M. Moisson (1968), or "Tableau de Bord deGestion", by J. de Guerny, J.C. Guiriec and J. Lavergne, which is updated periodically (6th edition,1990).4 The French use the term "strategy" less often than Americans do, but the principle is the same.
4
Concretely, the Tableau de Bord document should report actual performance of the
(sub-)unit on a small number of indicators; conciseness is important and the danger
of overloading managers with information is often highlighted by French authors.
The report should include numbers covering the period since the last report, and
may also present cumulative performance since the beginning of the year. Actual
performance should be compared to some yardstick chosen on the basis of both past
performance and external benchmarking. 5 The periodicity of the report should be a
function of the unit's responsibilities and the nature of the data, but a monthly
revision is considered typical at the top management level.
More than a mere document, French writers position the Tableau de Bord within an
"overall management approach". Aside from the document itself, which is useful in
its own right to support local decision making, a firm can derive much value from:
• The Tableau de Bord development process, which forces each unit, function or
division to identify its objectives and Key Success Factors, and the areas of
interdependence with other sub-units,
• The discussions that will be triggered by the publication of the Tableau de
Bord, which will provide opportunities for learning throughout the firm and for
reinforcing the firm's overall mission.
Overall, the Tableau de Bord document and the processes in which it is embedded
could thus yield four types of benefits.
1. Provide each manager with a periodic succinct overview of the performance
of its unit to guide decision making.
2. Inform the next level up of the sub-unit's performance (a complement to
decentralization of responsibilities).
5 This emphasis on benchmarking with other firms already appeared in the 1962 textbook on Tableauxde Bord.
5
3. Force each sub-unit to (a) position itself within the context of the firm's overall
strategy and the responsibilities of other sub-units, and (b) identify corresponding
KSF and KPI.
4. The company's overall Tableau de Bord and its sub-unit applications
contribute to structuring management's agenda and directing managerial focus and
discussions.
The concept of Balanced Scorecard
The concept of balanced scorecard came out of the realization that no single
performance indicator can capture the full complexity of an organization's
performance. In particular, financial indicators have well-known weaknesses, such
as capturing the impact of decisions with a significant time lag. As a result they tend
to be less proactive indicators of potential problems than operational (non-financial)
indicators. Many articles published in the 1980s following the TQM movement
emphasized the need to complement financial indicators with non-financial ones.
Several articles went in fact a step further and recommended reducing the focus on
financial indicators, which were said to encourage managers to make decisions that
were not in the best interests of the company.
We now know that financial and non-financial indicators should not be viewed as
substitutes. While financial measures tend to be lagging indicators of performance
(they tend to capture the impact of decisions only when their financial consequences
materialize, which can be long after the decision was made), they also have two
important benefits: (1) They represent the impact of decisions in a comparable
measurement unit -money, which allows aggregation of results across units, and (2)
they capture the cost of trade-offs between resources as well as the cost of spare
capacity. Business organizations exist in large part to create value for shareholders;
financial performance thus remains an essential parameter. Ultimately,
improvement on non-financial measures should translate into superior financial
performance.
6
While several organizations were tracking and reporting many non-financial
indicators, Kaplan and Norton went one step further by proposing a framework,
called Balanced Scorecard, that has three important characteristics:
• it presents on a single document, a series of indicators providing a more
complete view of the company's performance;
• this document is supposed to be short and connected to the company's
information system for further detail (rather than the monthly "book" that many
organizations still produce and which requires enormous managerial time and skill
to digest);
• instead of listing indicators in an ad hoc manner, the Balanced Scorecard
groups the indicators into four "boxes", each capturing a distinct perspective on the
company's performance but all linked to its vision and strategy (see Figure 1).
The financial perspective focuses on the shareholders' interests: is the company
generating satisfactory return on investment and creating shareholder value? The
three other perspectives can be explained through the following reasoning: How
does a company succeed financially? Through a combination of two elements: One
is creating value for customers; we thus need to know how customers perceive our
performance. But a firm can delight customers all the way into bankruptcy, so it also
need to make sure that it performs well on key internal dimensions. For example, we
can improve customer service by having massive numbers of employees servicing
customers, or by having less employees whose time we utilize more efficiently and
whom we support with excellent information technology. Creating value for
customers only translates into shareholder value if it is based on effective and
efficient key internal processes.
The next step is to make this value creation sustainable over time. The company may
create value for customers and make excellent use of its resources today, but the
world does not stand still and performance requirements keep ratcheting up over
time. To make sure that the company will still be appreciated by tomorrow's
7
customers and will keep making excellent use of its resources, the organization and
its employees must keep learning and developing. This perspective should thus
group indicators capturing the company's performance with respect to innovation,
learning and growth.
From this reasoning comes a set of four perspectives, each characterized by a small
set of performance measures. As in the "Tableau de Bord", the specific content of
these four "boxes" must be adapted to the circumstances of each organization. In
particular, the four sets of indicators should reflect and operationalize the
organization's mission and strategy. A company following a low cost strategy will
have different Key Success Factors than one creating value through very innovative
products targeted at a subset of the overall market. These two organizations should
track different indicators to assess how well they are doing and guide performance
improvement programs.
Also similar to the Tableau de Bord, the concept of balanced scorecard can be
cascaded down through the organization to achieve a dual purpose: customization of
the balanced scorecard to the (sub-)unit by identifying its own set of actionable
performance indicators, and alignment of the sub-units within the company's overall
vision and strategy.
A Balanced Scorecard contains a set of performance metrics, some considered
"lagging indicators", others considered "leading indicators". In practice the notion
of leading vs. lagging indicator should really be thought of as a continuum.
Customer satisfaction, for example, is a leading indicator of financial performance,
but (assuming on-time-delivery is an important factor for the firm's customers) it is
also a lagging indicator of on-time-delivery. On-time-delivery is a leading indicator
of customer satisfaction, but it is determined in part by, and thus is a lagging
indicator of, production cycle time and quality of both product and process. It is in
fact possible to reflect such relationships between means and ends, or between causes
and effects, through the Balanced Scorecard (see Figure 2).
8
Main benefits of implementing a tool such as Balanced Scorecard or Tableau de
Bord
Developing and using a Balanced Scorecard or Tableau de Bord can bring several
benefits to a firm, some quite obvious, others more subtle. The most obvious
advantages are:
The Balanced Scorecard summarizes on a single, succinct document, four
different perspectives on the company's performance. Most organizations collect
some performance measures addressing some or all of these perspectives, but these
measures are typically reported in several different documents, often bulky, and
typically containing too much information to allow good analysis. Balanced
Scorecards and Tableaux de Bord group a small set of selected indicators on a single,
succinct document.
Because the four perspectives provide a more "balanced" view of the
company, they also allow managers to keep an eye on the way performance is
achieved (on the means used by managers). In particular, the Balanced Scorecard
highlights trade-offs between measures. A liquor company we worked with was in
the habit of pushing sales to distributors during the last week of each period, thus
overloading the distribution pipe line and "borrowing" sales from the next period.
Everybody knew that the practice was commonly used, but no one (but the people
close to the operations) knew exactly the amounts involved. In a Balanced Scorecard
context, such practices could easily be spotted through various measures focused on
customer satisfaction and number of weeks of distributor inventory.
Beyond these obvious benefits, the Balanced Scorecard is also a way for the company
to communicate and reinforce its strategy through its ranks. The presence of a
Balanced Scorecard does not eliminate the need for top managers to explain what
they are trying to achieve and why, but it reinforces traditional means of
communication by translating the strategy into quantifiable indicators. The firm's
Balanced Scorecard, in turn, can be translated into "local" scorecards for lower level
9
units, thus "cascading" the strategy and creating a set of "nested" performance
management systems.
Of course, tools like Balanced Scorecard and Tableau de Bord will have little impact
if they are never discussed. Rather than being used as a part of management-by-
exception, where indicators are only discussed if they fail to reach some pre-set
standard, the Balanced Scorecard should be part of a form of "interactive control"
and involve frequent and regular attention from operating managers through face-
to-face meetings of superiors, subordinates and peers. Rather than discussing
numbers for numbers' sake, discussions should be used to challenge and debate the
underlying data, assumptions and action plans. Unlike management-by-exception,
interactive control is not limited to unfavorable variances, it is systematic; we always
discuss where we stand on this metric.6
In this context, quantitative data are used not as an end in themselves but rather as a
mean to understand and improve the underlying activities. The Balanced Scorecard
then contributes to learning by structuring the agenda for meetings and discussions.
Such discussions can occur when reviewing the unit's performance for the month (or
the quarter), but also when evaluating new investments (how does this investment
impact the four perspectives presented on our scorecard), in the planning and
budgeting cycle, etc.
Finally, many companies have derived benefits from the very process of developing
a Balanced Scorecard. Just like many companies learn a lot about their activities and
processes from implementing Activity-Based-Costing, many firms realized while
developing a Balanced Scorecard that they did not really have clear views on the
strategy they were pursuing, nor on the key success factors of this strategy! In some
cases, senior management realized that they could not articulate a clear strategy. In
other cases, the problem was the opposite: too many people were articulating
different views on what the strategy of the firm really was! In both sets of cases,
6For more on the notion of interactive vs. diagnostic control, see "Control in an Age of Empowerment",by Robert Simons, Harvard Business Review (March-Apri11995).
10
development of the Balanced Scorecard forced the top management team to sit down
and develop a clear and shared view on what they were trying to achieve.
Did the French Tableau de Bord have it all?
As the previous sections make clear, the French notion of Tableau de Bord is quite
close to Kaplan and Norton's Balanced Scorecard from a conceptual point of view.
In practice, however, French Tableaux de Bord tend to fall significantly short of
Kaplan and Norton's Balanced Scorecard.
• First, the French Tableaux de Bord we have observed tend to over-
emphasize financial measures and to contain much less non-financial measures than
books on Tableaux de Bord recommend. A comparative study of French and
American companies published shortly after Kaplan and Norton's first Balanced
Scorecard article reported similar findings.'
• Also contrary to written advice, many companies chose goals and targets
that were mostly internal, with comparisons to last year's performance or this year's
budget, as opposed to systematic benchmarking of best-in-class performers.
• Writings on the French Tableau de Bord go back more than forty years and
often fail to highlight important notions that we have learned over the last few years.
In particular, measures described in books on Tableau de Bord tend to be gathered
internally inside the firm, rather than externally from customers. French writers also
tend to refer to the company's or the sub-units' "mission and objectives", rather than
refer explicitly to their "strategy" as we would be more likely to do today.
• Finally, with respect to the way the Tableau de Bord was used, French
managers seem to have often fallen into the trap of using the Tableau de Bord as a
device supporting management-from-a-distance and management-by-exception,
7 The study was conducted by two academics, one American and the other French. Their findingswere reported in the journal of the French association of accountants (Recent evolution of the Tableaude Bord systems: comparison of practices in a few American and French multinationals, Jack Gray andYvon Pesqueux, Revue Frangaise de Comptabilite, February 1993).
11
rather than using it interactively to create an agenda for discussions and meetings.
As a result the Tableau de Bord lost much of its power and usefulness.
There are indications that French Tableaux de Bord are improving rapidly; several
recent articles in French business magazines report that an increasing number of
companies are collecting and reporting non-financial indicators, particularly external
data on customer perception. The increasing use of integrated computer systems
such as SAP and Oracle is also helping firms to collect, process and integrate data
that goes beyond "traditional" accounting measures. Still, it is fair to say that, at
least at the top management level, the content and style of use of French companies'
Tableaux de Bord often fell short of the theory on the subject.
Grouping indicators into "perspectives"
Some French authors point out that the notion of Tableau de Bord is wider and more
general than Kaplan and Norton's Balanced Scorecard, which they regard as a
"special case" of Tableau de Bord. These authors base their argument on the fact that
texts on the Tableau de Bord strongly emphasize the need to tailor-make the Tableau
de Bord to each company and to each manager within the company. As a result,
writings on the French Tableau de Bord generally do not specify structured sets of
indicators, while Kaplan and Norton's Balanced Scorecard proposes four generic sets
of indicators . The Balanced Scorecard approach can thus look more rigid and be
faulted by some as disregarding potentially important dimensions of firm
performance. For example, companies might want to highlight the following
dimensions by creating a specific "box" of indicators for them:
• Impact of the firm on society • The firm's economic, politicaland social environment
• Consumers vs. customers • Major projects currentlyunderway
12
Firm's impact on employment, localcommunities and environment; firm's recordon health and safety.
For firms selling through distributors andwhich have two levels of constituencies: theirimmediate customers and the final consumers.
price of raw materials, performance of theoverall industry, etc.)
Key milestones for the firm's major projects (toensure that progress on these projects -animportant leading indicator of futureperformance- receives as much attention asnecessary.
Environmental contingencies that can have amajor impact on the firm's performance (e.g.,
In all fairness, however, this is not really a limitation of the Balanced Scorecard
model. First, some of the indicators addressing the "other" dimensions can often be
included in the four boxes proposed in the framework. Secondly, Kaplan and
Norton's four boxes are presented as an organizing framework rather than a
constraining straight-jacket. Nothing prevents companies from adding one or two
additional boxes, although part of the power of the Balanced Scorecard comes from
its conciseness and the clarity of its presentation; it is thus probably better to try to
keep the number of boxes rather small.
Finally, having a framework helps protect potential users against two dangers: the
danger of one particular perspective, for example the financial perspective, coming
to dominate the other perspectives by default (as has happened in many French
companies), and the danger of missing one of the four dimensions proposed in the
Balanced Scorecard. Because they have to be collected for external purposes and will
always receive much attention from shareholders, financial measures have in-bred
advantages with respect to top management attention and are bound to "creep up"
on top managers unless their attention is specifically focused in other directions as
well.
Implementation issues
Introducing a Balanced Scorecard means introducing a change in the company. This
is never easy, and it is especially difficult when the change involves performance
reporting and risks modifying the balance of power within the organization.
Companies trying to implement Balanced Scorecards can encounter difficulties along
the following lines:
13
1. The first problem that many firms encounter is the realization that the top
management team cannot articulate a clear and shared view of the firm's strategy; in
some cases, the strategy is not clear, in other cases members of the top management
team hold different views on what the strategy of the firm is or ought to be. The first
step of the process is thus to get to a consensus on what the firm should try to
achieve.
2. Developing and maintaining a Balanced Scorecard can create workload for
many people. In particular, some of the data required may not currently exist within
the firm and thus needs to be collected specifically for the scorecard. Managers that
are often already stretched by their normal workload may not be enthusiastic about
this additional demand on their time. Furthermore, many companies have a track
record of starting and later abandoning initiatives like the Balanced Scorecard. As a
result some employees may have grown weary of such change efforts and may have
developed an attitude along the lines of "if I wait long enough, this will go away!".
Top managers interested in the Scorecard concept may thus encounter some
cynicism among their troops when they bring up the idea.
3. Aside from resistance to increased workload for an initiative that may or may
not have clear benefits for the managers involved, companies may encounter
resistance motivated by a desire to protect one's turf or power base. Senior
managers should not assume that the absence of specific quantitative indicators in a
firm is always due to ignorance or excessive workload. In many cases, such absence
of information reflects what we call opaqueness by design. Local managers have
learned to develop secondary sources of information that are not accessible to top
management and/or to their subordinates. Maintaining opaqueness is often a way
for managers to centralize authority and/or to protect themselves from scrutiny and
questioning by their boss. The Balanced Scorecard highlights trade-offs and thus
brings increased transparency, which may be threatening for some managers.
4. Once the Balanced Scorecard is developed, it must then survive and prosper
among competing reporting mechanisms. For this to happen, top management must
14
be consistent in its decision to widen their perspective from a narrow emphasis on
financial measures. In one company we studied, for example, a manager said: "we
developed a Balanced Scorecard and used it in our monthly discussions. This lasted
until the first time we failed to meet our financial targets, at which point we didn't
talk about the Balanced Scorecard anymore; we reverted back to talking only about
financial performance."
While the need for consistency is common-sense and easy to accept in
principle, displaying such consistency is not easy for top managers who have
reached their position in part because of their ability to reach financial targets. This
need for consistency is not specific to scorecards or Tableaux de Bord; the same
problem exists with any project that goes beyond short term financial results, e.g.,
Quality or Just-in-Time programs. Just as managers should not talk about quality for
all but the last two days of the month, they cannot expect subordinates to develop a
broader view of performance encompassing a more balanced scorecard if they do not
consistently reinforce this broader view themselves.
One way for top management to show focus and consistency in outlook is to
link employees' performance evaluation and reward to performance on the Balanced
Scorecard. Some companies have started doing so; the insurance company Cigna
Property and Casualty, for example, calculates its employees incentive compensation
based on a set of Balanced Scorecards. 8 Surveys by consulting firms also suggest that
an increasing number of large firms are tying executive compensation of senior
executives to balanced scorecard-types of indicators. 9 Other companies prefer to
gain more experience with their scorecard before creating a tight link with reward
systems. This "wait while we learn" approach is quite reasonable given the
enhanced resistance that changes to compensation systems tend to create, but it is
clear that companies that tie significant rewards with financial performance only are
using a dangerous "double talk" when they also try to emphasize a broader outlook
during balanced scorecard progress meetings.
8 See "Cigna P&C: A Balanced Scorecard", CFO Magazine, October 1996. For another example, see alsoRobert S. Kaplan's case "Mobil USM&R (A): Linking the Balanced Scorecard" (HBS # 9-197-025).9 See, for example, a 1996 study by Towers Perrin, New York, quoted in HR Focus (June 1996).
15
Role of the controller
The controller can support the scorecard development process in two very significant
ways because of the skills they have with respect to measurement and structured
reasoning.
Structured reasoning
On a recent consulting assignment we were asked to help the executive teams of
several business units to develop a more focused and performance oriented
approach to their business. (The project was similar to the (re)-introduction of a
management-by-objectives system). Our first contribution was to help these
managers be more rigorous in articulating their mission and their strategy, then in
translating them into a manageable subset of objectives; Executives often came up
with lists of 15 to 20 goals, which could in fact fit into 4 or 5 major blocks of related
initiatives.
Selecting the right performance indicators
The next step was for the managers to translate the objectives into measurable
targets, which many experienced as a very challenging process. Aside from sales
and manufacturing functions, many managers remain moderately skilled at
identifying quantifiable performance indicators. This process is not as easy as it
seems; the indicators must be controllable (i.e., target achievement should not be
overly influenced by events or decisions that are out of managers' control), but they
should also be reasonably complete (i.e., they should not fail to capture important
dimensions of performance such as cooperation with other business units or
adaptation to significant external events). Because of their experience and training,
controllers tend to be better skilled than line managers at identifying the right
performance indicators.
Conclusion
Balanced Scorecard and Tableaux de Bord are powerful tools. They have many
potential benefits which we have tried to describe in this article. Like all
16
management tools, however, the Balanced Scorecard is not a sufficient condition for
success; it cannot do everything! For example, it should not be a tool supporting
attempts at management-by-exception and management-from-a-distance. Neither is
it a substitute for sound strategy, clear focus and strong alignment of energies within
the firm. On the other hand, developing and using a Balanced Scorecard-type of
system can help develop these conditions by forcing top management to articulate a
strategy and Key Success Factors, and focusing managers' attention on the firm's
progress on these elements. To achieve these benefits, top management needs to
show focus and consistency: Focus during the design of the tool, and consistency
"To achieve our IObjectives Measures I Targets I Initiativesvision, howshould we
appear to ourcustomers?"
Objectives i Measures I Targets i Initiatives
I I I
I 7
"To satisfy ourshareholders
and customers,what businessprocesses mustwe excel at?"
I I
I II II I
I I
LEARNING AND GROWTH
Objectives I Measures I Targets I Initiatives
1
"To achieve ourvision, how
will we sustainour ability tochange andimprove?"
Objectives I Measures I Targets I InitiativesI I
I I
I I
I I
Vision andStrategy
Figure 1Translating Vision and Strategy: Four Perspectives*
* Reprinted from "Linking the Balanced Scorecard to Strategy", by Robert S. Kaplan and David P. Norton, California Managment Review (July 1996)
EmployeeSuggestions
ShorterCycle LowerTime-'4"'N‘ 'b■- Rework
Process Quality
Financial
Customers
InternalBusinessProcesses
Learning andGrowth
Figure 2Organizing Performance Indicators in a Causal Chain
* Adapted from "Using the Balanced Scorecard as a Strategic Management System" by Robert S. Kaplan and David P.Norton, Harvard Business Review (January-February 1996)