Page 1
The Bank of Israel’s New DSGE Model Project
Team: David Elkayam, Eyal Argov, Emanuel Barnea, Alon Binyamini, Eliezer Borenstein, Irit RozenshtromUpdated: 22 October 2009Prepared for presentation at the Central Bank Macroeconomic Modeling Workshop, Jerusalem - 28/10/2009
Page 2
Contents Overview of the project. Short description of the New Area Wide
Model (NAWM). 4 main deviations from NAWM:
Imports in exports. UIP condition. Time varying long-run real interest rate. Rest of the world model.
Page 3
Project Motivation
From 2005 until today, the main monetary model operated at the Bank of Israel to support interest rate decisions is: “Open-economy New-Keynesian small DSGE ‘lite’ model”. Four blocks:
Inflation Output gap Exchange rate Interest-rate
What's missing? The model is too small – real sector not rich enough, does not cover GDP
components, no labor market, no investment-capital dynamics. Limited amounts of questions you can ask. Loose ends on theory – ad hoc imported inflation equation, exogenous
investment, ad hoc “closing open-economy model”. HP filtered gaps – hard to present growth forecasts.
In 2008 the BoI Monetary Models Forum initiated the development of a new DSGE model for use in forecasting and policy analysis.
Page 4
The Project
Starting point – ECB’s “New Area Wide Model” Similar (RAMSES, NEMO, TOTEM)
Stages of the project: Study and replicate the NAWM – done. Derive analytical solution to steady state – done. Calibrate version for Israel – done. Implementing the model for practical use – ongoing Bayesian estimation of the model – ongoing Extensions of the model – future work
Financial frictions Search and matching labor market Distinction of business sector vs. government output.
Page 5
The New Area Wide Model (Christoffel et al. , 2008) – Main Economic Units Households:
Consume. Invest in capital stock. Rent capital services to intermediate goods firms. Save in domestic or foreign bond Monopolistic suppliers of labor – subject to Calvo (1983)
rigidity in wage setting. Domestic producers of intermediate goods:
Produce with labor and capital (and technology). Sell to local final good produces (C, I, G) and foreign
importers (X) In each market: monopolistic competition + Calvo (1983)
rigidity in price setting
Page 6
The New Area Wide Model (Christoffel et al. , 2008) – Main Economic Units Importers of intermediate goods:
Buy foreign output. Monopolistic competition + Calvo (1983) rigidity in price
setting (LCP). Final good producers (type C, type I):
Aggregate domestic and imported intermediate goods. Perfect competition.
Central bank: Sets nominal interest rate according to Taylor-type rule in order to meet IT.
Fiscal authority: exogenously sets government consumption and tax rates.
Foreign economy (y*, r*, π*): determined by VAR.
Page 7
Extension I: Imports in Exports In the NAWM exports are domestically produced (Not like C or I). Israel:
Export weight in GDP – 36%. Estimates of import intensiveness in exports are around 30%.
To model the use of imported intermediate goods in the production of exports: Not enough to model exports like other final goods (C, I) that are
produced with domestic and imported intermediate goods. We also want to maintain assumption of Local Currency Pricing.
Solution: Two stage production of exports: First stage: CES aggregation of domestic and imported intermediate
goods (like C and I). Second stage: Then brand-naming and monopolistic competition with
Calvo (1983) price rigidity.
Page 8
Extension I: Imports in Exports Domestic final goods firms
Final export good (before brand-naming) CES production function:
Final export good’s price aggregator (marginal cost of distributors):
Imported Intermediate goods
Domestic Intermediate goods
Final Export good before brand-naming
Page 9
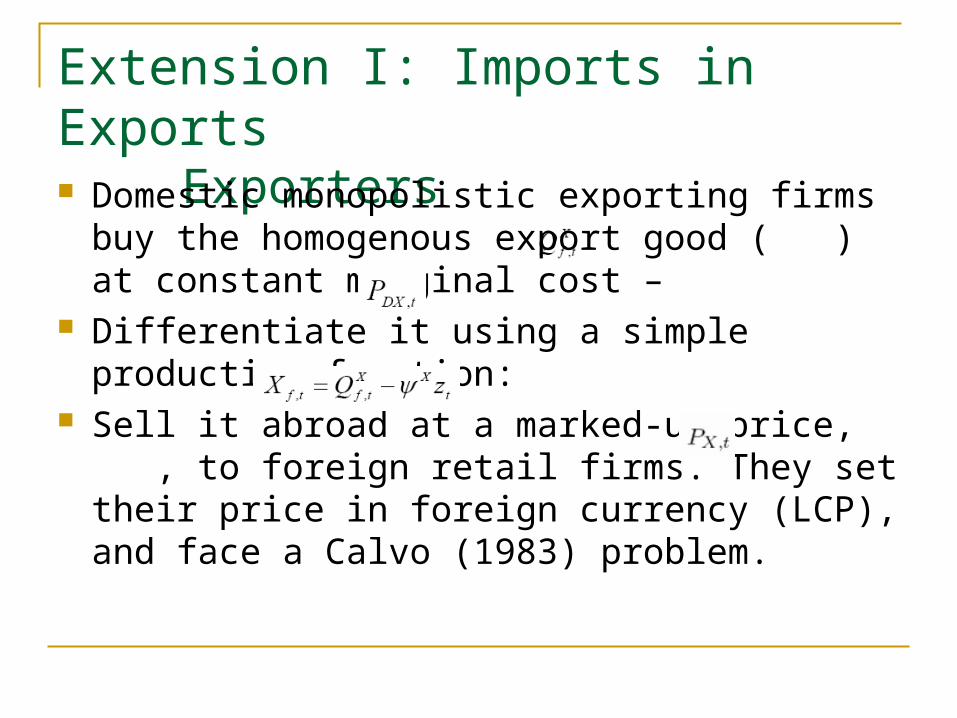
Extension I: Imports in Exports Exporters
Domestic monopolistic exporting firms buy the homogenous export good ( ) at constant marginal cost –
Differentiate it using a simple production function:
Sell it abroad at a marked-up price, , to foreign retail firms. They set their price in foreign currency (LCP), and face a Calvo (1983) problem.
Page 10
Extension I: Imports in ExportsMarket Clearing Conditions Two equilibrium conditions defining nominal and real
GDP from the supply side: Nominal GDP:
NAWM:
BoI Model:
Real GDP: NAWM:
BoI Model problem – H, X, and QX are not the same good!
Solution:
Page 11
Extension I: Imports in ExportsExport demand shock
-1
0
1
2
3
4
5
0 5 10 15 20 25 30
Exports (x)
Imports (im)
Output (y)
Nominal interest rate (r)
inflation (πc)
Nominal exchange rate (S)
-0.2
0.0
0.2
0.4
0.6
0.8
1.0
1.2
0 5 10 15 20 25 30
-0.04
-0.03
-0.03
-0.02
-0.02
-0.01
-0.01
0.00
0 5 10 15 20 25 30
0.0
0.2
0.4
0.6
0.8
1.0
1.2
1.4
1.6
1.8
0 5 10 15 20 25 30-0.06
-0.05
-0.04
-0.03
-0.02
-0.01
0.00
0.01
0.02
0.03
0 5 10 15 20 25 30
-0.8
-0.7
-0.6
-0.5
-0.4
-0.3
-0.2
-0.1
0.0
0 5 10 15 20 25 30
Baseline Model Without IM in X
Page 12
Extension I: Imports in ExportsExport demand shock
-1
0
1
2
3
4
5
0 5 10 15 20 25 30
Exports (x)
Imports (im)
Output (y)
Nominal interest rate (r)
inflation (πc)
Nominal exchange rate (S)
-0.2
0.0
0.2
0.4
0.6
0.8
1.0
1.2
0 5 10 15 20 25 30
-0.04
-0.03
-0.03
-0.02
-0.02
-0.01
-0.01
0.00
0 5 10 15 20 25 30
0.0
0.2
0.4
0.6
0.8
1.0
1.2
1.4
1.6
1.8
0 5 10 15 20 25 30-0.06
-0.05
-0.04
-0.03
-0.02
-0.01
0.00
0.01
0.02
0.03
0 5 10 15 20 25 30
-0.8
-0.7
-0.6
-0.5
-0.4
-0.3
-0.2
-0.1
0.0
0 5 10 15 20 25 30
Correlation between Δx and Δim:
Observed in data: 0.50
Baseline Model: 0.38
Model without IM in X: – 0.08
Baseline Model Without IM in X
Page 13
Extension II: UIP ModificationsGeneral Overview
Three Modifications to the UIP condition:
I. Incomplete financial markets – external risk premium depends on foreign asset position (Benigno, 2001).
II. “Modified” UIP – external risk premium depends on expected and lagged nominal exchange rate (Adolfson et al., 2007).
III. “Modified” UIP compatible with persistent inflation target differentials.
Page 14
Extension II: UIP ModificationsThe explicit modeling
From the households budget constraint:Local bonds
Foreign bondsExternal risk premium
Local nominal rate
Foreign nominal rate
External risk premium
I. Foreign asset
position
II. Expected depreciation
III. Adjusted of inflation target differentials
“Modified” UIP
Page 15
Extension II: UIP Modifications External Risk Premium Shock
-0.5
0.0
0.5
1.0
1.5
2.0
2.5
0 5 10 15 20 25 30
Real exchange rate (s)
External Risk Premium (ΓB*)
Output (y)
Nominal interest rate (r)
inflation (πc)
Nominal exchange rate (S)
Baseline Model Non - “Modified” UIP
-0.05
0.00
0.050.10
0.15
0.20
0.25
0.300.35
0.40
0.45
0 5 10 15 20 25 30
-0.1
0.0
0.1
0.2
0.3
0.4
0.5
0 5 10 15 20 25 30
-0.5
0.0
0.5
1.0
1.5
2.0
2.5
0 5 10 15 20 25 30
-0.10
-0.05
0.000.05
0.10
0.15
0.20
0.250.30
0.35
0.40
0 5 10 15 20 25 30
0.0
0.5
1.0
1.5
2.0
2.5
3.0
0 5 10 15 20 25 30
Page 16
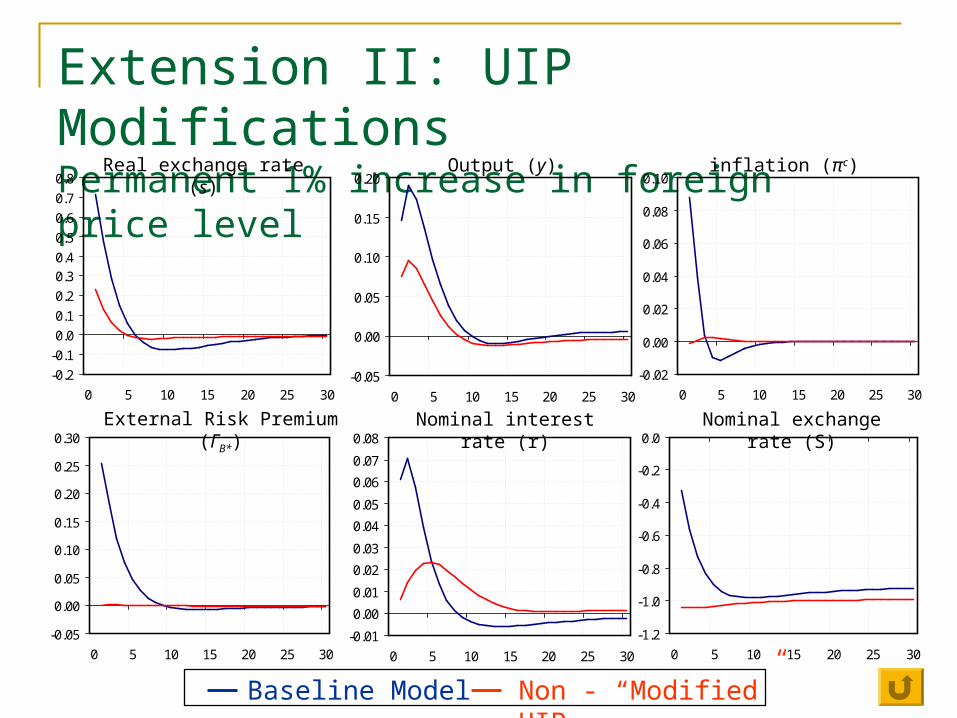
Extension II: UIP Modifications Permanent 1% increase in foreign price level
-0.2
-0.1
0.0
0.1
0.2
0.30.4
0.5
0.6
0.7
0.8
0 5 10 15 20 25 30
Real exchange rate (s)
External Risk Premium (ΓB*)
Output (y)
Nominal interest rate (r)
inflation (πc)
Nominal exchange rate (S)
Baseline Model Non - “Modified” UIP
-0.05
0.00
0.05
0.10
0.15
0.20
0 5 10 15 20 25 30
-0.02
0.00
0.02
0.04
0.06
0.08
0.10
0 5 10 15 20 25 30
-0.05
0.00
0.05
0.10
0.15
0.20
0.25
0.30
0 5 10 15 20 25 30-0.01
0.00
0.01
0.02
0.03
0.04
0.05
0.06
0.07
0.08
0 5 10 15 20 25 30
-1.2
-1.0
-0.8
-0.6
-0.4
-0.2
0.0
0 5 10 15 20 25 30
Page 17
Year-on-year Inflation and the Inflation Target – Israel and G4, 1992-2009
-4
-2
0
2
4
6
8
10
12
14
16
18
92 93 94 95 96 97 98 99 00 01 02 03 04 05 06 07 08 09
%
Israel: YoY inflation
Israel: Inflation target
Effective G4
Page 18
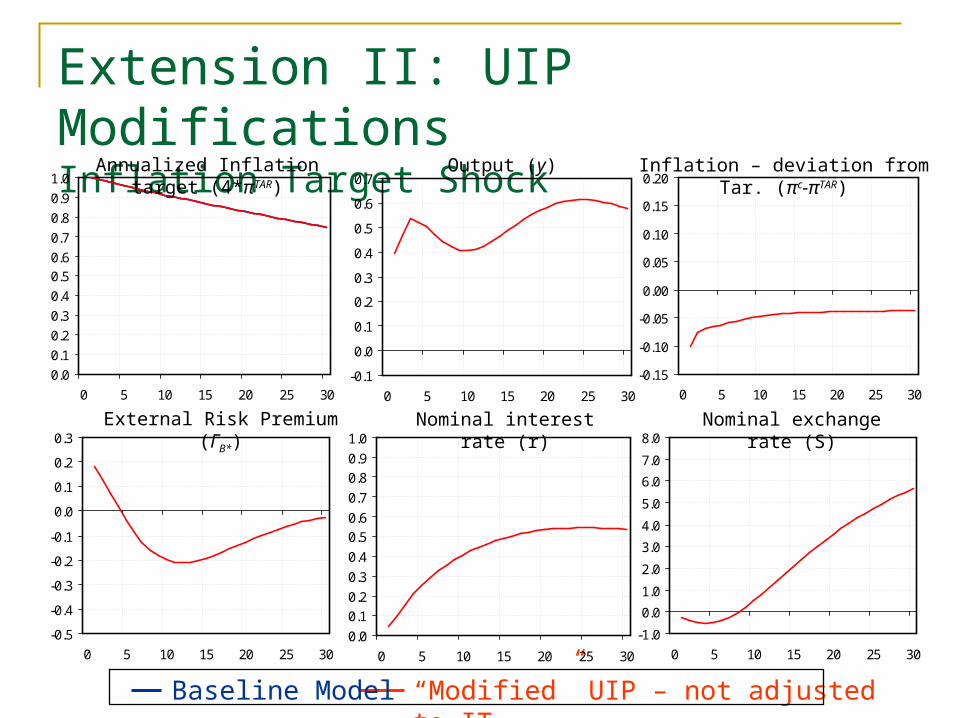
Extension II: UIP Modifications Inflation Target Shock
0.0
0.1
0.2
0.3
0.4
0.50.6
0.7
0.8
0.9
1.0
0 5 10 15 20 25 30
Annualized Inflation target (4*πTAR)
External Risk Premium (ΓB*) Nominal interest rate (r)
Inflation – deviation from Tar. (πc-πTAR)
Nominal exchange rate (S)
Baseline Model “Modified” UIP – not adjusted to IT
-0.15
-0.10
-0.05
0.00
0.05
0.10
0.15
0.20
0 5 10 15 20 25 30
-0.5
-0.4
-0.3
-0.2
-0.1
0.0
0.1
0.2
0.3
0 5 10 15 20 25 300.0
0.10.2
0.3
0.4
0.50.6
0.7
0.80.9
1.0
0 5 10 15 20 25 30
-1.0
0.0
1.0
2.0
3.0
4.0
5.0
6.0
7.0
8.0
0 5 10 15 20 25 30
Output (y)
-0.1
0.0
0.1
0.2
0.3
0.4
0.5
0.6
0.7
0 5 10 15 20 25 30
Page 19
Extension II: UIP Modifications Inflation Target Shock
External Risk Premium (ΓB*)
Output (y)
Nominal interest rate (r)
Inflation – deviation from Tar. (πc-πTAR)
Nominal exchange rate (S)
Baseline Model “Modified” UIP – not adjusted to IT
-0.1
0.0
0.1
0.2
0.3
0.4
0.5
0.6
0.7
0 5 10 15 20 25 30
-0.15
-0.10
-0.05
0.00
0.05
0.10
0.15
0.20
0 5 10 15 20 25 30
-0.5
-0.4
-0.3
-0.2
-0.1
0.0
0.1
0.2
0.3
0 5 10 15 20 25 300.0
0.1
0.20.3
0.4
0.5
0.6
0.70.8
0.9
1.0
0 5 10 15 20 25 30
-1.0
0.0
1.0
2.0
3.0
4.0
5.0
6.0
7.0
8.0
0 5 10 15 20 25 30
0.0
0.1
0.2
0.3
0.4
0.50.6
0.7
0.8
0.9
1.0
0 5 10 15 20 25 30
Annualized Inflation target (4*πTAR)
Page 20
Extension III: Time Varying LR Real RateMotivation
2.0%
3.0%
4.0%
5.0%
6.0%
7.0%
8.0%
9.0%
01-92 01-94 01-96 01-98 01-00 01-02 01-04 01-06 01-08
5-10 Years Ahead Forward Real Interest Rates (Derived from Government Indexed Bonds)
Israel
US
US (Nominal)
Page 21
Extension III: Time Varying LR Real Rate We add to the model:
Financial shock and structure that allow expected long-run (5 to
10 years) interest rates to change over time.
Monetary policy uses long-run interest rates (forward 5 to 10
years ahead) as benchmark rates.
Use data on long-run interest rates in estimation.
Page 22
Extension III: Time Varying LR Real Rate The explicit modeling From the households budget constraint:
Domestic financial premium:
Local bonds
Foreign bondsExternal risk premium
Local nominal rate
Foreign nominal rate
III. Domestic financial risk
premium shock
II. Symmetric financial risk-
premium shock
I. External financial risk-
premium shock
Page 23
Interest rate rule:
Long-run fwd real-rate:
Short-run real rate:
Inflation
Long-run fwd real rate
Extension III: Time Varying LR Real Rate The explicit modeling
OutputLong-runSmoothing
Inflation target
Page 24
The observable 5-10 year forward real rate derived from indexed government bonds:
Extension III: Time Varying LR Real Rate The explicit modeling
Observed fwd rate
Model predicted fwd rate
Constant Measurement error
Time varying term premium
Page 25
Extension III: Time Varying LR Real RateMotivation
2.0%
2.5%
3.0%
3.5%
4.0%
4.5%
5.0%
5.5%
6.0%
01-92 01-94 01-96 01-98 01-00 01-02 01-04 01-06 01-08
5-10 Years Ahead Forward Real Interest Rates (Derived from Government Indexed Bonds)
Israel
US
Model derived “pure” fwd real-rate
Page 26
Extension IV: The Rest of the WorldOptions at Hand How to model the rest of the world (i*, π*, y*)?
Single-equation AR. Problem: can’t apply structural foreign
shocks.
VAR (example - NAWM). Problem: “Well” looking structural
shocks depend on identification assumption.
Closed economy NK small model. Compared to AR: better fit, structural shocks.
Compared to VAR: worse fit, better interpretation of shocks.
Problem: variables relevant to world model may be less relevant to
Israeli economy. Solution: bridge equations.
Page 27
Extension IV: The Rest of the WorldThe world Model IS curve (world output):
Phillips Curve (CPI inflation) :
Taylor rule (CB key rates) :
Page 28
Extension IV: The Rest of the WorldObservable Variables Observable Variables:
i* – G4 effective CB key rates π* – G4 effective CPI inflation Δy* - Dilemma:
G4 effective output growth is more adequate for world model. G4 effective import growth (Δim* ) is more adequate to explain
Israeli exports:
Solution: use Δy* and Δim* in observable set. Define bridge equation:
Page 29
Extension IV: The Rest of the WorldRecap on Foreign Output Transmission Mechanism IS curve for G4 effective output (Δy* ):
Bridge equation for G4 imports:
Export demand equation
Page 30
Extension IV: The Rest of the WorldWorld Import Shock (blue) vs. World Demand shock (red)
-1.0
-0.5
0.0
0.5
1.0
1.5
2.0
2.5
3.0
0 5 10 15 20 25 30
World: imports (im*), output (y*) Output (y)
Nominal interest rate (r)
inflation (πc)
Nominal exchange rate (S)
-0.15
-0.10
-0.05
0.00
0.05
0.10
0.15
0.20
0.25
0.30
0 5 10 15 20 25 30
-0.04
-0.02
0.00
0.02
0.04
0.06
0.08
0 5 10 15 20 25 30
-0.2
-0.1
0.0
0.1
0.2
0.3
0.4
0.5
0.6
0 5 10 15 20 25 30
-0.5
-0.4
-0.3
-0.2
-0.1
0.0
0.1
0.2
0.3
0 5 10 15 20 25 30
World import shock (Non structural) World demand shock (structural)
World: key-rate (r*), inflation (π*)
-0.2
-0.1
0.0
0.1
0.2
0.3
0.4
0.5
0.6
0.7
0 5 10 15 20 25 30
Page 31
Extension IV: The Rest of the WorldWorld Import Shock (blue) vs. World Demand shock (red)
-1.0
-0.5
0.0
0.5
1.0
1.5
2.0
2.5
3.0
0 5 10 15 20 25 30
World: imports (im*), output (y*) Output (y)
Nominal interest rate (r)
inflation (πc)
Nominal exchange rate (S)
-0.15
-0.10
-0.05
0.00
0.05
0.10
0.15
0.20
0.25
0.30
0 5 10 15 20 25 30
-0.04
-0.02
0.00
0.02
0.04
0.06
0.08
0 5 10 15 20 25 30
-0.2
-0.1
0.0
0.1
0.2
0.3
0.4
0.5
0.6
0 5 10 15 20 25 30
-0.5
-0.4
-0.3
-0.2
-0.1
0.0
0.1
0.2
0.3
0 5 10 15 20 25 30
World import shock (Non structural) World demand shock (structural)
World: key-rate (r*), inflation (π*)
-0.2
-0.1
0.0
0.1
0.2
0.3
0.4
0.5
0.6
0.7
0 5 10 15 20 25 30
Page 33
Schematic Diagram: Resources and Uses
C Private Consumption
IM Imports
G Public consumption
I Investment
H Intermediate goods
)Y – Gross Domestic Product(
K Capital
L Labor
X Exports
Page 34
Schematic Diagram: Prices
PC Private Consumption
PIM Imports
PG Public consumption
PI Investment
PH Intermediate goods
)Y – Gross DomesticProduct(
RK Rent
W Wage
PX Exports
Page 35
Schematic Diagram: Production and Inputs
Nh Nh Nh Nh
Monopolistic CompetitionWage Rigidity (Calvo,1983)
Labor aggregateNf
Intermediate good Hf
Nh
Capital servicesKs
f
TechnologyZ, ε
Production Function
Hf
Hf
InvestmentI
Capital stockKh
Utilization rate
u
Adjustment costsInvestment productivity
Households
Page 36
Schematic Diagram: From Intermediate Goods to Final Goods
Hf Hf Hf Hf
Monopolistic CompetitionPrice Rigidity (Calvo,1983)
Homogenous local intermediate good
H (Y)
Final Local UsesC, I, G
Hf IMf IMf IMf
Homogenous imported intermediate good
IM
IMfIMf
Xf
Xf
Xf
Export (stage I) QX
Homogenous Export good
X
Monopolistic CompetitionPrice Rigidity (Calvo,1983)
Foreign products
X *
Foreign DemandY*
Perfect Competition
MCCalvo
Page 37
Schematic Diagram: Monetary Transmission Process (signs relate to interest rate hike)
Ls
Ks
RBoI interest
rateS
Nominal ExchangeRate
PIM
Imports prices
PcConsumer Price
Index
sReal Exchange
Rate
RM-πExpected real
interestRate (Market)
WWage
LD
KD RK
Rent
PH
Price of domestic intermediate goods
I
C
NX
Production costs
(-)
(-)
(+)
(+)
YOutput
Supply (-)
(+)
(-)
DemandFactors of production
(-)
(+)
(-) (-)
(-)
(-)
(-)
(-) (-)
(-)
(-) (-)
(+)
Demands