54
Page 1 of 54 THE BAR STANDARDS BOARD CENTRAL EXAMINATIONS BOARD CHAIR’S REPORT Summer 2019 Sitting

Page 1 of 54
THE BAR STANDARDS BOARD CENTRAL EXAMINATIONS BOARD
CHAIR’S REPORT
Summer 2019 Sitting
Page 2 of 54
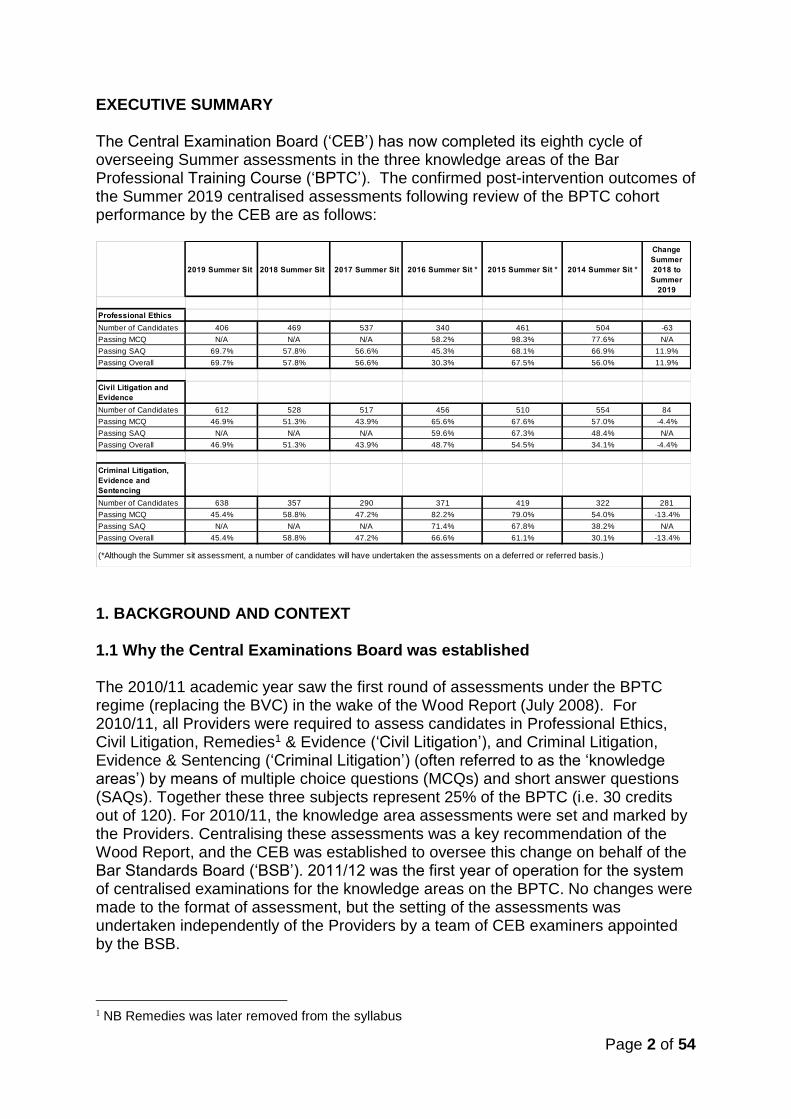
EXECUTIVE SUMMARY The Central Examination Board (‘CEB’) has now completed its eighth cycle of overseeing Summer assessments in the three knowledge areas of the Bar Professional Training Course (‘BPTC’). The confirmed post-intervention outcomes of the Summer 2019 centralised assessments following review of the BPTC cohort performance by the CEB are as follows:
2019 Summer Sit 2018 Summer Sit 2017 Summer Sit 2016 Summer Sit * 2015 Summer Sit * 2014 Summer Sit *
Change
Summer
2018 to
Summer
2019
Professional Ethics
Number of Candidates 406 469 537 340 461 504 -63
Passing MCQ N/A N/A N/A 58.2% 98.3% 77.6% N/A
Passing SAQ 69.7% 57.8% 56.6% 45.3% 68.1% 66.9% 11.9%
Passing Overall 69.7% 57.8% 56.6% 30.3% 67.5% 56.0% 11.9%
Civil Litigation and
Evidence
Number of Candidates 612 528 517 456 510 554 84
Passing MCQ 46.9% 51.3% 43.9% 65.6% 67.6% 57.0% -4.4%
Passing SAQ N/A N/A N/A 59.6% 67.3% 48.4% N/A
Passing Overall 46.9% 51.3% 43.9% 48.7% 54.5% 34.1% -4.4%
Criminal Litigation,
Evidence and
Sentencing
Number of Candidates 638 357 290 371 419 322 281
Passing MCQ 45.4% 58.8% 47.2% 82.2% 79.0% 54.0% -13.4%
Passing SAQ N/A N/A N/A 71.4% 67.8% 38.2% N/A
Passing Overall 45.4% 58.8% 47.2% 66.6% 61.1% 30.1% -13.4%
(*Although the Summer sit assessment, a number of candidates will have undertaken the assessments on a deferred or referred basis.)
1. BACKGROUND AND CONTEXT 1.1 Why the Central Examinations Board was established The 2010/11 academic year saw the first round of assessments under the BPTC regime (replacing the BVC) in the wake of the Wood Report (July 2008). For 2010/11, all Providers were required to assess candidates in Professional Ethics, Civil Litigation, Remedies1 & Evidence (‘Civil Litigation’), and Criminal Litigation, Evidence & Sentencing (‘Criminal Litigation’) (often referred to as the ‘knowledge areas’) by means of multiple choice questions (MCQs) and short answer questions (SAQs). Together these three subjects represent 25% of the BPTC (i.e. 30 credits out of 120). For 2010/11, the knowledge area assessments were set and marked by the Providers. Centralising these assessments was a key recommendation of the Wood Report, and the CEB was established to oversee this change on behalf of the Bar Standards Board (‘BSB’). 2011/12 was the first year of operation for the system of centralised examinations for the knowledge areas on the BPTC. No changes were made to the format of assessment, but the setting of the assessments was undertaken independently of the Providers by a team of CEB examiners appointed by the BSB. 1 NB Remedies was later removed from the syllabus

Page 3 of 54
1.2 The 2011/12 to 2015/16 assessment formats From the 2011/12 academic year, up to and including the 2015/16 academic year, candidates in each of the three centrally assessed subjects were required to attempt an MCQ test, and a SAQ test. The Civil and Criminal Litigation assessments each comprised a paper requiring candidates to attempt 40 MCQs and five SAQs in three hours. The Professional Ethics assessment required candidates to attempt 20 MCQs and three SAQs in two hours. All questions in all papers were compulsory and the pass mark in each part of each paper was fixed at 60%. All MCQ papers were marked electronically using Speedwell scanning technology. All SAQ papers were marked by teaching staff at the relevant Provider institution, with marks being remitted to the CEB for processing. The marks for the MCQ and SAQ elements of each of the papers were aggregated to provide each candidate with a combined mark for each subject. Candidates were required to achieve the pass mark of 60% in both elements of each assessment, there being no scope for the aggregation of marks below 60% between MCQ and SAQ scores to achieve the minimum 60% pass mark overall. 1.3 The assessment formats from Spring 2017 onwards Acting on the recommendations of the BSB’s Education and Training Committee, from the Spring 2017 sitting, the CEB introduced significant changes to the format and marking processes for the centralised assessments on the BPTC. Both the Civil Litigation and Criminal Litigation assessments were modified to become three-hour papers comprising 75 MCQ and Single Best Answer (SBA) questions. This change meant that the answers for the entire paper in each subject could be marked electronically using Speedwell scanning technology. The assessment in Professional Ethics became a two-hour paper (increased to two hours and thirty minutes from the Spring 2018 sit) comprised of six SAQs, the marking being undertaken by a team of independent markers appointed by the BSB. 1.3.1 2017 was also the first year in which Bar Transfer Test (BTT) candidates had
to take centralised assessments in the three knowledge areas rather than assessments set by BPP University, the institution appointed by the BSB to provide BTT training. For the Spring 2017 sitting, BTT candidates thus sat the same Civil Litigation and Criminal Litigation papers as the BPTC cohort on the same dates, and (for logistical reasons relating to the Spring 2017 assessment) a separate Professional Ethics paper. For the Spring 2018 sit, BTT candidates attempted the same Professional Ethics assessment as the BPTC candidates (see section 6 for BTT results). Unless otherwise specified, cohort performance data analysed in this report, and any assessment reliability analysis is based on the results achieved by BPTC candidates only.

Page 4 of 54
1.4 Table of Provider centres and active dates
Provider Centre 11/12 12/13 13/14 14/15 15/16 16/17 17/18 18/19
BPP University
London Yes Yes Yes Yes Yes Yes Yes Yes
BPP University
Leeds Yes Yes Yes Yes Yes Yes Yes Yes
BPP University
Manchester No No Yes Yes Yes Yes Yes Yes
BPP University
Birmingham No No No No Yes Yes Yes Yes
BPP University
Bristol No No No No No No Yes Yes
Cardiff University
Cardiff Yes Yes Yes Yes Yes Yes Yes Yes
City University
London Yes Yes Yes Yes Yes Yes Yes Yes
University of Law (‘ULaw’)
Birmingham Yes Yes Yes Yes Yes Yes Yes Yes
University of Law (‘ULaw’)
London Yes Yes Yes Yes Yes Yes Yes Yes
University of Law (‘ULaw’)
Leeds No No No No No Yes Yes Yes
University of the West of England (‘UWE”)
Bristol Yes Yes Yes Yes Yes Yes Yes Yes
University of Northumbria (‘UNN’)
Newcastle Yes Yes Yes Yes Yes Yes Yes Yes
Manchester Metropolitan University (‘MMU’)
Manchester Yes Yes Yes Yes Yes Yes Yes Yes
Nottingham Trent University (‘NTU’)
Nottingham Yes Yes Yes Yes Yes Yes Yes Yes
Kaplan Law School
London Yes Yes Yes Referrals only
No No No No
1.4.1 As indicated above, BPP started to deliver the BPTC in Manchester in the
2013/14 academic year, in Birmingham in the 2015/16 academic year, and in Bristol, for the first time, in the 2017/18 academic year. The University of Law Leeds centre had examination candidates for the first time in Spring 2017. Kaplan Law School recruited its last intake in the 2013/14 academic year (although it had a very small number of referred and deferred candidates in the Spring 2015 cohort and a handful of candidates finishing in the 2015/16 academic year).
1.5 Terms used in this report
• “All-Provider” refers to the aggregated data bringing together cohort performance across all Providers centres
• “By Provider” refers to data comparing the performance of each of the Providers relative to each other

Page 5 of 54
• “Spring sit” refers to the March/April/May exam cycle. Note that some candidates undertaking these examinations may be doing so on a referred or deferred basis
• “Summer sit” refers to the August exam cycle. Some candidates undertaking these examinations may be doing so on a deferred basis (i.e. as if for the first time)
• “Combined” refers to the pre-Spring 2017 assessment format where the result for a centrally assessed knowledge area was arrived at by aggregating a candidate’s MCQ and SAQ scores.
2. THE ASSESSMENT PROCESS SPRING 2017 ONWARDS The assessment process is overseen by the CEB whose members are appointed by the BSB. The CEB comprises a Chair, teams of examiners (a Chief Examiner and a number of Assistant Examiners for each subject), an independent observer, an independent Psychometrician and senior staff from the BSB. The Chair and the examiners between them contribute a mix of both academic and practitioner experience. 2.1 How examination papers are devised and approved 2.1.1 The bank of material used for compiling the centralised assessments is
derived from a number of sources, including, questions devised by specialist question writers commissioned by the BSB (some of whom are based at Provider institutions), questions devised by members of the central examining teams, and some questions adapted from material originally submitted by Provider institutions at the request of the BSB.
2.1.2 Draft assessment papers are compiled by the relevant CEB examiner teams,
under the guidance of the Chief Examiner for each centrally assessed knowledge area. A series of paper confirmation meetings are held, attended by the relevant examiner team, the Chair of the CEB, and key BSB support staff. These meetings consider the suitability of each question and the proposed answer, with particular emphasis on balance of coverage, syllabus coverage, currency of material, clarity and coherence of material, and level of challenge. If a question has been used previously, we also consider the statistics regarding its prior performance. In addition, the draft Litigation papers are reviewed by the BSB’s syllabus team to ensure that all questions comply with the current curriculum. Any recommendations made during this process by the BSB’s syllabus team are passed on to the Chief Examiner who will determine any changes to be made to the draft paper. The draft paper is then stress tested under the equivalent of exam conditions, and the outcomes used to inform further review by the relevant Chief Examiner. For Professional Ethics, a Technical Reader checks the draft exam paper to assess whether the examination questions are, in legal terms, technically correct and the language sufficiently clear. The outcome of this process is fed back to the Chief Examiner who makes the final decision on whether to alter any of the questions as a result. Finally, a proof reader checks each exam paper for compliance with house style, grammatical accuracy, typographical errors; and ease of reading.
Page 6 of 54
2.2 Standard setting: Civil Litigation & Evidence, and Criminal Litigation, Evidence & Sentencing 2.2.1 Before candidates attempt the examinations for Civil Litigation and Criminal
Litigation the papers are subjected to a standard setting process to determine a pass standard which will be recommended to the Final Examination Board. The method used for these two subjects is known as the Angoff Method, and it helps ensure that the standard required to achieve a pass mark is consistent from one sitting of the assessment to the next. Using standard setting, the number of MCQs a candidate needs to answer correctly in order to pass the assessment may go up or down from one sitting to the next depending on the level of challenge presented by the exam paper as determined by the standard setters. For a more detailed explanation of this process consult the BSB website.
2.2.2 Standard setting for the Professional Ethics paper takes place after the examination in that subject as explained below at 2.5.
2.3 How the exams are conducted 2.3.1 For the Summer 2019 sitting candidates at each of the Provider institutions
attempted the assessments in each of the knowledge areas on the same dates as follows:
BPTC and BTT Professional Ethics Friday 16 August 2019 at 2pm BPTC and BTT Civil Litigation Monday 19 August 2019 at 2pm BPTC and BTT Criminal Litigation Wednesday 21 August 2019 at 2pm 2.3.2 In any case where a Provider identifies candidates as having special
assessment arrangements necessitating a start time earlier than that of the main cohort, the relevant candidates are not allowed to leave their assessment area until the commencement of the main cohort assessment. Secure delivery and collection arrangements are put in place for all examination materials.
2.3.3 In exceptional circumstances candidates can be allowed to attempt the
assessments at locations overseas. The onus is placed on the candidates’ Provider institution to ensure that a secure assessment centre is available, and the BSB normally requires the start time of the examination at the overseas centre to be the same as the UK start time (an earlier/later start time may be permitted provided there is an overlap and candidates are quarantined). To ensure the complete security of the examination papers the BSB dispatches all examinations to the overseas contacts directly. See: https://www.barstandardsboard.org.uk/training-qualification/bar-qualification-manual/part-2-for-students-pupils--transferring-lawyers/b4-centralised-assessments.html
2.3.4 Provider institutions are given guidance on examination arrangements by the
BSB. Exam invigilation reports are submitted by Providers, detailing any issues they believe may have had a material bearing on the conduct of the

Page 7 of 54
examination itself at their assessment centres (for example, public transport strikes, bomb alerts, fire alarms, building noise), and these reports will be considered at the CEB Subject and Final Exam Boards.
2.3.5 Each Provider oversees its own "fit to sit" policy. Some Providers require
candidates to complete a "fit to sit" form at the time of an exam. Other Providers will complete this process at enrolment, candidates confirming that if they are present at the time of the exam, they are fit to sit the exam.
2.4 Marking 2.4.1 Candidates attempting the MCQ papers in Civil Litigation and Criminal
Litigation record their answers on machine-readable answer sheets. Provider institutions return the original answer sheets to the BSB for machine marking. The MCQ answer sheet scanning is undertaken by specially trained BSB support staff, using Speedwell scanners and software. The scanner removes the risk of wrongly capturing marks which may occur with human input. This process enables accurate production of data statistics and results analysis.
2.4.2 For Professional Ethics, candidates write their answers to the SAQs in the
answer booklets supplied by the BSB. These are scanned and uploaded to Objective Connect by the Provider institutions, each candidate having a unique candidate number.
2.4.3 Once scripts are uploaded, the BSB staff compare the scripts received with
the exam attendance lists supplied by Providers to ensure all the expected scripts have been received. A more comprehensive check takes place which checks that each script is completely anonymised of Provider information, all pages are accounted for and all SAQs have been attempted. This is used in a later check of any marks reported as Did Not Attempt (“DNA”).
2.4.4 Markers are divided into teams - there are always six markers in each team
but the number of teams depend on the number of markers available and the number of Professional Ethics scripts to be marked - for Summer 2019 there were seven marking teams, each marker dealt with 67/68 scripts each during the first marking process. Teams consist of BPTC Provider staff and practitioners. Care is taken to ensure Provider-based markers are not marking their own candidates’ scripts. This arrangement means that one member in each of the six marking teams only marks SAQ1, another only marks SAQ2 and so on. The advantage of this approach is that a candidate’s script is marked by six different examiners, thus helping to even out the impact of markers who are “hawks” (harsher markers) and “doves” (more generous markers). It also removes the ‘halo effect’ whereby a good (or poor) answer to a particular SAQ influences the marks awarded to other answers.
2.4.5 Markers are allocated to an SAQ that matches their area of expertise (Civil
and Criminal Law). Up to ten sample scripts are selected at random from each team’s pool, ensuring there are scripts from each Provider being marked by that team. Each marker marks his or her allocated SAQ across all sample scripts according to the existing mark scheme (version 1). Therefore, up to 50

Page 8 of 54
scripts are sampled by the markers. The examining team reviews the majority of the sample scripts but not necessarily all of them. Markers are invited to a markers’, meeting where markers are divided into groups based on the SAQ they have been allocated and this generates a discussion that influences and feeds into a revised mark scheme (version 2). A Team Leader is allocated to each team and acts as a liaison between the markers and the Chief Examiner. The Team Leader addresses any general marking queries and seeks clarification from the examining team when required, minimising the time it takes the team to respond to each query directly.
2.4.6 Markers are supplied with an Excel spreadsheet onto which they enter the relevant data. The spreadsheet is pre-populated with the candidate numbers for the scripts being marked by a particular team and lists all the bullet points available for the SAQ, enabling a full breakdown of how candidates achieved their final marks. The spreadsheet is locked to accept only the characters accepted in the mark scheme (i.e. – if a point in an SAQ marking scheme is worth 1 mark, the only possible marks are 0 and 1). This minimises the risk of allocating too few or too many marks to a candidate. The spreadsheet can be updated upon issue of version 2 of the mark scheme, if there are any changes to the marks available per SAQ or its marks breakdown. Where a candidate achieves a mark of 0, markers are required to confirm if a candidate did so because their answer did not attract any marks or because the question was not attempted. Markers also report if they deem a SAQ/script to be illegible. Markers record their marks on the spreadsheet, and these are returned to the CEB for processing and further clerical checks and missing marks. The spreadsheet permits analysis of the way in which all markers approached a particular question and allows comparison of marker group performance and individual marker performance. The examining team provides markers with a finalised marking scheme and they are encouraged to raise queries with the Team Leader as their marking progresses. Team Leaders in turn direct any material queries to the Chief Examiner.
2.4.7 Markers are instructed that they may award a candidate a mark of 0 for a part
of an answer if what the candidate has written is incoherent prose (bullet-point answers are acceptable). Similarly, where the salient points can only be identified by the marker making an extensive search for points throughout unconnected parts of the examination script, they are instructed that they may award a mark of 0 rather than joining together unconnected points from across the candidate’s script. Any decision by a marker that a script falls below these thresholds is subject to review and moderation to ensure fairness and consistency in the application of these threshold requirements. Similarly, where a marker is having difficulty with the legibility of a candidate’s script the marker will, in the first instance, print the relevant pages to see if that assists and, if difficulties persist, escalate the matter to the marking team leader to resolve. Where necessary, issues of legibility can be referred to the CEB examining team for further assistance and a final decision on whether a script is legible or not. Where part of an answer is confirmed as being illegible, the candidate can still be awarded marks for that part of the answer that is legible.

Page 9 of 54
2.4.8 Once first marking has been completed, Team Leaders are responsible for checking a sample of marks from each of their team members, checking that marking has been done in accordance with the mark scheme. Once this moderation process has taken place, the Team Leader produces a report indicating any areas for concern or agreeing to the approach to marking taken by the team members. The reports are considered by the CEB examining team. The Team Leaders’ marks are moderated by the CEB examining team.
2.4.9 Once standard setting has taken place (see 2.5 below), scripts which have
been scored to a certain point below the pass standard as determined by the Psychometrician are second marked. Second marking is undertaken ‘blind’ (i.e. second markers do not know the marks awarded by the first markers) and by SAQ, rather than by script (i.e. those markers who first marked SAQ1 will second mark SAQ1). Care is taken to ensure the second markers do not mark scripts from their own institution. Second marks are submitted to the BSB who will compare the first marking with the second marking. Both markers are then responsible for discussing the marks awarded and for coming to an agreement on the final mark to be awarded to the candidate.
2.4.10 Once all the marks are agreed, the BSB will compare all records of DNA
submitted by the markers with those recorded on the first check conducted by the BSB. It is assumed that marks awarded by the marker for a DNA recorded by the BSB checking staff are for the benefit of the candidate and no further action is taken (as the BSB staff are not qualified to make an academic judgement about whether the question has been answered but wrongly identified). Where the marker awarded DNA but the BSB has not identified it as such, the query is raised with the marker.
2.4.11 For all three centrally assessed knowledge areas, once the marking is
completed, statistical data is generated (based on candidates' marks) and presented at a series of examination Boards.
2.5 Standard setting for the Professional Ethics assessment In Professional Ethics, standard setting uses the Contrasting Groups method.
Candidate scripts are marked (as explained at 2.4.2 to 2.4.10 above) and a group of standard setters (who are not aware of the marks awarded) review a sample of scripts in order to allocate them to one of three groupings: “pass”, “fail” or “borderline”. Once this process is complete the data is analysed to identify the correlation between the marks awarded and the “borderline” performance, and in turn the recommended passing standard for the assessment. For a more detailed explanation of this process consult the BSB website.

Page 10 of 54
2.6 Examination Boards 2.6.1 The CEB operates a two-tier examination Board process. A first-tier Subject
Board is convened for each of the knowledge areas attended by all members of the examining team, the independent Psychometrician and independent observer. The recommendations from each of these first-tier Boards are then fed into an over-arching Final Examination Board where the recommendations are considered and a final decision on cohort performance in each of the centralised assessment knowledge areas is arrived at.
2.6.2 The Subject Board is advised by the independent Psychometrician in respect
of the outcome of the standard setting process and whether there are any grounds to question the reliability of the assessment, or whether there are any other factors that might lead the Subject Board to recommend a different pass standard. Once the Subject Board agrees what its recommendation to the Final Board will be in respect of the passing standard to be applied, the Subject Board reviews the raw data on cohort performance in relation to the assessment as a whole (overall passing rate and Provider cohort passing rates) and the results for each component question (or part-question) making up the assessment.
The key data presented to the Subject Board (reflecting the recommended
pass standard) will also include:
• overall pass rates and Provider pass rates for the current and previous two cycles of assessment.
• data showing the pass rate for each MCQ (for Civil and Criminal Litigation) and each component of each Ethics SAQ, achieved at each of the Providers cross-referenced to the representations made in the assessment pro-formas returned by the Providers – thus flagging up any correlation of Provider criticisms and concerns with systemic poor performance by candidates.
• ‘Manhattan’ diagrams (pentile histograms) which rank candidates (for Civil and Criminal Litigation) into 20% bands based on their performance in an exam. For each exam question, the first bar of the Manhattan diagram shows the top 20% of candidates and the proportion who answered the question correctly. A decrease in correct answers going down through the bands indicates a good discrimination between strong and weak candidates.
• statistical analysis by the Psychometrician.
• the Chief Examiner’s commentary on the assessment process.
• Invigilator reports detailing evidence of issues that may have impacted on the conduct of the examination itself at any Provider centre.
2.6.3 On the basis of the above evidence, and as advised by the independent
Psychometrician, the Subject Boards have the discretion to intervene where there is evidence that a particular element of an assessment has not operated effectively. Options typically include:
• crediting more than one answer to an MCQ as correct.
Page 11 of 54
• disregarding an MCQ or part of an SAQ entirely if deemed defective or inappropriate (e.g. no correct answer) – no candidate is credited, and the maximum score is recalculated.
• crediting all candidates with the correct answer if an MCQ or part of an SAQ is deemed defective or inappropriate.
• scaling overall marks for an assessment, or for a sub-cohort due to local assessment issues (provided the sub-cohort constitutes a statistically reliable sample for scaling purposes).
• (in respect of the Professional Ethics SAQ results) scaling the marks awarded by a marker, second marker, or marking team.
2.6.4 In confirming marks for cohorts of candidates the CEB is concerned to ensure
that a consistent measure of achievement has been applied across all Providers, and that proper account has been taken of any relevant factors that may have had a bearing on the performance of a cohort of candidates. As a result, the CEB has the discretion to scale cohort marks (upwards or downwards) if it feels there are issues relating to all candidates, or a statistically relevant sub-cohort of candidates, that justify such intervention. The CEB will not use this discretion to intervene in respect of issues arising from the delivery of the course by a Provider or matters related to the conduct of the assessment that can be dealt with through a Provider’s extenuation processes.
2.6.5 The Final Examination Board considers the recommendations of the Subject
Boards in respect of the Provider cohort performances in the three knowledge areas. The meeting is attended by the CEB Chair, the relevant Chief Examiners, key BSB staff, an independent Psychometrician and independent observer. The function of the Final Examination Board is to test the recommendations of the Subject Boards, and to confirm the MCQ/SAQ cohort marks subject to any outstanding quality assurance issues. Once cohort marks are confirmed by the CEB they cannot subsequently be altered by Provider institutions. The process for challenging marks confirmed by the CEB is outlined here.
2.7 Reporting results to Providers 2.7.1 Once the CEB has confirmed the centralised assessment marks for each
cohort of candidates at each Provider the marks are distributed to the Providers where they feed into the individual BPTC or BTT candidate profiles considered at the Provider award and progression examination Boards. The actual scores achieved by candidates need to be aligned with a 60% passing mark in order to best fit with the Providers’ systems. Hence if, for example, the passing standard for Criminal Litigation is 43/75 (in effect 57%), a candidate achieving 43/75 will be reported as having a score of 60% (the pass mark). All other candidate scores will be translated accordingly depending on the pass standard adopted.
2.7.2 It is at the BPTC Provider examination boards that issues relating to individual
candidates such as extenuating circumstances or academic misconduct are considered.

Page 12 of 54
2.8 Grade boundary allocations 2.8.1 In addition to receiving a % score for each of the centrally assessed subjects,
BPTC candidates are also allocated to one of four grade groups (Outstanding, Very Competent, Competent and Not Competent) depending on their performance in each assessment. The CEB does not exercise any discretion in respect of these gradings – they are a product of the score achieved by the candidate. Prior to the introduction of standard setting to determine the pass standard for centralised assessments, the 60% to 100% range used for the awarding of passing grades was apportioned as follows:
• 10% of the 60 to 100 range (60-69%) for “Competent” (i.e. 25% of the available range from 60% to 100%);
• 15% of the 60 to 100 range (70-84%) for “Very Competent” (i.e. 37.5% of the available range from 60% to 100%); and
• 15% of the 60 to 100 range (85-100%) for “Outstanding” (i.e. 37.5% of the available range from 60% to 100%),
This was effectively a 2:3:3 allocation ratio across the three passing grades. 2.8.2 At its June 2017 meeting, the CEB Final Examination Board reviewed the
options in respect of the approach to be adopted to the allocation of grade boundaries in the light of the introduction of standard setting (where the mark equating to the passing standard can vary from one assessment to the next). Two options were considered: the “2:3:3” ratio methodology and a norm-referencing approach. Norm-referencing takes data from previous cycles as an indication of what a typical cohort performance might be expected to look like.
2.8.3 On the basis of the four Spring assessment cycles from 2012/13 to 2015/16
the averages for each of the centrally assessed subjects were:
Professional Ethics Outstanding
Very Competent Competent
Not Competent
2012/13 20.2 54.5 11.6 13.7
2013/14 8.2 34.9 18.6 40.3
2014/15 8.8 35.4 12.5 43.3
2015/16 16.3 47 6.9 29.8
Average 4 cycles
13.1 43.0 12.2 31.8
Criminal Litigation Outstanding
Very Competent Competent
Not Competent
2012/13 14.0 42.8 11.3 31.8
2013/14 16.8 39.2 16.8 28.2
2014/15 18.5 33.6 11.5 38.5
2015/16 20.7 36.1 13.3 29.7
Average 4 cycles 18.3 38.9 13.2 31.6

Page 13 of 54
Civil Litigation Outstanding
Very Competent Competent
Not Competent
2012/13 8.4 31.8 18.0 43.8
2013/14 8.6 32.8 18.6 42.6
2014/15 13.0 31.6 13.4 42.0
2015/16 16.1 31.3 14.8 38.8
Average 4 cycles 11.0 31.9 15.7 41.6
2.8.4 Taking Professional Ethics as the example, on average over those four
assessment cycles,13% of candidates achieved “Outstanding”, 43% “Very Competent” and 12% “Competent”, the remainder being “Not Competent”. Taking those that passed as a group the ratio of the three passing grades was roughly 23:59:18. Using the same methodology, the ratios were approximately 26:55:19 for Criminal Litigation and approximately 19:54:27 for Civil Litigation.
2.8.5 Applying the “2:3:3” ratio methodology, if the standard setting process
produced pass standards of 45/75 (60%) for both the Civil and Criminal Litigation papers the grade boundary points would be as follows (applying the 25%; 37.5% and 37.5% proportions above):
MarkThresholds
Raw Scaled Scalefactor
Competent 45 60 1.33
VeryCompetent 53 70 1.32
Outstanding 64 85 1.33
Maxmark 75 100 1.33 2.8.6 Similarly, for Professional Ethics (where a score of 36/60 would be 60%) the
grade boundary points would be:
MarkThresholds
Raw Scaled Scalefactor
Competent 36 60 1.67
VeryCompetent 42 70 1.67
Outstanding 51 85 1.67
Maxmark 60 100 1.67 2.8.7 Where, however, the standard setting process recommends a pass standard
that deviates from 45/75 or 36/60 the grade boundaries need to be recalibrated to maintain the 2:3:3 ratio (as explained at above at 2.8.3). For example, if the Civil Litigation pass standard was determined to be 50/75 (reflecting a view by the standard setters that the paper was less challenging) the grade boundaries (using the methodology outlined above) would be as follows:

Page 14 of 54
MarkThresholds
Raw Scaled Scalefactor
Competent 50 60 1.20
VeryCompetent 56 70 1.24
Outstanding 66 85 1.30
Maxmark 75 100 1.33
Hence, with a pass standard of 50/75, a candidate would have to correctly answer at least 66/75 MCQs to be classified as “Outstanding” instead of 64/75 if the pass standard had been 45/75.
2.8.8 Similarly if, for example, in Professional Ethics the standard setting process produced a pass standard of 24/60 the grade boundaries (using the methodology outlined above) would be as follows:
MarkThresholds
Raw Scaled Scalefactor
Competent 24 60 2.50
VeryCompetent 33 70 2.12
Outstanding 47 85 1.83
Maxmark 60 100 1.67
Hence, a candidate would only have to achieve 47/75 to be classified as “Outstanding” instead of 51/75 if the pass standard had been 36/60.
2.8.9 The Spring 2017 Final Examination Board was unanimous in its view that the
“2:3:3” ratio methodology was to be preferred as a more objective approach to allocating candidates to the grade boundary framework on the basis that it was neither transparent nor best practice to adopt a quota-based approach to grade boundaries, and such an approach was not reflected in any other aspect of the CEB’s work. The CEB has always taken the view that the percentage of candidates falling within any particular grade boundary was a product of the examination process and not something that was in any way engineered by the CEB as a desirable or acceptable outcome.
2.8.10 Note that where a candidate’s standard setting adjusted % score falls
between two whole numbers a rounding up methodology is applied, hence a candidate with a post standard setting score of 69.5% is reported as “Very Competent” as the 69.5% is treated, for the purposes of grade boundary allocation, as 70%.

Page 15 of 54
3. SUMMER 2019 RESULTS IN PROFESSIONAL ETHICS 3.1 Professional Ethics pre-intervention pass rates – all Providers Summer 2017 to Summer 2019
Professional Ethics All Provider pre-intervention
Summer 2019 Summer 2018 Summer 2017
69.7% 57.8% 49.0%
3.1.1 The table above shows a Summer 2019 pre-intervention passing rate of
69.7%; that is a significant improvement on Summer 2018 and is highest achieved across the three sittings for which data is provided. The Summer 2019 passing rate is a product of the Final Board endorsing a recommended passing standard for the Professional Ethics SAQ assessment of 26/60 (see 2.5 above for further explanation of standard setting). Data from cycles prior to Summer 2017 have been excluded as the form of assessment was different 2017 (an MCQ paper comprising twenty questions, and an SAQ paper comprising three questions – both elements having a fixed pass mark of 60%).
3.2 Details of Final Examination Board discussions 3.2.1 The Board noted the all-Provider BPTC pre-intervention pass rate of 69.7%
achieved by 406 candidates, alongside the passing rate for the cohort of 67 BTT candidates which was 54.5%.
3.2.2 The Psychometrician reported that the standard setting process took place with
the now usual number of 15 standard setters, following the usual method which determined a passing standard of 26/60.

Page 16 of 54
3.3 Detailed statistical analysis of each SAQ sub-part
SAQ
SAQ 1(a)
Marks
Mean
Std Dev2
Corr. with other Qs3
Cont. to total
variance4
Expected
cont.5
6 3.54 1.18 0.39 10.2 10
No material issues were raised in relation to this question. The Final Board decided no intervention was warranted.
SAQ 1(b)
Marks
Mean
Std Dev
Corr. with other Qs
Cont. to total
variance
Expected
cont.
4 2.38 0.86 0.33 6.2 6.7
No material issues were raised in relation to this question. The Final Board decided no intervention was warranted.
SAQ 2(a)
Marks
Mean
Std Dev
Corr. with other Qs
Cont. to total
variance
Expected
cont.
6 3.02 1.24 0.28 8.9 10
This question sub-part was highlighted by the Psychometrician because the correlation with other questions was below 0.3 (0.28), he gave a possible explanation that this question tested an area that was different to the other questions on the question paper. However, the Chief Examiner observed that the question dealt with the cab-rank rule, which is a fundamental aspect of the Professional Ethics syllabus and analysis of the mark scheme revealed where candidates missed marks on this question. The Final Board analysed the data presented, discussed and reviewed the question. It was agreed that the question was fit for purpose and could be reused unchanged in the future if needed. The Final Board decided no intervention was warranted.
SAQ 2(b)
Marks
Mean
Std Dev
Corr. with other Qs
Cont. to total
variance
Expected
cont.
4 1.98 0.85 0.31 6.1 6.7
No material issues were raised in relation to this question. The Final Board decided no intervention was warranted.
SAQ 3(a)
Marks
Mean
Std Dev
Corr. with other Qs
Cont. to total
variance
Expected
cont.
2 Standard deviation 3 Correlation with other questions 4 Contribution to total variance 5 Expected contribution to total variance

Page 17 of 54
SAQ
5 2.71 1.2 0.33 8.3 8.3
No material issues were raised in relation to this question. The Final Board decided no intervention was warranted.
SAQ 3(b)
Marks
Mean
Std Dev
Corr. with other Qs
Cont. to total
variance
Expected
cont.
5 2.42 1.06 0.34 8.3 8.3
No material issues were raised in relation to this question. The Final Board decided no intervention was warranted.
SAQ 4(a)
Marks
Mean
Std Dev
Corr. with other Qs
Cont. to total
variance
Expected
cont.
5 2.66 1.19 0.39 10.1 8.3
No material issues were raised in relation to this question. The Final Board decided no intervention was warranted.
SAQ 4(b)
Marks
Mean
Std Dev
Corr. with other Qs
Cont. to total
variance
Expected
cont.
5 1.4 1.02 0.33 5.9 8.3
This question sub-part was highlighted by the Psychometrician because the contribution to total variance was clearly lower than expected. The Chief Examiner observed that: the question dealt with the cab rank rule and personal conflict, a fundamental area of Professional Ethics and central to the syllabus; a similar question had been used in the past and worked well in the assessment; the mark scheme was appropriate as was the question. The Final Board analysed the data presented, discussed and reviewed the question. It was agreed that the question was fit for purpose and could be reused unchanged in the future if needed. The Final Board decided no intervention was warranted.
SAQ 5(a)
Marks
Mean
Std Dev
Corr. with other Qs
Cont. to total variance
Expected cont.
5 1.41 1.25 0.28 9.4 8.3
This question sub-part was highlighted by the Psychometrician because the mean score was below 40% of the available marks and the correlation with other questions was below the expected value of at least 0.30. The Chief Examiner observed that: the question focused on Public Access, a central principle that everyone in practice now needs to know; feedback

Page 18 of 54
was taken from markers during the markers’ meeting and reflected in the amended mark scheme; the markers were content that it adequately covered the content that was being asked of the candidates from the question. The Final Board decided no intervention was warranted.
SAQ 5(b)
Marks
Mean
Std Dev
Corr. with other Qs
Cont. to total
variance
Expected
cont.
5 1.82 1.03 0.31 7.6 8.3
This question sub-part was highlighted by the Psychometrician because the mean score was below 40% of the available marks. The Chief Examiner observed that: the question was based on a central principle of Professional Ethics; higher core duties were involved (CD9, CD10) on which candidates may not have placed as much importance as the other areas of the syllabus (complaints processes) and so may have neglected. The Chair raised the issue as to whether candidates may have been disadvantaged that the Legal Ombudsman was referred to in the fact pattern of the question. The Chief Examiner confirmed that the Legal Ombudsman was used in previous questions, was part of the complaints procedures, and was on the syllabus. It was felt to be a matter with which candidates should be familiar. The Final Board analysed the data presented, discussed and reviewed the question. It was agreed that the question was fit for purpose and could be used unchanged in the future if needed. The Final Board decided no intervention was warranted.
SAQ 6(a)
Marks
Mean
Std Dev
Corr. with other Qs
Cont. to total
variance
Expected
cont.
5 2.24 1.11 0.33 8.5 8.3
No material issues were raised in relation to this question. The Final Board decided no intervention was warranted.
SAQ 6(b)
Marks
Mean
Std Dev
Corr. with other Qs
Cont. to total
variance
Expected
cont.
5 2.12 1.14 0.34 9.3 8.3
No material issues were raised in relation to this question. The Final Board decided no intervention was warranted.
3.3.1 The Independent Psychometrician observed that, ideally, the “correlation with
other questions” figure will be at least 0.30. Only two sub-parts, 2(a) and 5(a) failed to achieve this, but at 0.28 this was not felt to be material as regards any intervention by the Final Board. In terms of standard deviation, a figure representing at least 15% of the marks available for a sub-part is desirable, and this was achieved in respect of all sub-parts.

Page 19 of 54
3.3.2 The standard deviation and the correlation with other questions data enter into the calculation of the contribution to total variance. A deviation of more than 2% from the expected contribution can sometimes suggest that further investigation of other factors is warranted (see commentary on question 4(b).
3.3.3 No interventions were deemed necessary in respect of any of the SAQs or
their sub-parts and there were no unresolved marking and moderation issues requiring consideration by the Final Board. The Psychometrician advised the Board that the that the exam’s reliability score for this assessment, using the Kruder Richardson scale, was 0.68 which showed a slight improvement from the Summer 2018 figure of 0.66. The Final Board endorsed the proposed passing standard of 26/60 as proposed by the standard setting process. The Independent Observer confirmed that due process had been observed.
3.4 Professional Ethics post-intervention pass rates – all Providers Summer 2017 to Summer 2019
Professional Ethics All Provider post-intervention
Summer 2019 Summer 2018 Summer 2017
69.7% 57.8% 56.6%
3.4.1 The table above confirms that there were no interventions necessary in
respect of the post-moderation results for Professional Ethics. 3.5 Professional Ethics Summer 2019 pass rates across all Providers

Page 20 of 54
3.5.1 Providers are ranged left to right in order of their Summer 2019 passing rates.
Hence ULaw London had the highest passing rate at 85.7 % and BPP Birmingham the lowest at 54.5% - a range of 31.2%. The variation in Provider cohort performance is marked. The top three Provider cohorts have an average passing rate of over 82%, whilst the bottom three Provider cohorts have an average passing rate of just 59.9%, suggesting the assessment discriminated effectively between weak and strong cohorts.
50.0
55.0
60.0
65.0
70.0
75.0
80.0
85.0
90.0
Pas
s ra
te %
Provider
Professional Ethics Summer 2019Pass rates - All Providers
Page 21 of 54
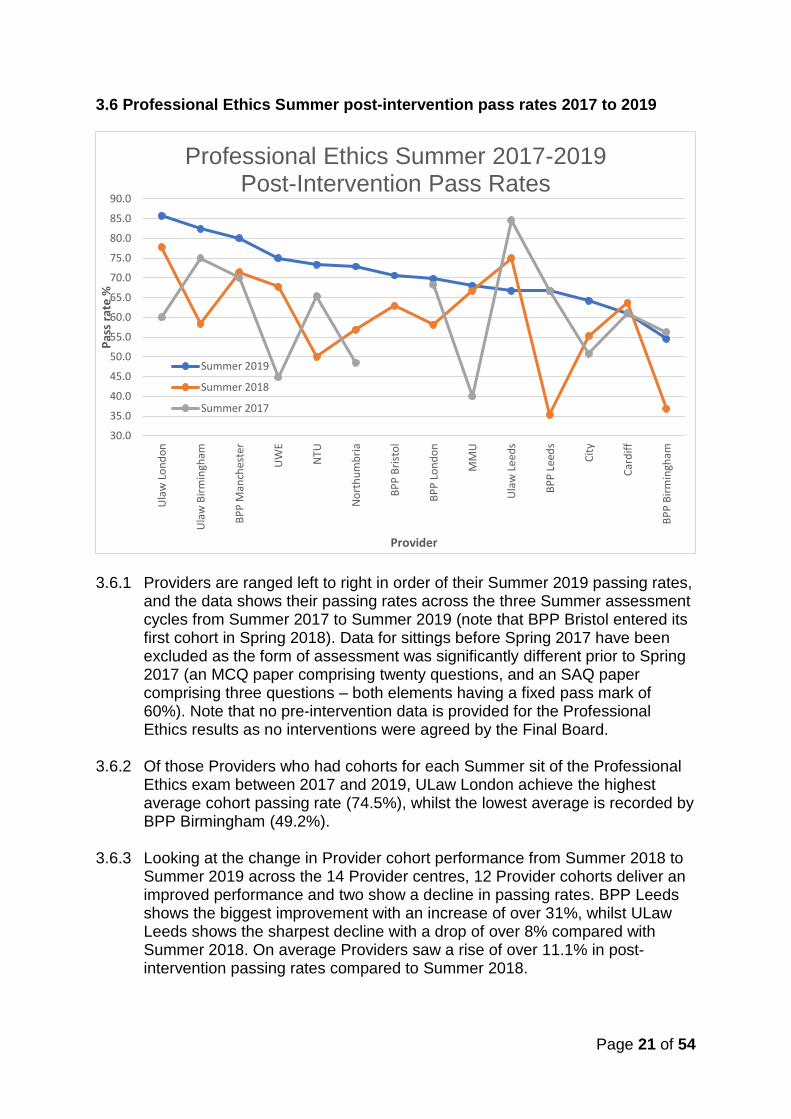
3.6 Professional Ethics Summer post-intervention pass rates 2017 to 2019
3.6.1 Providers are ranged left to right in order of their Summer 2019 passing rates,
and the data shows their passing rates across the three Summer assessment cycles from Summer 2017 to Summer 2019 (note that BPP Bristol entered its first cohort in Spring 2018). Data for sittings before Spring 2017 have been excluded as the form of assessment was significantly different prior to Spring 2017 (an MCQ paper comprising twenty questions, and an SAQ paper comprising three questions – both elements having a fixed pass mark of 60%). Note that no pre-intervention data is provided for the Professional Ethics results as no interventions were agreed by the Final Board.
3.6.2 Of those Providers who had cohorts for each Summer sit of the Professional
Ethics exam between 2017 and 2019, ULaw London achieve the highest average cohort passing rate (74.5%), whilst the lowest average is recorded by BPP Birmingham (49.2%).
3.6.3 Looking at the change in Provider cohort performance from Summer 2018 to
Summer 2019 across the 14 Provider centres, 12 Provider cohorts deliver an improved performance and two show a decline in passing rates. BPP Leeds shows the biggest improvement with an increase of over 31%, whilst ULaw Leeds shows the sharpest decline with a drop of over 8% compared with Summer 2018. On average Providers saw a rise of over 11.1% in post-intervention passing rates compared to Summer 2018.
30.0
35.0
40.0
45.0
50.0
55.0
60.0
65.0
70.0
75.0
80.0
85.0
90.0
Ula
w L
on
do
n
Ula
w B
irm
ingh
am
BP
P M
anch
este
r
UW
E
NTU
No
rth
um
bri
a
BP
P B
rist
ol
BP
P L
on
do
n
MM
U
Ula
w L
eed
s
BP
P L
eed
s
Cit
y
Car
dif
f
BP
P B
irm
ingh
am
Pas
s ra
te %
Provider
Professional Ethics Summer 2017-2019Post-Intervention Pass Rates
Summer 2019
Summer 2018
Summer 2017

Page 22 of 54
3.6.4 Comparing Summer 2019 cohort passing rates with Summer 2017 shows 11 Provider centres with cohorts across all three cycles improving on their Summer 2017 passing rates – with UWE improving by over 30%. On average Providers saw a rise of over 9.9% in passing rates compared to Summer 2017. (BPP Bristol is excluded from this calculation as it had no cohort in Summer 2017.)
3.7 Overall grade boundary distribution
All Provider Grade Boundary Distribution
Not Competent Competent Very Competent Outstanding
30.3% 54.7% 15.0% 0.0%
3.7.1 The standard setting process determines where the “Not Competent”/
“Competent” boundary lies, and grade boundaries are then calculated accordingly to ensure that the passing grades are allocated proportionately across the “Competent / Very Competent / Outstanding” classifications. As explained above at 2.8 (above), for an assessment comprising six SAQs, each carrying 10 marks, a passing standard of 36/60 equates to a passing score of 60%, thus mirroring the fixed pass mark used in centrally assessed exams prior to Spring 2017. In a system with a fixed pass mark of 60% candidates awarded marks of 60% to 69% were graded “Competent”; those awarded marks of 70% to 84% were graded “Very Competent”; and awarded marks between 85% and 100% were graded “Outstanding”. With the introduction of standard setting, the performance identified as equating to the pass standard can vary from one year to the next depending on the perceived level of difficulty offered by the examination. Where the passing standard is identified as being below 36/60 the range of “Competent / Very Competent / Outstanding” classifications is stretched to cover a broader range of scores. Conversely where the passing standard is identified as being above 36/60 the range of “Competent / Very Competent / Outstanding” classifications becomes compressed. The Summer 2019 all-Provider cohort results for Professional Ethics show that, on this basis, there are no candidates achieving the “Outstanding” classification.

Page 23 of 54
3.8 Summer 2019 post-intervention grade boundaries by Provider
3.8.1 Providers are ranged from left to right in declining order of Summer 2019
post-intervention passing rates, hence the “Not Competent” grouping rises from left to right, mapping the increasing failure rate across the Provider cohorts. There were no any candidates graded “Outstanding” at any Provider. The Provider with the highest percentage of its cohort rated at “Very Competent” was ULaw Leeds (33%), notwithstanding that ULaw Leeds came 10/14 in terms of passing rates for candidates overall. As might be expected the weakest Professional Ethics cohort, BPP Birmingham, had the lowest percentage of candidates graded as “Very Competent” (11%).
0.0
20.0
40.0
60.0
80.0
100.0
% c
and
dia
tes
per
cat
ego
ry
Provider
Professional Ethics Summer 2019Grade boundaries by Provider
Not competent Competent Very Competent Outstanding

Page 24 of 54
3.9 All-Provider Summer 2017 to Summer 2019 grade boundary trend analysis
3.9.1 In common with the two previous Summer sittings of the Professional Ethics
examination using the format introduced in 2017, there are no candidates graded “Outstanding”. What is noticeable, however, for the Summer 2019 sit, is the increase in candidates graded as “Very Competent” (15% against 3.8%).
0.0
10.0
20.0
30.0
40.0
50.0
60.0
70.0
80.0
Summer 2017 Summer 2018 Summer 2019
% c
and
idat
es
Grade boundary
Professional Ethics Grade boundaries trend analysis
Summer 2017 to Summer 2019
Outstanding Very Competent Competent Not Competent

Page 25 of 54
4. SUMMER 2019 CRIMINAL LITIGATION RESULTS 4.1 Criminal Litigation pre-intervention pass rates – all Providers Summer 2017 to Summer 2019
Criminal Litigation All Provider pre-intervention
Summer 2019 Summer 2018 Summer 2017
19.0% 58.8% 45.9%
The table above shows the all-Provider Summer 2019 pre-intervention BPTC cohort passing rate of 19% for Criminal Litigation, based on a pass standard recommended to the Final Board (as a result of the standard setting process) of 44 out of 75. The decline in the pre-intervention passing rate (37.8%) is particularly marked, and the lowest recorded since the new-style assessment based on 75 MCQs was introduced for the Spring 2017 sit. For the BTT candidates, the corresponding Summer 2019 pre-intervention passing rate was 23.4%. 4.2 Pre-intervention histogram of MCQs
The pre-intervention data shows 26 MCQs (over a third of the assessment) with an all-Provider cohort passing rate below 40% (compared to 18 in the Summer 2018 sit). There is evidence that candidates as a whole fared better across the first 25 MCQs (average passing rate 56.8% - only five MCQs had a passing rate below 40%), compared with the middle section (44.6%) and the last 25 MCQs (48%). The
0
10
20
30
40
50
60
70
80
90
1 3 5 7 9 11 13 15 17 19 21 23 25 27 29 31 33 35 37 39 41 43 45 47 49 51 53 55 57 59 61 63 65 67 69 71 73 75
Pas
s ra
te %
MCQ item number
Criminal Litigation Summer 2019 Pre-interventionMCQ All Provider question by question histogram
Pass rate %

Page 26 of 54
average passing rate per MCQ (49.8%) is in marked contrast to the overall pre-intervention passing rate (only 19% of candidates), largely driven by the fact that there were 26 MCQs with a passing rate below 40% and only 11 with a passing rate above 60%. 4.3 Details of Subject Board discussions and interventions 4.3.1 The Board noted that the Criminal Litigation examination was taken by both
BPTC and BTT candidates. It was noted that the total number of BPTC candidates sitting was 638 and 47 for the BTT cohort.
4.3.2 Interventions agreed by the Final Board
Q8 Credit answer B in addition to correct answer D. A question relating to the bad character of the defendant, which had weak correlation. The answer selected as correct by the examiners was one that, from a practitioner’s view, would be the easiest route. However, in light of comments from Providers and consideration at the Subject Board, it was suggested that answer B would also be a correct answer from the candidates’ perspective. The Final Board agreed to endorse the proposed intervention on question 8.
Q13 Credit answer C in addition to correct answer D. There was weak positive correlation on distractor C but an acceptable discrimination value. The question had been incorrectly labelled as an MCQ, when it was in fact a single best answer question. Although a practitioner would find the question easy, there was not sufficient difference in the practitioner text to allow candidates to sufficiently distinguish between C and D. To be fair to candidates, who are not expected to have practitioner experience, the intervention was proposed as both answers were technically correct. The Final Board agreed to endorse the proposed intervention on question 13.
Q36 Credit answer B in addition to correct answer C. Low pass rate of 9.6% and poor discrimination. The commentary in Blackstone’s was not as clear as considered at the time of the setting of the question, as there was a commentary that undermined C as the single best answer and made answer B as equally correct as C. The Final Board agreed to endorse the proposed intervention on question 36.
Q41 Credit answer C in addition to correct answer B. Another single best answer question, this time relating to a defendant failing to attend court due to medical issues. Very low pass rate, poor discrimination and slightly positive correlation on distractor C. The writer relied on the wording in Blackstone’s to differentiate between the two options but this resulted in a very

Page 27 of 54
fine technical distinction between options B and C and made both options correct. The Final Board agreed to endorse the proposed intervention on question 41.
Q50 Credit answer C in addition to correct answer B. A single best answer question with reasonable discrimination, relating to the trial of a youth with an adult. The commentary in Blackstone’s was originally considered to lead candidates to option B but in practice C would more readily occur. The Final Board agreed to endorse the proposed intervention on question 50.
4.3.3. The Final Board reviewed the recommended passing standard of 44/75
following CEB conventions. The Chief Examiner advised that there was concern at the Criminal Subject Board in respect of the Summer 2019 exam paper being more challenging than the Spring 2019 paper (where the Final Board had agreed to revise the pass standard by lowering it by two marks). Taking into account the more challenging exam and, considering the complexity of the facts presented (which included a change of question writing style, less frequently encountered areas of the syllabus being tested and the notably higher word count compared to recent papers), the Criminal Subject Board proposed lowering the passing standard by four marks as the issues were more significant than in Spring 2019. It was also noted that that the standard setting process did not evaluate the overall difficulty of the paper and that it should be the examining team and the CEB’s role to make such assessment. The Chief Examiner reported that the Provider feedback considered at the sub Criminal Subject Board reflected the examining team’s view that this had been a more challenging exam paper than in previous years and that the examiners would need to ensure that, when setting the exam questions, in particular of an SBA nature, it was the letter of the law in the Blackstone’s commentaries that determined the correct answer proposed. It was also recommended that caution was exercised to ensure that practical experience did not overly influence the correct answer choice, and to consider the overall balance of the paper instead of relying solely on the standard setting process and on the word count. The Final Board was also advised that the Criminal Litigation mock paper would be revised to reflect the new question complexity and length of the assessment. It was also explained that it had become apparent at the Criminal Subject Board that the paper was considerably more challenging than previous exams, including the mock exam which had not been updated recently to reflect the more challenging and complex questions.
4.3.4 The Chief Examiner advised the Board that the recommendation from the
Criminal Subject Board to lower the passing standard had been made without any knowledge of the potential impact on the overall passing rate. Based on all the facts presented, the Final Board endorsed the revised passing standard of 40/75.

Page 28 of 54
4.3.5 The Psychometrician advised the Board that the pre-intervention exam reliability score for this assessment, using the Kruder Richardson scale, was 0.69 which raised to 0.70 post-intervention. This was an improvement from the Summer 2018 figure of 0.66. It was noted that this fell below the benchmark reliability score of 0.80, but the Psychometrician advised the Final Board that the candidates for the summer assessments were predominantly those candidates who failed the Spring assessment, leading to a narrower range of candidates, which had the effect of depressing the reliability figure. The Psychometrician observed that he was content with the way in which the assessment had operated and saw nothing in the data analysis to raise any concerns.
4.3.6 The Independent Observer confirmed that due processes were followed by
the Subject Board, noting it was a challenging and thorough deliberation with five interventions proposed. The Independent Observer endorsed the proposed interventions.
4.4 Criminal Litigation post-intervention pass rates – all Provider Summer 2017 to Summer 2019
Criminal Litigation All Provider post-intervention
Summer 2019 Summer 2018 Summer 2017
45.5% 63.6% 47.2%
4.4.1 The Summer 2019 all-Provider BPTC post-intervention passing rate was
45.5%, down 18.1% on Summer 2018 and the lowest recorded for a summer sit across all three cycles of the new 75 MCQ assessment.
4.5 Summer 2019 pre- and post-intervention passing rates by Provider

Page 29 of 54
Providers are ranged left to right in order of their post-intervention passing rates. Hence BPP Manchester had the highest Spring 2019 post intervention passing rate at 72.7% and ULaw Leeds the lowest at 17.6% - a range of over 55% and easily the widest spread of performance across the three centrally assessed subjects. The interventions (both in relation to MCQs 8, 13, 36, 41 and 50 and the passing standard) had a positive impact on all Provider cohorts – the average uplift in passing rates being 26.4%. BPP Leeds saw the biggest positive impact of 40.9% whilst the smallest impact was on the ULaw Leeds cohort at 5.8%. Overall, the interventions had bigger impact (32.7% on average) on the top seven Provider cohorts (ranked by post-intervention passing rates) than on the bottom seven (20.2% on average). 4.6 Criminal Litigation Summer 2017 to Summer 2019 post-intervention pass rates
0
10
20
30
40
50
60
70
80
Pas
s ra
te %
Provider
Criminal Litigation - Summer 2019Pre and Post Intervention comparison
Pre-intervention
Post-intervention

Page 30 of 54
4.6.1 Providers are ranged left to right in order of their Summer 2019 post-
intervention passing rates. Data from assessments prior to the Spring 2017 sit has been excluded as it no longer provides a useful point of comparison given the changes to the assessment made with effect from the Spring 2017 sit. The data shows that BPP Manchester has delivered the strongest post-intervention cohort performance in Criminal Litigation across all three Summer sit cycles of the current form of assessment, with and average cohort passing rate across those three cycles of 84.2%. Cardiff have the second highest average passing rate over the same period at 73.8% (just shading over BPP Leeds on 73.7%). NTU has the lowest average passing rate at 43.9%.
4.6.2 Not surprisingly, all Provider cohorts report a decline in passing rates
compared to the Summer 2018 sit – the average decline being 27%. This figure masks some wide variations, however. Whilst the decline for the BPP London was 4.2%, for ULaw Leeds it was 82.4%, and for BPP Birmingham it was 60.7%. It should be noted that where cohort numbers are low (as is often the case with Summer sit cohorts) small changes in cohort numbers can produce what look like very significant changes in passing rates from year to year. Overall the decline in passing rates impacted more on the lowest seven performing cohorts (down on average 35.1%) compared with the highest performing seven (down on average 18.1%)
4.6.3 Comparing changes in Provider cohort performance between Summer 2017
and Summer 2019, ten out of 13 Providers saw a decline in their cohort passing rate – the average across all 13 being a drop of 8.3% (BPP Bristol excluded from these calculations as there was no Summer 2017 cohort for that Provider). NTU bucked the trend by achieving a 15.1% improvement, closely followed by MMU with an improvement of 13.9%.
10.0
20.0
30.0
40.0
50.0
60.0
70.0
80.0
90.0
100.0
BP
P M
anch
este
r
BP
P L
eed
s
Car
dif
f
BP
P L
on
do
n
Ula
w B
ham
Ula
w L
on
do
n
NTU
MM
U
No
rth
um
bri
a
Cit
y
BP
P B
rist
ol
UW
E
BP
P B
irm
ingh
am
ULa
w L
eed
s
Pas
s ra
te %
Provider
Criminal Litigation Summer 2017-2019Post-Intervention Pass Rates
Summer 2019
Summer 2018
Summer 2017

Page 31 of 54
4.7 Overall grade boundary distribution
All Provider Grade Boundary Distribution
Not Competent Competent Very Competent Outstanding
54.5 32.9 12.2 0.3
4.7.1 The standard setting process determines where the “Not
competent”/”Competent” boundary lies, and grade boundaries are then calculated accordingly to ensure that the passing grades are allocated proportionately across the “Competent / Very Competent / Outstanding” classifications. As explained above at 2.8 (above), for an assessment comprising 75 MCQs a passing standard of 45/75 equates to a passing score of 60%, thus mirroring the fixed pass mark used in centrally assessed exams prior to Spring 2017. Under the 60% fixed pass mark regime candidates awarded marks of 60% to 69% were graded “Competent”; those awarded marks of 70% to 84% were graded “Very Competent”; and awarded marks between 85% and 100% were graded “Outstanding”. From Spring 2017 onwards, where the passing standard is identified as being below 45/75, the range of “Competent / Very Competent / Outstanding” classifications is stretched to cover a broader range of scores. Conversely where the passing standard is identified as being above 45/75 the range of “Competent / Very Competent / Outstanding” classifications becomes compressed. The Summer 2019 all-Provider cohort results for Criminal Litigation show that even with a passing standard set at 40/75 there were only 0.3% of candidates achieving the Outstanding classification (all at either BPP London or City).

Page 32 of 54
4.8 Summer 2019 grade boundaries by Provider
4.8.1 Providers are ranged from left to right in declining order of Summer 2019 post
intervention passing rates, hence the “Not Competent” grouping also rises from left to right left, mapping the increasing failure rate across the weaker Provider cohorts. Given the dearth of candidates graded as “Outstanding” (two in all) it is perhaps more useful to look at the distribution of candidates graded as “Very Competent” (78 in total). For example, ULaw Leeds is the weakest cohort overall in terms of the Summer 2019 Criminal examination, but there are seven other Provider cohorts with a lower percentage of candidates achieving the “Very Competent”. Grade. Twelfth placed UWE has the lowest proportion at 2.8%
0.0
20.0
40.0
60.0
80.0
100.0
% s
tud
ents
per
cat
ego
ry
Provider
Criminal Litigation Summer 2019Grade boundaries by Provider
Not Competent Competent Very Competent Outstanding

Page 33 of 54
4.9 All-Provider Summer 2017 to Summer 2019 grade boundaries trend analysis
4.9.1 No change in the number of candidates securing the “Outstanding” grade.
The profile for the Summer 2019 sit closely resembles that of the Summer 2017 sit.
0
10
20
30
40
50
60
Summer 2017 Summer 2018 Summer 2019
% s
tud
ents
Grade category
Criminal Litigation Grade boundaries trend analysis Summer 2017 to Summer 2019
Outstanding Very Competent
Competent Not Competent

Page 34 of 54
5. SUMMER 2019 CIVIL LITIGATION RESULTS 5.1 Civil Litigation pre-intervention pass rates – all Providers Summer 2017 to Summer 2019
Civil Litigation All Provider pre-intervention
Summer 2019 Summer 2018 Summer 2017
48.5% 50.2% 33.8%
The table above shows the all-Provider Summer 2019 pre-intervention cohort passing rate as being 48.5% for Civil Litigation, based on a pass standard recommended to the Board (as a result of the standard setting process) of 44 out of 75. The Summer 2019 pre-intervention passing rate is on a par with that achieved in Summer 2018 and significantly ahead of the comparable figure (19%) recorded for the Summer 2019 Criminal Litigation assessment. 5.2 Pre-intervention histogram of MCQs
The pre-intervention data shows 14 MCQs with an all-Provider cohort passing rate below 40% (down from 19 in the Summer 2018 sit). Candidates performed much more strongly across the first 25 MCQs (61.7% average passing rate) compared to the performance across MCQs 26-50 (56.5% average passing rate) and MCQs 51-75 (55.9% average passing rate), although the spread of MCQs where the passing rate is below 40% is fairly even across the three groupings.
0.0
10.0
20.0
30.0
40.0
50.0
60.0
70.0
80.0
90.0
100.0
1 3 5 7 9 11 13 15 17 19 21 23 25 27 29 31 33 35 37 39 41 43 45 47 49 51 53 55 57 59 61 63 65 67 69 71 73 75
Pas
rat
e %
MCQ Item Number
Civil Litigation 2019 Summer Sit Pre-intervention MCQ All Provider question by question histogram Pass rate %

Page 35 of 54
5.3 Details of Subject Board discussions and interventions 5.3.1 The Final Board noted that the Civil Litigation examination was taken by both
BPTC and BTT candidates. The total number of BPTC candidates sitting was 612 and 43 for the BTT cohort.
5.3.2 Interventions agreed by the Final Board
Q41 Whilst the pre-intervention data indicated a passing rate 63.6%, discrimination was weak at at 0.056, and it was reported to the Final Board that there was a perceived difficulty in candidates being able to make the correct selection based on the problematic wording of the question which could lead good candidates to choose between two separate parts of the CPR both of which were on syllabus (CPR19.8(2)(b) and CPR7 para 5.5) and would be correct in the scenario presented. In light of the level of the assessment and that it was a closed book assessment, the wording of the fact set up could have been improved. The Final Board agreed that there were grounds to see how strong candidates may have legitimately opted for distractor [A]. The Final Board decided to intervene by crediting options [A] & [D] as correct answers. The Independent Observer endorsed this decision.
Q64 The MCQ had a pre-intervention passing rate of 44.8% and acceptable discrimination. The recommendation to the Final Board, however, was that the question should be removed from the assessment because issues it raised in relation to contributory negligence were not on the syllabus. The Final Board accepted that, because of the syllabus, the question was not examinable and should not have been set. As the question should not have been set, logically those who achieved the correct answer were not being disadvantaged as it was not a legitimate question. The Final Board therefore agreed to the removal of this MCQ from the assessment, with consequential adjustments to the pass standard. The Independent Observer endorsed this decision.
5.3.3 Removing MCQ 64 impacted on the proposed passing standard, which was
then recalculated as 43.7, rounded up to 44/74 using CEB conventions. The Chief Examiner advised the Final Board that there was some discussion at the Subject Board in relation to the impact of standard setting meeting having considered the paper in syllabus order but, as previously advised by the Psychometrician, it was concluded that it was not a sufficient ground to alter the passing standard.
5.3.4 The Final Board reaffirmed the approach previously taken, to the effect that
that a candidate can only be said to have passed or failed the assessment once the Final Board has endorsed any proposed interventions and the passing standard. The data presented at the Subject Boards was indicative

Page 36 of 54
and served to inform the boards on the performance of questions and assist on intervention decisions. References to pre-intervention “passing rates” should, therefore, be read with that caveat in mind. Pre-intervention “passing rates” indicated what the passing rates would look like without any intervention being agreed. No candidate could be said to have passed or failed an assessment until the Final Board had conformed any proposed interventions and they were applied to the raw data.
5.3.5 The Psychometrician advised the Board that the pre-intervention exam
reliability score for this assessment, using the Kruder Richardson scale, was 0.77 which was maintained post-intervention and similar to the Summer 2018 figure of 0.78. It was noted that this fell slightly below the benchmark reliability score of 0.80, but the Psychometrician advised the Board that the candidates for the Summer assessments were predominantly those candidates who failed the Spring assessment leading to a narrower range of candidates, which had the effect of depressing the reliability figure. The Psychometrician observed that he was content with the way in which the assessment had operated and saw nothing in the data analysis to raise any concerns.
5.3.6 The Independent Observer endorsed the interventions proposed and
reassured the Board that the practices and processes followed were robust and appropriate and that passes can only be attained upon intervention endorsement by the Final Board.
5.4 Civil Litigation post-intervention pass rates – all Providers Summer 2017 to Summer 2019
Civil Litigation All Provider post-intervention
Summer 2019 Summer 2018 Summer 2017
46.9% 51.3% 43.9%
5.4.1 The impact of the two MCQ interventions agreed by the Final Board along
with the recalculation of the passing standard can be clearly seen in the post-intervention passing rate which is 1.6% lower than it would have been without the agreed interventions. Although below the passing rate for Summer 2018, the Summer 2019 figure is still higher than that achieved on a like for like basis in Summer 2017.

Page 37 of 54
5.5 Pre- and post-intervention passing rates by Provider
5.5.1 Providers are ranged left to right in order of their post-intervention passing
rates. Hence BPP Manchester had the highest Summer 2019 post intervention passing rate at 66.7% and ULaw Leeds the lowest at 30% - a range of 36.7 %. The interventions had a somewhat uneven impact on passing rates. Only ULaw Birmingham saw an increase in cohort passing rate as a result of the interventions approved by the Final Board (up 3.6%). Five Providers saw no impact on passing rates at all. Of the remaining 8 whose passing rates declined as a result of the interventions approved by the Final Board, BPP Leeds saw the biggest negative change, with a drop of 5.9%. Overall the average change was a passing rate that was 1.5% below that suggested by the raw data.
20.0
30.0
40.0
50.0
60.0
70.0
80.0
90.0
Pas
s R
ate
%
Provider
Civil Litigation Summer 2019Pre and Post Intervention Comparison
Pre-interventionPost-intervention

Page 38 of 54
5.6 Civil Litigation Summer 2017 to Summer 2019 post-intervention pass rates
5.6.1 Providers are ranged left to right in order of their Summer 2019 post-intervention passing rates. Data from assessments prior to the Spring 2017 sit has been excluded as it no longer provides a useful point of comparison given the changes to the assessment made with effect from the Spring 2017 sit. The data shows that BPP Manchester has delivered the strongest post-intervention cohort performance in Civil Litigation across all three Summer sit cycles of the current form of assessment, with and average cohort passing rate across those three cycles of 73.3%. BPP Leeds has the second highest average post-intervention passing rate over the same period at 65.1%. ULaw Birmingham has the lowest average post-intervention passing rate across those three cycles at 30.5%.
5.6.2 Eleven Providers reported a decline in passing rates compared to the
Summer 2019 sit – the average fall being 9.3%. The potential in volatility in Summer sit data is reflected in the fact that whilst NTU saw an improvement of 17.7% in its post-intervention passing rate compared to Summer 2018, ULaw Leeds saw a drop of 47.8%. With small cohorts (as can be the case with Summer sits) performance data can change significantly even though the absolute numbers underpinning that change are small.
5.6.3 Comparing changes in Provider cohort performance between Summer 2017
and Summer 2019, six experienced a decline in their cohort passing rate, with ULaw Leeds recording a decline of 12.9%. Overall passing rates were up 0.7% in Summer 2019 compared to Summer 2017, with ULaw Birmingham leading the way with a 12% improvement.
0.0
10.0
20.0
30.0
40.0
50.0
60.0
70.0
80.0
90.0
Pas
s ra
te %
Provider
Civil Litigation Summer 2017-2019Post-Intervention Pass Rates
Summer 2019 Summer 2018 Summer 2017

Page 39 of 54
5.7 Overall grade boundary distribution
All Provider Grade Boundary Distribution
Not Competent Competent Very Competent Outstanding
53.1 28.8 16.7 1.5
5.7.1 The standard setting process determines where the “Not
competent”/”Competent” boundary lies, and grade boundaries are then calculated accordingly to ensure that the passing grades are allocated proportionately across the “Competent / Very Competent / Outstanding” classifications. As explained above at 2.8 (above), for an assessment comprising 75 MCQs a passing standard of 45/75 equates to a passing score of 60%, thus mirroring the fixed pass mark used in centrally assessed exams prior to Spring 2017. Under the 60% fixed pass mark regime candidates awarded marks of 60% to 69% were graded “Competent”; those awarded marks of 70% to 84% were graded “Very Competent”; and awarded marks between 85% and 100% were graded “Outstanding”. From Spring 2017 onwards, where the passing standard is identified as being below 45/75, the range of “Competent / Very Competent / Outstanding” classifications is stretched to cover a broader range of scores. Conversely where the passing standard is identified as being above 45/75 the range of “Competent / Very Competent / Outstanding” classifications becomes compressed. The Summer 2019 all-Provider cohort results for Civil Litigation show a very small number of candidates (9) awarded the “Outstanding” grade.

Page 40 of 54
5.8 Summer 2019 Civil Litigation grade boundaries by Provider
5.8.1 Providers are ranged from left to right in declining order of Summer 2019 post
intervention passing rates, hence the “Not Competent” grouping also rises from left to right left, mapping the increasing failure rate across the weaker Provider cohorts.
5.9 All-Provider Summer 2017 to Summer 2019 grade boundaries trend analysis
0.0
10.0
20.0
30.0
40.0
50.0
60.0
70.0
80.0
90.0
100.0
% s
tud
ent
per
cat
ego
ry
Provider
Civil Litigation Summer 2019Grade boundaries by Provider
Not Competent Competent Very CompetentOutstanding
0
10
20
30
40
50
60
Summer 2017 Summer 2018 Summer 2019
% s
tud
ents
Grade category
Civil Litigation Grade boundaries trend analysisSummer 2017 to Summer 2019
Outstanding Very Competent

Page 41 of 54
5.9.1 The graph above indicates a very stable position in terms of the distribution of grade boundaries across the last three Summer sit cycles in Civil Litigation. Very few candidates have been graded “Outstanding” and there has been no more than a 4% range in the percentage of candidates graded “Competent” or “Very Competent”.

Page 42 of 54
6. BAR TRANSFER TEST RESULTS The results for Bar Transfer test (‘BTT’) candidates attempting the Summer 2019 BTT assessments were considered by the Subject Exam Boards and the Final Board. For the Summer 2019 sit, all BTT candidates attempted the same centrally assessed exam papers as the BPTC candidates. 6.1 BTT Summer 2019 results
Subject Number of BTT
candidates
Summer 2019 pre-intervention passing rate the
BTT cohort
Summer 2019 post-intervention passing rate the
BTT cohort
Professional Ethics 67 59.7% 59.7%
Civil Litigation 43 48.7% 46.7%
Criminal Litigation 47 23.4% 44.7%
Subject
BPTC Summer 2019 post-intervention passing rate
BTT Summer 2019 post-intervention
passing rate Variance
Professional Ethics 69.7% 59.70% -10.00%
Civil Litigation 46.9% 46.70% -0.20%
Criminal Litigation 45.4% 44.70% -0.70%
The BTT cohort, whilst somewhat weaker in Professional Ethics, matched the all-Provider passing rates in the litigation subjects.

Page 43 of 54
7. COMPARING BPTC POST-INTERVENTION PASSING RATES ACROSS SUBJECT AREAS SUMMER 2017 TO SUMMER 2019 7.1 Centralised assessment post-intervention BPTC cohort passing rates compared Summer 2019 2019 Summer Sit
Professional Ethics
Number of Candidates 406
Passing Overall 69.7%
Civil Litigation and Evidence
Number of Candidates 612
Passing Overall 46.9%
Criminal Litigation, Evidence and Sentencing
Number of Candidates 638
Passing Overall 45.4%
This table shows the post intervention passing rates for the three centralised assessments for the Summer 2019 sit. 7.2 Centralised assessment grade boundaries compared Summer 2019
Ethics Summer 2019 Civil Summer
2019 Criminal Summer
2019
Outstanding 0 1.5 0.3
Very Competent 15.02 16.7 12.2
Competent 54.67 28.8 32.9
Not Competent 30.29 53.1 54.5
7.2.1 This table shows the percentage of candidates being awarded “Outstanding”,
“Very Competent”, “Competent” and “Not Competent” across the three centralised assessment for the Summer 2019 sit.
Not Competent Competent
Very Competent Outstanding
% of candidates
Ethics Summer 2019
15.5% 36.6% 25.0% 0.0% 24.5%

Page 44 of 54
Criminal Summer 2019
43.7% 34.5% 32.5% 18.2% 38.5%
Civil Summer 2019
40.8% 28.9% 42.5% 81.8% 37.0%
7.2.2 The table above shows how the total number of grades at each level were
distributed across the three centralised assessments. For example, across all three centralised assessments there were a total of 11 instances of a candidate achieving the grade “Outstanding”, but nine of these (81.1%) were achieved in Civil Litigation. Professional Ethics had the lowest proportion of candidates but the highest proportion of competent candidates.
7.3 Comparison of candidates passing across all three centralised assessments Summer 2019
Comparison of Candidates passing across papers
Candidates Attempting Professional Ethics
Candidates Passing
Professional Ethics
Also Passed Civil
Litigation
Also passed Criminal Litigation
Also Passed Criminal and
Civil Litigation
406 283 53 46 19
Candidates Attempting Criminal Litigation
Candidates passing Criminal Litigation
Also Passed Professional
Ethics
Also Passed Civil
Litigation
Also passed Professional Ethics and
Civil Litigation
634 290 46 86 19
Candidates Attempting Civil Litigation
Candidates passing
Civil Litigation
Also passed Professional
Ethics
Also passed Criminal Litigation
Also passed Criminal
Litigation and Professional
Ethics
612 287 53 86 19
As these figures relate to a Summer sit it should be borne in mind that not all candidates will have been attempting examinations in all three, or even two out of the three, subjects. There are no statistically difference here in terms correlating success in one examination with another.

Page 45 of 54
7.4 Centralised assessment post-intervention passing rate trends Summer 2017 to Summer 2019
7.4.1 Across the three Summer sit cycles detailed in the above chart Professional
Ethics has the highest average post-intervention passing rate at 61.4% followed by Criminal Litigation at 50.5% and Civil litigation at 47.4%. Civil has never had the highest post-intervention passing rate across these three Summer sit cycles.
30
35
40
45
50
55
60
65
70
75
Summer 17 Summer 18 Summer 19
Pas
s ra
te %
Post intervention passing rate trend analysis Summer 2017 - Summer 2019
Ethics overall
Civil overall
Criminal overall

Page 46 of 54
8. COMPARING SUMMER 2019 RESULTS ACROSS PROVIDERS 8.1 Summer 2019 post-intervention passing rates by Provider
8.1.1 Providers are ordered left to right according to the average post-intervention
passing rate achieved by their cohorts across all three subject areas in the Summer 2019 centralised assessments. BPP Manchester is the highest performing cohort in all three centralised with an average passing rate across the three subject areas of 73.1% and ULaw Leeds the lowest at 38.1%. The highest post-intervention cohort passing rate in any of the centrally examined subject areas was achieved by ULaw London with an 85.7% passing rate in respect of Professional Ethics. The worst Provider cohort performance across any centrally examined subject areas was achieved by ULaw Leeds where only 17.6% passed Criminal Litigation.
0.0
10.0
20.0
30.0
40.0
50.0
60.0
70.0
80.0
90.0
Pas
s ra
te %
Provider
Knowledge areas Summer 2019 Post intervention pass rates by Provider
Ethics
Civil
Criminal

Page 47 of 54
8.2 Analysis of grade boundary distribution within each Provider cohort Summer 2019
8.2.1 The data in the above table shows the spread of candidates at each Provider
achieving a grade of “Outstanding”, “Very Competent”, “Competent” or “Not Competent” in one of the three centralised assessments in the Spring 2019 sit. By way of example, if a Provider had 60 candidates and each candidate attempted the three centralised assessments there would be 180 instances of candidates attempting the centralised assessments at that Provider. If, across all three centralised assessments there were 18 instances at that Provider of candidates achieving an “Outstanding” grade, the data would show the rate as being 10%. It should not be assumed on this basis that 10% of candidates at that Provider necessarily achieve an “Outstanding” grade as the same candidate may achieve that grade in more than one assessment. With that caveat in mind the data shows that at BPP Manchester (where there were 28 instances of a candidate attempting a centralised assessment), 3.6% of those instances resulted a candidates achieving an “Outstanding” grade, 32.1% resulted a candidates achieving a “Very Competent” grade, 35.7% a “Competent” grade and in 28.6% of instances a “Not Competent” grade. It is notable that only the two best performing cohorts managed to have more candidates graded “Competent” than graded “Not Competent”.
8.3 Distribution of grade boundaries across Provider cohorts Summer 2019 8.3.1 For the Summer 2019 sitting there were 1,656 instances of BPTC candidates
attempting centralised assessments. The table below illustrates the proportion of that 1,656 represented by the candidates at each Provider. Hence BPP Birmingham, with 51 instances of candidates attempting the centralised assessments, contributed 3.1% of the 1,656 total instances of assessment.
0.0%
10.0%
20.0%
30.0%
40.0%
50.0%
60.0%
70.0%
80.0%
Distribution of grade boundaries across Providers Summer 2019
Not Competent Competent Very Competent Outstanding

Page 48 of 54
The two right hand columns indicate the proportion of the overall total of “Very Competent” and “Outstanding” grades awarded to candidates at each Provider. On this basis it can be seen that, whilst BPP Birmingham contributes 3.1% of assessment instances, its candidates are only achieving 1.3% of the “Very Competent” grades awarded across all Providers, and 0% of the “Outstanding” grades. City, by contrast contributes 22.2% of candidates and achieves 22.1% of the “Very Competent” grades. Given the low numbers of candidates achieving the “Outstanding” grade the resulting percentages can give a somewhat distorted view.
Instances % of instances % of Very
Competent % of
Outstanding
BPP Birmingham 51 3.1% 1.3% 0.0%
BPP Bristol 57 3.4% 4.2% 0.0%
BPP Leeds 48 2.9% 5.0% 9.1%
BPP London 370 22.3% 23.3% 36.4%
BPP Manchester 28 1.7% 3.8% 9.1%
Cardiff 92 5.6% 7.9% 0.0%
City 367 22.2% 22.1% 27.3%
MMU 96 5.8% 4.2% 0.0%
Northumbria 177 10.7% 6.7% 0.0%
NTU 69 4.2% 6.3% 9.1%
ULaw Birmingham 73 4.4% 3.8% 0.0%
ULaw Leeds 43 2.6% 2.1% 0.0%
ULaw London 94 5.7% 5.0% 0.0%
UWE 91 5.5% 4.6% 9.1%
8.4 Ranking of Provider cohorts Summer 2019 8.4.1 Provider cohort performance can also be compared in terms of the ranking
position of each Provider in each of the centrally assessed areas. For these purposes a Provider ranked first in one of the three centrally assessed subjects is awarded 1 point, and a Provider ranked last out of 14 is awarded 14 (hence the lower the total the stronger the Provider’s cohort). The best score possible would be 3 (3 x 1), and the worst possible score would be 42 (3 x 14). On this basis, the Summer 2019 sit, Providers can be ranked as per the table below (Summer 2018 rankings and change provided for reference). With a combined ranking score of 5, BPP Manchester emerges as the most consistently strong Provider cohort for Summer 2019 based on its post intervention ranking positions with little change compared to Summer 2018 data. By contrast, ULaw Leeds emerge as the weakest with combined ranking score of 38, not far off the worst possible score. The Provider cohorts are split with seven seeing improved ranking scores compared to Summer 2018 and seven seeing worse ranking scores. The NTU cohort sees its ranking score improve by 23 points to move it up to second place overall, whilst BPP Leeds

Page 49 of 54
sees a huge negative change of 33 ranking points to put in in last place. It should be borne in mind that, given the small cohorts at some Provider centres taking the Summer assessments there is likely to be greater volatility than is the case with the data for the Spring sits.
Provider
Ranking score
Summer 2019
Ranking score
Summer 2018
Change
BPP Manchester 5 7 -2
NTU 15 38 -23
BPP Leeds 15 26 -11
BPP London 17 35 -18
ULaw London 17 7 10
ULaw Birmingham 18 28 -10
Cardiff 22 13 9
BPP Bristol 22 21 1
Northumbria 24 31 -7
UWE 28 20 8
City 29 31 -2
MMU 30 17 13
BPP Birmingham 35 30 5
ULaw Leeds 38 5 33
8.4.2 If the Provider cohort results are aggregated to show performance by Provider
group rather than study centre (i.e. combining the passing rates across all branches operated by Providers) the BPP group emerges as the most consistently successful across the Summer 2019 sitting. The post-‘92 Providers emerge as the second-place group but there is very little, statistically, between that group, ULaw and the pre-’92 Provider grouping.

Page 50 of 54
Provider
Ranking score
Summer 2019
Ranking score Spring 2018
Change
BPP Birmingham 35.0 30.0 5
BPP Bristol 22.0 21.0 1
BPP Leeds 15.0 26.0 -11
BPP London 17.0 35.0 -18
BPP Manchester 5.0 7.0 -2
BPP Group 18.8 23.8 -5
MMU 30.0 17.0 13
Northumbria 24.0 31.0 -7
NTU 15.0 38.0 -23
UWE 28.0 20.0 8
Post-'92 Universities
24.3 26.5 -2
ULaw Bham 18.0 28.0 -10
ULaw Leeds 38.0 5.0 33
ULaw London 17.0 7.0 10
ULaw Group 24.3 13.3 11
Cardiff 22.0 13.0 9
City 29.0 31.0 -2
Pre-'92 Universities
25.5 22.0 3.5

Page 51 of 54
8.5 Changes in post-intervention passing rates Summer 2018 to Summer 2019
8.5.1 This table looks at the year-on-year change in post-intervention Provider cohort passing rates across the three centrally assessed area comparing the Summer 2018 and Summer 2019 sit results for BPTC candidates. The figures show that no Provider managed to increase its cohort passing rates across all three subject areas compared to their Summer 2018 sit results. Two Providers, Cardiff and ULaw Leeds saw a year-on-year decline across all three subject areas. No Provider saw an increase year-on-year in passing rates in Criminal litigation and only three saw an increase in respect of Civil Litigation.
8.5.2 The average year-on-year change across the subject areas was: Professional
Ethics up 11.1%; Civil Litigation down 9.3%, and Criminal Litigation down 27%. Looking at the changes in post-intervention passing rates across all three subjects at each Provider (i.e. aggregating the rise and fall in passing rates) shows that only four Providers (BPP London, BPP Leeds, NTU, and ULaw Birmingham) managed to achieve net rises in their aggregated passing rates compared to Summer 2018 (NTU up 31.9%). At subject level, the highest year-on-year improvement was achieved by BPP Leeds in respect of Professional Ethics (up 31.4%), whilst the biggest reverse was experienced by ULaw Leeds in respect of Criminal Litigation (-82.4%).
-70.0
-50.0
-30.0
-10.0
10.0
30.0
50.0
BP
P M
anch
este
r
BP
P L
eed
s
NTU
Ula
w L
on
do
n
Ula
w B
irm
ingh
am
BP
P L
on
do
n
Car
dif
f
No
rth
um
bri
a
Cit
y
BP
P B
rist
ol
UW
E
MM
U
BP
P B
irm
ingh
am
Ula
w L
eed
s
% C
han
ge
Provider
Changes in Provider pass ratesSummer 2019 vs Summer 2018 Ethics
Civil
Criminal

Page 52 of 54
8.6 Summer 2019 pass rates by mode of study
Part-time Pass % Full-Time Pass % Part-time Pass % Full-Time Pass % Part-time Pass % Full-Time Pass %
Bpp Birmingham 0.0 60.0 100 42.1 100 21.1
BPP Bristol N/A 70.6 N/A 52.6 N/A 38.1
BPP Leeds 80.0 50.0 50 66.7 100 61.1
BPP London 50.0 76.8 53.8 50.0 51.7 49.6
BPP Manchester N/A 80.0 100 63.6 N/A 72.7
Cardiff N/A 61.1 N/A 50.0 N/A 52.3
City 41.7 67.0 60 46.5 35.3 43.5
MMU 100.0 66.7 20 35.5 0 47.1
Northumbria N/A 72.9 N/A 40.9 N/A 42.9
NTU N/A 73.3 N/A 60.0 N/A 45.8
Ulaw Birmingham 100.0 80.0 50 35.0 75.0 45.8
Ulaw Leeds N/A 66.7 N/A 30.0 N/A 17.6
Ulaw London 50.0 89.5 50 39.3 33.3 48.6
UWE 50.0 78.6 25 41.2 25 40.0
Professional Ethics Civil Litigation Criminal Litigation
8.6.1 This table disaggregates full-time and part-time candidates passing rates by
Provider for the Summer 2019 assessments. Where a Provider is shown as “N/A” it indicates that there is no part-time mode offered. A passing rate of “0.0” indicates that no part-time candidates passed.
8.6.2 Care needs to be taken in interpreting this data as some part-time cohorts
may be very small, hence the results of a handful of candidates can result in significant fluctuations in passing rates. Subject to that caveat, it can be seen that, generally part-time cohorts did as well as full-time cohorts. Across 25 assessments points were there were results for both full-time and part-time candidates, full-time candidate cohorts have higher passing rates in 12 instances and part-time in 13. Part-time cohorts were least successful in Professional ethics where there were only three Provider centres where they out-performed full-time cohorts. Looking at those Provider centres having part-time candidates attempting all three centrally assessed examinations, the part-time cohort at ULaw Birmingham outperformed the ULaw Birmingham full-time cohort in terms of passing rates across all three examinations. Looking at averages of part-time cohort passing rates as against full-time cohorts shows the PT cohort as being 3% weaker in Professional Ethics, but 10% stronger in Civil Litigation and 8% stronger in Criminal Litigation.

Page 53 of 54
9. Other issues 9.1 The Final Board noted:
• the administrative difficulties caused for the BSB exams team by the failure of BPP to ensure that their attendance lists were correct, leading to a failure to ensure that all of its candidates’ optically read marksheets were delivered to the BSB in time to be processed for consideration by the relevant Subject Boards, or Final Board. It was clear that the Provider was not aware that candidates’ marks were missing until those candidates queried their lack of results when the Provider then submitted the marksheets for marking by the BSB. The Provider has been asked to improve its processes to ensure that this issue does not arise again. The BSB is under no obligation to mark marksheets or scripts which are not submitted in time; Providers must ensure that their administrative errors do not negatively impact their students.
• that due to the issues noted at BPP above, the data for one candidate was submitted too late to be included in this report; the data for the other candidates whose marks had been missing previously has been included. The advice of the independent Psychometrician was that if one candidate’s marks were to be excluded the effect on the data would be negligible.
• where possible, standard setting for the Litigation examinations should be undertaken using exam papers with questions in printing order.
• the CEB would continue to adopt an holistic approach to the confirmation of the pass standard recommended as a result of the standard setting process, bearing in mind the overall difficulty of the exam paper in question, and the fact that standard setters were focused on rating the difficulty of each individual question.
Professor Mike Molan Chair of the Central Examination Board 28 November 2019

Page 54 of 54
Addendum to Summer 2019 Chair’s Report
It was reported to the relevant Subject Boards and the Final Board that there were two instances of questions having been used in the Summer 2019 assessments that had previously been used in mock examinations supplied to students preparing for the centralised assessments in Civil Litigation, and in Criminal Litigation. The issue arose in respect of Question 73 in the Criminal Litigation paper, and question 43 in respect of the Civil Litigation. In respect of Question 73 in the Criminal Litigation paper, 26.2% of candidates answered the question correctly and there were no Provider comments. The discrimination data (the extent to which the question tended to be answered correctly by the stronger candidates, and incorrectly by the weaker candidates) was very good. The use of questions previously featured in mock assessments in contrary to CEB established practice and should not have occurred, however, as the mock paper was made available to all Providers, the Final Board concluded that this departure from established practice was not material, hence no candidates have been disadvantaged, and there were no grounds for intervention In respect of Question 43 in the Civil Litigation paper, 59.3% of candidates answered the question correctly and Provider comments were considered (although they were not felt to be material). The discrimination data (the extent to which the question tended to be answered correctly by the stronger candidates, and incorrectly by the weaker candidates) was very good. The use of questions previously featured in mock assessments in contrary to CEB established practice and should not have occurred, however, as the mock paper was made available to all Providers, the Final Board concluded that this departure from established practice was not material, hence no candidates have been disadvantaged, and there were no grounds for intervention. Professor Mike Molan Chair of the Central Examination Board 22 January 2020


