This article was downloaded by: [USM University of Southern Mississippi] On: 12 September 2014, At: 16:24 Publisher: Routledge Informa Ltd Registered in England and Wales Registered Number: 1072954 Registered office: Mortimer House, 37-41 Mortimer Street, London W1T 3JH, UK Regional Studies Publication details, including instructions for authors and subscription information: http://www.tandfonline.com/loi/cres20 The Barnett Allocation Mechanism: Formula Plus Influence? Alex Christie a & J. Kim Swales b a Fraser of Allander Institute, Department of Economics , University of Strathclyde , Sir William Duncan Building, 130 Rottenrow, Glasgow, G4 0GE, UK E-mail: b Department of Economics , University of Strathclyde , Sir William Duncan Building, 130 Rottenrow, Glasgow, G4 0GE, UK Published online: 14 Sep 2009. To cite this article: Alex Christie & J. Kim Swales (2010) The Barnett Allocation Mechanism: Formula Plus Influence?, Regional Studies, 44:6, 761-775, DOI: 10.1080/00343400903107710 To link to this article: http://dx.doi.org/10.1080/00343400903107710 PLEASE SCROLL DOWN FOR ARTICLE Taylor & Francis makes every effort to ensure the accuracy of all the information (the “Content”) contained in the publications on our platform. However, Taylor & Francis, our agents, and our licensors make no representations or warranties whatsoever as to the accuracy, completeness, or suitability for any purpose of the Content. Any opinions and views expressed in this publication are the opinions and views of the authors, and are not the views of or endorsed by Taylor & Francis. The accuracy of the Content should not be relied upon and should be independently verified with primary sources of information. Taylor and Francis shall not be liable for any losses, actions, claims, proceedings, demands, costs, expenses, damages, and other liabilities whatsoever or howsoever caused arising directly or indirectly in connection with, in relation to or arising out of the use of the Content. This article may be used for research, teaching, and private study purposes. Any substantial or systematic reproduction, redistribution, reselling, loan, sub-licensing, systematic supply, or distribution in any form to anyone is expressly forbidden. Terms & Conditions of access and use can be found at http:// www.tandfonline.com/page/terms-and-conditions
Transcript
This article was downloaded by: [USM University of Southern Mississippi]On: 12 September 2014, At: 16:24Publisher: RoutledgeInforma Ltd Registered in England and Wales Registered Number: 1072954 Registered office: MortimerHouse, 37-41 Mortimer Street, London W1T 3JH, UK
Regional StudiesPublication details, including instructions for authors and subscription information:http://www.tandfonline.com/loi/cres20
The Barnett Allocation Mechanism: Formula PlusInfluence?Alex Christie a & J. Kim Swales ba Fraser of Allander Institute, Department of Economics , University of Strathclyde , SirWilliam Duncan Building, 130 Rottenrow, Glasgow, G4 0GE, UK E-mail:b Department of Economics , University of Strathclyde , Sir William Duncan Building, 130Rottenrow, Glasgow, G4 0GE, UKPublished online: 14 Sep 2009.
To cite this article: Alex Christie & J. Kim Swales (2010) The Barnett Allocation Mechanism: Formula Plus Influence?,Regional Studies, 44:6, 761-775, DOI: 10.1080/00343400903107710
To link to this article: http://dx.doi.org/10.1080/00343400903107710
PLEASE SCROLL DOWN FOR ARTICLE
Taylor & Francis makes every effort to ensure the accuracy of all the information (the “Content”) containedin the publications on our platform. However, Taylor & Francis, our agents, and our licensors make norepresentations or warranties whatsoever as to the accuracy, completeness, or suitability for any purpose ofthe Content. Any opinions and views expressed in this publication are the opinions and views of the authors,and are not the views of or endorsed by Taylor & Francis. The accuracy of the Content should not be reliedupon and should be independently verified with primary sources of information. Taylor and Francis shallnot be liable for any losses, actions, claims, proceedings, demands, costs, expenses, damages, and otherliabilities whatsoever or howsoever caused arising directly or indirectly in connection with, in relation to orarising out of the use of the Content.
This article may be used for research, teaching, and private study purposes. Any substantial or systematicreproduction, redistribution, reselling, loan, sub-licensing, systematic supply, or distribution in anyform to anyone is expressly forbidden. Terms & Conditions of access and use can be found at http://www.tandfonline.com/page/terms-and-conditions
The Barnett Allocation Mechanism: FormulaPlus Influence?
ALEX CHRISTIE� and J. KIM SWALES†�Fraser of Allander Institute, Department of Economics, University of Strathclyde, Sir William Duncan Building, 130 Rottenrow,
Glasgow G4 0GE, UK. Email: [email protected]†Department of Economics, University of Strathclyde, Sir William Duncan Building, 130 Rottenrow, Glasgow G4 0GE, UK.
CHRISTIE A. y SWALES J. K. El mecanismo de la asignacion Barnett: ¿formula mas influencia?, Regional Studies. El objetivo de este
artıculo es explicar el porque la operacion de la formula Barnett no ha generado una convergencia en los niveles de gastos publicos
per capita en las cuatro regiones del Reino Unido. Usando Escocia como ejemplo, en este ensayo argumentamos que se ha intro-
ducido un mecanismo de asignacion tipo ‘formula mas influencia’. Esto ofrece una mejor flexibilidad, mayor integracion polıtica y
mas flujos de informacion comparado con un proceso a traves de negociaciones directas o de formulas. Aunque la transferencia de
Regional Studies, Vol. 44.6, pp. 761–775, July 2010
0034-3404 print/1360-0591 online/10/060761-16 # 2010 Regional Studies Association DOI: 10.1080/00343400903107710http://www.regional-studies-assoc.ac.uk
Dow
nloa
ded
by [
USM
Uni
vers
ity o
f So
uthe
rn M
issi
ssip
pi]
at 1
6:24
12
Sept
embe
r 20
14
competencias no ha cambiado la formula Barnett, sı que ha alterado el entorno en el que funciona y esto bien podrıa desestabilizar
un sistema que normalmente es seguro.
Formula Barnett Transferencia de competencias Descentralizacion fiscal Escocia Finanzas publicas
JEL classifications: H79, R50
INTRODUCTION
Since 1978, the Barnett formula has been the mechan-ism that formally determines the distribution of the bulkof public funds from the United Kingdom central gov-ernment to the administrations in Northern Ireland,Scotland, and Wales, the three regions of the UK thatare not part of England. Whilst the UK central govern-ment does not deal with these three regions uniformly,their treatment has always differed from that of theEnglish regions, and this difference was furtherextended when the post-1997 UK Labour governmentdevolved their administrations. This paper refers toNorthern Ireland, Scotland, and Wales collectively asthe UK peripheral regions or, where appropriately,the UK devolved administrations.
Despite being used by successive Conservative andLabour governments, the Barnett formula has beenthe subject of vigorous debate and often-adversecomment. This has centred round its fairness andrationality and its implications for the future fundingof the UK devolved administrations. In terms of fair-ness, MACKAY (2001, 2005) and MCLEAN andMCMILLAN (2003) point to the relatively generoustreatment of the UK peripheral regions, especially Scot-land, when set against ‘comparable’ English regions.Concerning rationality, the Barnett formula has a veryweak link with need. Further, the operation of theformula should generate relative per capita publicexpenditure convergence in the peripheral regions tothe average English level (BELL, 2000; CUTHBERT,1998; FERGUSON et al., 2003; HEALD, 1994; KAY,1998; MIDWINTER, 1999).1 However, even thosewho take the existing UK spatial allocation of publicexpenditure to be unfair find such ultimate convergencein per capita expenditure undesirable.
This paper has four key interrelated themes. First, itfollows the work of ALESINA and SPOLAORE (1997,2003), who argue that from an economic point ofview, as a country increases in geographical scale, twoconflicting influences apply. On the one hand, the percapita costs of providing national public goods, such asdefence and foreign affairs, falls. On the other hand,increased size will also, in general, be associated withgreater population diversity. From such a perspective,it is likely to be optimal for the government to treatregions that are geographically and culturally distancedfrom the centre favourably on efficiency grounds, toprevent secession, and on equity grounds, becauseperipheral regions gain least from a uniform tax and
expenditure system. In this approach, the relativelyfavourable existing treatment of the UK peripheralregions is both explicable and justifiable.
The second theme is that the actual per capita govern-ment expenditure will be influenced by the government’sresponse to short-term region-specific shocks. However,such shocks will generate fluctuations around an under-lying relative per capita expenditure level that is compara-tively stable over time. This stable underlying positionreflects the bargaining position of the region with thecentre, which depends partly on the region’s ability tosecede. Because this relative bargaining position willchange only slowly with time, the relative per capitaexpenditure levels are expected to be similarly stable.
The third theme is that the Barnett formula is onlypart – albeit a very important part – of the system thatdetermines appropriate public expenditures in the UKperipheral regions. This more extensive system has main-tained relatively stable per capita public expendituredifferences between the peripheral and English regions.It is shown that there is no necessary contradiction in amechanism that, if operating alone, would generate rela-tive public expenditure convergence, being part of asystem generating such stability. In particular, a ‘formulaplus influence’ account of this process is given that iscredible, consistent with the available evidence, and hasbenefits for both the centre and peripheral regions.
The fourth theme is that whilst the Barnett formuladid not change fundamentally with devolution, the insti-tutions around it did. As a result, this rather subtle system,of which the Barnett formula was a part, seems moreappropriate for the pre-, rather than the post-, devolu-tion administrative and political arrangements. Thefunding of the UK devolved administrations is likely topose extremely difficult questions in the future.
The second section outlines two major puzzles ofthe Barnett formula: the lack of evidence of relativepublic spending convergence and the lack of trans-parency in the operation of the formula. This sectionprovides additional Scottish data pointing to suchnon-convergence. The third section discusses alterna-tive accounts that place the Barnett formula in aricher institutional setting. In particular, it considersHeald’s notion of ‘formula by-pass’ and Midwinter’sarguments around bargaining. The fourth sectionpresents the authors’ alternative representation of thefunding mechanism, a ‘formula plus influence’ system.The fifth section discusses the way in which devolutionhas led to changes in this procedure; the sixth section is a
762 Alex Christie and J. Kim Swales
Dow
nloa
ded
by [
USM
Uni
vers
ity o
f So
uthe
rn M
issi
ssip
pi]
at 1
6:24
12
Sept
embe
r 20
14
short conclusion. Whilst the arguments apply generallyto the UK peripheral regions, the authors often takeScotland as an exemplar, given better data for Scotlandand the more virulent debate that has emerged therearound the Barnett formula.
PUZZLES CONCERNING THE OPERATION
OF THE BARNETT FORMULA
There are two major puzzles associated with theoperation of the Barnett formula. These concern theobserved lack of convergence in per capita publicexpenditure in the peripheral regions, and the lowlevel of transparency in the workings of the formula.
Lack of convergence
The Barnett formula was introduced in 1978, linked tothe proposal to establish devolved assemblies forScotland and Wales. In the case of Scotland, initiallythe formula delivered 10/85ths of changes in compar-able spending conducted in England. This transfer wasknown as the Scottish block: 10/85 matched the popu-lation ratio between Scotland and England at the time ofthe formula’s establishment.2 The details of the oper-ation of the formula have changed over the period ofits use, but not the broad principles. It has only everacted on marginal changes in the various forms ofcomparable expenditure between England and theperipheral regions (OFFICIAL REPORT, 1997). In theabsence of population change, this means that anyinitial absolute differences in per capita public spendingallocations – the appropriate comparison – are perpe-tuated by the formula.3
As a result of changes in public accounting intro-duced by the post-1997 Labour government, theformula now acts on most of that part of the budgettermed Departmental Expenditure Limits (DEL). Thissection of the budget is set on a three-year cycle aspart of the Spending Review process. DEL coversitems deemed to be predictable and therefore able tobe planned, for example, health and education.4 Theother part of the new budget process, AnnuallyManaged Expenditure (AME), is outwith the formula.Its components, as the name suggests, are determinedannually, largely because they are demand led. Anexample is social security payments.
The logical implication of operating such a system isthat with increased nominal government expenditure,relative public spending per head in the peripheralregions will converge on the English spending level.5
This is because the per capita spending increment isthe same across administrations and the effect of thedifferent initial starting levels becomes proportionatelyless important with time. Whilst there are constraintson this convergence, it is generally agreed that theBarnett formula should, in practice, lead to convergence
in per capita spending if it is applied correctly to largeparts of the budget increment. This predicted conver-gence is known as the Barnett squeeze (BELL, 2000;CUTHBERT, 1998; HEALD, 1994; KAY, 1998).6
However, the actual, as against the predicted, per-formance of the formula is much more difficult todetermine. Data concerning UK public spending on aregional basis are limited, though improving, and aremost easily accessed in the annual Public ExpenditureStatistical Analyses (H. M. TREASURY, various years).But these figures are for identifiable expenditure, andwhile spending is classified by government level, it isbased on output expenditure rather than any input allo-cation. Details derived from the Scottish and Welshbudget documents show additions to AME and DEL,but not what proportion of the DEL increase was deter-mined by the Barnett formula. Equally, the biennialStatement of Funding Policy (H. M. Treasury) givesthe comparability percentages, population relativities,and total spending allocations to each spending line,but not the increments for any one year. While infor-mation on public spending has increased greatly, it isstill not detailed enough to know the precise Barnettallocations and, therefore, whether or not convergencethrough the operation of Barnett has taken place.
Previous studies (BAILEY and FINGLAND, 2004;MIDWINTER, 2002) have used identifiable expenditureper head over time. They demonstrate a lack of conver-gence towards the English per capita spending allo-cation, with Bailey and Fingland finding spendinglevels per head in Northern Ireland and Wales conver-ging with that of the Scottish, rather than the English,level. GALLAGHER and HINZE (2005) similarly focuson identifiable expenditure, but here excluding socialprotection and agriculture and covering only the post-devolution period.7 They claim to detect convergence,but this seems premature. There is no convergence inthe Welsh figure and the large fall in Northern Irishrelative expenditure per head is likely to be driven byfactors specific to that province.
HEALD and MCLEOD (2002) correctly note that it ispotentially misleading to use this data source to identifythe impact of the Barnett formula since identifiableexpenditure includes expenditure by all levels of gov-ernment and not just that undertaken as a consequenceof Barnett formula funding. BAILEY and FINGLAND
(2004) particularly stress this point. Removing socialsecurity expenditure and agriculture – the largest UKgovernment expenditures in Scotland and Wales – getscloser to the Barnett-funded expenditures. However,although this adjustment alters spending patterns, thedata still do not indicate that relative convergence inspending per head has occurred.
This issue is approached here in a slightly differentway, using information based on budget inputs, ratherthan the spending outputs previously employed.8
Specifically, the Scottish budget allocation per head iscalculated as a percentage of the corresponding UK
The Barnett Allocation Mechanism: Formula Plus Influence? 763
Dow
nloa
ded
by [
USM
Uni
vers
ity o
f So
uthe
rn M
issi
ssip
pi]
at 1
6:24
12
Sept
embe
r 20
14
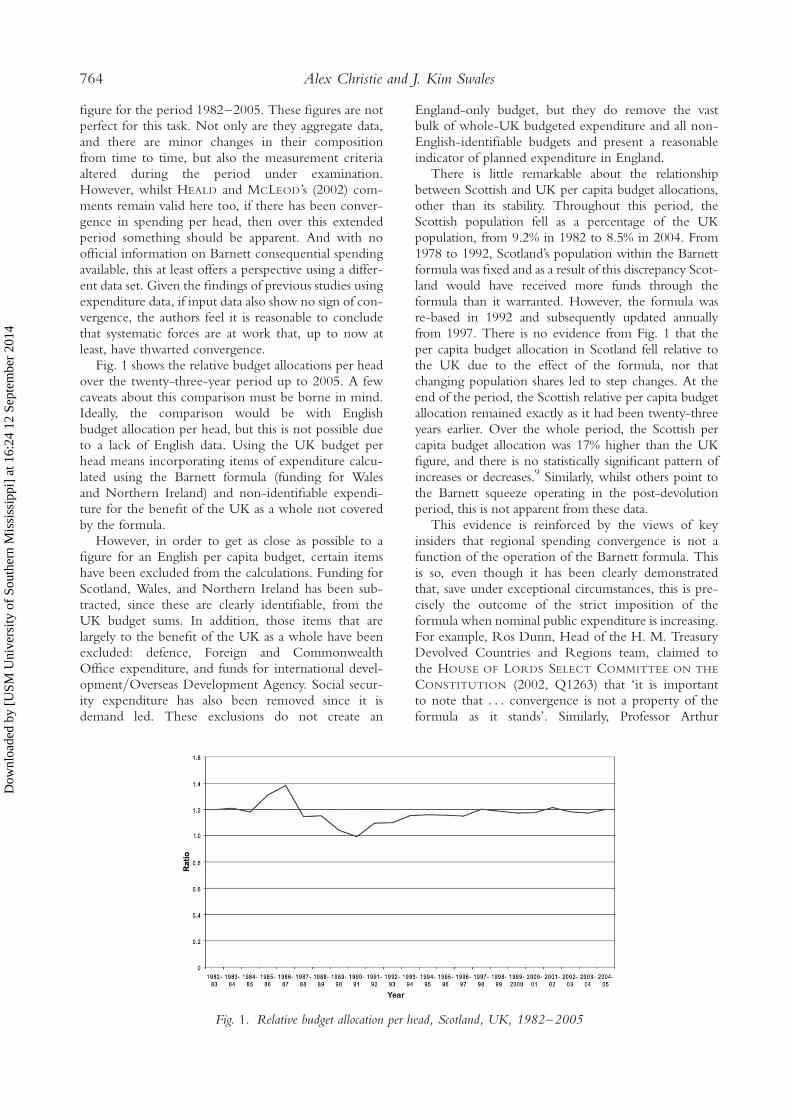
figure for the period 1982–2005. These figures are notperfect for this task. Not only are they aggregate data,and there are minor changes in their compositionfrom time to time, but also the measurement criteriaaltered during the period under examination.However, whilst HEALD and MCLEOD’s (2002) com-ments remain valid here too, if there has been conver-gence in spending per head, then over this extendedperiod something should be apparent. And with noofficial information on Barnett consequential spendingavailable, this at least offers a perspective using a differ-ent data set. Given the findings of previous studies usingexpenditure data, if input data also show no sign of con-vergence, the authors feel it is reasonable to concludethat systematic forces are at work that, up to now atleast, have thwarted convergence.
Fig. 1 shows the relative budget allocations per headover the twenty-three-year period up to 2005. A fewcaveats about this comparison must be borne in mind.Ideally, the comparison would be with Englishbudget allocation per head, but this is not possible dueto a lack of English data. Using the UK budget perhead means incorporating items of expenditure calcu-lated using the Barnett formula (funding for Walesand Northern Ireland) and non-identifiable expendi-ture for the benefit of the UK as a whole not coveredby the formula.
However, in order to get as close as possible to afigure for an English per capita budget, certain itemshave been excluded from the calculations. Funding forScotland, Wales, and Northern Ireland has been sub-tracted, since these are clearly identifiable, from theUK budget sums. In addition, those items that arelargely to the benefit of the UK as a whole have beenexcluded: defence, Foreign and CommonwealthOffice expenditure, and funds for international devel-opment/Overseas Development Agency. Social secur-ity expenditure has also been removed since it isdemand led. These exclusions do not create an
England-only budget, but they do remove the vastbulk of whole-UK budgeted expenditure and all non-English-identifiable budgets and present a reasonableindicator of planned expenditure in England.
There is little remarkable about the relationshipbetween Scottish and UK per capita budget allocations,other than its stability. Throughout this period, theScottish population fell as a percentage of the UKpopulation, from 9.2% in 1982 to 8.5% in 2004. From1978 to 1992, Scotland’s population within the Barnettformula was fixed and as a result of this discrepancy Scot-land would have received more funds through theformula than it warranted. However, the formula wasre-based in 1992 and subsequently updated annuallyfrom 1997. There is no evidence from Fig. 1 that theper capita budget allocation in Scotland fell relative tothe UK due to the effect of the formula, nor thatchanging population shares led to step changes. At theend of the period, the Scottish relative per capita budgetallocation remained exactly as it had been twenty-threeyears earlier. Over the whole period, the Scottish percapita budget allocation was 17% higher than the UKfigure, and there is no statistically significant pattern ofincreases or decreases.9 Similarly, whilst others point tothe Barnett squeeze operating in the post-devolutionperiod, this is not apparent from these data.
This evidence is reinforced by the views of keyinsiders that regional spending convergence is not afunction of the operation of the Barnett formula. Thisis so, even though it has been clearly demonstratedthat, save under exceptional circumstances, this is pre-cisely the outcome of the strict imposition of theformula when nominal public expenditure is increasing.For example, Ros Dunn, Head of the H. M. TreasuryDevolved Countries and Regions team, claimed tothe HOUSE OF LORDS SELECT COMMITTEE ON THE
CONSTITUTION (2002, Q1263) that ‘it is importantto note that . . . convergence is not a property of theformula as it stands’. Similarly, Professor Arthur
Fig. 1. Relative budget allocation per head, Scotland, UK, 1982–2005
764 Alex Christie and J. Kim Swales
Dow
nloa
ded
by [
USM
Uni
vers
ity o
f So
uthe
rn M
issi
ssip
pi]
at 1
6:24
12
Sept
embe
r 20
14
Midwinter (MIDWINTER, 2004), then adviser to theScottish Parliament’s Finance Committee, claims thatno public document or ministerial statement has everasserted that convergence is an aim of the Barnettformula. He also argues that:
convergence on spending [is] ‘not a policy objective’ of
the UK Government, and that any of the devolved admin-
istrations – Scotland, Wales and Northern Ireland – could
reopen the formula if they believed it was not providing
resources relative to its need.
(THE SCOTSMAN, 2005)
Midwinter asserts that there is no evidence from spend-ing data to justify consistent convergence betweenScottish and English per capita spending. Rather, spend-ing has fluctuated around 125% of the UK expenditureper head total since 1992. The present data analysis isbroadly in line with his findings.
Lack of transparency
Donald Dewar presents the standard view that:
successive Governments have defended [the Barnett
formula] for many years because it is simple and explicable.
. . . [I]t is a neat and tidy method of adjusting Scottish
expenditure so that it is in line with that of comparable
Departments south of the border. I expect that to continue.
(SCOTTISH GRAND COMMITTEE, 1998, col. 6)
This defends the idea that the formula works as theStatement of Funding Policy describes, since a ‘neatand tidy method’ is doubtless a computational one.
From a purely economic perspective, certain aspectsof the mechanics of the formula have potentially ben-eficial efficiency outcomes. First, having a formulathat is ostensibly free of political manipulation reducesinfluence costs. In fact, if the formula were complete,and if transfers outwith the Barnett formula were toconsist only of AME (demand-led) spending, theseinfluence costs would be zero. Second, the formulaalso provides economic stability, since budget growthis incremental rather than zero-based. If budgets werere-based every year, stability would be greatly reducedand influence costs increased since, in its currentform, the spending whims of English departmentswould determine entirely the outcomes for the periph-eral regions. Instead, under the operation of the Barnettformula, the budgets of the peripheral regions are basedalmost entirely on historical budget priorities of theWhitehall departments and only marginally on currentpriorities. Third, the Barnett system imposes a hardbudget constraint. A strict formula-based approachmeans that the devolved administrations are not bailedout when they make policy mistakes. The sharpeningof financial accountability that accompanies a hardbudget constraint is thought to improve public decisiontaking. HALLWOOD and MCDONALD (2005, 2006)make this point with particular force.
These advantages require that the Barnett formulashould be transparent. But as it has been argued in theprevious subsection, the actual operation of theBarnett formula is curiously opaque. In its early yearsthe formula was little understood, with most infor-mation coming through academic research rather thanfrom the government. This changed with the publi-cation of a Written Answer to a parliamentary questionin 1997 where the process employed by the formula wasset out (OFFICIAL REPORT, 1997). More recently, howthe Barnett formula is technically calculated has becomecommon – if occasionally misconstrued – knowledge.However, the data required to track the precise mannerin which spending increases in England lead to the sub-sequent increases in the sums available to Scotland,Wales, and Northern Ireland are still not publicly avail-able. The Barnett mechanism cannot be verified inde-pendently and the relationship between the publishedBarnett process and the budget outcomes is stillhidden from scrutiny.10
BARGAINING NOT BARNETT
Whilst the Statement of Funding Policy maintains thatthe Barnett process is purely formula-driven, the evi-dence presented in the previous section suggests that itis not. An explanation for the actual figures is that inreality the outcome is the result of a bargainingprocess. This theory has a weak and a strong form.HEALD (1994) presents the weak form when heargues that the failure of per capita spending to convergeis a result of making extra payments outwith theformula. These ‘formula by-pass’ payments may varyfrom year to year, but independently of whether thesepayments are large or small, systematic or ad hoc, theywould act to erode the convergence features of theformula. Heald gives examples of how expenditureallocation outwith the formula might be justified.For instance, where a national pay deal is agreed, andScotland has a greater than population share of thatpublic sector group, it would be relatively under-funded. A similar financial difficulty would occurwhere one service is undertaken by the public sector inScotland but not in England, Scottish Water for instance.
MIDWINTER (2002) presents the bargaining theoryin a strong form. He asserts that ‘Scotland’s share ofUK public expenditure reflects a whole range ofdecisions, not just the mechanical application of theformula’ (p. 108). He extends Heald’s argument,placing reduced emphasis on the formula and rathermore on the bargaining: that is to say, his positionseems to be ‘bargaining plus formula’ rather than‘formula plus bargaining’. Midwinter’s stance is clearlyconsistent with that of Ros Dunn (HOUSE OF LORDS
SELECT COMMITTEE ON THE CONSTITUTION, 2002)cited in the previous section.
The Barnett Allocation Mechanism: Formula Plus Influence? 765
Dow
nloa
ded
by [
USM
Uni
vers
ity o
f So
uthe
rn M
issi
ssip
pi]
at 1
6:24
12
Sept
embe
r 20
14
The bargaining procedures outlined by Heald andMidwinter imply that the devolved administrationsmight be able to attract a greater share of public expen-diture than is consistent with their level of economicprosperity (MACKAY, 2001; MCLEAN and MCMILLAN,2003). ALESINA and SPOLAORE (1997, 2003) putforward theoretical arguments as to why such differen-tial treatment might be expected. The larger a country’ssize, the lower the per capita cost of providing nationalpublic goods as the fixed costs are shared amongst alarger population. However, expanding the territorialsize of a country will also tend to increase its culturaland economic diversity. In their account, the more per-ipheral a region, the greater both the geographical andcultural distance from the provision of national publicgoods. With a single national tax structure, the benefitsfrom a unified country are therefore distributed in aregionally differentiated way. This can mean that someterritories have a possible incentive to secede. Essen-tially in their basic model, the size of country that maxi-mizes average welfare is larger than the size that wouldbe produced through democratic decision-making.That is to say, secession can improve welfare in theseceding region whilst simultaneously having a detri-mental impact on total welfare.
Within the UK it is not difficult to recognize thisissue. All of the three peripheral regions – NorthernIreland, Scotland, and Wales – have cultural character-istics that are very distinct from the other (English)regions of the UK. Also, each has a significant politicalparty that seeks secession from the Union. In the caseof Scotland, there are key institutional differences:separate legal and educational systems, and a differen-tiated religious structure. Further, at the time ofwriting, the Scottish National Party (SNP), a partyfavouring Scottish independence, leads a minorityadministration in the Scottish Parliament. Clearly,these cultural characteristics, created through specifichistorical forces, will have their own separate impactsbut here reinforce the more mechanical Alesina andSpolaore argument.
ALESINA and SPOLAORE (2003) suggest two sol-utions to this problem. Providing that transfers do notlead to significant economic distortions, it might beoptimal to make transfers from central to peripheralregions. Alternatively, public good delivery might bedecentralized. Again, there is tangible evidence toboth these proposals from the UK. The creation ofthe post of Minister of State, then Secretary of Statefor Scotland, and finally the Scottish Parliament to Scot-land, and the provision of devolved rule in NorthernIreland, until it was suspended in 1972, and then itsintermittent reestablishment since 1998, represent adecentralizing of public good provision. The muchlater creation of the Welsh Office in 1964 and thehighly marginal 1999 pro-devolution vote in Walesmay serve to indicate both its closer geographical andsocial proximity to the ‘centre’.
In addition, Northern Ireland, Scotland, and Waleshave higher per capita identifiable expenditure thanEngland. The H. M. Treasury Needs Assessment Study:Report (H. M. TREASURY, 1979) showed needsindices for a similar level of provision for the public ser-vices that were to be devolved under the 1976 plans.These plans gave higher spending per head, respectively,to Wales, Scotland, and Northern Ireland, figures allabove the per capita spending level in England. Theseidentifiable expenditure figures remain higher today,as shown in the second section above, even thoughthe Barnett formula should encourage convergence.The UK, therefore, exhibits both Alesina and Spolaore’sprojected outcomes.
Given this argument, it is of interest to attempt a ball-park figure of how large the payment to the peripheralregions might be. Appendix 2 develops a very simpleaccounting model in which: the nation is divided intocentral and peripheral regions where the proportionof the population in the peripheral region is g; all indi-viduals have equal incomes; and the tax system isuniform across the economy. In this model, governmentexpenditure is divided between local and nationalpublic goods, where the proportion of total governmentexpenditure made on national public goods is a. Thequestion that is posed is: what is the additional expendi-ture per head that the centre would be prepared toprovide for local public goods in the periphery inorder to retain the contribution of the peripheralregions to the funding of national public goods?
The authors identify the ratio of per capita expendi-ture on local public goods in the peripheral region com-pared with the central region as 1. In this model, thoseliving in the centre benefit from the union as long as 1 isless than some maximum figure, 1, given as:11
�1 ¼ 1þa
1� a� g(1)
The value of a is difficult to determine accurately, butthe ratio of non-identifiable expenditure to totalmanaged expenditure is used as an approximation.H. M. TREASURY (2006) defines non-identifiableexpenditure as that:
deemed to be incurred on behalf of the United Kingdom
as a whole, e.g. defence expenditure, overseas represen-
tation, tax collection and some environmental protection
spending.
(p. 93)
It is the residual of spending undertaken by the govern-ment that has been identified as benefiting the people,businesses or communities in a region.12 For the finan-cial year 2004/05, the UK total managed expenditurewas £491 billion, with non-identifiable expenditureat £64 billion. This gives a value of a of 13%. Thedata for population are rather more straightforward.For mid-2006, the Scottish population was 5.1
766 Alex Christie and J. Kim Swales
Dow
nloa
ded
by [
USM
Uni
vers
ity o
f So
uthe
rn M
issi
ssip
pi]
at 1
6:24
12
Sept
embe
r 20
14
million out of a UK total of 60.6 million, giving a valueof g of just over 8% (NATIONAL STATISTICS ONLINE,2007). This generates a value of 1 for Scotland equalto 116%. This is very similar to the actual average differ-ential that is calculated for Scotland in the secondsection.13
The argument of Alesina and Spolaore is primarilybased on efficiency criteria, though this can also be sup-ported by an appeal to a form of ‘territorial justice’.First, if a country’s size is determined solely on demo-cratic principles, so that individual regions decidewhether to enter or leave existing countries, althoughthe average welfare per person falls, the minimumwelfare experienced by any individual is increased.Under Rawlsian criteria, welfare has risen (RAWLS,1971). Transfers from the centre to the periphery arean attempt to maintain the overall efficiency of theeconomy, but in doing so they also improve the relativewelfare of those located at the periphery.
Second, BINMORE (1994, 1998) argues that notionsof justice and fairness essentially reflect the bargainingposition of individuals and groups. Applying Binmore’sgeneral argument to this particular case, the additionalpublic sector provision in the peripheral regions canbe justified in terms of their physical and culturaldistance from the centre. But many disadvantagedgroups do not get such favourable treatment. In thiscase, the possibility of secession and the implied bargain-ing power strengthens the argument. However, thisapproach suggests a mechanism rather more systematicthan that identified by Heald, perhaps closer to theposition adopted by Midwinter.
FORMULA PLUS INFLUENCE
If this bargaining approach is accepted, another puzzleappears. Why have the Barnett formula at all? In con-ventional bargaining theory, the outcome can beaffected by varying the fallback position or the bargain-ing strength of either player (DIXIT and SKEATH, 1999,ch. 16). With a ‘bargaining plus formula’ approach, themost straightforward interpretation might be that theformula determines the fallback position for allplayers – the situation to which all players revert ifthey fail to reach an agreement.14 But the allocationof a budget is a zero-sum game. Therefore, theplayers would always be forced back to the formulaoutcome. This is because with any other bargain, atleast one player would be worse off than theirformula allocation and would therefore not acceptthe bargain.
In the case of Barnett, imagine that as a result of astrong bargaining position the peripheral regionscould increase their share of the national budget. Ifthese regions are really bargaining with the centralgovernment and the Barnett formula offers a fallbackposition, the central government would simply
impose the formula. Similarly, if the central governmenthad a bargaining position stronger than that suggestedby the Barnett formula, the peripheral regions wouldjust fail to reach an agreement so that the Barnettformula would need to be enforced. Either way, theoutcome is the Barnett allocation. But this is exactlythe result that authors such as Midwinter are attemptingto avoid. By introducing bargaining into the situation,they are attempting to provide a mechanism formoving the actual outcome away from the formula.
Of course, the formula might simply be cosmetic,veiling the real processes at work: ‘an effective smokesc-reen’ (MACKAY, 2001, p. 573). But if the motivation issimply misdirection for those in the English regions,why was the mathematical operation of the formulainitially hidden? Further, in practice, if this is centralgovernment spin – perpetrated by both Labour andConservative governments – it operates very imper-fectly. For the Barnett process receives much criticismin the devolved administrations over something thathas apparently not happened – convergence in publicspending per head.15 Clearly, a straight bargainingaccount will accommodate the lack of convergence,but it raises problems of its own.
The present authors wish to suggest a procedure thatstarts from the Barnett formula, but formally incorpor-ates influence behaviour (BECKER, 1983, 1985). This iscalled a ‘formula plus influence’ system. First, the pos-ition is outlined in broad-brush terms and then thedetails are discussed. In this approach, as far as the UKperipheral regions are concerned, the Barnett formulagenerates a floor allocation of funds. However, theseadministrations additionally use resources in anattempt to augment this allocation through influencebehaviour. Whilst the Barnett formula operating aloneproduces convergence in per capita public expenditure,the impact of the influence behaviour is to generateadditional revenues that are then incorporated into thebase for allocations in subsequent years.
Through varying its responsiveness to this influencebehaviour, the central government can determine theoverall allocation of funds to the peripheral regions.Therefore, central government can maintain a desiredrelative per capita public expenditure ratio that repli-cates what would be expected from the two sides’ bar-gaining positions, as in ALESINA and SPOLAORE (2003).Appendix 3 gives a mathematical demonstration of thisresult. It shows that with a constant population and afixed growth of nominal English public expenditure,appropriate central government behaviour in the‘formula plus influence’ system leads to the devolvedadministration spending a fixed proportion of itsrevenue on influence behaviour in order to maintain afixed relative per capita expenditure differential over time.
It is perhaps important to stress at this point thedifferences between the present approach and previousaccounts of the allocation of budgets to the UK periph-eral regions. First, the importance of considering the
The Barnett Allocation Mechanism: Formula Plus Influence? 767
Dow
nloa
ded
by [
USM
Uni
vers
ity o
f So
uthe
rn M
issi
ssip
pi]
at 1
6:24
12
Sept
embe
r 20
14
allocation mechanism as a whole is emphasized: that is,as a set of interacting institutional arrangements (GREIF,2006). The corollary is that to focus solely on one aspectof the allocation arrangement in isolation is to miss keyelements of, and therefore completely misunderstand,the overall process.
Second, whilst there are likely to be short-run fluc-tuations in the allocations, which reflect the flexibilityof the procedure, it is expected that the ratio of the rel-evant per capita public expenditure figures is relativelystable across time. This is because in the ‘formula plusinfluence’ account, these ratios reflect the relative bar-gaining positions of the peripheral regions. But theinstitutional difficulties that would accompany secessionare such that in bargaining, the long-run benefits andcosts of union to both sides should determine theoutcome. One would not expect these long-runbenefits and costs to vary widely in the short run.16
Third, it is unlikely that the ‘formula plus influence’system has been consciously designed to bring aboutthis outcome. In particular, the Barnett formula wasintroduced initially as a stop-gap measure. Rather, theinteraction and adjustment of institutional arrangementsthat were put in place to meet rather different needs hasproduced this stable allocative outcome. This is clearlyMidwinter’s view: the existing procedures should bejudged by their actual outcome, not by some theoreticalprojection of how the individual elements work inisolation.
Consistency with the evidence
A key characteristic of the ‘formula plus influence’version of the operation of Barnett is that it accommo-dates more satisfactorily the existing evidence than doalternative accounts. This authors begin with the evi-dence that is inconsistent with the strict application ofthe Barnett formula. First, within the ‘formula plusinfluence’ system, the lack of empirical support of con-vergence is straightforward. The formal inclusion ofinfluence activity means that the budget outcomes forthe devolved administrations will always be greater thana strict application of the Barnett formula would predict.
Second, there is no inconsistency in the views of insi-ders that the operation of the Barnett formula is notmeant to generate convergence. As shown in Appendix3, central government can calibrate its response to influ-ence behaviour so as to maintain the relative per capitapublic expenditures and the available evidence suggeststhis is broadly what has occurred, at least in the case ofScotland.
Third, where the system works with a combinationof formula and influence, the benefits of external trans-parency are questionable. Rather, the overall effective-ness of the system depends on a degree of opacity. Inparticular, the central government might have difficultyin formally acknowledging that the allocation process issystematically open to influence behaviour from the
peripheral regions. Further, it might be inconvenientthat there are explicit or implicit targets for relativeper capita public expenditure differentials that thecentral government is choosing to maintain. Recallthat the arguments presented by ALESINA andSPOLAORE (2003) link the more powerful bargainingposition of the peripheral regions with their credibleability to secede.
The section now turns to the evidence presentedagainst the pure bargaining solution. First, in the‘formula plus influence’ version of the budget allocationprocess, the formula still plays an important role. Byfocusing attention on marginal changes, it reducesoverall influence costs, and by setting a floor to theactual budget it gives a high degree of stability to thefinances of the devolved administrations. This meansthat the details of the formula are important and onewould expect revision from time to time. Second, thefact that the Barnett formula acting alone wouldproduce convergence is crucial for the ‘formula plusinfluence’ system. For example, if the formula by itselfmaintained the relative per capita public expenditures,then any additional influence behaviour would increasethese relativities. Because the influence behaviour isunidirectional, it is important that the rule-basedoutcome undershoots any desired target. Such under-shooting in this case means that the use of the formulaalone implies convergence.
Strengths of the formula plus influence system
The ‘formula plus influence’ system is consistent withthe evidence that other accounts of the UK allocationof funds to the peripheral regions find difficult toexplain. Further, there are three potential advantagesfrom such a system: improved flexibility, greater politi-cal integration, and increased information flows.
In incorporating influence, the flexibility of theallocation system is improved. A formula-based systemoperates as a rule of thumb that by definition cannotadapt to unforeseen circumstances. Even if theformula has broad agreement initially, it will losesupport if it is perceived to become unfair over time.But the economy is subject to spatially asymmetricshort-term and long-term shocks, such as the onset offoot-and-mouth disease or the impact of differentialpopulation growth, which strain the formula. A strictlyapplied rules-based system trades off flexibility forincreased certainty and reduced influence costs.However, the inflexibility of such an approach is likelyto become more costly over time and might ultimatelythreaten the viability of the allocation system. Then thepossibility of renegotiating the formula negates theadvantages that the rules-based system appears tooffer: significant influence costs and uncertainty againarise. Similar problems are discussed at depth in theliterature on rules-based regimes for monetary policy(BALLS et al., 2002; DRAZEN, 2000).
768 Alex Christie and J. Kim Swales
Dow
nloa
ded
by [
USM
Uni
vers
ity o
f So
uthe
rn M
issi
ssip
pi]
at 1
6:24
12
Sept
embe
r 20
14
Allowing influence behaviour to affect outcomes in acontrolled way potentially improves the integration ofperipheral regions into the national political system.The regional administrations can be seen to be operat-ing in the interests of the local population in attemptingto increase funding for issues of local importance. Forinstance, Ian Lang, reflecting on his period as Secretaryof State for Scotland, maintains that:
[t]he real scope for protecting Scottish interests lay in the
side deals and the special ad hoc negotiations that stood
outside the corral of the ‘bloc and formula’. . . . The
very existence of the Barnett formula, far from inhibiting
me, enabled me to concentrate on special deals to augment
our resources.
(LANG, 2002, p. 194)
Similarly, the centre can be seen to be reacting in arelevant manner – with cash – to what are taken tobe the most important needs of the peripheral regions.This is of particular importance pre-devolution inbolstering the legitimacy and credibility of the locallyunelected administrations, and gains significance giventhe limited independent tax-raising powers of the per-ipheral regions, both pre- and post-devolution.
Finally, influence behaviour provides importantinformation to the central government. It gives anincentive to the peripheral regions to signal their pro-blems and priorities.
THE BARNETT PROCEDURE
POST-DEVOLUTION
The Barnett formula was maintained as the mechanismfor financing the UK devolved administrations in theperipheral regions. However, this does not mean thatthe operation of the ‘formula plus influence’ systemhas been unaffected. For whilst the relatively favour-able public expenditure position of the devolvedadministrations stems from their peripheral status,and the potential bargaining power this gives, theparticular administrative arrangements for deliveringthis outcome are of equal importance. In this respect,devolution has at least three key implications for themechanism determining the funding levels to thedevolved Parliament and Assemblies.
First, it is inconceivable that the operation of theformula remains opaque and not subject to external ver-ification. Devolution, and the increase in financialinformation that has accompanied it, has led to anincrease in the visibility of the Barnett formula andgreater scrutiny of the formula’s outcome and itsmethod of operation. MACKAY (2005) emphasizes thispoint. There is no evidence that this scrutiny willreduce as devolution becomes embedded: in fact, itseems more likely to increase. Given that Barnett oper-ates through formula plus influence, this will destabilizethe whole procedure.17
Second, devolution reduces the potential forinfluence activity in Westminster and Whitehall. Forexample, at the time of writing the role of Secretary ofState for Scotland is curiously combined with that ofDefence Secretary in the UK Cabinet. With a separateFirst Minister in the Scottish Parliament, it seems unli-kely that the UK Cabinet spends much time on Scottishaffairs. Further, where powers have been devolved to theScottish Parliament, civil servants will have less contactwith their counterparts in the corresponding Whitehalldepartments. Therefore, the ability to affect budgetarydecisions in Scotland’s favour is likely to be reduced.
Third, devolution has almost certainly increased thenotional bargaining power of the now devolved admin-istrations through making secession organizationallymore straightforward. However, as is argued above, ithas simultaneously weakened the ability of the‘formula plus influence’ mechanism to maintain the dif-ferentially favourable funding levels of the devolvedregions. This suggests that the Barnett formula willremain a source of friction in the devolved settlement:what was a robust, but flexible, funding mechanismpre-devolution might prove inadequate for the post-devolution world.
The increased concern over the Barnett formula hasled to alternative financing mechanisms being putforward. Many involve a certain degree of fiscal auton-omy, which raises issues beyond the scope of this paper(ASHCROFT et al., 2006; HALLWOOD and MCDONALD,2005, 2006). Schemes that retain the full funding of theperipheral regions by the central government typicallyinclude a needs assessment. However, there are cleartensions raised in replacing the present funding mechan-ism for the now devolved administrations with onebased on a needs assessment exercise that couldequally apply to the English regions (MCLEAN andMCMILLAN, 2003).
First, the following statement by Ros Dunn indicatesthat H. M. Treasury are aware that devolution under-mines the notion of a standard set of needs thatshould be met in each region:
[P]art of the point about devolution was to allow for the
devolved countries to have policy evolving in different
ways to meet their own circumstances, so when you
come to think about what would be a uniform level, the
answer is do you say that the policy approach in England
is the one we should standardize on, or the policy
approach in Scotland, and so on. So I think there are
some very complicated issues underlying that, and the
argument I think would be that what we have is a reason-
able distribution method that has commanded acceptance.
(HOUSE OF LORDS SELECT COMMITTEE ON THE
CONSTITUTION, 2002, Minutes of Evidence,
answer to Question 1266)
Under devolution, it is not clear whose definition ofneeds should count. In some of the recent literature itis suggested that simple criteria, such as regional valueadded per head, is an appropriate measure of need,
The Barnett Allocation Mechanism: Formula Plus Influence? 769
Dow
nloa
ded
by [
USM
Uni
vers
ity o
f So
uthe
rn M
issi
ssip
pi]
at 1
6:24
12
Sept
embe
r 20
14
but this is extremely questionable (BELL and CHRISTIE,2007). Any needs assessment would have to be based ona weighted index with the weights extremely difficult todetermine objectively.
Second, the present asymmetric decentralized gov-ernance framework in the UK implicitly recognizesthe separate status of the devolved administrations.This separate status has a long history that predatesdevolution (see Appendix 1). The peripheral regionshave a greater cultural distance from, and a greater bar-gaining power with, central government than theEnglish regions. There is no necessity that the Englishregions should ever want or have the same degree ofpolitical independence experienced by the presentlydevolved administrations (HAZELL, 2006; RALLINGS
and THRASHER, 2006).18
CONCLUSIONS
In the debate concerning the funding of the nowdevolved peripheral regions, the Barnett formula isoften presented as a mechanism that is so fundamentallyflawed that almost any reasonable alternative wouldbe an improvement. This view is wrong. Barnett isonly one element in a more nuanced ‘formula plusinfluence’ system that has many advantages for bothcentral government and the peripheral regions.Remember that the Barnett formula has been inplace for thirty years and was preceded by an allocationsystem that appeared to operate, in practice, in a verysimilar manner.
Although the Barnett formula was retained afterdevolution, many of the other key institutional elementsof the ‘formula and influence’ system changed. This hasled to a questioning of the Barnett mechanism in bothcentral and peripheral regions. In the debate overBarnett, the disparity between the outcome thatBarnett would produce if it operated in isolation andthe actual outcome that has resulted from the ‘formulaplus influence’ mechanism, of which Barnett is a part,has been misused on both sides. It is not the Barnettformula but the UK government that has retained thefavourable funding position for the peripheral regions.Similarly, there has been no Barnett squeeze onfunding to the peripheral regions, as would haveoccurred had Barnett been rigorously applied andbeen operating in isolation.
If it seeks to reform or replace Barnett, the govern-ment faces an extremely difficult task. The conventionalresponse to the requirement for transparency and equityof treatment across all the regions of the UK is that someneeds assessment procedure should be adopted(H. M. TREASURY, 1979). It is generally thought thatsuch an exercise would give peripheral regions ahigher expenditure per head on local public goodsthan the UK average, although the difference wouldbe lower than at present (MACKAY, 2001, 2005;
MCLEAN and MCMILLAN, 2003).19 However, in thepresent authors’ view the budgets to the peripheralregions for local public goods have in the past offsetthe lower value to these regions of national publicgoods. This reflects the greater cultural and geographicdistance of these regions from the centre and the greaterpolitical coherence and the more powerful bargainingpower that the peripheral regions held. An appropriatesolution will be difficult to find.
Acknowledgements – The authors would like to thank
John McLaren, Peter McGregor, James Mitchell, Arthur
Midwinter, Andy Park, the participants at the Scottish Econ-
omic Society Annual Conference, Perth, UK, 2006, the
Regional Science Association, British and Irish Section,
Annual Conference, Jersey, UK, 2006, and four anonymous
referees for comments on this and earlier related works.
APPENDIX 1: THE HISTORY AND
MECHANICS OF THE BARNETT FORMULA
The Barnett formula has a predecessor in the Goschenformula. Named after George Goschen, Chancellor ofthe Exchequer in office when it was introduced in1888, this formula was used until 1959 (HEALD andMCLEOD, 2002). It operated by allocating funds onthe following basis: 80% to England and Wales, 11%to Scotland, and 9% to Ireland (until Ireland achievedself-government). After 1918, Scotland received 11/80ths of increments to relevant English public expendi-ture over the level paid in 1913–1914 (MCPHERSON
and RAAB, 1988). These proportions were based onthe contribution of probate duties to the Exchequer –rather than the population shares – at the time of theformula’s introduction (MITCHELL, 1991). Fundingfor Northern Ireland operated somewhat differently.Post-1920, the province was supposed to make animperial contribution to Westminster as payment forthose services provided by the UK government thatbenefited Northern Ireland. In fact, this quicklybecame an effective imperial subsidy, as Stormont (theNorthern Irish government) was never in a positionto afford such a contribution and the flow of fundswas reversed (MITCHELL, 2004).
Between 1959 and 1978 there was no formallyacknowledged mechanism to allocate resources to theperipheral regions. HEALD and MCLEOD (2002,p. 458) note that it would have been difficult to castaside immediately the Goschen formula and ‘that 11/80ths of England and Wales provision may have beenseen as a minimum’. This system remained in placeuntil the inception of the Barnett formula in 1978.(HEALD, 1980, christened the formula after JoelBarnett, Chief Secretary to the Treasury when theformula was introduced.) However, the Barnettformula was the second-choice allocation mechanismto a needs assessment. As part of the proposal to establish
770 Alex Christie and J. Kim Swales
Dow
nloa
ded
by [
USM
Uni
vers
ity o
f So
uthe
rn M
issi
ssip
pi]
at 1
6:24
12
Sept
embe
r 20
14
devolved assemblies for Scotland and Wales, the inten-tion was to use a formula system based upon a needsassessment for those functions that were to be devolved.More importantly, the needs-based formula was to besettled after consultation with the devolved Assemblies.
The Barnett formula appears to have been devised bythe UK Treasury and imposed on the peripheralregions. Since it was only considered to be an interimarrangement, this might have reduced any resistancefrom the Scottish and Welsh Offices. But the failureof devolution and the election of the strongly anti-devolutionist Conservative government meant that theBarnett formula was retained and rapidly became insti-tutionalized, though little publicized.
APPENDIX 2: THE COSTS OF SECESSION
Imagine a unified country, subscript U, with a centraland peripheral region, subscripted as C and R, respect-ively. Government expenditure, G, is divided betweennational and local public goods (N and L). The publicsector has a balanced budget, with a constant percapita tax rate t, and the proportion of the budgetspent on national public goods is a. Population is P,with the proportion in the peripheral region as g. Forthe unified economy the tax rate is given as:
t U ¼N þ LC þ LR
P C þ PR
(A2:1)
For the centre, if the peripheral region secedes, the taxrate is:
t C ¼N þ LC
PC
(A2:2)
The central population is better off retaining the per-iphery within the union as long as:
t C � t U (A2:3)
Substituting equations (A2.1) and (A2.2) intoexpression (A2.3) gives the required inequality as:
N þ L C
PC
�N þ LC þ LR
P C þ P R
(A2:4)
which can be reformulated as:
N þ L C
PC
�N þ LC
P C
� �P C
P C þ PR
� �þ
LR
P C þ PR
(A2:5)
which simplifies to:
N þ L C
P C
� �PR
P C þ P R
� ��
L R
PC þ P R
(A2:6)
Multiplying both sides of expression (A2.6) by P CþP R
P R
produces:
N
P C
þL C
P C
�L R
P R
(A2:7)
Define the proportionate difference between theexpenditure on local public goods between the centreand peripheral regions as 1, so that:
L R
P R
¼ 1L C
P C
(A2:8)
where one expects 1.1. Combining expression(A2.7) and equation (A2.8) and rearranging pro-duces:
N � ð1� 1ÞLC (A2:9)
Given the share of the national public good in totalgovernment expenditure and the proportion of thepopulation in the peripheral region, the value ofthe expenditure on local public goods in thecentral region is given as:
LC ¼Gð1� aÞð1� gÞ
1þ gð1� 1Þ(A2:10)
Combining expression (A2.9) and equation (A2.10)gives:
a �ð1� 1Þð1� aÞð1� gÞ
1þ gð1� 1Þ(A2:11)
Rearranging expression (A2.11), for values of 1.aþg,produces the maximum value for 1 (1) for which thecentre still gains from the union, so that:
�1 ¼ 1þa
1� a� g(A2:12)
APPENDIX 3: A MATHEMATICAL
REPRESENTATION OF THE FORMULA
AND INFLUENCE SYSTEM
In period t, the ratio of peripheral to central publicexpenditure per head, m, is given as:
m ¼At
Gts(A3:1)
where At is the actual peripheral real allocation of fundsthrough the Barnet mechanism; Gt is the comparablecentral real public expenditure figure; s is the periph-eral population measured relative to the central total;
The Barnett Allocation Mechanism: Formula Plus Influence? 771
Dow
nloa
ded
by [
USM
Uni
vers
ity o
f So
uthe
rn M
issi
ssip
pi]
at 1
6:24
12
Sept
embe
r 20
14
and the subscript t indicates the time period. (Thepopulation ratio is assumed to be unchanged overtime). Given that the peripheral region has a relativelyhigh per capita public expenditure, m . 1, under whatcircumstances will a combination of the Barnettformula plus influence behaviour, regulated by thecentral government, maintain the value of m constantover time?
The administration in the peripheral region can usereal resources in period t, It, to influence thebudget allocation from central government by a realamount, Etþ1, in the subsequent year. One can takethe impact of this influence activity to be governed bythe general relationship:
Etþ1
Btþ1
¼ ZIt
At
� �a(A3:2)
where Btþ1 is the real Barnett counterfactual allocationof resources in period t þ 1; and Z (.0) anda (1 . a . 0) are at present treated as parameters. Bythe counterfactual Barnett allocation is meant theallocation in period t þ 1 that would follow from At
without influence activity.Equation (A3.2) can be also be expressed as:
Etþ1 ¼ Kt It½ �a (A3:3)
where:
Kt ¼ZBtþ1
Aat
(A3:4)
and
dEtþ1
dIt
. 0;d2Etþ1
dI2t
, 0
However, the benefits to the peripheral administrationdo not stop in period 1: any improvement in fundingin one period is continued in nominal terms into allsubsequent periods as it becomes built into theBarnett formula outcomes.
The forward-looking peripheral administration setsthe value of It in order to maximize the present value,Pt, of public sector consumption. This is given as:
Pt ¼X1i¼t
di�tCi (A3:5)
where Ci is real public consumption in period i; and d isthe time discount factor (0 , d , 1). For the initial
period, that is where i ¼ t:
Ct ¼ At � It (A3:6)
For subsequent periods, where i . t:
Ci ¼ Ai ¼ Bi þEtþ1
ð1þ rÞi�t�1(A3:7)
where r is the rate of inflation. The additional fundinggenerated by the influence behaviour in period t is dis-counted by the inflation rate because the Barnettformula operates in nominal terms.
Combining equations (A3.3) to (A3.7) gives:
Pt ¼ At � It þX1i¼tþ1
d i�tBi þ KtIat
X1j¼tþ1
d j�t
ð1þ rÞ j�t�1
(A3:8)
that can be restated as:
Pt ¼ At � It þX1i¼tþ1
di�tBi þ KtIat
dð1þ rÞ
1þ r� d
� �
(A3:9)
Partially differentiating equation (A3.9) with respect toIt and setting this to zero gives the investment in influ-ence that maximizes the present value of real publicconsumption in the peripheral region:
It ¼Ktadð1þ rÞ
1þ r� d
� �1=1�a
(A3:10)
Substituting equation (A3.10) into equation (A3.3) andusing equation (A3.4) gives the real increase in centralgovernment funds received in period tþ1 as a resultof this optimal influence activity by the peripheraladministration:
Etþ1 ¼ K1=1�at
adð1þ rÞ
1þ r� d
� �a=1�a
¼ZBtþ1
Aat
� �1=1�aadð1þ rÞ
1þ r� d
� �a=1�a(A3:11)
The parameter Z can be treated as a central governmentpolicy instrument, with variations in parameter Z cor-responding to the central government varying its recep-tiveness to the devolved administrations. But can thevalue of this influence–behaviour efficiency parameter,Z, be set so as to maintain the peripheral relative publicexpenditure per head constant, as against the Englishfigure?
772 Alex Christie and J. Kim Swales
Dow
nloa
ded
by [
USM
Uni
vers
ity o
f So
uthe
rn M
issi
ssip
pi]
at 1
6:24
12
Sept
embe
r 20
14
The counterfactual peripheral Barnett allocationfor the period t þ 1, that is the allocation withoutinfluence behaviour, is calculated as follows. The per-ipheral region receives its nominal budget for the pre-vious year plus a share of the change in the centralnominal budget. This share is proportional to the per-ipheral region’s population. If the proportionateincrease in real national government expenditure isg, and the inflation rate is r, then the change innominal central government expenditure, DGtþ1
N, isgiven as:
DGNtþ1 ¼ Gtð1þ rÞð1þ gÞ �Gt
¼ Gtðrþ g þ rgÞ (A3:12)
Using equations (A3.1) and (A3.12), the counterfactualBarnett allocation is therefore:
Btþ1 ¼At þ sDGN
tþ1
1þ r
¼GtsmþGtsðrþ g þ rgÞ
1þ r
¼Gtsðmþ rþ g þ rgÞ
1þ r(A3:13)
Again, using equation (A3.1), equation (A3.13) can beexpressed as:
Btþ1 ¼Atðmþ rþ g þ rgÞ
ð1þ rÞm(A3:14)
The required increase in the budget generated byinfluence behaviour in order to maintain the realvalue of the peripheral allocation (and therefore its rela-tively favourable position in terms of per capita expen-diture) is given by:
Etþ1 þ Btþ1
Gtsð1þ gÞ¼ m (A3:15)
Rearranging equation (A3.15) and using equations(A3.13) and (A3.1) produces:
Etþ1 ¼Gts
1þ rðmð1þ gÞð1þ rÞ � m� g � r� rgÞ
¼At
ð1þ rÞ
ðm� 1Þðg þ rþ rgÞ
m
� �
(A3:16)
Equation (A3.16) indicates the funding required,additional to that coming through the strict applicationof the Barnett formula, to maintain the relativelyfavourable peripheral per capita public expenditure.
The corresponding equation for Etþ1 derived fromthe maximizing behaviour of the peripheral adminis-tration is found by combining equations (A3.14) and(A3.11) to give:
Etþ1¼At
ð1þrÞ
ZðmþrþgþrgÞ
m
� �1=1�aad
1þr�d
� �a=1�a
(A3:17)
If equation (A3.17) is substituted into equation (A3.18),one can derive the value of Z, the influence–effective-ness parameter, which will maintain the value of therelative per capita public expenditure, m, constant.This is:
Z¼ðm�1ÞðgþrþrgÞ� �1�a
mð1þr�dÞ½ �a
ðmþrþgþrgÞðadÞa(A3:18)
Whilst the expression on the right-hand side ofequation (A3.18) is rather complex, it is independentof the scale of the initial Barnett allocation. Therefore,in period t þ 1, when the peripheral administrationagain has to take the decision about influence activity,it will allocate the same share of its budget with thesame relative effects on the allocation in future rounds.
NOTES
1. In the remainder of this paper, this is referred to as relative
public expenditure convergence.
2. Initially, the changes in the relevant expenditure totals
were measured in real terms. This was changed to
nominal terms in 1982.
3. Scotland’s population has fallen since the 1970s, and this
was reflected in the updated population ratios in 1992.
Since 1997, this updating has become annual, with the
latest population estimates giving Scotland 10.32% of
the English population, having fallen from 10.66% in
the first update in 1992.
4. Those parts of DEL on which the Barnett formula oper-
ates are given a comparability percentage from zero to
100%, which represents the extent to which the expen-
diture for that item is conducted by the devolved admin-
istration or by Westminster. This is then multiplied by
the population percentage to arrive at an increment for
each budget line; the sum of all budget lines being the
Barnett formula-determined increment to the devolved
administration.
5. That is to say, over time the ratio of the peripheral
region’s relevant public expenditure per head to the
English comparable public expenditure per head tends
to unity.
6. The degree of convergence implied by the formula will
be positively related to the extent of spending covered,
the rate of real public spending increases in England,
and the rate of inflation. If there is a falling population
share in the peripheral region, then this can slow the con-
vergence process, but this is of minor importance in this
The Barnett Allocation Mechanism: Formula Plus Influence? 773
Dow
nloa
ded
by [
USM
Uni
vers
ity o
f So
uthe
rn M
issi
ssip
pi]
at 1
6:24
12
Sept
embe
r 20
14
time period. For a full mathematical treatment of the
formula and squeeze, see CUTHBERT (1998, 2001) and
BELL (2000).
7. GALLAGHER and HINZE (2005) consider two other sets
of figures. They plot Scottish relative per capita aggregate
and identifiable relative public expenditure over a longer
time period (1980–2003), but find no convergence.
They also calculate Scottish relative per capita health
expenditure over a similar time period. This initially
diverges from the English level and then converges, but
these expenditures will be affected by a number of
factors, not simply Barnett.
8. The data for early years come from the annual Autumn
Statement (H. M. TREASURY, various years) and sub-
sequently the Financial Statement and Budget Report
(H. M. TREASURY, various years) after the publications
were merged in 1992. Data for each year are the latest
available, on the basis that these have the lowest discre-
pancy from actual budgets. The measures employed are
the planning total for Scotland and the overall planning
total for the UK. After the public sector’s accounting
system altered in 1998, the figures are for Scottish DEL
and total UK DEL.
9. The value for the Wald–Wolfowitz Runs test indicates
that the sequence of increases and decreases in relative
expenditure is not significantly different from random
at the 10% significance level.
10. One reason for failing to reveal an allocation formula
might be so as to stop the participants ‘gaming the
system’. However, in this case, with the formula allo-
cation being determined solely by the population share,
that would not be a consideration.
11. Equation (1) shows that where the peripheral region is
very small, so that g ! 0, the central government will
be prepared to supply additional expenditure to cover
local public goods up to a value of 1 ¼ 11�a
. This is the
ratio of total public expenditure to public expenditure
on local public goods. The maximum additional per
capita expenditure is increased where the share of national
public goods and the size of the potentially seceding per-
ipheral region are larger given that @�1@a ;
@�1@g . 0.
12. However, some of the expenditure allocated to regions is
actually to finance national public goods. An example is
the wage costs of defence establishments.
13. The calculated figures for Wales, 116%, and Northern
Ireland, 115%, are very similar but slightly smaller,
reflecting the lower population level in these regions.
14. This is the role played by their amended Barnett formula
in the scheme for allocation of government revenue to
the UK regions put forward by MCLEAN and
MCMILLAN (2003).
15. The formula is also criticized in some English regions for
maintaining intact the original additional per capita
nominal expenditure advantage that the now devolved
administrations had over the English average
(MCGREGOR and SWALES, 2005).
16. For an account of the difficulties facing the movement
towards Scottish independence, see HAZELL (2008).
However, ACEMOGLU and ROBINSON (2006) take
rather a different position. They argue that short-run
considerations have been important in the timing of
the expansion of suffrage, though the commitment
problems that drive their analysis seems less relevant here.
17. It is odd that many who wish to defend the Barnett
process, for example, Dewar (SCOTTISH GRAND
COMMITTEE, 1998) and MCCONNELL (2000), praise it
for the transparency and simplicity that it does not have
in actual operation.
18. In saying this, the authors do not wish to give any disser-
vice to English regionalism. Clearly, there are economic,
social, and cultural variations across English regions and
there is a degree of decentralized policy-making. But
within England, the desire for political institutions at
the regional level is at present very weak.
19. Because there has been no recent needs assessment, it is
not possible to be categorical about this. For regions
such as Scotland, differential expenditure on local
public goods would reflect both the relative need and
the cost of meeting that need, given that the greater
spatial dispersion of the population increases transport
costs and reduces the possibility of economies of scale
and scope in the provision of public goods.
REFERENCES
ACEMOGLU D. and ROBINSON J. A. (2006) Economic Origins of Dictatorship and Democracy. Cambridge University Press, Cambridge.
ALESINA A. and SPOLAORE E. (1997) On the number and size of nations, Quarterly Journal of Economics 112, 1027–1056.
ALESINA A. and SPOLAORE E. (2003) The Size of Nations. MIT Press, Cambridge, MA.
ASHCROFT B., CHRISTIE A. and SWALES K. (2006) Flaws and myths in the case for Scottish fiscal autonomy, Fraser of Allander
Quarterly Economic Commentary 13, 33–39.
BAILEY S. J. and FINGLAND L. (2004) Convergence of public expenditures in UK territories, Regional Studies 38, 845–858.
BALLS E., O’DONNELL G. and BHUNDIA A. (2002) The UK model of central bank independence: an assessment, in BALLS E. and
O’DONNELL G. (Eds) Reforming Britain’s Economic and Finance Policy, pp. 85–109. H. M. Treasury, London, and Palgrave,
Basingstoke.
BECKER G. S. (1983) A theory of competition among pressure groups for political influence, Quarterly Journal of Economics 98,
371–400.
BECKER G. S. (1985) Public policies, pressure groups and deadweight costs, Journal of Public Economics 28, 329–347.
BELL D. (2000) The Barnett Formula. Mimeo. University of Stirling, Stirling.
BELL D. and CHRISTIE A. (2007) The Difficulty of Simple Needs Assessment in the UK. Mimeo. University of Strathclyde, Glasgow.
BINMORE K. (1994) Game Theory and the Social Contract – Playing Fair. MIT Press, Cambridge, MA.
BINMORE K. (1998) Game Theory and the Social Contract – Just Playing. MIT Press, Cambridge, MA.
CUTHBERT J. (1998) The Implications of the Barnett Formula. Saltire Paper Number 1. Scottish National Party, Edinburgh.
CUTHBERT J. (2001) The effect of relative population growth on the Barnett squeeze. Fraser of Allander Quarterly Economic
Commentary 26, 34–37.
774 Alex Christie and J. Kim Swales
Dow
nloa
ded
by [
USM
Uni
vers
ity o
f So
uthe
rn M
issi
ssip
pi]
at 1
6:24
12
Sept
embe
r 20
14
DIXIT A. K. and SKEATH S. (1999) Games of Strategy. Norton, New York, NY.
DRAZEN A. (2000) Political Economy in Macroeconomics. Princeton University Press, Princeton, NJ.
FERGUSON L., MCGREGOR P. G., SWALES J. K. and TURNER K. (2003) The Regional Distribution of Public Expenditures in the UK: An
Exposition and Critique of the Barnett Formula. Discussion Papers in Economics Number 03-08. University of Strathclyde,
Glasgow.
GALLAGHER J. and HINZE D. (2005) Financing Options for Devolved Government in the UK. Discussion Paper Number 2005-24.
Department of Economics, University of Glasgow, Glasgow.
GREIF A. (2006) Institutions and the Path to the Modern Economy. Cambridge University Press, Cambridge.
H. M. TREASURY (1979) Needs Assessment Study: Report. HMSO, London.
H. M. TREASURY (2006) Public Expenditure Statistical Analysis 2006. HMSO, London.
H. M. TREASURY (various years) Autumn Statement. HMSO, London.
H. M. TREASURY (various years) Financial Statement and Budget Report. HMSO, London.
H. M. TREASURY (various years) Public Expenditure Statistical Analyses. HMSO, London.
HALLWOOD P. and MCDONALD R. (2005) The economic case for fiscal federalism, in COYLE D., ALEXANDERW. and ASHCROFT B.
(Eds) New Wealth for Old Nations: Scotland’s Economic Prospects, pp. 96–116. Princeton University Press, Princeton, NJ.
HALLWOOD P. and MCDONALD R. (2006) The Economic Case for Scottish Fiscal Autonomy: With or Without Independence. Policy
Institute, Edinburgh.
HAZELL R. (2006) The English question, Publius 36, 37–56.
HAZELL R. (2008) Salmond has far to leap, Prospect July, 18.
HEALD D. (1980) Territorial Equity and Public Finances: Concepts and Confusion. Studies in Public Policy Number 75. University of
Strathclyde Centre for the Study of Public Policy, Glasgow.
HEALD D. A. (1994) Territorial public expenditure in the United Kingdom, Public Administration 72, 147–175.
HEALD D. A. and MCLEOD A. (2002) Public expenditure, in The Laws of Scotland: Stair Memorial Encyclopaedia, paras 480–552.
Butterworths, Edinburgh.
HOUSE OF LORDS SELECT COMMITTEE ON THE CONSTITUTION (2002) Official Report 26 June, Q1263.
KAY N. (1998) The Scottish Parliament and the Barnett Formula, Fraser of Allander Quarterly Economic Commentary 24, 32–48.
LANG I. (2002) Blue Remembered Years: A Political Memoir. Politico’s, London.
MACKAY R. R. (2001) Regional taxation and spending: the search for balance, Regional Studies 35, 563–575.
MACKAY R. R. (2005) Thinking about need: public funding on the regions, Regional Studies 39, 815–828.
MCCONNELL J. (2000) Why Barnett remains better than the alternatives, New Economy 7, 65–68.
MCGREGOR P. and SWALES J. K. (2005) Economics of devolution/decentralization in the UK: some questions and answers,
Regional Studies 39, 477–494.
MCLEAN I. and MCMILLAN A. (2003) The distribution of public expenditure across the UK regions, Fiscal Studies 24, 45–71.
MCPHERSON A. and RAAB C. D. (1988) Governing Education: A Sociology of Policy Since 1945. Edinburgh University Press,
Edinburgh.
MIDWINTER A. (1999) The Barnett Formula and public spending in Scotland: policy and practice, Scottish Affairs no. 28, 83–92.
MIDWINTER A. (2002) The limits to fiscal autonomy under the devolution settlement, Scottish Affairs no. 41, 102–120.
MIDWINTER A. (2004) The changing distribution of territorial public expenditure in the UK, Regional and Federal Studies 14,
499–512.
MITCHELL J. (1991) Scottish Public Finances. Mimeo. University of Strathclyde, Glasgow.
MITCHELL J. (2004) Financing devolution: Stormont and the Welfare State. Paper presented at the Conference of the PSA British
and Comparative Territorial Politics Specialist Group 2004, University of Strathclyde, Glasgow.
NATIONAL STATISTICS ONLINE (2007) (available at: http://www.statistics.gov.uk).
OFFICIAL REPORT (1997) Official Report 9 December, cols 510–513.
RALLINGS C. and THRASHER M. (2006) ‘Just another expensive talking shop’: public attitudes and the 2004 Regional Assembly
Referendum in the North East of England, Regional Studies 40, 927–936.
RAWLS J. (1971) A Theory of Justice. Harvard University Press, Cambridge, MA.
SCOTTISH GRAND COMMITTEE (1998) Official Report 21 July.
THE SCOTSMAN (2005) The Scotsman 24 June.
The Barnett Allocation Mechanism: Formula Plus Influence? 775