THE BASIC AERODYNAMICS RESEARCH TUNNEL - A FACILITY DEDICATED TO CODE VALIDATION William L. Sellers 111*, Scott 0 . Kjelgaard** Analytical Methods Branch NASA Langley Research Center Hampton, VA Abstract Computational fluid dynamics code validation re- quirements are discussed together with the need for close interaction between experiment and code devel- opment. Code validation experiments require a great deal of data and for the experiments to be successful, a highly-productive research facility is required. A de- scription is provided of the NASA Langley Basic Aero- dynamics Research Tunnel (BART); especially the in- strumentation and experimental techniques that make the facility idealy suited to code validation experiments. Results are presented from recent tests which illustrate the techniques used in BART. Introduction Computational fluid dynamics (CFD) methods are playing an ever increasing role in the design of aircraft and are progressing toward the prediction of the three- dimensional flowfield about complex geometries at high angles-of-attack. These methods usually involve solu- tions of the Euler or Navier-Stokes equations and typ- ically require assumptions about the structure of the flowfield to make the solution more tractable. Detailed experimental flowfield and surface mea- surements, with minimal, quantifiable errors, are re- quired to validate these methods. To date, few sets of experimental data exist which are of sufficient de- tail and completeness to allow a definitive validation of current conlputational methods. The flowfields of inter- est are usually complex, and difficult to measure, and therefore require state-of-the-art instrumentation. The large volume of experimental data places demands on a facility. These demands are met with highly-automated data acquisition and control systems and large amounts of mass storage to maintain the data base. The future progress of CFD methods will depend on their ability to accurately model the fundamental physics of the flow. This ability can only be assessed by - - - - * Research Scientist, Analytical Methods Branch, Senior Member AIAA ** Research Scientist, Analytical Methods Branch This paper is declared a work of the U.S. Govermnel~t. and is not subject to copyright protection in the Uni(.ed States. comparisons between detailed experimental and compu- tational results. These experiments will require a close interaction between the code developer and the experi- mentalist. This interaction helps to design experiments that are productive, by focussing on specific items of interest. This paper will describe the NASA Langley Basic Aerodynamics Research Tunnel ( B A R T ) which is a fa- cility dedicated to obtaining the detailed flowfield data required for code validation. The instrumentation sys- tems and techniques that make the tunnel a highly pro- ductive research tool for code development and valida- tion will be described and typical comparisons between the experimental data and computational results will be presented. Many of the features that make the fa- cility suitable for code validation experiments also en- able the tunnel to undertake detailed flowfield studies over complex aircraft configurations. Flowfield surveys from recent high-alpha investigations of fighter config- urations will also be used to demonstrate some of the capabilities of the facility. Nomenclature centerline length of 75' delta wing model (22.392 inches) Reynolds number, V, L/v pitot or reduced total pressure, psf dynamic pressure, ipv: stokes number freestream velocity, ft/sec velocity components in the body axis system, ft/sec Cartesian coordinates in the body axis system pitch angle measured by 5-hole probe, deg yaw angle measured by 5-hole probe, deg kinematic viscosity, ft2/sec
Transcript
THE BASIC AERODYNAMICS RESEARCH TUNNEL - A FACILITY DEDICATED T O CODE VALIDATION
William L. Sellers 111*, Scott 0 . Kjelgaard** Analytical Methods Branch
NASA Langley Research Center Hampton, VA
A b s t r a c t
Computational fluid dynamics code validation re- quirements are discussed together with the need for close interaction between experiment and code devel- opment. Code validation experiments require a great deal of data and for the experiments to be successful, a highly-productive research facility is required. A de- scription is provided of the NASA Langley Basic Aero- dynamics Research Tunnel (BART); especially the in- strumentation and experimental techniques that make the facility idealy suited to code validation experiments. Results are presented from recent tests which illustrate the techniques used in BART.
I n t r o d u c t i o n
Computational fluid dynamics (CFD) methods are playing an ever increasing role in the design of aircraft and are progressing toward the prediction of the three- dimensional flowfield about complex geometries a t high angles-of-attack. These methods usually involve solu- tions of the Euler or Navier-Stokes equations and typ- ically require assumptions about the structure of the flowfield to make the solution more tractable.
Detailed experimental flowfield and surface mea- surements, with minimal, quantifiable errors, are re- quired to validate these methods. To date, few sets of experimental da ta exist which are of sufficient de- tail and completeness to allow a definitive validation of current conlputational methods. The flowfields of inter- est are usually complex, and difficult to measure, and therefore require state-of-the-art instrumentation. The large volume of experimental data places demands on a facility. These demands are met with highly-automated data acquisition and control systems and large amounts of mass storage to maintain the da ta base.
The future progress of CFD methods will depend on their ability to accurately model the fundamental physics of the flow. This ability can only be assessed by
- - - -
* Research Scientist, Analytical Methods Branch, Senior Member AIAA
** Research Scientist, Analytical Methods Branch
This paper is declared a work of the U.S. Govermnel~t. and is not subject to copyright protection in the Uni(.ed States.
comparisons between detailed experimental and compu- tational results. These experiments will require a close interaction between the code developer and the experi- mentalist. This interaction helps to design experiments that are productive, by focussing on specific items of interest.
This paper will describe the NASA Langley Basic Aerodynamics Research Tunnel ( B A R T ) which is a fa- cility dedicated to obtaining the detailed flowfield data required for code validation. The instrumentation sys- tems and techniques that make the tunnel a highly pro- ductive research tool for code development and valida- tion will be described and typical comparisons between the experimental da ta and computational results will be presented. Many of the features that make the fa- cility suitable for code validation experiments also en- able the tunnel to undertake detailed flowfield studies over complex aircraft configurations. Flowfield surveys from recent high-alpha investigations of fighter config- urations will also be used to demonstrate some of the capabilities of the facility.
N o m e n c l a t u r e
centerline length of 75' delta wing model (22.392 inches)
Reynolds number, V, L / v
pitot or reduced total pressure, psf
dynamic pressure, ipv: stokes number
freestream velocity, ft/sec
velocity components in the body axis system, ft/sec
Cartesian coordinates in the body axis system
pitch angle measured by 5-hole probe, deg
yaw angle measured by 5-hole probe, deg
kinematic viscosity, ft2/sec
P density, slug/ft3
total flow angle, sin-'(&=&)
L au av vorticity, p ( ~ - z) m bl
Subscripts:
P particle
t transition
00 a t freestream conditions
Superscripts: Root Mean Square (RMS)
C o d e Val ida t ion R e q u i r e m e n t s
With the advent of the new generation supercom- puters with large memory capacity, and improvements in algorithms and grid generation, the CFD codes are progressing toward the calculation of complex flowfields where little experimental data presently exists or is not technically feasible to acquire. One of the goals of a 1980 Stanford Conference On Complex Turbulent Shear ~ l o w s ' was to reach a consensus on trustworthy da ta sets that could be used for flow modeling or for check- ing the results from computer codes. During the confer- ence, a position paper2 was presented which discussed the experimental data requirements for CFD. Different type of experiments were classified and the experimen- tal requirements for each category discussed. Several of the many valuable comments and recommendations which were provided for future experiments are reiter- ated below.
One important recommendation was that future ex- periments must be well documented, with a statement of the experimental uncertainties. The understanding of the uncertainties must have a central role in the code validation effort because it is important (1) to the conlparison of da ta from different test facilities or techniques, (2) to the comparison of da ta to computa- tions from different algorithms, and (3) to determining whether da ta sets should be accepted or rejected for code validation.
It was also suggested that experiments should be conducted in more than one laboratory or facility, be- cause redundant testing helps uncover or isolate prob- lems generated by the experimental techniques or fa- cilities. This recommendation becomes even more im- portant in cases where the flowfields being measured are sensitive to the input turbulence spectrum. In addition, the experimenter should record the time-dependent or fluctuating signals so that da ta can be re-analyzed in later years for different quantities of interest or if ques- tions arise about the da ta set.
The NASA Aerodynamics Advisory Committee ( A A C ) formed an Ad Hoc Committee for Code Valida- tion in 1986. The goal of the committee was to provide a critical review of the NASA's efforts in code valida- tion. In July of 1987, the first NASA CFD Validation workshop3 was held. During the workshop the commit- tee's recommendations were summarized and comments were solicited from the industry, university and govern- ment representatives that were present.
The committee's review reiterated the need for close interaction between the code developer and the exper- imentalist. The committee developed specific defini- tions from which experiments would be classified and what was required for code validation. Validation was defined as "detailed surface-and-pow-field comparisons with experimental data to verify the code's ability to ac- c u r a t e l y m o d e l the cr i t i ca l phys ics of the pow". It was further stated that , "validation can occur only when the accuracy and limitations of the experimental data are known and thoroughly understood and when the accuracy and limitations of the code's numerical algorithms, grid-density effects, and physical basis are equally known ...".
Several of the committee's recommendations are re- peated below. The committee concluded that CFD val- idation is severely hampered by the lack of critical mea- surements under realistic conditions. In addition, mea- surements must be taken with adequate accuracy and resolution, and with redundant instrumentation, in or- der to evaluate the capability of C F D methods to pre- dict details and to explore the boundaries of application for specific codes. The committee also recomnlended that specific instrumentation and facilities need to be developed when the state-of-the-art is inadequate.
Bas ic A e r o d y n a m i c s R e s e a r c h T u n n e l
With the guidelines provided by the 1980 Stanford conference, the Analytical Methods Branch ( A M B ) of the NASA Langley Research Center set out to develop a facility dedicated to code validation and incorporate as many of the recommendations as possible into the tunnel operations and da ta acquisition. A commercially available wind tunnel was acquired in November 1984, with certain features such as the honeycomb cell size, screen mesh and porosity specified by the AMB. An important design specification for the tunnel was that it must be simple to operate and maintain.
Wind Tunnel
The Basic Aerodynamics Research Tunnel shown in figure 1 is an open-return wind tunnel with a test section 28 inches high, 40 inches wide and 10 feet long. The test section is divided into 2-five foot long bays. The
maximum flow velocity in the test section is 220 ft/sec which yields a R,/ft of 1.4 million. The airflow entering the test section is conditioned by a honeycomb, four anti-turbulence screens and an 11:l contraction ratio. The four-inch thick honeycomb has a 0.25 inch cell size. The screens are 20 mesh per inch with a porosity (ratio of open area to total area) of 64%. The tunnel is powered by a 125 horsepower AC motor coupled to a magnetic clutch. An electronic speed controller maintains the fan rpm within .1% of full scale (less than 1 rpnl variation).
These flow conditioners, coupled with an excellent fan speed controller, provide a low-turbulence, uniform flow in the test section. The variation in the longitu- dinal component of turbulence intensity with test sec- tion q is presented in figure 2 and shows that the u- component of the turbulence intensity ranges from ap- proximately .05% a t q = 10 lb/ft2 (V, = 92 ft/sec) to .08% a t q = 45 lb/ft2 (V, = 195 ft/sec).
Optical access to the test section is critical in code validation experiments, not only for flow visualization, but for non-intrusive instrumentation such as the laser doppler velocimeter (LDV). The plexiglass windows in the walls and ceiling were made as large as structurally possible and can be replaced with 11 mm thick glass for tests involving the LDV system.
D a t a Acquis i t ion a n d C o n t r o l S y s t e m
Code validation requires large amounts of experi- mental data. A highly integrated and automated da ta acquisition and control system (DACS) is required to acquire and reduce this data in a timely fashion. Real- time color graphic displays of flowfield parameters are required to ensure that the experiment is progressing properly and to assimilate the large amount of informa- tion that is acquired.
A schematic of the BART DACS is shown in fig- ure 3. The DACS is an integration of two different computer systems. The Tunnel Data Acquisition and Control (TDAC) computer system is used to acquire low transfer rate data from the tunnel and several pe- ripheral systems. This desktop computer system has a Motorola 68000 based CPU with 4 Megabytes of mem- ory. A computer-controlled 3-component hot-wire sys- tem and an electronic scanning pressure system have an interface with the TDAC, which has software that au- tonlatically checks each system and re-calibrates them for changes such as temperature drifts. The TDAC also drives a 2-axis traverse system which is used for pres- sure probe surveys or for the LDV seeding system, The TDAC also provides the real-time color graphic display of the flowfield parameters to monitor the progress of the test.
A larger minicomputer handles the on-line acquisi- tion and reduction of the LDV data , movement of the
LDV traverse system and post-processing of the flow- field data. The minicomputer will be linked to the com- putational fluid dynamics lab to enable efficient transfer of da ta for comparison with the colnputational results. The system is fully automated and many of the flowfield surveys are done under complete computer control.
~ a r v i n * recently discussed the role of experiment in the development of CFD methods. The pacing items for both the computational and experimental efforts were discussed and he also described the requirements for future wind tunnels used to verify CFD methods. The BART tunnel and its instrumentation and da ta systems just described meet the requirement of an idealized system as described by Marvin in reference 4.
E x p e r i m e n t a l Techniques a n d I n s t r u m e n t a t i o n
The test philosophy adopted for use in BART was again guided by the recommendations of the 1980 Stan- ford conference2 in that; ". . .it is better to do one exper- iment with extreme thoroughness, including redundant measurements with more than one type of instrument, than to provide a variety of experiments.. .". Therefore, only a few experiments that were selected with the guid- ance of the code developers, are scheduled for testing in the BART tunnel. Redundant measurement techniques are used to provide cross-checks on the accuracy of the various instrumentation systems.
The following sections describe the experimental techniques and instrumentation that are used in a typ- ical test. The examples that are provided come from a recent test of a 75' delta wings16 along with selected re- sults from tests involving fighter configurations a t high angles of attack. The 75' delta wing experiment is typ- ical of a code validation experiment in BART. The test consisted of several phases, each one utilizing a differ- ent measurement system to provide cross checks on ac- curacy. The test was conducted a t one angle of at- tack and results include surface flow visualization, off- body flow visualization, and detailed flowfield surveys for various Reynolds numbers. Flowfield surveys were obtained using three different techniques a t several lon- gitudinal stations with as many as 3300 da ta points a t each station.
The computational results presented in this pa- per were obtained utilizing the CFL3D code7, which uses a thin-layer formulation of the Navier-Stokes equa- tions. The nonlinear method uses second-order accurate upwind-biased spatial differencing and linearized, back- ward time differencing. A full approximation scheme multigrid algorithm is used to accelerate convergence to the steady state.
F low Visua l iza t ion
Flow visualizations from a variety of techniques are
used routinely in the facility. The particular method chosen depends on the information that is desired. At the very simplest, flow visualization is used to provide a quick look a t the overall characteristics of the flowfield. In other cases, flow visualization provides quantitative data for certain physical aspects of the flow for compar- ison with other instruments or calculations.
Surface flow visualization is used primarily to de- termine the position of separation lines on the model surface and to examine the effect of Reynolds number on the location of transition. A titanium dioxide ( T i 0 2 ) technique5 has been used extensively in BART. Surface flow patterns are obtained using a mixture of T i 0 2 and kerosene with a sniall amount of oleic acid added as an anti-coagulant. After the mixture is painted on the surface of the model, the airspeed in the test section is brought up to the test condition. The kerosene evap- orates and leaves the T i 0 2 deposited on the surface. The evaporation rate can be slowed down by substitut- ing mineral or baby oil for the kerosene.
The T i 0 2 technique provides the fine-grain detail that is necessary to identify features such as boundary layer separation and attachment lines on the surface of the model. Figures 4a and 4b show the experimental and computational surface flow streamlines(from refer- ence 6) generated by a 75' delta wing a t 20.5' angle of attack a t a Reynolds number of 0.5 million. The com- putational surface streamlines were calculated using the grid points closest to the surface and integrating parti- cle paths using *time. The line closest to the leading- edge is an attachment line, not the tertiary separation line seen in the experiment. The semispan location of both the secondary and tertiary separation lines are pre- dicted within 1% by the computational code.
The location where the boundary layer undergoes transition from laminar to turbulent is important for validating computational methods, especially Reynolds- Averaged Navier-Stokes codes which use turbulence models. Sublimating chemicals and other techniques can be used to determine the point where the bound- ary layer undergoes transition. For delta wing configu- rations the T i 0 2 will also identify the transition point because the secondary separation line will sweep further outboard toward the wing tip when transition occurs. During a test of the 75' delta wing6 the transition loca- tion was documented for Reynolds numbers between 0.5 and 2.0 million in increments of 250,000. The transition Reynolds number,
where st is the streamwise distance from the apex to where transition begins, ranged from 800,000 to 900,000. The boundary layer transitions a t the trailing edge of the wing a t a Reynolds number of approximately
1.0 million and the transition point moves forward to x/ L x 0.4 a t a Reynolds number of 2.0 million.
A scanning laser light sheet is used to obtain a rapid global look a t the flowfield and to determine areas of interest for later detailed investigation. The system is also used to determine if there are probe interference ef- fects on the flowfield. Snioke is introduced into the flow upstream of the honeycomb, and is illuminated with a thin sheet of laser light to provide a cross-sectional view of the flowfield. The smoke is produced by vaporizing propylene glycol a t a temperature of 380' F. The light sheet is generated using an argon-ion laser as the light source with a twin-mirrored galvanometer laser-light- sheet generator. The system was designed by ~hodes ' , et. al. a t NASA Langley. The system can be used in a variety of modes and provides either single or simul- taneous multiple light sheets. In addition, the system can rotate the sheets through 360' or provide a sin- gle scanning sheet with adjustable scan rates. Figure 5 shows a photograph of a typical laser light sheet flow vi- sualization over an advanced fighter configuration and illustrates the capability of the system to produce si- multaneous multiple light sheets.
P i t o t P r e s s u r e S u r v e y s
Pitot pressure measurements are probably the sim- plest flowfield measurements to make. The probe most commonly used in the BART is a boundary-layer probe approximately .024 inches wide by .013 inches high with a wall thickness of .005 inches. The pitot probe was chosen because its small size enables measurements to be made with high spatial resolution. However, when a probe is introduced into a conlplex flowfield, the ef- fect of the probe on the flowfield as well as the probe's own measuring characteristics must be examined. It was recognized that this probe would not be capable of measuring the true total pressure since the probe is not always aligned in the direction of the local velocity vector; hence it is referred to as pitot pressure and not total pressure. The probe was however, carefully cal- ibrated to document6 its sensitivity to flow angle and techniques have been developed which enable the com- putational codes to account for the characteristics of the probe when conlparing with experiment.
A computer-controlled probe-positioning system is used to traverse the probe through the flowfield. At the beginning of each survey and after the airspeed is brought to the test condition, the model surface is lo- cated through the use of an electrical probe fouling cir- cuit. This is done to lessen the uncertainty in measure- ment location due to the effect of the probe and model deflections under aerodynamic loading. Once the model surface is located, the flowfield survey is conducted un- der complete computer control.
Pressure data is measured using an electronic scan- ning pressure system with 1 psid transducers. The ac- curacy of these transducers is f .001 psi. This accuracy is a function of temperature (k.0005 psi/' F) ; therefore, the data acquisition system continuously monitors the freestream temperature and automatically performs a recalibration when the temperature changes more than 2' F. After stepping to each measurement location and pausing 0.5 seconds, the mean pressure is determined by averaging 255 samples acquired over a 1 second time interval. The pressure transducers are referenced to the total pressure downstream of the last anti-turbulence screen and therefore, measure the pitot pressure deficit from that location. Real-time color graphic displays of the pitot pressure flowfield are produced to ensure there are no lead/lag pressure errors induced by the movement of the probe through the flowfield.
Pitot pressure surveys for the 75' delta wing a t 20.5' angle of attack are shown in figure 6. Each survey sta- tion contains approximately 2,800 measurement points and took approximately 2 hours to acquire. The data acquisition software has the option of specifying an "em- bedded grid" in the flowfield just acquired. In a recent test for example, the region enclosing the secondary vor- tex was chosen for the embedded grid. The da ta acqui- sition system automatically surveys the specified region with a user-selectable grid size. The embedded grids for the secondary vortex typically contained approximately 1700 data points.
The flowfield over a complex aircraft configuration represents a much more difficult survey task than a flat delta wing due to the irregular surface. The da ta ac- quisition software handles this situation by generating a body-fitted grid. The first task is to "digitize" the surface of the model a t specified span stations with the probe and the fouling circuit. The DACS stores the model surface or "base-survey line" in memory and cre- ates a survey grid by stepping a constant vertical incre- ment from the previous survey line. An example of this technique is shown in figure 7, which shows the pitot pressures measured over an F-18 model a t 23' angle of attack. Digitizing the surface of the model takes ap- proximately one hour and represents a significant por- tion of the survey time a t a cross section. In this test, the grid size changed from station to station. The first survey plane near the front of the leading edge exten- sion (LEX) contains approximately 2,800 measurement locations and took approximately 2 hours to acquire. The last survey station just ahead of the twin-tails con- tains approximately 5,800 measurement locations and took approximately 8 hours to acquire (3 hours for sur- face digitization).
6-Hole P r o b e S u r v e y s
A hemispherical tipped, 0.125 inch diameter, 5-hole
pressure probe is used to measure the yaw angle, pitch angle, and total velocity in the flowfield. The probe is calibrated using equations derived from the potential flow about a sphere. The derivation of the calibration equations and the method of acquiring the calibration da ta are described in reference 9. The error in a , P, and q deduced from the 5-hole probe calibration data are presented in figures 8a, 8b, and 8c. The 5-hole probe acquires data using the same probe positioning system and pressure measurement technique described above. However, due to the relatively large size of the 5-hole probe, the embedded survey grid option was not used to measure the secondary vortex. The real-time color graphic display presents the crossflow velocity vectors with the color of the vector representing the longitudinal or streamwise component of velocity.
Results from a typical 5-hole probe survey over a 75' delta wing are shown in figure 9. The data was obtained a t x/L=0.7 a t a Reynolds number of 0.5 nil lion. This figure clearly shows the a~nount of detail that was obtained in the experimental effort. A typical survey plane contained approximately 3,300 measurement locations and took approximately 3 hours to acquire. The figure compares the measured cross flow velocity vectors with the results from the CFL3D Navier-Stokes code7. The figure shows the relative locations where the da ta was acquired experimentally and predicted computationally. The vectors show that the computational grid is clustered near the surface to better resolve the viscous effects in the boundary layer. The experimental grid is a cartesian-type which places equal emphasis on the entire flowfield. The figure also shows that the experimental survey grid has a spacing finer than the computation in the region above the primary vortex core. A comparison between the experimental and computational vorticity calculated from the velocity field a t x/L=0.9 is shown in figure 10. The computation predicts the general trends of the flowfield. The vortex strength in the primary vortex is underestimated by the code. A grid refinement study has shown that the computational grid needs to be denser in the region of the primary vortex to model accurately the strong gradients near the core. The computational method is presently being modified to provide an embedded grid in the region of the primary vortex core.
3 - C o m p o n e n t L a s e r D o p p l e r Ve loc imete r S u r v e y s
Many of the flowfields that are of interest for code validation experiments are complex and difficult to mea- sure and therefore, require state-of-the-art instrumen- tation. The LDV is capable of obtaining accurate veloc- ity measurements in flowfields with reverse flows, large shear gradients and velocity fluctuations.
BART is equipped with a dedicated, 3-component LDV system to enable the nonintrusive measurement of the flowfield. The LDV system is an orthogonal crossed- fringe configuration with the receive optics mounted 90' off-axis. The 514.5, 496.5 and 476.5 nanometer wave- lengths are used to measure the lateral (v), streamwise (u) , and vertical (w) velocity components, respectively. Bragg cells are used to provide directional measurement capability in all three velocity components. The sample volume is spherical in shape and has been calculated to be approximately 150-pm in diameter. A photograph of the laser beams crossing over the 75' swept delta wing model is shown in figure 11.
The optics and laser move as a unit on a travers- ing system that provides 1 meter of travel, with 10-pm resolution, in all three axes. The design of the traverse system provides flexibility in optical mounting and al- lows the optics to be remounted in forward scatter or 180' back scatter configuration should the test require. The traverse system is shown installed around the tun- nel test section in figure 12. A detailed description of the LDV system which includes its design and opera- tion, is presented by Meyers and Hepner in reference 10.
The flowfield is seeded with 0.8-pm polystyrene la- tex nlicrospheres which are fabricated a t NASA Lang- ley using the technique described by ~ichols" . The seed particles are suspended in a mixture of alcohol and water and are injected into the flow upstream of the honeycomb using an atomizing spray nozzle. The spray nozzle is mounted on a computer-controlled 2-axis traverse system which allows remote positioning of the spray nozzle. Typically several hundred to 4096 veloc- ity samples are obtained a t each measurement location in the flowfield. The actual number of samples and the acquisition rate depends on the particular location in the flowfield and the particle seeding rate.
The ability of a particle to track the streamlines in the flowfield, and thus the accuracy of the LDV, is re- lated to the size of the particle. Theoretical predictions of particle trajectories in swirling flows were reported by Dring and suo12. They concluded that the particle tra- jectory in a free vortex swirling flow is governed primar- ily by the Stokes nu111ber (St) and when the Stokes num- ber is less than 0.01, the particle will follow the circular streamlines of the free vortex. The 0.8-p~n particles used in BART have a density = 2.03727 slugs/ft3. The Stokes number for these particles, based on the radius and the swirl velocity a t the edge of the vor- tex core, is 0.007. The numerical procedure described by Dring was used to predict the particle trajectories for a free vortex with swirl velocities based on val- ues measured during the 75O flowfield investigatione. The predictions show that the particles used during
this test will follow the streamlines of the vortex with an accuracy better than 1%.
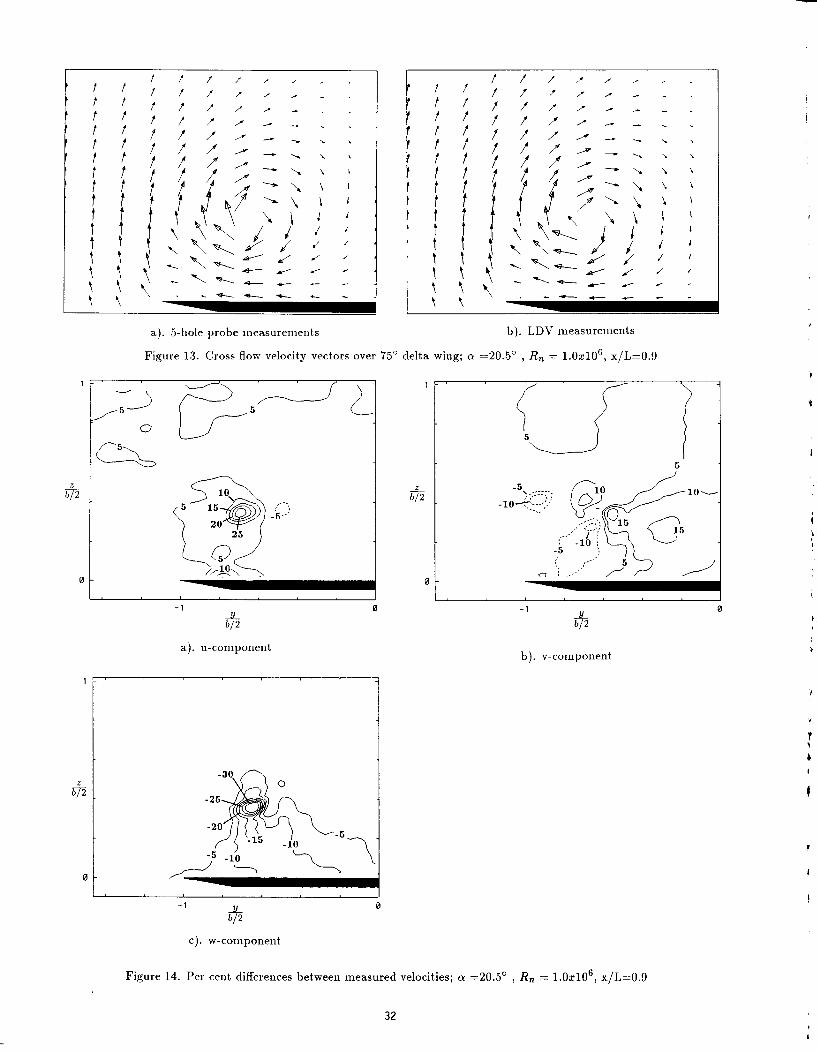
The LDV system has been used to provide redun- dant flow angle and velocity measurements for direct comparison with the 5-hole probe. This data helps to assess the measurement errors caused by introducing the probe into a vortical flowfield. LDV velocity sur- veys of the flowfield above the 75' delta wing were con- ducted a t selected chordwise stations and a t the same measurement locations that were obtained with the 5- hole probe. Figure 13 shows a comparison between the cross-flow velocity vectors that were obtained using the LDV and the 5-hole probe a t x/L=0.9 for a Reynolds number of 1.0 million. The per cent differences between the measured velocity components are presented in fig- ure 14 and were calculated assuming that the LDV mea- surements were the reference. The equation used to calculate the u-component error is shown below:
The figure shows tha t in regions where the velocity gradients are low, the 5-hole probe does a reasonable job of measuring the flowfield quantities (probe error is less than 5%). However, the 5-hole probe has errors ranging from 17% to 35% in the core of the vortex.
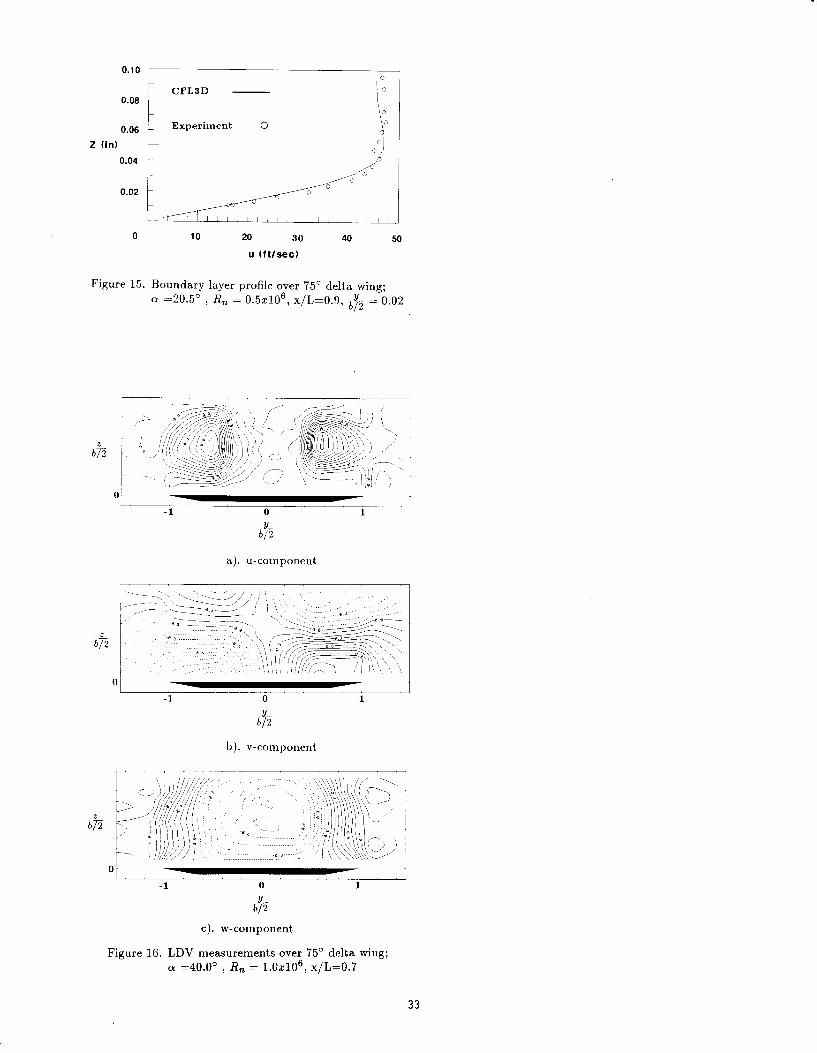
The LDV system has the ability to measure veloc- ities very close to the surface of the model for simple configurations. Figure 15 shows the boundary layer that was measured near the centerline of the 75' delta wing a t x/L=0.9 for a Reynolds number of 0.5 million. The data show that the boundary layer was laminar and was approximately 800-pm thick. The LDV was able to measure all three velocity components in the bound- ary layer within 250-pm of the surface and was able to provide a good definition of the profile.
The LDV system has also been used to measure the velocities in flowfields that contain burst vortices. When a vortex bursts, the axial velocity a t the core of the vortex abruptly stagnates followed by a rapid expansion of the core. After the expansion the flow changes to a highly-turbulent swirling state. Vortices can burst asymmetrically and induce substantial rolling moments. Figure 16 shows a flowfield survey over the 75' delta wing a t an angle of attack of 40' . The data were obtained a t an x/L=0.7 for a Reynolds number of 1 million. The figure shows that the vortices have burst asymmetrically. The axial velocity in the core of the vortex on the left contains a small region of reverse flow (figure 16a). The vortex on the right shows a retardation of the axial velocity in the core and little or no reverse flow.
C o n c l u d i n g R e m a r k s
Computational methods are playing an ever increas- ing role in the design of aircraft and are progressing toward the prediction of the three-dimensional flowfield about complex geometries a t high angles-of-attack. De- tailed experimental flowfield measurements are required to validate these methods and ensure that the codes are accurately modeling the physics of the fluid flow. With the guidelines provided by the 1980 Stanford con- ference, the Analytical Methods Branch of the NASA Langley Research Center set out to develop a facility dedicated to code validation and incorporate as many of the recommendations as possible into the tunnel op- erations and data acquisition. The Basic Aerodynani- ics Research Tunnel was acquired in November 1984 and dedicated to obtaining the highly-detailed flow- field data required for code validation. The facility has been equipped with state-of-the-art instrumenta- tion and data reduction computers.
Code validation experiments conducted in BART require a close interaction between the computational code developers and the experimentalists. This inter- action is required so that experiments are designed to address the specific needs of the computational method. These experiments typically have the following require- ments:
1. large quantities of highly-detailed flowfield data
2. state-of-the-art instrumentation systems
3. statement of measurement errors or uncertainty 4. redundant measurements using different instrumen-
tation techniques
The characteristics of BART meet these requirements. These characteristics also make the facility ideally suited for flowfield studies over complex aircraft con- figurations.
Refe rences
1. Kline, S. J.; Cantwell, B. J . ; and Lilley, G. M. Eds., The 1980-81 AFOSR-HTTM Stanford Confer- ence on Complex Turbulent Flows: Comparison of Computation and Experiment, Thermosciences Di- vision Mechanical Engineering Department, Stan-
ford University, Stanford, California, Volume I thru 111, 1981.
Bradshaw, P.; Cantwell, B. J.; Ferziger, J . H.; and Kline, S. J.: Experimental Data Needs for Computa- tional Fluid Dynamics - A Position Paper, Proceed- ing of the 1980-81 AFOSR-HTTM Stanford Confer- ence on Complex Turbulent Flows, Volume I, 1981.
N A S A CFD Validation Workshop, NASA Ames Re- search Center, July 14-16, 1987.
Marvin, Joseph G.: Wind Tunnel Requirements for Computational Fluid Dynamics Code Verification, NASA T M 100001, July 1987.
Kjelgaard, S. 0 . ; Sellers, W. L. 111; and Weston, R. P.: The Flowfield Over a 75 Degree Swept Delta Wing at 20.5 Degrees Angle-of-Attack, AIAA Paper 86-1775, June 1986.
Taylor S. L.; Kjelgaard, S. 0 . ; Weston, R. P.; Thomas, J . L.; and Sellers, W. L. 111: Experimen- tal and Computational Study of the Subsonic Flow About a 750 Swept Delta Wing, AIAA Paper 87- 2425, August 1987.
Thomas, J . L.; Taylor, S. L., and Anderson, W. K.: Navier-Stokes Computations of Vortical Flows Over Low Aspect Ratio Wings, AIAA Paper 86-0207, January, 1987.
Rhodes, David B.; Franke, John M.; Jones, Stephen B.; and Leighty, Bradley D.: A Twin-Mirrored Galvanometer Laser Light Sheet generator, NASA T M 100587, 1988.
Fearn, Richard L.and Weston, Robert P: Induced Velocity Field of a Jet in a C r o s s ~ o w , NASA T P 1087, May, 1978.
10. Meyers, James F. and Hepner, Timothy E.: Mea- surement of Leading Edge Vortices From a Delta Wing Using a Three Component Laser Velocimeter, AIAA-88-2024, May, 1988.
11. Nichols, Cecil E., Jr.: Preparation of Polystyrene Microspheres for Laser Velocimetry in Wind Tun- nels, NASA TM-89163, June 1987.
12. Dring, R. P. and Suo, M.: Particle Trajectories in Swirling Flows, Journal of Energy, Vol. 2, No. 4, July-August 1978.
Figure 1. Photograph of the Basic Aerodynamics Research Tunnel
0 0
G I V , .06
percent . 0 4
q, l b l f t
Figure 2. Variation in longitudinal turbulence intensity with q.
DISK I
SCANNING
I F A 100/200 1 ~a SCAWING
VOLTMETER
1 -
TRAVERSE SYSTEM
Figure 3. Schematic of the BART Data Acquisition System.