56
The Basics of Quality Data and Target Setting Early Childhood Outcomes (ECO) Center National Early Childhood TA Center (NECTAC) Workshop 1: December 5, 2009 1
| Date post: | 19-Dec-2015 |
| Category: |
Documents |
| View: | 214 times |
| Download: | 0 times |

The Basics of Quality Data and Target Setting
Early Childhood Outcomes (ECO) CenterNational Early Childhood TA Center
(NECTAC)
Workshop 1: December 5, 2009
1

By the end of the morning:
We hope you’ll be • Comfortable• Conversant• And immersed
In outcomes data!
Early Childhood Outcomes Center 2

Plan for today
• The first half of the morning we will review the results data provided in other EC PART reports
• The rest of the morning we will spend reviewing the sections of IDEA that refer to data
Early Childhood Outcomes Center 3

What we’ll cover
• The BASICS workshop includes:– A quick review of the basics–Reviewing hypothetical progress data
for accuracy–Considering data quality in target setting–Communicating to stakeholders about
baseline and targetsEarly Childhood Outcomes Center 4

“…To enable young children to be active and
successful participants during the early
childhood years and in the future in a variety
of settings – in their homes with their families,
in child care, in preschool or school
programs, and in the community.”
(from Early Childhood Outcomes Center,http://www.fpg.unc.edu/~eco/pdfs/eco_outcomes_4-13-05.pdf)
5
Goal of early intervention/early childhood special education

The child outcomes
A. Positive social emotional skills (including positive social relationships)
The intended meaning:Using social/emotional, language, cognitive (etc) skills to have positive social relationships
Early Childhood Outcomes Center 6

The child outcomes
B. Acquisition and use of knowledge and skills (including early language/ communication [and early literacy])
The intended meaning:Using cognitive, language, etc. skills to reason, problem solve, and understand their physical and social worlds
Early Childhood Outcomes Center 7
The child outcomes
C. Use of appropriate behaviors to meet their needs
The intended meaning:
Using motor, language, social, cognitive, etc. skills to successfully take care of themselves and their needs
Early Childhood Outcomes Center 8

OSEP reporting categories
Percentage of children who: a. Did not improve functioningb. Improved functioning, but not sufficient to move nearer
to functioning comparable to same-aged peers c. Improved functioning to a level nearer to same-aged
peers but did not reach itd. Improved functioning to reach a level comparable to
same-aged peerse. Maintained functioning at a level comparable to same-
aged peers
9

Key Concepts Related to Progress Categories
• Progress categories require 2 data points for each child,
• are based on growth trajectories,
• compare a child to him or herself over time, and also compare each child to age expectations
Early Childhood Outcomes Center10
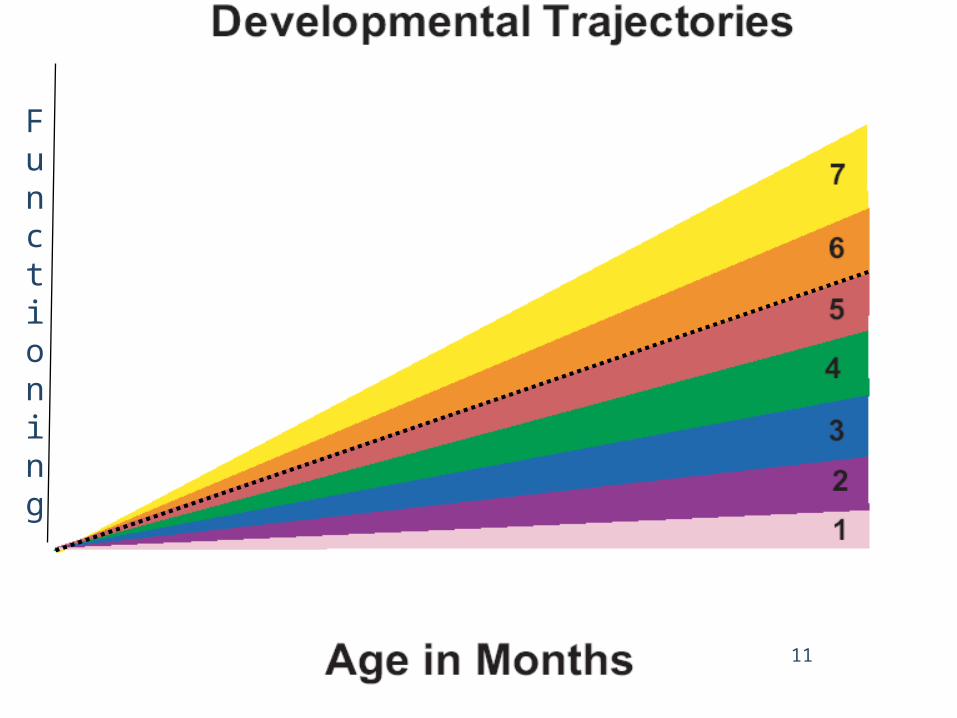
Functioning
11

Early Childhood Outcomes Center
12
The “a” category
a. Percent of Part C/preschool children who did not improve functioning
– Children who acquired no new skills or regressed during their time in the program
– Didn’t gain or use even one new skill– Children with degenerative conditions/
significant disabilities

Early Childhood Outcomes Center
13
Entry Exit

Early Childhood Outcomes Center
14
Entry Exit

Early Childhood Outcomes Center
15
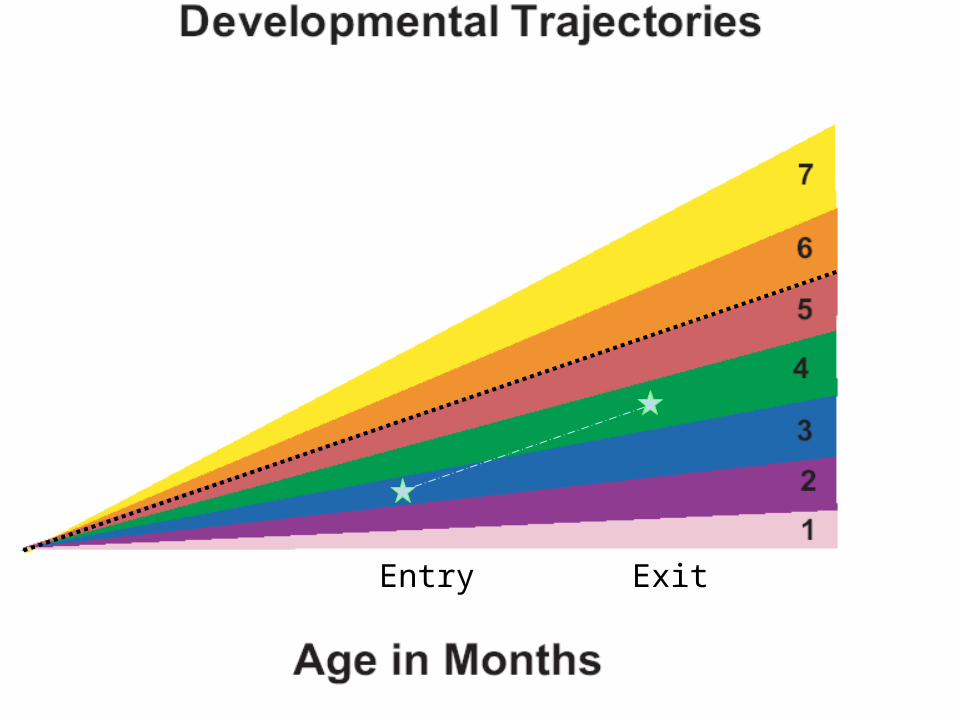
The “b” category
b. Percent of Part C/preschool children who improved functioning but not sufficient to move nearer to functioning comparable to same-aged peers – Children who acquired new skills but continued to
grow at the same rate throughout their time in the program
– Gained and used new skills but did not increase their rate of growth or change their growth trajectories while in services

Early Childhood Outcomes Center
16
Entry Exit
Early Childhood Outcomes Center
17
Entry Exit

Early Childhood Outcomes Center
18
Entry Exit

Early Childhood Outcomes Center
19
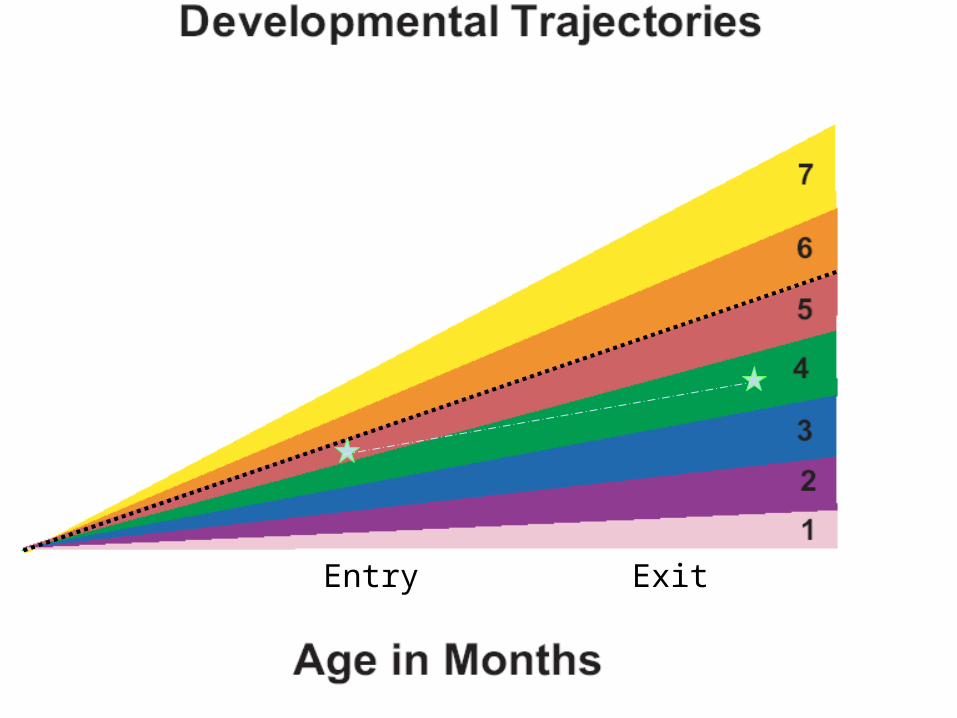
The “c” category
c. Percent of Part C/preschool children who improved functioning to a level nearer to same-aged peers but did not reach it – Children who acquired new skills but accelerated their
rate of growth during their time in the program– Made progress toward catching up with same aged
peers but were still functioning below age expectations when they left the program
– Changed their growth trajectories --“narrowed the gap”
Early Childhood Outcomes Center
20
Entry Exit

Early Childhood Outcomes Center
21
The “d” category
d. Percent of preschool children who improved functioning to reach a level comparable to same-aged peers – Children who were functioning below age expectations
when they entered the program but were functioning at age expectations when they left
– Started out below age expectations, but caught up while in services

Early Childhood Outcomes Center
22
Entry Exit

Early Childhood Outcomes Center
23
The “e” category
e. Percent of Part C/preschool children who maintained functioning at a level comparable to same-aged peers – Children who were functioning at age
expectations when they entered the program and were functioning at age expectations when they left
– Entered the program at age expectations and were still up with age expectations at exit

Early Childhood Outcomes Center
24
Entry Exit

Early Childhood Outcomes Center
25
Entry Exit

Summary Statement Data
• Required Summary Statement 1:
Of those children who entered or exited the program below age expectations in each Outcome, the percent who substantially increased their rate of growth by the time they exited the program.
• Required Summary Statement 2:
The percent of children who were functioning within age expectations in each Outcome by the time they exited the program.
26

Summary Statement 1
27
Prog cat
# %
a 17 2b 106 14c 67 9d 169 22e 425 54
359 (a, b, c, and d) or 46% of the children entered or exited the program functioning below age expectations
425 (e) or 54% of the children entered and exited functioning at age expectations

% of Children who made greater than expected progress
28
Prog cat
# %
a 17 2
b 106 14
c 67 9
d 169 22
e 425 54
236 (c and d) of the 359 (a, b, c, and d) changed their growth trajectories (made greater than expected progress)
236359
= 66%

% who Exited at Age Expectations
29
Prog cat
# %
a 17 2b 106 14c 67 9d 169 22e 425 54
total 784169 + 425 784
= 76%
22% of the children reached age expectations by exit and 54% of the children entered and exited at age expectations

• Evidence, Inference, Action!• Results, Implications, Action!• Data, Interpretation, Action!• Findings, Inference, Action!
Early Childhood Outcomes Center 30
What the data can tell us:

31
EIA, RIA, DIA, FIA!
• Analysis yields–Evidence, results, data, or findings that
allow you to make– Inferences or interpretations that lead to–Actions to improve the system.

The Data, Evidence, Results
Early Childhood Outcomes Center 32
Usually they are what they are, not debatable

33
Inference, Interpretation
• But what do the data mean?• Good news? Bad news? • Is debatable -- even reasonable people can
reach different conclusions• May be a question of the quality of the data• To reach an inference, sometimes we
analyze data in other ways (ask for more evidence)

Early Childhood Outcomes Center 34

35
Action
• Given the interpretation of the evidence, what should be done?
• Recommendations or action steps• Action can be debatable – and often is• Again, sometimes the action is to
improve the quality of the data

Early Childhood Outcomes Center 36

Let’s begin the workshop
• In your packets:– Definitions of the progress categories– Summary Statements with explanations– Note taking chart with 12 local programs listed – Overall State Outcomes Data for the State of
Euphoria
Early Childhood Outcomes Center 37

Reviewing Program Data
• Do we trust the state baseline?• Looking at anomalies or outliers in the local
program data to determine:– Is it poor quality (inaccurate) data?– Are there real differences among the
children participating in the programs?– Are some programs really more or less
effective than others?Early Childhood Outcomes Center 38

Reviewing Progress and Summary Statement Data by Program
• Are there any programs that have funny looking data?
• Make notes on the note taking sheet, e.g.– Percentages look too high or too low
compared to the rest of the state– Percentages are in a pattern unlike the rest of
the state
Early Childhood Outcomes Center 39
What other data would you need?
• To decide:– Is it poor quality (inaccurate) data?– Are there real differences among the
children participating in the programs?– Are some programs really more or less
effective than others?
Early Childhood Outcomes Center 40

Let’s look at Missing Data
• What did you find?• What inferences would you
make about local programs?
Early Childhood Outcomes Center 41

Comparing Entry Data
• What differences in entry data can you see across local programs?
• How might these differences be interpreted?
Early Childhood Outcomes Center 42

Comparing Disability Category Data
• What differences in Disability Category data can you see across local programs?
• How might these differences be interpreted?
Early Childhood Outcomes Center 43

Comparing Race/Ethnicity Data
• What differences in Race/Ethnicity data can you see across local programs?
• How might these differences be interpreted?
Early Childhood Outcomes Center 44
• Which programs are the outliers?• Do you have hypotheses about whether
program differences are due to bad data, different populations of children, or real differences in the effectiveness of services
• What else do you need to know?
Early Childhood Outcomes Center 45

Monitoring Notes
• What inferences would you make from the monitoring data?
• Which program data, if any, would you remove to get a more accurate estimate of your baseline?
Early Childhood Outcomes Center 46

Conclusions about Baseline Data
• How does the review of the data help you determine the accuracy of your baseline data?
• Do you think your baseline data is accurate? Overestimated? Or underestimated for each of the Summary Statements for each of the Outcomes?
Early Childhood Outcomes Center 47

Recalculated State Data
• Programs 1, 6, and 7 were removed from this analysis to see what the state data would look like with only the “cleanest” data included
• How does this data compare to your baseline?
• What are the implications for target setting?Early Childhood Outcomes Center 48

Early Childhood Outcomes Center 49

Target Setting
• What targets would you set for the State of Euphoria?
• What is your rationale?
Early Childhood Outcomes Center 50

Early Childhood Outcomes Center 51
The children aren’t making progress and the press are asking questions. Stakeholders, we’re looking for a scapegoat
What are key points you’d want to include in an explanation of your baseline and target data?
Think about . . .
• How you will explain the outcomes data to the public and the media?
• What are key messages you want to communicate?
• What additional actions would you take to improve the data?
Early Childhood Outcomes Center 52

ECO/NECTAC Resourcesre: target setting
• Summary statement calculator -- http://www.fpg.unc.edu/~eco/pages/summary.cfm
• National Conference calls http://www.fpg.unc.edu/~eco/pages/archive.cfm – Conference Call on Summary Statements - June 9, 2009– Conference Call on Target Setting - June 16, 2009– Conference Call on Updating SPP/APR Indicators – August
13, 2009• Suggested format for Feb 2010 SPP/APR:
http://www.fpg.unc.edu/~eco/pages/fed_req.cfm#UpdatingSPPIndicators
53
ECO/NECTAC Resourcesre: target setting
• Individualized TA with states:– Supporting states in preparing for stakeholder discussions on target
setting – Supporting states in looking at their data in various ways
Resources: • Looking at State data:
http://www.fpg.unc.edu/~eco/assets/ppt/4-statedata.ppt • Playing with data:
http://www.fpg.unc.edu/~eco/assets/xls/SummaryStatements-PLAY.xls
54

Baseline and Targets: Typical Timelines
55
In Feb, 2010
Actual data= baseline
Targets for FFY 2009
Targets for FFY 2010
In Feb, 2011
Actual data Compared to FFY 2009 target
Progress or slippage; met or did not meet target
In Feb, 2012
Actual data Compared to FFY2010 target
Progress or slippage; met or did not meet target

OR Baseline and Target can be Revised in Feb, 2011
56
In Feb, 2010
Actual data= baseline
Targets for FFY 2009
Targets for FFY 2010
In Feb, 2011
Actual data= revised baseline
Compared to FFY2009 target
Progress or slippage; met or did not meet target
Revise Target for FFY 2010
In Feb, 2012
Actual data Compared to revised FFY2010 target
Progress or slippage; met or did not meet target


