CONS/1011-6 NASA TM-73761 (NASA-TM-73761) BASELINE TESTS OF THE BATTRONIC MINIVAN ELECTRIC DELIVERY VAN (NASA) 52 p HC A04/MF A01 CSCI 13F ... ... ..... ... .. . ... . . BASELINE TESTS OF G3/ 435- N78-17940 Unclas 04465 THE BATTRONIC MINIVAN ELECTRIC DELIVERY VAN Miles 0. Dustin, Richard F. Soltis, John M. Bozek and Edward A. Maslowski National Aeronautics and Space Administration Lewis Research Center Cleveland, Ohio 44135 December 1977 Prepared for DEPARTMENT OF ENERGY Division of Transportation Energy Conservation Under Interagency Agreement EC-77-A-31-1011 https://ntrs.nasa.gov/search.jsp?R=19780009997 2018-07-08T22:07:53+00:00Z
Transcript
CONS1011-6 NASA TM-73761
(NASA-TM-73761) BASELINE TESTS OF THE BATTRONIC MINIVAN ELECTRIC DELIVERY VAN (NASA) 52 p HC A04MF A01 CSCI 13F
BASELINE TESTS OF G3 435-
N78-17940
Unclas 04465
THE BATTRONIC MINIVAN ELECTRIC DELIVERY VAN
Miles 0 Dustin Richard F Soltis John M Bozek and Edward A Maslowski National Aeronautics and Space Administration Lewis Research Center Cleveland Ohio 44135
December 1977
Prepared for
DEPARTMENT OF ENERGY Division of Transportation Energy Conservation Under Interagency Agreement EC-77-A-31-1011
This report was prepared to document work sponsored by
the United States Government Neither the United States
nor its agent the United States Energy Research and
Development Administration nor any Federal employees
nor any of their contractors subcontractors or their
employees makes any warranty express or implied or
assumes any legal liability or responsibility for the
accuracy completeness or usefulness of any infornashy
tion apparatus product or process disclosed or
represents that its use would not infringe privately
owned rights
1 Report No 2 Government Accesion No 3 Recipients Catalog No
NASA TM-73761
4 Title and Subtitle 5 Report Date
BASELINE TESTS OF THE BATTRONIC MINIVAN ELECTRIC December 1977 6 Performing Organization CodeDELIVERY VAN
7 Author(s) 8 Performing Organization Report No
Miles 0 Dustin Richard F Soltis John M Bozek and E-9483
Edward A Maslowski 10 Work Unit No 9 Performing Organization Name and Address
National Aeronautics and Space Adnimstration 11 f or Grant No
Lewis Research Center Cleveland Ohio 44135 13 Type of Report and Period Covered
12 Sponsoring Agency Name and Address Techmcal Memorandum Department of Energy Division of Transportation Energy Conservation 14 Sponsoring Agency CreReport No
Washington DC 20545 CONS1011-6 15 Supplementary Notes
Prepared under Interagency Agreement EC-77-A-31-1011
16 Abstract The Battromc Minivan an electric passenger vehicle manufactured by the Battromc Truck Corp
a Division of Boyertown Auto Body Works was tested at the Dynamic Science Test Track in
Phoenix Arizona between February 5 and March 6 1977 The tests are part of an Energy
Research and Development Administration (ERDA) project to charactenze the state-of-the-art of
electric vehicles The Battronic vehicle performance test results are presented in this report
17 Key Words (Suggested by Author(s)) 18 Distribution Statement Electric vehicle Unclassified - unlinted
Car STAR Category 85 Test and evaluation DOE Category UC-96
Battery
19 Secuity Cassi (of thisreport) 20 Security Classif (of this page) 21 No of Pages 22 Price
Unclassified Unclassified 50 A03
For sale by the National Technical Information Service Springfield Virginia 22161
The Electric and Hybrid Vehicle Program
was conducted under the guidance of the
then Energy Research and Development
Administration (ERDA) now part of the
Department of Energy
BASELINE TESTS OF THE
BATTRONIC MINIVAN ELECTRIC DELIVERY VAN
Miles 0 Dustin Richard F Solts John M Bozek
and Edward A Maslowski
Lewis Research Center
SUMMARY
The Battronic Minivan an electric passenger vehiclemanufactured by the Battronic Truck Corp a Division ofBoyertown Auto Body Works was tested at the Dynamic SciencePest Track in Phoenix Arizona between February 5 andMarch 6 1977 The tests are part of an Energy Research andDevelopment Administration (ERDA) project to characterizethe state-of-tne-art of electric vehicles The Battronicvehicle performance test results are presented in thisreport
The Minivan is a two-passenger van with sliding sideentry doors and a large rear door It is powered by atwo-module 112-volt semi-industrial battery through an SCRdirect-current (DC) chopper controller witn bypasscontactors The motor is a 31-kilowatt (42-hp) series-woundDC traction motor The braking system is a conventionalhydraulic braking system Regenerative braking was notprovided
All tests were run at the gross vehicle weight of 2860kilograms (6300 lbm) The results of the tests are asfollows
Test condition Type of test(constant speed ordriving schedule) Range Road Road energy Indicated
kmhmph km kW kWhmllek energy consumptionmile power M7km Mmkhml
Low gear
40 25 1057 657 59 053 024 155 069
60 37 823 512 129 77 35 219 98
High gear
72 45 540 336 183 091 041 321 143
84 52 354 220 shy 403 180
B 795 494 ---- ---- 245 110
C 637 396 ---- ---- - - 292 130
The Minivan was able to accelerate from 0 to 32 kilometersper hour (0 to 20 mph) in 7 seconds and from 0 to 48Kilometers per hour (0 to 30 mph) in 11 seconds Thegradeability limit was 50 percent for 1 to 2 seconds onlyThe duration was limited because the 400-ampere motor protection fuse failed due to current overload
The efficiency of the battery charger was measured andfound to be 85 to 95 percent over a complete charge cycle
INTRODUCTION
The vehicle tests and the data presented in this reportare in support of Public Law 94-413 enacted by Congress onSeptember 17 1976 The law requires the Energy Researchand Development Administration (ERDA) to develop datacharacterizing the state-of-the-art of electric and hybridvehicles The data so developed are to serve as a baseline(1) to compare improvements in electric and hybrid vehicletechnologies (2) to assist in establishing performancestandards for electric and hybrid vehicles and (3) to helpguide future research and development activities
The National Aeronautics and Space Administration(NASA) under the direction of the Electric and HybridResearch Development and Demonstration Office of the Division of Transportation Energy Conservation of ERDA hasconducted track tests of electric vehicles to measure theirperformance characteristics and vehicle componentefficiencies The tests were conducted according to ERDAElectric and Hybrid Vehicle Test and Evaluation Procedure described in appendix E of reference 1 This procedure isbased on the Society of Automotive Engineers (SAE) J227aprocedure (ref 2) Seventeen electric vehicles have beentested under this phase of the program 12 by NASA 4 by MERADCOM and 1 by the Canadian government
-The assistance and cooperation of Robert Dare fromBattronic Truck Corp the vehicle manufacturer are greatlyappreciated The Energy Research and DevelopmentAdministration provided funding support and guidance duringthis project
US customary units were used in the collection andreduction of data The units were converted to theInternational System of Units for presentation in thisreport US customary units are presented in parenthesesThe parameters symbols units and unit abbreviations usedin this report are listed here for the convenience of thereader
2
ORIGINAL PAGE ISOF POOR QUALTY
Parameter Symbol SI units US customary units
Unit Abbrevia- Unit Abbreviashytion tion
Acceleration a meter per scond squared ms mile per hour per second mphs2 22
m square foot square inch ft inArea --- square meter
Energy --shy megajoule M3 kilowatt hour kWh Energy consumption E megajoule per kilometer 4km kilowatt hour per mile kWhmile Energy economy --shy megajoule per kilometer Makm kilowatt hour per mile kWhmile
Force P newton N pound force lbf
Integrated current --shy ampere hour Ah ampere hour Ah Length meter m inch foot mile in ft Mass weight W kilogram kg pound mass ibm Power P kilowatt kw horsepower hp Pressure --shy kilopascal kPa pound per square inch psi
Range --shy kilometer km mile ---
Specific energy --shy megajoule per kilogram Jkg watt hour per pound WhIbm Specific power --shy kilowatt per kilogram kWkg kilowatt per pound kWlbm Speed
Volume
V
--shy
kilometer per hour
cubic meter
kmh m 3
mile per hour cubic inch cubic foot
mph in
3 ft 3
OBJECTIVES
The objectives of the tests were to measure vehiclemaximum speed range at constant speed range overstop-and-go driving schedules maximum accelerationgradeabilaty gradeabilty limit road energy consumptionroad power indicated energy consumption brakingcapability and battery charger efficiency for the BattronacMinivan electric delivery van
TEST VEHICLE DESCRIPTION
The Battronic Minivan is a battery-powered electrictruck with a curb weight of approximately 2600 kilograms(5730 lbm) and a payload capability of 363 kilograms (800ibm) It is a two-passenger van with a sliding cab door oneach side (fig 1) Each cab door has a sliding sashwindow The vehicle nas a large single rear door whichprovides easy access to the rear compartment (fig 2) Acomplete description of the vehicle is given in reference 3More-detailed characteristics of the vehicle are presentedin appendix A and below
The vehicle is powered by a 313-kilowatt (42-hp)series-wound direct-current (DC) traction motor withthermal protection The controller located in the front ofthe vehicle (fig 3) is a General Electiric reactance
3
solid-state SCR DC chopper with bypass contactors It hasfused protection for the control circuits Field weakeningand automatic current limiting are also provided by thecontroller
The battery of the Battrncid Minivan is asemi-industrial lead-acid battery It is rated at 112volts and is assembled into two modules one located on eachside of the rear compartment Figure 4 depicts the batterymodule located on the passenger side of the vehicle Thetwo modules are connected electrically in series wheninstalled in the vehicle An on-board battery charger isprovided to charge these modules It may be connected to either 115 or 230 volts alternating current (AC) and isequipped with an automatic timer
An accessory 12-volt battery is furnished to power thelights horn radio etc This battery is chargedcontinuously from the main batteries through a DC-to-DCconverter
Driveline gear ratio is controlled by a transfer-caseshift lever The transfer case has two ratios and can beshifted only when the vehicle is standing still The highgear position is used for highway driving the low gearposition is used for normal city driving and hill climbingA neutral position is provided to disengage the motor andgearbox
A directional control lever is used to control thedirection of current flow to the field of the motor Thisallows the vehicle to move forward or in reverse With thislever in the neutral position no current can flow to thefield circuit and operation of the vehicle is prevented
To place the vehicle in motion requires releasing thehand brakemov-ing the shift lever to the proper gearplacing the directional control lever in forward or reverseand depressing the accelerator pedal Removing pressurefrom the accelerator pedal shuts off all power to the motorThe brakes are conventional hydraulic drum brakes Noregenerative braking is provided
INSTRUMENTATION
The Battronic Minivan was instrumented to measurevehicle speed and range battery voltage and current motorvoltage and current temperatures of the motor frame andbattery case and battery charger power Most of thesemeasurements were telemetered to a central instrumentationfacility where they were recorded on magnetic tape The
4
telemetry system is described in appendix B
A schematic diagram of the electric propulsion systemwith the instrumentation sensors is shown in figure 5 ANucleus Corporation Model NC-7 precision speedometer (fifthwheel) was used to measure vehicle speed and distancetraveled Auxiliary equipment used with the fifth wheelincluded a Model ERP-Xl electronic pulser for distancemeasurement a Model NC-PTE pulse totalizer a Model ESSEexpanded-scale speedometer and a programmable digitalattenuator The fifth wheel was calibrated before each testby rotating it on a constant-speed fifth-wheel calibratordrum mounted on the shaft of a synchronous AC motor Theaccuracy of the distance and velocity readings was within+05 percent of the readings Distance and velocity wererecorded on magnetic tape through the telemetry system
The integrated battery current was measured for thebattery pack with a current shunt and an on-board currentintegrator It was recorded manually after each test Thismeasurement provides the ampere-hours delivered by thebattery pack The current integrator is a Model SHR-C3Curtis current integrator and was calibrated periodically towithin +1 percent of reading
Motor current motor voltage and motor temperaturewere measured to determine motor performance A 1000-amperecurrent shunt was used in an attempt to measure motor current Excessive noise in the motor current signal madetne measurement useless One thermocouple was placed oneach battery module to monitor battery temperature Thesemeasurements were telemetered and recorded on magnetic tapeBattery electrolyte temperatures and specific gravities weremeasured manually before and after the tests
Power for the fifth wheel and current integrator wasprovided from an automotive 12-volt starting lighting andignition (SLI) battery A Tripp Lite 500-watt DCACinverter provided the AC power The power for the telemetrysystem was obtained from the battery power pack described inappendix B
All instruments were calibrated periodically Theintegrators and strip-chart recorders were calibrated with aHewlett-Packard Model 6920 B meter calibrator which has anaccuracy of 02 percent of reading and a usable range of001 to 1000 volts
The current and voltage into the battery and the energy into the battery charger were measured while tne battery wasbeing recharged after each test The current and voltage to
5
the battery were recorded on a Honeywell 195 Electroniktwo-channel strip-chart recorder The current measurementused a 500-ampere current shunt in all the test seriesexcept one In that series a laboratory wattmeter withHall-effect current sensors manufactured by OhioSemitronics Inc was used to measure charger efficiencyThe energy delivered to the charger was measured with aGeneral Electric 1-50A single-phase residentialkilowatt-hour meter
TEST PROCEDURES
The tests described in this report were performed atthe Dynamic Science Test Track a two-lane 322-kilometer(2-mile) asphalt track located in Phoenix Arizona Acomplete description of the track is given in appendix CWhen the vehicle was delivered to the test track thepretest checks described in appendix D were conducted Thefirst test was a formal shakedown to familiarize the driverwith the operating characteristics of the vehicle to checkout all instrumentation systems and to determine thevehicles maximum speed (appendix D) All tests were run inaccordance with ERDA Electric and Hybrid Vehicle Test AndEvaluation Procedure ERDA-EHV-TEP (appendix E of ref 1) atthe gross weight of the vehicle 2860 kilograms (6300 lbm)
Range Tests at Constant Speed
The vehicle speed for the highest constant-speed rangetest was determined during checkout tests of the vehicleIt was specifiedas 95 percent of the minimum speed thevehicle could maintain on the test track when it wastraveling at full power This speed was 84 kilometers perhour (52 mph) in high gear and 595 kilometers per hour (37mph) in low gear for the Battronic Minivan
Range tests at constant speeds were run for theBattronic Minivan in both low and high gear The testspeeds were 40 and 60 kilometers per hour (25 and 37 mph) inlow gear and 72 and 84 kilometers per hour (45 and 52 mph)in high gear The speed was held constant within +16kilometers per hour (I mph) and the test was terminatedwhen the vehicle could no longer maintain 95 percent of thetest speed The range tests were run at least twice at eachspeed
Range Tests under Driving Schedules
Both the 32-kilometer-per-hour (20-mph) schedule B andthe 48-kilometer-per-hour (30-mph) schedule C stop-and-godriving cycles shown in figure 6 were run with this
6
vehicle A complete description of the cycle tests is givenin appendix E of reference 1 A special instrument calleda cycle timer was developed at the Lewis Research Center toassist in accurately running these tests Details of thecycle timer are given in appendix D The cycle tests wereterminated when the test speed could not be attained in thetime required under maximum acceleration
Acceleration and Coast-Down Tests
The maximum acceleration of the vehicle was measured ona level road with tne battery fully charged and 40 and 80percent discharged Four runs two in each direction wereconducted at each of these three states of charge with thevehicle in high gear In low gear the tests were conductedwith the battery 40 and 80 percent discharged Depth ofdischarge was determined from the number of ampere-hoursremoved from the batteries Acceleration runs were made onthe southern straight section of the track and coast-downson the northern straight section (appendix C fig C-1)Coast-down data were taken after the acceleration test withthe transmission in neutral and with fully charged batteriesin order to start the coast-down run from the maximumattainable vehicle speed
Braking Tests
Braking tests on the vehicle were conducted
(1) fo determine the minimum stopping distance in astraight-line emergency stop
(2) To determine the controllability of the vehiclewhile braking in a turn on both wet and drypavement
(3) To determine the brake recovery after the vehiclewas driven through 015 meter (6 in) of water at 8kilometers per hour (5 mph) for 2 minutes
(4) To determine the parking brake effectiveness on anincline
Instrumentation used during the braking test included afifth wheel programmed to determine stopping distance abrake pedal force transducer and a decelerometer Acomplete description of the braking tests is given in thediscussion of test results and in appendix E of reference 1
7
Tractive Force Tests
The maximum grade-climbing capability of the testvehicle can be determined from tractive force tests bytowing a second vehicle The driver of the towed vehicleby applying the footbrake maintains a speed of about 3kilometers per hour (2 mph) while the test vehicle is beingdriven with a wide-open throttle The force is measured bya 13 000-newton (3000-lbf) load cell attached to the tow chain between the vehicles The tests are normally run with the batteries fully charged and 40 and 80 percentdischarged However a problem arose each time an attemptwas made to tow the second vehicle with the BattronicMinivan The motor drew such a large amount of current toget-the vehicles moving that the 400-ampere fuse in the mainbattery circuit kept blowing out Therefore these testscould not be completed The initial thrust of the vehicleprior to opening of the fuse was calculated to be equivalentto a gradeability limit in excess of 50 percent
Charger Efficiency Tests
Two methods were used to determine charger efficiencyas a function of charge time In the first method aresidential kilowatt-hour meter was used to measure inputpower to the charger by counting rotations of the disk andapplying the meter manufacturers calibration factor Thecharger output power was determined by multiplying theaverage value of current by the average value of voltageResidential kilowatt-hour meters are calibrated forsinusoidal waves only The error in measuring input powerdepends on the wave shape and may be as high as 5 percentThe method of determining output power is correct only wheneither the voltage or the current is a constant during eachcharging pulse The battery voltage does change during eachcharging pulse which introduces a small error The currentshunts used to measure current are inaccurate for pulsingcurrent The error depends on frequency and wave shape andmay exceed 10 percent
In the other method used for determining chargerefficiency a 50-kilowatt power meter was used on both theinput and output of the charger and a Hall-effect currentprobe was used for current measurements To minimizeerrors the same meter and current probe were used for boththe input measurement and the output measurement TheaVerage power measured was about 4 percent of full scale The influence of these inaccuracies on the determination ofcharger efficiency is discussed in the component section ofthis report
8
TEST RESULTS
Range
The data collected from all the range tests aresummarized in taole I Shown in the table are the testdate the type of test the environmental conditions therange test results the ampere-hours into and out of thebattery and the energy into the charger These data wereused to determine vehicle range battery efficiency andenergy consumption
During most of the test period the winds were variableand gusty Even though the wind was less than 16 kilometersper hour (10 mph) on several occasions it was blowing indifferent directions and at different velocities at twopositions on the track There was no indication that thisvariation in wind velocity significantly affected the range or other test results as long as the measured winds wereless than about 16 kilometers per hour
The maximum speed of the vehicle was measured duringthe checkout tests It is defined as the average speed thatcould be maintained on the track under full power Themeasured maximum speed was 90 kilometers per hour (56 mph)for this vehicle This differs from the maximum speed usedin the range tests
Two 40-kilometer-per-hour (25-mph) three60-kilometer-per-hour (37-mpn) two schedule B and twoschedule C tests were run in low gear on the BattronacMinivan In high gear three 72-kilometer-per-hour (45-mph)and two 84-kilometer-per-hour (52-mph) constant-speed rangetests were run The constant-speed test results are plottedin figure 7 Some tests in table I were not included in thedata averaging because winds exceeding the specificationsoccurred during these tests
Maximum Acceleration
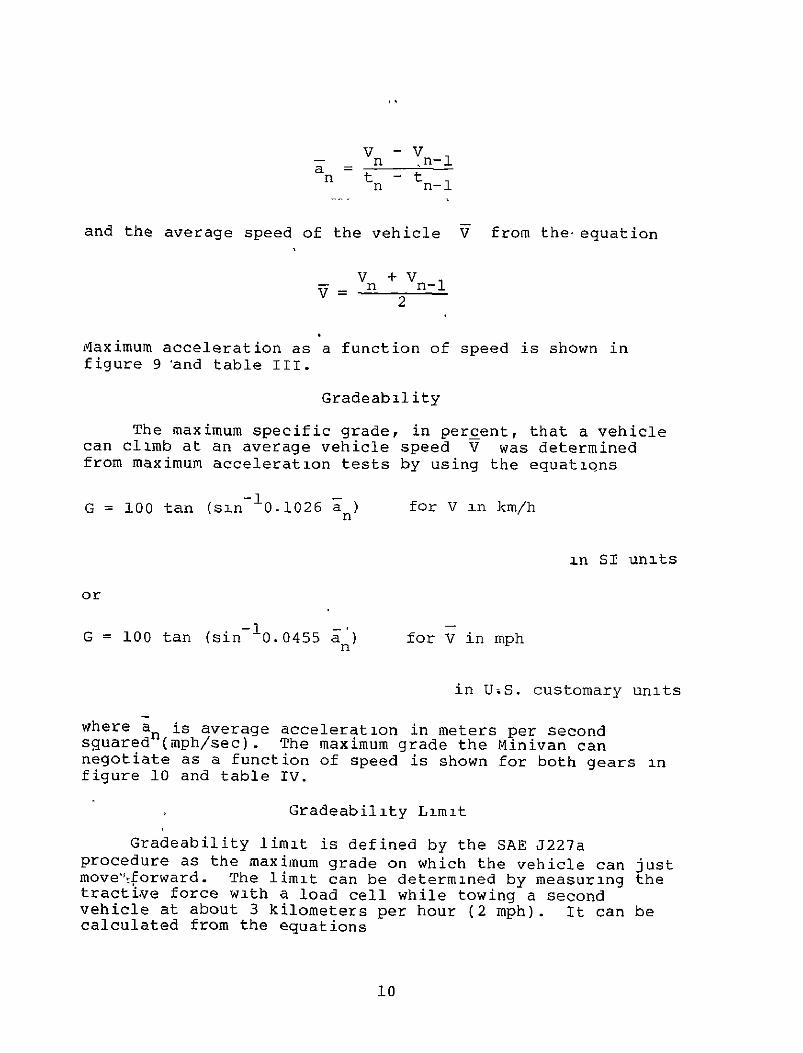
The maximum acceleration of the vehicle was determinedwith the batteries fully charged and 40 and 80 percentdischarged Since the transmission had both a high gear anda low gear in the forward direction the acceleration testswere run in both gears The results of these tests areshown in figure 8(a) for the tests run in high gear and infigure 8(b) for low gear These data are tabulated in tableII The average acceleration an was calculated for thetime period t_1 to tn where the vehicle speed increased from Vn-l to Vn from the equation
9
V -V n-l nn - Ittn tn-1
and the average speed of the vehicle V from the equation
V +VV n+ n-i 2
Maximum acceleration as a function of speed is shown in
figure 9 and table III
Gradeability
The maximum specific grade in percent that a vehicle can climb at an average vehicle speed V was determinedfrom maximum acceleration tests by using the equatiqns
G = 100 tan (sin 01026 a for V in kmh
in S1 units
or
G = 100 tan (sin 00455 an) for V in mph
in US customary units
where an is average acceleration in meters per secondsquared (rnphsec) The maximum grade the Minivan cannegotiate as a function of speed is shown for both gears infigure 10 and table IV
Gradeability Limit
Gradeability limit is defined by the SAE J227aprocedure as the maximum grade on which the vehicle can justmove forward The limit can be determined by measuring thetracti-ve force with a load cell while towing a secondvehicle at about 3 kilometers per hour (2 mph) It can becalculated from the equations
10
Gradeability limit in percent = 100 tan (sin-i 98 w)
in SI units
or
Gradeability limit in percent = 100 tan (s n-1 )
in US customary units
where
P tractive force N (lbf)
W gross vehicle weight kg (ibm)
The tractive force that the Battronic Minivan wascapanle of exerting for the required speed and time(appendix E of ref 1) was not attained because the currentdrawn from the battery was so large that it kept blowing outthe main battery fuse However the initial thrust of thevehicle recorded a tractive force of nearly full scale (13000 o (3000 lbf)) before the fuse blew The resultantgradeability should thus be in excess of 50 percent Sincethis is only the initial force exerted for very shortduration the gradeability may decrease over a longer periodof time Results given in reference 4 indicate a maximumgradeability capability of over 31 percent when the vehiclewas driven for 18 meters (60 ft) at a speed of 8 kilometersper hour (5 mph)
Road Energy Consumption
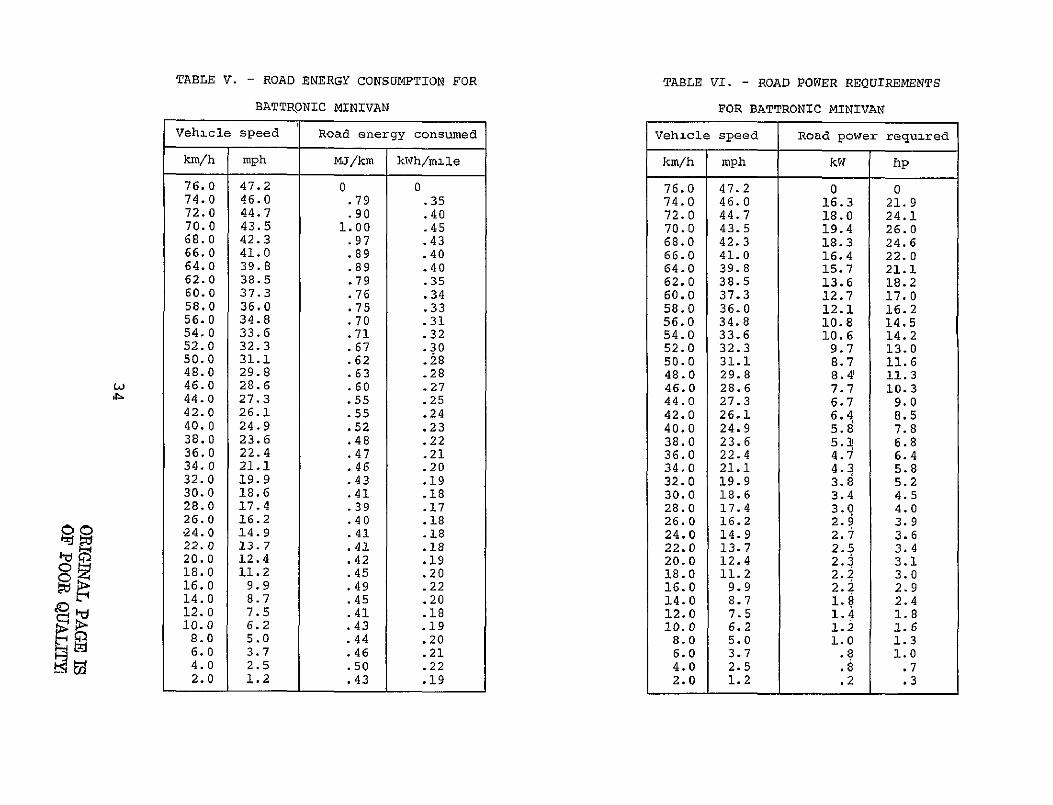
Road energy is a measure of the energy consumed perunit distance in overcoming the vehicles aerodynamic androlling resistance plus the energy consumed in thedifferential drive shaft and the portion of the transmissionrotating when in neutral It was obtained during coast-downtests when the differential was being driven by the wheelsand thus may be different than the energy consumed when thedifferential is being driven by the motor
11
V
The Battronic Minivan was driven to nearly its maximumspeedr the accelerator pedal was released and thetransfer-case shift lever was quickly moved to the neutralposition This procedure disconnected the drive motor andallowed the vehicle to coast freely to zero speed
Road energy consumpt-ion Eb was caa-cu-1ated--from thefollowing equations
-4 Vn-i
En = 278x0 W tn tni n MJkm
or
E = 907x10-5W Vn-i - V n kWhmiletn nshy
where
W vehicle mass kg (ibm)
vehicle speed kmh (mph)
t time s
The results of the road energy calculations are shown in figure 11 and table V
load Power Requirements
The calculation of road power is analogous to the roadenergy calculation It is a measure of the power needed to overcome vehicle aerodynamic and rolling resistance plus thepower losses from the differential the drive shaft and aportion of the transmission The road power Pn requiredto propel a vehicle at various speeds is also determinedfrom the coast-down tests The following equations areused
v2 _ 2Pn 3 1-Wt -ti~P 3S6xlO- n nl kW5W n-l
n n-1
12
or
V2 _ 2
P = 608xl0 5 W n--t n hp n nn 1
The results of road power calculations are shown in figure
12 and table VI
Indicated Energy Consum3tion
The vehicle indicated energy consumption is defined as the energy required to recharge the battery after a testdivided by the vehicle range achieved during the test wherethe energy is the input to the battery charger
The energy input to the battery charger was measuredwith a residential kilowatt-hour meter after each rangetest Some overcharge of the batteries was usually requiredin order to assure that all battery cells were fully chargedand that the pack was equalized The reported energy usagemay be higher than would be experienced with normal vehiclefield operation Indicated energy consumption as a function of vehicle speed is presented in figure 13 and table VII forthe constant-speed tests
Braking Capability
Simplified braking capability tests were conductedaccording to the procedure outlined in appendix E of reference 1 in order to provide a preliminary evaluation ofthe vehicles braking capabilities The procedure alsoincludes tests for handling but at ERDAs direction theywere not conducted on this vehicle
Straight-line stops - Six straight-line stops from 48kilometers per hour (30 mph) were made three from eachdirection Stopping distance varied from 16 meters (53 ft)to 18 meters (60 ft) Then six straight-line stops from themaximum speed of 83 kilometers per hour (52 mph) were madethree from each direction Stopping distance varied from 60meters (198 ft) to 67 meters (220 ft)
Stops on a curve - Three stops were made going into a03-g curve from 84 kilometers per hour (52 mph) on drypavement turning right and three stops were made on thesame curve turning left No difficulties were encounteredin stopping within the 36-meter (12-ft) lane The stoppingdistances were consistently about 72 meters (235 ft) The
13
tests were repeated in a 02-g turn on wet pavement Againthe vehicle stopped smoothly with no problems The stoppingdistances averaged slightly higher for these testsapproximately 74 meters (244 ft)
Wet brake recoSvery - Three baseline stops were madefrom 48 kilometers per hour (30 mph) with dry brakesdecelerating at 3 meters per second squared (10 ftsec2)The average pedal force was 294 newtons (66 lbf) After thevehicle was driven through 015 meter (6 in) of water at 8kilometers per hour (5 mpn) for 2 minutes the tests wererepeated The first stop was made with a pedal force of 330newtons (74 lbf) The brakes had fully recovered on thefifth stop
Parking brake - Tests were conducted to determineparking brake effectiveness The vehicle did not pass theparking brake test the first time The brakes were adjustedand the tests were repeated After adjustment the brakingforce required to hold the vehicle on a 30-percent slope was446 newtons (100 lbf) facing uphill and 350 newtons (79 lbf)facing downhill with the force being applied 38centimeters (15 in) from the top of the brake handle Noslippage during the 5-minute hold was observed with theparking brake set as described The test was run twice ineach attitude Since the test specification calls for amaximum allowable force on the lever of 400 newtons (90 lb)the vehicle successfully passed the minimum requirements inthe nose downward position but failed in the upslopeattitude even after the brake adjustment was made
COMPONENT PERFORMANCE AND EFFICIENCY
Battery Charger
The battery charger employs a ferroresonant transformerwith a center-tapped secondary The center-tapped secondaryis connected through diodes for full-wave rectification
The battery charger efficiency test results arepresented in figure 14 The indicated efficiencies of thecharger as calculated from the readings on the residentialkilowatt-hour meter and the average values of charger outputvoltages and amperes vary from 7 percent less to 5 percentmore than the efficiencies that were calculated fromwattmeter readings Which set of values is more nearlycorrect has not been determined Since the power efficiency is fairly constant over the entire time period the energyefficiency is approximately equal to the average of thepower efficiencies
14
The total amount of energy that is delivered to thebattery depends not only on the charger efficiency but alsoon the system used to terminate the charge The Battroniccharger uses a timer set by the operator to terminate thecharge Since variations in the battery voltage-currentrelationship (due to temperature age etc) can drasticallyaffect the charging current the time required to attainfull charge also varies Consequently the amount of energythat is delivered to the battery is largely determined bythe 3udgment of the operator During the track tests thebattery was always purposely overcharged to assure fullcapacity for all cells
Battery
The battery used to power the Battronic Minivan forthis test was a two-module General Battery Corpsemi-industrial battery Each module contained twenty-eight EV-330 cells The battery capacity as rated by themanufacturer is 330 ampere-hours at a discharge current of55 amperes (6-h rate) to a voltage cutoff of 170 volts percell (476 Vmodule) The cell characteristics as suppliedby the battery manufacturer are shown in table VIII
Battery acceptance - Before road testing was startedthe batteries supplied by the vehicle manufacturer werenormally tested for battery capacity and terminal integrityas specified in appendix D Both tests were modified forthe Battronic Minivan
Prior to delivery of the battery a 924-ampere (3-hrate) battery discharge test was conducted by the batterysupplier at his facility This test was used in place ofthe battery capacity test normally conducted before vehicletests The results of the test are shown in figure 15 Themeasured average capacity of the battery at 924 amperes was285 ampere-hours to a 476-volt-per-module cutoff voltageAs the manufacturer rated the battery at 277 ampere-hours atthe 924-ampere rate the battery passed the test
The cells in each battery module are permenantlyconnected together with lead connectors As theseconnectors cannot be easily loosened there was no need toconduct the 300-ampere terminal integrity test Theconnectors were inspected carefully and since there were novisible defects the battery was accepted
Controller
The Battronic Minivan controller was manufactured bythe General Electric Co The controller consists of an SCR
15
chopper bypass contactors and field weakening contactorsUp to about 80 percent of the maximum vehicle speed thespeed is controlled by applying a series of voltage pulsesto the motor As the accelerator pedal is-depressed boththe pulse width and the repetition rates are increased toincrease the percentage of time that the pulses are appliedto the motor -Increasing the percent of Uime-increases theaverage voltage applied to the motor and consequently itsspeed
At about 80 percent of the maximum vehicle speed theaverage value of motor voltage approaches the batteryvoltage Any difference results from controller lossesprimarily due to the voltage drop across the SCR Closingthe bypass contactor eliminates the controller voltage drop increasing the motor voltage and vehicle speed If shyadditional speed is desired the field weakening contactor is closed diverting some of the series field currentthrough a resistor This increases the motor speed
Information regarding the efficiency of the controllerin the chopper mode is not available Once the controlleris bypassed the only losses result from the contactor coilresistance and the small voltage drop across the contactsConsequently the controller efficiency approaches 100percent In the field weakening mode additional lossesappear in the resistor These losses reduce the controllerefficiency
Motor
The Battronic Minivan motor is a conventional DCseries-wound traction motor The motor was manufactured bythe General Electric Co The 04-hour rating of the motorwas 315 kilowatts (42 hp) at 2300 rpm 390 amperes and 94volts The motor has Class F insulation and an internalcooling fan
VEHICLE RELIABILITY
The Minivan was quite reliable during the test periodwith only three minor problems During a maximum-speedrange test at 84 kilometers per hour (52 mph) a 300-amperemotor protection fuse blew after approximately 8 minutesThe vehicle manufacturer recommended replacing the fuse witha 400-ampere fuse No further problems were encounteredwith the higher rating fuse During the test period thecharger timer failed The charger was operated without atimer for the rest of the test period The 12-volt chargeralso failed and had to be replaced early in the testprogram
16
APPENDIX A
VEHICLE SUMMARY DATA SHEET
10 Vehicle manufacturer Battronic Truck Corp
Bovertown Pa
20 Vehicle Battronic Minivan
30 Price and availability $15000 production upon request
40 Vehicle weight and load 41 Curb weight kg (bm) 2690 (5930) 42 Gross vehicle weight kg (Ibm) 2858 (6300)
43 Cargo weight kg (ibm) 227 (500) 44 Number of passengers 2
45 Payload kg(Ibm) 363 (800) including driver
50 Vehicle size 51 Wheelbase In (in) 240 (945)
52 Length m (in) 369 (145) 53 Width m(in) 198 (779) 54 Height m (in) 227 (89)
55 Head room m (in) 110 (435)
56 Legroom m(m) 037 (145)
57 Frontal area m2 (ft2) 39 (42) 58 Road clearance cm (in) 33 (13)
59 Number of seats 2
6 0 Auxiliaries and options
61 Lights (number type and function) 2 headlamp 2 park 2 brake 1 backup 2 sidelights at rear 2 sidelights
Data acquired from the test vehicle are conditionedonboard the vehicle and transmitted to the Data AcquisitionCenter where they are demodulated and recorded on magnetictape (fig B-I)
The following paragraphs provide a detailed descriptionof system components Instrumentation calibrationprocedures and test procedures relative to the dataacquisition system are also described
Signal Conditioning Equipment
The signal conditioning equipment has a modular orbuilding-block configuration The basic building block isthe remote signal conditioning module (RSCM) which consistsof all the necessary functions required to take the basictransducer information and store it on magnetic tape EachRSCM handles 14 data channels
Internally the RSCM consists of all the necessarycomponents required to signal condition modulate ontoInter-Range Instrumentation Group (IRIG) constant-bandwidthfrequency-modulated (FM) channels and transmit a transduceroutput signal to a remote tape recorder Figure B-2 is thesystem diagram defining this RSCM
The signal conditioning amplifiers in the front end ofthe RSCM provide suitable gain and balance to normalize alltransducer outputs into common formats and to drive thevoltage-controlled oscillators (VCOs) Each amplifier hasa built-in isolated bridge power supply regulated at 50volts DC that negates loading effects from other transducersand changes in output due to supply battery variationsThis power supply is used either alone divided down by01-percent metal film resistors or in series with othersupplies to provide a highly accurate and stable voltageinsertion calibration of the entire system channel by channel
The VCOs convert analog voltages to afrequency-modulated unbalanced signal The centerfrequencies of the VCOs are set at values defined by IRIG106-71 for constant-bandwidth channels (table B-l) The+25-volt outputs from the amplifier provide +100-percentdeviation of the VCOs Using a mix of A and B channelsprovides an optimum combination of data frequency responseresolution percentage of deviation and channel density in
22
each multiplex
The system is designed to provide 1000-hertz datachannel bandwidth on all A channels and 2000-hertz channelbandwidth on all B channels The 14 VCO outputs are mixedonto a common bus which provides the output signal to berecorded An external 28-volt battery is used to power theRSCM
Each RSCM weighs under 9 kilograms (20 lbm) and coversapproximately 390 square centimeters (60 in2 ) of floorspace All input and output connections and finaladjustments are accessible from the top of the module
System Accuracy
Table B-2 represents the system errors for the dataacquisition system The values are taken from the componentspecifications As there are several informationconversions through the system there was an attempt totranslate the specifications into a common error domainEach device in the system has a set of parameters thatrepresent its performance in a particular region of themultidimensional space (eg an accelerometer converts anacceleration into a voltage (actually an energy conversion)with some nonlinearity of information conversion) There isa conversion from analog voltage to frequency with acorresponding nonlinearity in the VCO The tape recorderhas to handle the information mechanically with highaccuracy because a change in tape speed represents a changein frequency which in turn represents a change in theoriginal analog voltage
Tape Recorders
The tape recorder has 14 IRIG-compatible channels withthe recording channels individually controlled so thatmultiple recording passes may be made on the same tapeCapstan speed accuracy of 001 percent is obtained by use ofa tape speed compensator system while flutter is held to022 percent Time base and dynamic skew are 05 and 25microseconds respectively
23
APPENDIX C
DESCRIPTION OF VEHICLE TEST TRACK
The test track used to conduct the tests described inthis report is located in Phoenix Arizona The track isowneamp and opeiated byDynamicScincea subsidiary ofTalley Industries
The test track is a paved continuous two-lane 32-kilometer- (2-mile-) long oval with an adjacent40 000-square-meter (10-acre) skid pad The inner lane ofthe track is not banked and was used for all cycle tests andall constant-speed tests of 56 kilometers per hour (35 mph)or under The outer lane has zero lateral acceleration at80 kilometers per hour (50 mph) and was used for tests over56 kilometers per hour (35 mph) An elevation survey of thetrack is shown in figure C-I Average grade is 066 percenton the northern straight section and 076 percent on thesouthern straight section The surface of the track andskid pad is asphaltic concrete with a dry locked-wheel skidnumber of 82 and a wet locked-wheel skid number of 71
Wet and dry braking-in-turn tests were conducted on theskid pad vet recovery tests were conducted on the testtrack after driving through the wet-brake water troughlocated near the northern straight section of the trackBoth 20- and 30-percent grades are available for parkingbrake tests
24
APPENDIX D
VEHICLE PREPARATION AND TEST PROCEDURE
Vehicle Preparation
When a vehicle was received at the test track a numberof checks were made to assure that it was ready forperformance tests These checks were recorded on a vehiclepreparation check sheet such as the one shown in figureD-l The vehicle was examined for physical damage when it was removed from the transport truck and before it wasaccepted from the shipper Before the vehicle was operateda complete visual check was made of the entire vehicleincluding wiring batteries motor and controller Thevehicle was weighed and compared with the manufacturersspecified curb weight The gross vehicle weight (GVW) wasdetermined from the vehicle sticker GVW If themanufacturer did not recommend a GVW it was determined byadding 68 kilograms (150 lbm) per passenger plus any payloadweight to the vehicle curb weight
The wheel alignment was checked compared andcorrected to the manufacturers recommended alignmentvalues The battery was charged and specific gravitiestaken to determine if the batteries were equalized If notan equalizing charge was applied to the batteries Theintegrity of the internal interconnections and the batteryterminals was checked by drawing either 300 amperes or thevehicle manufacturers maximum allowed current load from thebattery through a load bank for 5 minutes If thetemperature of the battery terminals or interconnectionsrose more than 60 degrees Celsius above ambient the test was terminated and the terminal was cleaned or the batteryreplaced The batteries were then recharged and a battery capacity check was made The battery was discharged inaccordance with the battery manufacturers recommendationsTo pass this test the capacity must be within 20 percent ofthe manufacturers published capacity at the published rate
The vehicle manufacturer was contacted for hisrecommendations concerning the maximum speed of the vehicletire pressures and procedures for driving the vehicle Thevehicle was photographed head-on with a 270-millimetertelephoto lens from a distance of about 305 meters (100 ft)in order to determine the frontal area
Test Procedure
Each day before a test a test checklist was usedTwo samples of these checklists are shown in figure D-2
25
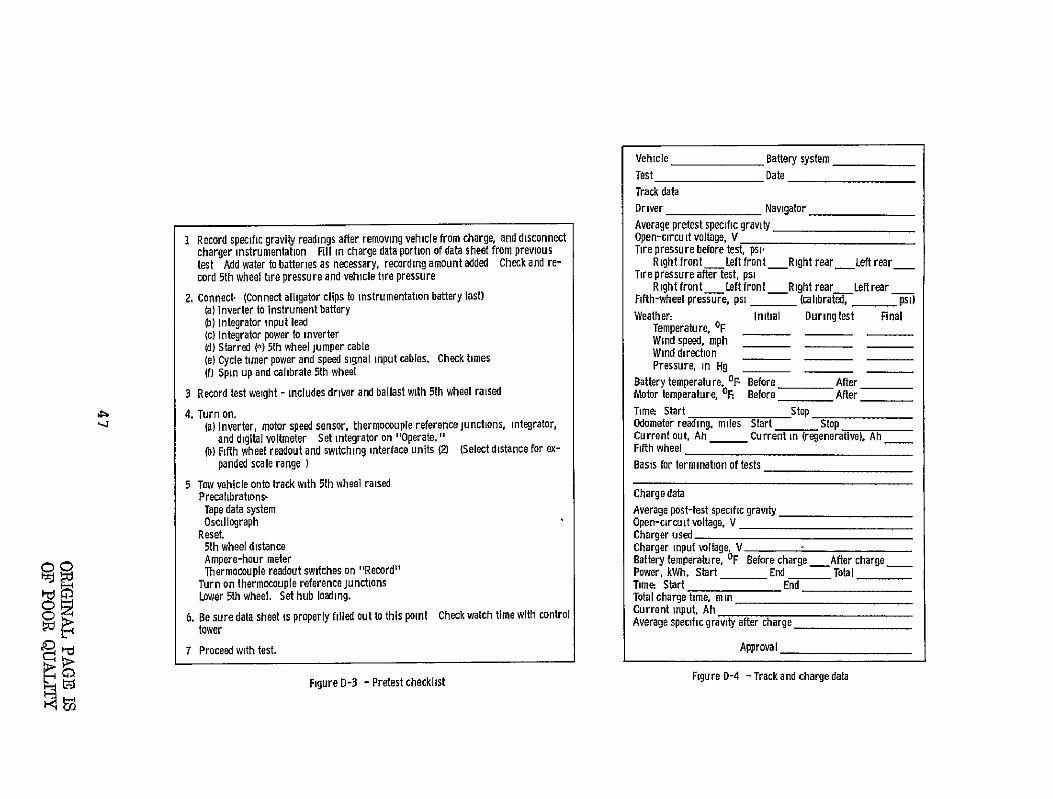
The first item under driver instructions on the testchecklist is to complete the pretest checklist (fig D-3)
Data taken before during and after each test wereentered on the vehicle data sheet (fig D-4) These datainclude
(1) Average specific gravity of the battery
(2) Tire pressures
(3) Fifth-wheel tire pressure
(4) Test weight of the vehicle
(5) Weather information
(6) Battery temperatures
(7) Time the test was started
(8) Time the test was stopped
(9) Ampere-hours out of the battery
(10) Fifth-wheel distance count
(11) Odometer readings before and after the tests
The battery charge data taken during the charge cycle werealso recorded on this data sheet These data include theaverage specific gravity of the battery after the test thekilowatt-hours and ampere-hours put into the battery duringthe charge and the total time of the charge
To prepare for a test the specific gravities werefirst measured for each cell and recorded The tirepressures were measured and the vehicle was weighed Theweight was brought up to the GVW by adding sandbags Theinstrumentation was connected and power from theinstrumentation battery was applied All instruments wereturned on and warmed up The vehicle was towed to thestarting point on the track If the data were beingtelemetered precalibrations were applied to both themagnetic tape and the oscillograph The fifth-wheeldistance counter and ampere-hour integrator counter werereset to zero and thermocouple reference 3unctions wereturned on The test was started and was carried out inaccordance with the test checklist When the test wasterminated the vehicle was brought to a stop and thepost-test checks were made in accordance with the post-test
26
checklist (fig D-5) The driver recorded on the vehicledata sheet the time the odometer reading the ampere hourintegrator reading and the fifth-wheel distance readingThe post-calibration steps were then applied to the magnetictape and the oscillograph At the end of the test weatherdata were recorded on the vehicle data sheet Allinstrumentation power was turned off the instrumentationbattery was disconnected and the fifth wheel was raisedThe vehicle was then towed back to the garage the post-testspecific gravities were measured for all cells and thevehicle was placed on charge
After the test the engineer conducting the test completed a test summary sheet (fig D-6) This data sheetprovides a brief summary of the pertinent informationreceived from the test Another data sheet the engineersdata sheet (fig D-7) was also filled out This data sheetsummarizes the engineers evaluation of the test andprovides a record of problems malfunctions changes toinstrumentation etc that occurred during the test
Weather data - Wind velocity and direction and ambienttemperature were measured at the beginning and at the end ofeach test and every hour during the test The windanemometer was located about 18 meters (6 ft) from theground near the southern straight section of the track Theambient temperature readings were taken at theinstrumentation trailer near the west curve of the trackDuring most of the test period the winds were variable andgusty
Determination of maximum speed - The maximum speed ofthe vehicle was determined in the following manner Thevehicle was fully charged and loaded to gross vehicleweight After one warmup lap the vehicle was driven atwide-open throttle for three laps around the track Theminimum speed for each lap was recorded and the average wascalculated This average was called the vehicle maximumspeed This speed takes into account track variability andmaximum vehicle loading This quantity was then reduced by5 percent and called the recommended maximum cruise testspeed
Cycle timer - The cycle timer (fig D-8) was designedto assist the Vehicle driver in accurately driving SAEschedules B C and D The required test profile ispermanently stored on a programmable read-only memory(PROM) which is the heart of the instrument This profile is continuously reproduced on one needle of a dual-movementanalog meter shown in the figure The second needle isconnected to the output of the fifth wheel and the driver
27
matches needles to accurately drive the required schedule
One second before each speed transition (egacceleration to cruise or cruise to coast) an audio signalsounds to forewarn the driver of a change A longerduration audio signal sounds after the idle period toephasfze the st-art of a new cycle The total number oftest cycles driven is stored in a counter and can bedisplayed at any time with a pushbutton (to conserve power)
28
REFERENCES
1 Sargent Noel B Maslowski Edward A Soltis RichardF and Schuh Richard M Baseline Tests of the C H Waterman DAF Electric Passenger Vehicle NASA TM-737571977
2 Society of Automotive Engineers Inc Electric VehicleTest Procedure - SAE J227a Feb 1976
3 Battronics Minivan Service and Parts Manual BattronicTruck Corp Boyertown Pa
4 Franz Gary J Performance and Operation Tests of aBattery Powered Multi-Purpose Work Vehicle Manufacturedby Boyertown Auto Body Works Boyertown Pennsylvaniafor the Electric Vehicle Council New York New YorkDana Corp 1973
29
I - SL OF T R S FOR MTTA C nNIVAN
(a) sI nut+s
Test-date ar Test ohton n Wind Teper- -Range- Cycle Curret Cr t Dergy Tndicatd (oistant speed
Figure B-2 - Remote signal conditioning modulediagram
ORIGINAL PAGE IS OE POOR QUALITY44
DISTANCE km (1t) (9000) (8000) (7000)
1 shy3ORTlHERN $1RAIGHi 0
0(
2)5 SOUTHERN STRAIGHT- 5 000)1-3
0
DI00) (2000) (3000) (4 0O)
(a)Track diagram
12shy
z- 4
1shy
-12 - -8 II II I
(b)Grade -- 12 [NO4- 10- SOUTHERN NORTHERN
STRAIGHT STRAIGHT
30 I 25 - 2
Fz 20 I 15 0 4 I
10 5 21
0 J ORIGINAL PAGE l o 10002O0
DISTANCE in 400~opOO IAT
POOR QUALM I I I I I I 0 2000 4000 6000 8000 10000
DISTANCE ft
(c)Elevation
Figure C-I - Characteristics of Dynamic Science Test Track Phoenix Arizona
1 Vehicle
2 Date received 3 Checked for damage - date 4 Wheel alignment -date 5 Battery checked and equalized - date 6 Curb weight determined Ibm Date 7 Gross vehicle weight Ibm
8 300-Ampere test - date 9 Manufacturers recommendations
Maximum speed mph Tire pressures psi Front Rear Driving procedures
Figure D-1 - Vehicle preparation check sheet
45
Vehicle _m -- mph range test ___ gear
Driver Instructions1 Complete pretest checklist2 While on track recheck
Integrator - light on in operate position zeroed Speedometer - set on _ mph center Vehicle __cycle test gearDistance - on reset lighted Attenuator - on reset lighted Driver Instructons
3 At signal from control center accelerate moderately to _ mph I Complete pretest checklist 4Maintain -+ mph with minimal accelerator movement 2While on track recheck5 Integrator - light on in operate position zeroedSWhen vehicle isno longer able to maintain __ mph brake moderately to full stop Speedometer - set on - mph center 6Complete post-test checklist and other documentation Distance - on reset lightedRecording Attenuator - on reset selector on 1001 Set oscillograph zeros at Channel] Zero in Cycle timer - verify scheduled timing with stop watch
3 30 3At signal from control center perform cycletest using cycle timer as basis for detershy4 4 5 mining length of each phase of performance cycle Use programmed stop watch as 6 5 0 backup device Cycle Consists of
o 10 75 Accelerate to __ mph in __ s 12 11 Cruise at mph for s 13 12 14 20 Coast for s
2Record all channels on magnetic tape Check inputs at beginning of test to verify Brake to complete stop in s recording Hold in stop position for _ s
3Run cals on all channels Repeat entire cycle until vehicle isunable to meet acceleration time Moderately brake 4 Remove all channels from oscillograph except 3and 4 to acomplete stop 5 Start recording 15 sbefore start of test at oscillograph speed of 01Inls and tape speed 4 Complete post-test checklist and other documentation
of Lnls Recordingshy6After 15 min into test connect channels 6 10 12 13 and 14 to oscillograph and record 1Record all channels on magnetic tape at_ ins Check all channels to veriy
aburst at 100 nis while veh icle is in chopper mode input at beginning of test 7Remove channels 6 10 12 13 and 14 from oscillograph and continue test at 0 1 ins 2Record speed and distance on oscillograph at_ mns
with channels 3and 4only 3 Start recordingdata 15 sbefore beginning test 8 Document all ambient conditions at beginning once every hou rand at the end of the 4Document ambient conditions at beginning once every hour and at the end of the testtest Items recorded shall include temperature wind speed and direction significant Items recorded shall include temperature wind speed and direction significant windwind gusts and corrected barometric pressure gusts and corrected barometric pressure
-J (al Constant-speed test t)) Driving cycle test v i7)Figure D-2 - Test checklists
0-~
1 Record specific gravity readings after removing vehicle from charge and disconnect charger instrumentation Fill in charge data portion of data sheet from previous test Add water to batteries as necessary recording amount added Check and reshycord 5th wheel tire pressure and vehicle tire pressure
2 Connect (Connect alligator clips to instrumentation battery last))neter on a strument battery a
(a)inverter to instrument batterygo)Integrator input leadTeprteF
(c) Integrator power to inverter d)Starred Hf5th wheel jumper cable e)Cycle timer power and speed signal input cables (f)Spn up and calibrate 5th wheel
Check times
3 Record test weight - includes driver and ballast with 5th wheel raised
eN 4 Turn on (a)Inverter motor speed sensor thermocouple reference junctions integrator
and digital voltmeter Set integrator on Operate (b)Fifth wheel readout and switching interface units (2) (Select distance for exshy
panded scale range )
C C 1
5 Tow vehicle onto track with 5th wheel raised Precalhbrations
Tape data system Oscillograph
Reset 5th wheel distance Ampere-hour meter Thermocouple readout switches on Record
Turn on thermocouple reference junctions Lower 5th wheel Set hub loading
6Be sure data sheet isproperly filled out to this point tower
Check watch time with control
7 Proceed with test
Figure D-3 - Pretest checklist
Vehicle Battery system
Test Date Track data Driver Navigator
Average pretest specific gravity Open-circuit voltage V Tire pressure before test psi
Right front_ Left front Right rear Left rear Tire pressure after test psi
Right front __ Left front Right rear__ Left rear Fifth-wheel pressure psi _ (calibrated __ psi)Weather Initial Duringtest Final
Temperature OF Wind speed mph Wind direction Pressure in Hg
Battery temperature OF Before After Motor temperature OF Before After
Time Start Stop _
Odometer reading miles Start _ Stop Current out Ah _ Current in (regenerative) Ah Fifth wheel Basis for termination of tests
Charge data Average post-test specific gravity Open-circuit voltage V Charger used Charger input voltage V Battery temperature OF Before charge After charge _ Power kwh Start End Tota I Time Start EndTotal charge time mm
Current iput Ah Average specific gravity after charge
Approval
Figure D-4 - Track and charge data
1 Recordtime immediately at completion of test Turn off key switch
2 Complete track data sheet (a)Odometer stop0) Ampere-hour integrator(c)5th wheel distance (d)Read temperature (e)Calibrate data system (f) Record weather data
3 Turn off inverter thermocouple reference junctions
4 Disconnect 12-olt instrument battery red lead
5 Raise 5th wheel
6 Tow vehicle off track
7 Start charge procedure (specific gravities)
8 Check specific gravityon instrument battery If less than 1 220 remove from vehicle and charge to full capacity
9 Check water level in accessory batteries Add water as necessary
Figure D-5 - Post-test checklist
Vehicle Test Date Test conditions
Temperature OF Wind speed mph _ at Barometer reading in Hg _ Other
Test results Test time h Range milesCyclesCurrent out of battery AhCurrent into battery AhCharge time hPower into battery kWh
Magnetic tape NO_ Speed ins
Comments
Figure D-6 - Test summary sheet
48
Vehicle Test Date Engineer Reason for test tcheccout component check scheduled test etc)
Limitation on test tmalfunction data system protlem brake drag etc)
Changes to vehicle prior to test (repair change batteries etc)
Other comments
Evaluation of test Range miles
Current out Ah
Current in Al
Power in kWh
Energy consumption kWhlmile Was planned driving cycle followed
General comments
Figure D-7 - Engineers data sheet
112
Figure D-amp - Cycle timer
49 ORIGINAL PAGE iaOF POR QUALr1
NATIONAL AERONAUTICS AND SPACE ADMINISTRATION WASHINGTON D C 20546
________POSTAGE AND FEES PALO NATIONAI AERONAUTICS ANDOFFICIAL BUSINESS SPACE ADMINIS1RATION
PENALTY FOR PIVATE uSE $30o SPECIAL FOURTH-CLASS RATE 45I
BOOK 4S
(Section 158If UndeliverablePOSTMASTR Pota anual) Do Not Return
NOTICE
This report was prepared to document work sponsored by
the United States Government Neither the United States
nor its agent the United States Energy Research and
Development Administration nor any Federal employees
nor any of their contractors subcontractors or their
employees makes any warranty express or implied or
assumes any legal liability or responsibility for the
accuracy completeness or usefulness of any infornashy
tion apparatus product or process disclosed or
represents that its use would not infringe privately
owned rights
1 Report No 2 Government Accesion No 3 Recipients Catalog No
NASA TM-73761
4 Title and Subtitle 5 Report Date
BASELINE TESTS OF THE BATTRONIC MINIVAN ELECTRIC December 1977 6 Performing Organization CodeDELIVERY VAN
7 Author(s) 8 Performing Organization Report No
Miles 0 Dustin Richard F Soltis John M Bozek and E-9483
Edward A Maslowski 10 Work Unit No 9 Performing Organization Name and Address
National Aeronautics and Space Adnimstration 11 f or Grant No
Lewis Research Center Cleveland Ohio 44135 13 Type of Report and Period Covered
12 Sponsoring Agency Name and Address Techmcal Memorandum Department of Energy Division of Transportation Energy Conservation 14 Sponsoring Agency CreReport No
Washington DC 20545 CONS1011-6 15 Supplementary Notes
Prepared under Interagency Agreement EC-77-A-31-1011
16 Abstract The Battromc Minivan an electric passenger vehicle manufactured by the Battromc Truck Corp
a Division of Boyertown Auto Body Works was tested at the Dynamic Science Test Track in
Phoenix Arizona between February 5 and March 6 1977 The tests are part of an Energy
Research and Development Administration (ERDA) project to charactenze the state-of-the-art of
electric vehicles The Battronic vehicle performance test results are presented in this report
17 Key Words (Suggested by Author(s)) 18 Distribution Statement Electric vehicle Unclassified - unlinted
Car STAR Category 85 Test and evaluation DOE Category UC-96
Battery
19 Secuity Cassi (of thisreport) 20 Security Classif (of this page) 21 No of Pages 22 Price
Unclassified Unclassified 50 A03
For sale by the National Technical Information Service Springfield Virginia 22161
The Electric and Hybrid Vehicle Program
was conducted under the guidance of the
then Energy Research and Development
Administration (ERDA) now part of the
Department of Energy
BASELINE TESTS OF THE
BATTRONIC MINIVAN ELECTRIC DELIVERY VAN
Miles 0 Dustin Richard F Solts John M Bozek
and Edward A Maslowski
Lewis Research Center
SUMMARY
The Battronic Minivan an electric passenger vehiclemanufactured by the Battronic Truck Corp a Division ofBoyertown Auto Body Works was tested at the Dynamic SciencePest Track in Phoenix Arizona between February 5 andMarch 6 1977 The tests are part of an Energy Research andDevelopment Administration (ERDA) project to characterizethe state-of-tne-art of electric vehicles The Battronicvehicle performance test results are presented in thisreport
The Minivan is a two-passenger van with sliding sideentry doors and a large rear door It is powered by atwo-module 112-volt semi-industrial battery through an SCRdirect-current (DC) chopper controller witn bypasscontactors The motor is a 31-kilowatt (42-hp) series-woundDC traction motor The braking system is a conventionalhydraulic braking system Regenerative braking was notprovided
All tests were run at the gross vehicle weight of 2860kilograms (6300 lbm) The results of the tests are asfollows
Test condition Type of test(constant speed ordriving schedule) Range Road Road energy Indicated
kmhmph km kW kWhmllek energy consumptionmile power M7km Mmkhml
Low gear
40 25 1057 657 59 053 024 155 069
60 37 823 512 129 77 35 219 98
High gear
72 45 540 336 183 091 041 321 143
84 52 354 220 shy 403 180
B 795 494 ---- ---- 245 110
C 637 396 ---- ---- - - 292 130
The Minivan was able to accelerate from 0 to 32 kilometersper hour (0 to 20 mph) in 7 seconds and from 0 to 48Kilometers per hour (0 to 30 mph) in 11 seconds Thegradeability limit was 50 percent for 1 to 2 seconds onlyThe duration was limited because the 400-ampere motor protection fuse failed due to current overload
The efficiency of the battery charger was measured andfound to be 85 to 95 percent over a complete charge cycle
INTRODUCTION
The vehicle tests and the data presented in this reportare in support of Public Law 94-413 enacted by Congress onSeptember 17 1976 The law requires the Energy Researchand Development Administration (ERDA) to develop datacharacterizing the state-of-the-art of electric and hybridvehicles The data so developed are to serve as a baseline(1) to compare improvements in electric and hybrid vehicletechnologies (2) to assist in establishing performancestandards for electric and hybrid vehicles and (3) to helpguide future research and development activities
The National Aeronautics and Space Administration(NASA) under the direction of the Electric and HybridResearch Development and Demonstration Office of the Division of Transportation Energy Conservation of ERDA hasconducted track tests of electric vehicles to measure theirperformance characteristics and vehicle componentefficiencies The tests were conducted according to ERDAElectric and Hybrid Vehicle Test and Evaluation Procedure described in appendix E of reference 1 This procedure isbased on the Society of Automotive Engineers (SAE) J227aprocedure (ref 2) Seventeen electric vehicles have beentested under this phase of the program 12 by NASA 4 by MERADCOM and 1 by the Canadian government
-The assistance and cooperation of Robert Dare fromBattronic Truck Corp the vehicle manufacturer are greatlyappreciated The Energy Research and DevelopmentAdministration provided funding support and guidance duringthis project
US customary units were used in the collection andreduction of data The units were converted to theInternational System of Units for presentation in thisreport US customary units are presented in parenthesesThe parameters symbols units and unit abbreviations usedin this report are listed here for the convenience of thereader
2
ORIGINAL PAGE ISOF POOR QUALTY
Parameter Symbol SI units US customary units
Unit Abbrevia- Unit Abbreviashytion tion
Acceleration a meter per scond squared ms mile per hour per second mphs2 22
m square foot square inch ft inArea --- square meter
Energy --shy megajoule M3 kilowatt hour kWh Energy consumption E megajoule per kilometer 4km kilowatt hour per mile kWhmile Energy economy --shy megajoule per kilometer Makm kilowatt hour per mile kWhmile
Force P newton N pound force lbf
Integrated current --shy ampere hour Ah ampere hour Ah Length meter m inch foot mile in ft Mass weight W kilogram kg pound mass ibm Power P kilowatt kw horsepower hp Pressure --shy kilopascal kPa pound per square inch psi
Range --shy kilometer km mile ---
Specific energy --shy megajoule per kilogram Jkg watt hour per pound WhIbm Specific power --shy kilowatt per kilogram kWkg kilowatt per pound kWlbm Speed
Volume
V
--shy
kilometer per hour
cubic meter
kmh m 3
mile per hour cubic inch cubic foot
mph in
3 ft 3
OBJECTIVES
The objectives of the tests were to measure vehiclemaximum speed range at constant speed range overstop-and-go driving schedules maximum accelerationgradeabilaty gradeabilty limit road energy consumptionroad power indicated energy consumption brakingcapability and battery charger efficiency for the BattronacMinivan electric delivery van
TEST VEHICLE DESCRIPTION
The Battronic Minivan is a battery-powered electrictruck with a curb weight of approximately 2600 kilograms(5730 lbm) and a payload capability of 363 kilograms (800ibm) It is a two-passenger van with a sliding cab door oneach side (fig 1) Each cab door has a sliding sashwindow The vehicle nas a large single rear door whichprovides easy access to the rear compartment (fig 2) Acomplete description of the vehicle is given in reference 3More-detailed characteristics of the vehicle are presentedin appendix A and below
The vehicle is powered by a 313-kilowatt (42-hp)series-wound direct-current (DC) traction motor withthermal protection The controller located in the front ofthe vehicle (fig 3) is a General Electiric reactance
3
solid-state SCR DC chopper with bypass contactors It hasfused protection for the control circuits Field weakeningand automatic current limiting are also provided by thecontroller
The battery of the Battrncid Minivan is asemi-industrial lead-acid battery It is rated at 112volts and is assembled into two modules one located on eachside of the rear compartment Figure 4 depicts the batterymodule located on the passenger side of the vehicle Thetwo modules are connected electrically in series wheninstalled in the vehicle An on-board battery charger isprovided to charge these modules It may be connected to either 115 or 230 volts alternating current (AC) and isequipped with an automatic timer
An accessory 12-volt battery is furnished to power thelights horn radio etc This battery is chargedcontinuously from the main batteries through a DC-to-DCconverter
Driveline gear ratio is controlled by a transfer-caseshift lever The transfer case has two ratios and can beshifted only when the vehicle is standing still The highgear position is used for highway driving the low gearposition is used for normal city driving and hill climbingA neutral position is provided to disengage the motor andgearbox
A directional control lever is used to control thedirection of current flow to the field of the motor Thisallows the vehicle to move forward or in reverse With thislever in the neutral position no current can flow to thefield circuit and operation of the vehicle is prevented
To place the vehicle in motion requires releasing thehand brakemov-ing the shift lever to the proper gearplacing the directional control lever in forward or reverseand depressing the accelerator pedal Removing pressurefrom the accelerator pedal shuts off all power to the motorThe brakes are conventional hydraulic drum brakes Noregenerative braking is provided
INSTRUMENTATION
The Battronic Minivan was instrumented to measurevehicle speed and range battery voltage and current motorvoltage and current temperatures of the motor frame andbattery case and battery charger power Most of thesemeasurements were telemetered to a central instrumentationfacility where they were recorded on magnetic tape The
4
telemetry system is described in appendix B
A schematic diagram of the electric propulsion systemwith the instrumentation sensors is shown in figure 5 ANucleus Corporation Model NC-7 precision speedometer (fifthwheel) was used to measure vehicle speed and distancetraveled Auxiliary equipment used with the fifth wheelincluded a Model ERP-Xl electronic pulser for distancemeasurement a Model NC-PTE pulse totalizer a Model ESSEexpanded-scale speedometer and a programmable digitalattenuator The fifth wheel was calibrated before each testby rotating it on a constant-speed fifth-wheel calibratordrum mounted on the shaft of a synchronous AC motor Theaccuracy of the distance and velocity readings was within+05 percent of the readings Distance and velocity wererecorded on magnetic tape through the telemetry system
The integrated battery current was measured for thebattery pack with a current shunt and an on-board currentintegrator It was recorded manually after each test Thismeasurement provides the ampere-hours delivered by thebattery pack The current integrator is a Model SHR-C3Curtis current integrator and was calibrated periodically towithin +1 percent of reading
Motor current motor voltage and motor temperaturewere measured to determine motor performance A 1000-amperecurrent shunt was used in an attempt to measure motor current Excessive noise in the motor current signal madetne measurement useless One thermocouple was placed oneach battery module to monitor battery temperature Thesemeasurements were telemetered and recorded on magnetic tapeBattery electrolyte temperatures and specific gravities weremeasured manually before and after the tests
Power for the fifth wheel and current integrator wasprovided from an automotive 12-volt starting lighting andignition (SLI) battery A Tripp Lite 500-watt DCACinverter provided the AC power The power for the telemetrysystem was obtained from the battery power pack described inappendix B
All instruments were calibrated periodically Theintegrators and strip-chart recorders were calibrated with aHewlett-Packard Model 6920 B meter calibrator which has anaccuracy of 02 percent of reading and a usable range of001 to 1000 volts
The current and voltage into the battery and the energy into the battery charger were measured while tne battery wasbeing recharged after each test The current and voltage to
5
the battery were recorded on a Honeywell 195 Electroniktwo-channel strip-chart recorder The current measurementused a 500-ampere current shunt in all the test seriesexcept one In that series a laboratory wattmeter withHall-effect current sensors manufactured by OhioSemitronics Inc was used to measure charger efficiencyThe energy delivered to the charger was measured with aGeneral Electric 1-50A single-phase residentialkilowatt-hour meter
TEST PROCEDURES
The tests described in this report were performed atthe Dynamic Science Test Track a two-lane 322-kilometer(2-mile) asphalt track located in Phoenix Arizona Acomplete description of the track is given in appendix CWhen the vehicle was delivered to the test track thepretest checks described in appendix D were conducted Thefirst test was a formal shakedown to familiarize the driverwith the operating characteristics of the vehicle to checkout all instrumentation systems and to determine thevehicles maximum speed (appendix D) All tests were run inaccordance with ERDA Electric and Hybrid Vehicle Test AndEvaluation Procedure ERDA-EHV-TEP (appendix E of ref 1) atthe gross weight of the vehicle 2860 kilograms (6300 lbm)
Range Tests at Constant Speed
The vehicle speed for the highest constant-speed rangetest was determined during checkout tests of the vehicleIt was specifiedas 95 percent of the minimum speed thevehicle could maintain on the test track when it wastraveling at full power This speed was 84 kilometers perhour (52 mph) in high gear and 595 kilometers per hour (37mph) in low gear for the Battronic Minivan
Range tests at constant speeds were run for theBattronic Minivan in both low and high gear The testspeeds were 40 and 60 kilometers per hour (25 and 37 mph) inlow gear and 72 and 84 kilometers per hour (45 and 52 mph)in high gear The speed was held constant within +16kilometers per hour (I mph) and the test was terminatedwhen the vehicle could no longer maintain 95 percent of thetest speed The range tests were run at least twice at eachspeed
Range Tests under Driving Schedules
Both the 32-kilometer-per-hour (20-mph) schedule B andthe 48-kilometer-per-hour (30-mph) schedule C stop-and-godriving cycles shown in figure 6 were run with this
6
vehicle A complete description of the cycle tests is givenin appendix E of reference 1 A special instrument calleda cycle timer was developed at the Lewis Research Center toassist in accurately running these tests Details of thecycle timer are given in appendix D The cycle tests wereterminated when the test speed could not be attained in thetime required under maximum acceleration
Acceleration and Coast-Down Tests
The maximum acceleration of the vehicle was measured ona level road with tne battery fully charged and 40 and 80percent discharged Four runs two in each direction wereconducted at each of these three states of charge with thevehicle in high gear In low gear the tests were conductedwith the battery 40 and 80 percent discharged Depth ofdischarge was determined from the number of ampere-hoursremoved from the batteries Acceleration runs were made onthe southern straight section of the track and coast-downson the northern straight section (appendix C fig C-1)Coast-down data were taken after the acceleration test withthe transmission in neutral and with fully charged batteriesin order to start the coast-down run from the maximumattainable vehicle speed
Braking Tests
Braking tests on the vehicle were conducted
(1) fo determine the minimum stopping distance in astraight-line emergency stop
(2) To determine the controllability of the vehiclewhile braking in a turn on both wet and drypavement
(3) To determine the brake recovery after the vehiclewas driven through 015 meter (6 in) of water at 8kilometers per hour (5 mph) for 2 minutes
(4) To determine the parking brake effectiveness on anincline
Instrumentation used during the braking test included afifth wheel programmed to determine stopping distance abrake pedal force transducer and a decelerometer Acomplete description of the braking tests is given in thediscussion of test results and in appendix E of reference 1
7
Tractive Force Tests
The maximum grade-climbing capability of the testvehicle can be determined from tractive force tests bytowing a second vehicle The driver of the towed vehicleby applying the footbrake maintains a speed of about 3kilometers per hour (2 mph) while the test vehicle is beingdriven with a wide-open throttle The force is measured bya 13 000-newton (3000-lbf) load cell attached to the tow chain between the vehicles The tests are normally run with the batteries fully charged and 40 and 80 percentdischarged However a problem arose each time an attemptwas made to tow the second vehicle with the BattronicMinivan The motor drew such a large amount of current toget-the vehicles moving that the 400-ampere fuse in the mainbattery circuit kept blowing out Therefore these testscould not be completed The initial thrust of the vehicleprior to opening of the fuse was calculated to be equivalentto a gradeability limit in excess of 50 percent
Charger Efficiency Tests
Two methods were used to determine charger efficiencyas a function of charge time In the first method aresidential kilowatt-hour meter was used to measure inputpower to the charger by counting rotations of the disk andapplying the meter manufacturers calibration factor Thecharger output power was determined by multiplying theaverage value of current by the average value of voltageResidential kilowatt-hour meters are calibrated forsinusoidal waves only The error in measuring input powerdepends on the wave shape and may be as high as 5 percentThe method of determining output power is correct only wheneither the voltage or the current is a constant during eachcharging pulse The battery voltage does change during eachcharging pulse which introduces a small error The currentshunts used to measure current are inaccurate for pulsingcurrent The error depends on frequency and wave shape andmay exceed 10 percent
In the other method used for determining chargerefficiency a 50-kilowatt power meter was used on both theinput and output of the charger and a Hall-effect currentprobe was used for current measurements To minimizeerrors the same meter and current probe were used for boththe input measurement and the output measurement TheaVerage power measured was about 4 percent of full scale The influence of these inaccuracies on the determination ofcharger efficiency is discussed in the component section ofthis report
8
TEST RESULTS
Range
The data collected from all the range tests aresummarized in taole I Shown in the table are the testdate the type of test the environmental conditions therange test results the ampere-hours into and out of thebattery and the energy into the charger These data wereused to determine vehicle range battery efficiency andenergy consumption
During most of the test period the winds were variableand gusty Even though the wind was less than 16 kilometersper hour (10 mph) on several occasions it was blowing indifferent directions and at different velocities at twopositions on the track There was no indication that thisvariation in wind velocity significantly affected the range or other test results as long as the measured winds wereless than about 16 kilometers per hour
The maximum speed of the vehicle was measured duringthe checkout tests It is defined as the average speed thatcould be maintained on the track under full power Themeasured maximum speed was 90 kilometers per hour (56 mph)for this vehicle This differs from the maximum speed usedin the range tests
Two 40-kilometer-per-hour (25-mph) three60-kilometer-per-hour (37-mpn) two schedule B and twoschedule C tests were run in low gear on the BattronacMinivan In high gear three 72-kilometer-per-hour (45-mph)and two 84-kilometer-per-hour (52-mph) constant-speed rangetests were run The constant-speed test results are plottedin figure 7 Some tests in table I were not included in thedata averaging because winds exceeding the specificationsoccurred during these tests
Maximum Acceleration
The maximum acceleration of the vehicle was determinedwith the batteries fully charged and 40 and 80 percentdischarged Since the transmission had both a high gear anda low gear in the forward direction the acceleration testswere run in both gears The results of these tests areshown in figure 8(a) for the tests run in high gear and infigure 8(b) for low gear These data are tabulated in tableII The average acceleration an was calculated for thetime period t_1 to tn where the vehicle speed increased from Vn-l to Vn from the equation
9
V -V n-l nn - Ittn tn-1
and the average speed of the vehicle V from the equation
V +VV n+ n-i 2
Maximum acceleration as a function of speed is shown in
figure 9 and table III
Gradeability
The maximum specific grade in percent that a vehicle can climb at an average vehicle speed V was determinedfrom maximum acceleration tests by using the equatiqns
G = 100 tan (sin 01026 a for V in kmh
in S1 units
or
G = 100 tan (sin 00455 an) for V in mph
in US customary units
where an is average acceleration in meters per secondsquared (rnphsec) The maximum grade the Minivan cannegotiate as a function of speed is shown for both gears infigure 10 and table IV
Gradeability Limit
Gradeability limit is defined by the SAE J227aprocedure as the maximum grade on which the vehicle can justmove forward The limit can be determined by measuring thetracti-ve force with a load cell while towing a secondvehicle at about 3 kilometers per hour (2 mph) It can becalculated from the equations
10
Gradeability limit in percent = 100 tan (sin-i 98 w)
in SI units
or
Gradeability limit in percent = 100 tan (s n-1 )
in US customary units
where
P tractive force N (lbf)
W gross vehicle weight kg (ibm)
The tractive force that the Battronic Minivan wascapanle of exerting for the required speed and time(appendix E of ref 1) was not attained because the currentdrawn from the battery was so large that it kept blowing outthe main battery fuse However the initial thrust of thevehicle recorded a tractive force of nearly full scale (13000 o (3000 lbf)) before the fuse blew The resultantgradeability should thus be in excess of 50 percent Sincethis is only the initial force exerted for very shortduration the gradeability may decrease over a longer periodof time Results given in reference 4 indicate a maximumgradeability capability of over 31 percent when the vehiclewas driven for 18 meters (60 ft) at a speed of 8 kilometersper hour (5 mph)
Road Energy Consumption
Road energy is a measure of the energy consumed perunit distance in overcoming the vehicles aerodynamic androlling resistance plus the energy consumed in thedifferential drive shaft and the portion of the transmissionrotating when in neutral It was obtained during coast-downtests when the differential was being driven by the wheelsand thus may be different than the energy consumed when thedifferential is being driven by the motor
11
V
The Battronic Minivan was driven to nearly its maximumspeedr the accelerator pedal was released and thetransfer-case shift lever was quickly moved to the neutralposition This procedure disconnected the drive motor andallowed the vehicle to coast freely to zero speed
Road energy consumpt-ion Eb was caa-cu-1ated--from thefollowing equations
-4 Vn-i
En = 278x0 W tn tni n MJkm
or
E = 907x10-5W Vn-i - V n kWhmiletn nshy
where
W vehicle mass kg (ibm)
vehicle speed kmh (mph)
t time s
The results of the road energy calculations are shown in figure 11 and table V
load Power Requirements
The calculation of road power is analogous to the roadenergy calculation It is a measure of the power needed to overcome vehicle aerodynamic and rolling resistance plus thepower losses from the differential the drive shaft and aportion of the transmission The road power Pn requiredto propel a vehicle at various speeds is also determinedfrom the coast-down tests The following equations areused
v2 _ 2Pn 3 1-Wt -ti~P 3S6xlO- n nl kW5W n-l
n n-1
12
or
V2 _ 2
P = 608xl0 5 W n--t n hp n nn 1
The results of road power calculations are shown in figure
12 and table VI
Indicated Energy Consum3tion
The vehicle indicated energy consumption is defined as the energy required to recharge the battery after a testdivided by the vehicle range achieved during the test wherethe energy is the input to the battery charger
The energy input to the battery charger was measuredwith a residential kilowatt-hour meter after each rangetest Some overcharge of the batteries was usually requiredin order to assure that all battery cells were fully chargedand that the pack was equalized The reported energy usagemay be higher than would be experienced with normal vehiclefield operation Indicated energy consumption as a function of vehicle speed is presented in figure 13 and table VII forthe constant-speed tests
Braking Capability
Simplified braking capability tests were conductedaccording to the procedure outlined in appendix E of reference 1 in order to provide a preliminary evaluation ofthe vehicles braking capabilities The procedure alsoincludes tests for handling but at ERDAs direction theywere not conducted on this vehicle
Straight-line stops - Six straight-line stops from 48kilometers per hour (30 mph) were made three from eachdirection Stopping distance varied from 16 meters (53 ft)to 18 meters (60 ft) Then six straight-line stops from themaximum speed of 83 kilometers per hour (52 mph) were madethree from each direction Stopping distance varied from 60meters (198 ft) to 67 meters (220 ft)
Stops on a curve - Three stops were made going into a03-g curve from 84 kilometers per hour (52 mph) on drypavement turning right and three stops were made on thesame curve turning left No difficulties were encounteredin stopping within the 36-meter (12-ft) lane The stoppingdistances were consistently about 72 meters (235 ft) The
13
tests were repeated in a 02-g turn on wet pavement Againthe vehicle stopped smoothly with no problems The stoppingdistances averaged slightly higher for these testsapproximately 74 meters (244 ft)
Wet brake recoSvery - Three baseline stops were madefrom 48 kilometers per hour (30 mph) with dry brakesdecelerating at 3 meters per second squared (10 ftsec2)The average pedal force was 294 newtons (66 lbf) After thevehicle was driven through 015 meter (6 in) of water at 8kilometers per hour (5 mpn) for 2 minutes the tests wererepeated The first stop was made with a pedal force of 330newtons (74 lbf) The brakes had fully recovered on thefifth stop
Parking brake - Tests were conducted to determineparking brake effectiveness The vehicle did not pass theparking brake test the first time The brakes were adjustedand the tests were repeated After adjustment the brakingforce required to hold the vehicle on a 30-percent slope was446 newtons (100 lbf) facing uphill and 350 newtons (79 lbf)facing downhill with the force being applied 38centimeters (15 in) from the top of the brake handle Noslippage during the 5-minute hold was observed with theparking brake set as described The test was run twice ineach attitude Since the test specification calls for amaximum allowable force on the lever of 400 newtons (90 lb)the vehicle successfully passed the minimum requirements inthe nose downward position but failed in the upslopeattitude even after the brake adjustment was made
COMPONENT PERFORMANCE AND EFFICIENCY
Battery Charger
The battery charger employs a ferroresonant transformerwith a center-tapped secondary The center-tapped secondaryis connected through diodes for full-wave rectification
The battery charger efficiency test results arepresented in figure 14 The indicated efficiencies of thecharger as calculated from the readings on the residentialkilowatt-hour meter and the average values of charger outputvoltages and amperes vary from 7 percent less to 5 percentmore than the efficiencies that were calculated fromwattmeter readings Which set of values is more nearlycorrect has not been determined Since the power efficiency is fairly constant over the entire time period the energyefficiency is approximately equal to the average of thepower efficiencies
14
The total amount of energy that is delivered to thebattery depends not only on the charger efficiency but alsoon the system used to terminate the charge The Battroniccharger uses a timer set by the operator to terminate thecharge Since variations in the battery voltage-currentrelationship (due to temperature age etc) can drasticallyaffect the charging current the time required to attainfull charge also varies Consequently the amount of energythat is delivered to the battery is largely determined bythe 3udgment of the operator During the track tests thebattery was always purposely overcharged to assure fullcapacity for all cells
Battery
The battery used to power the Battronic Minivan forthis test was a two-module General Battery Corpsemi-industrial battery Each module contained twenty-eight EV-330 cells The battery capacity as rated by themanufacturer is 330 ampere-hours at a discharge current of55 amperes (6-h rate) to a voltage cutoff of 170 volts percell (476 Vmodule) The cell characteristics as suppliedby the battery manufacturer are shown in table VIII
Battery acceptance - Before road testing was startedthe batteries supplied by the vehicle manufacturer werenormally tested for battery capacity and terminal integrityas specified in appendix D Both tests were modified forthe Battronic Minivan
Prior to delivery of the battery a 924-ampere (3-hrate) battery discharge test was conducted by the batterysupplier at his facility This test was used in place ofthe battery capacity test normally conducted before vehicletests The results of the test are shown in figure 15 Themeasured average capacity of the battery at 924 amperes was285 ampere-hours to a 476-volt-per-module cutoff voltageAs the manufacturer rated the battery at 277 ampere-hours atthe 924-ampere rate the battery passed the test
The cells in each battery module are permenantlyconnected together with lead connectors As theseconnectors cannot be easily loosened there was no need toconduct the 300-ampere terminal integrity test Theconnectors were inspected carefully and since there were novisible defects the battery was accepted
Controller
The Battronic Minivan controller was manufactured bythe General Electric Co The controller consists of an SCR
15
chopper bypass contactors and field weakening contactorsUp to about 80 percent of the maximum vehicle speed thespeed is controlled by applying a series of voltage pulsesto the motor As the accelerator pedal is-depressed boththe pulse width and the repetition rates are increased toincrease the percentage of time that the pulses are appliedto the motor -Increasing the percent of Uime-increases theaverage voltage applied to the motor and consequently itsspeed
At about 80 percent of the maximum vehicle speed theaverage value of motor voltage approaches the batteryvoltage Any difference results from controller lossesprimarily due to the voltage drop across the SCR Closingthe bypass contactor eliminates the controller voltage drop increasing the motor voltage and vehicle speed If shyadditional speed is desired the field weakening contactor is closed diverting some of the series field currentthrough a resistor This increases the motor speed
Information regarding the efficiency of the controllerin the chopper mode is not available Once the controlleris bypassed the only losses result from the contactor coilresistance and the small voltage drop across the contactsConsequently the controller efficiency approaches 100percent In the field weakening mode additional lossesappear in the resistor These losses reduce the controllerefficiency
Motor
The Battronic Minivan motor is a conventional DCseries-wound traction motor The motor was manufactured bythe General Electric Co The 04-hour rating of the motorwas 315 kilowatts (42 hp) at 2300 rpm 390 amperes and 94volts The motor has Class F insulation and an internalcooling fan
VEHICLE RELIABILITY
The Minivan was quite reliable during the test periodwith only three minor problems During a maximum-speedrange test at 84 kilometers per hour (52 mph) a 300-amperemotor protection fuse blew after approximately 8 minutesThe vehicle manufacturer recommended replacing the fuse witha 400-ampere fuse No further problems were encounteredwith the higher rating fuse During the test period thecharger timer failed The charger was operated without atimer for the rest of the test period The 12-volt chargeralso failed and had to be replaced early in the testprogram
16
APPENDIX A
VEHICLE SUMMARY DATA SHEET
10 Vehicle manufacturer Battronic Truck Corp
Bovertown Pa
20 Vehicle Battronic Minivan
30 Price and availability $15000 production upon request
40 Vehicle weight and load 41 Curb weight kg (bm) 2690 (5930) 42 Gross vehicle weight kg (Ibm) 2858 (6300)
43 Cargo weight kg (ibm) 227 (500) 44 Number of passengers 2
45 Payload kg(Ibm) 363 (800) including driver
50 Vehicle size 51 Wheelbase In (in) 240 (945)
52 Length m (in) 369 (145) 53 Width m(in) 198 (779) 54 Height m (in) 227 (89)
55 Head room m (in) 110 (435)
56 Legroom m(m) 037 (145)
57 Frontal area m2 (ft2) 39 (42) 58 Road clearance cm (in) 33 (13)
59 Number of seats 2
6 0 Auxiliaries and options
61 Lights (number type and function) 2 headlamp 2 park 2 brake 1 backup 2 sidelights at rear 2 sidelights
Data acquired from the test vehicle are conditionedonboard the vehicle and transmitted to the Data AcquisitionCenter where they are demodulated and recorded on magnetictape (fig B-I)
The following paragraphs provide a detailed descriptionof system components Instrumentation calibrationprocedures and test procedures relative to the dataacquisition system are also described
Signal Conditioning Equipment
The signal conditioning equipment has a modular orbuilding-block configuration The basic building block isthe remote signal conditioning module (RSCM) which consistsof all the necessary functions required to take the basictransducer information and store it on magnetic tape EachRSCM handles 14 data channels
Internally the RSCM consists of all the necessarycomponents required to signal condition modulate ontoInter-Range Instrumentation Group (IRIG) constant-bandwidthfrequency-modulated (FM) channels and transmit a transduceroutput signal to a remote tape recorder Figure B-2 is thesystem diagram defining this RSCM
The signal conditioning amplifiers in the front end ofthe RSCM provide suitable gain and balance to normalize alltransducer outputs into common formats and to drive thevoltage-controlled oscillators (VCOs) Each amplifier hasa built-in isolated bridge power supply regulated at 50volts DC that negates loading effects from other transducersand changes in output due to supply battery variationsThis power supply is used either alone divided down by01-percent metal film resistors or in series with othersupplies to provide a highly accurate and stable voltageinsertion calibration of the entire system channel by channel
The VCOs convert analog voltages to afrequency-modulated unbalanced signal The centerfrequencies of the VCOs are set at values defined by IRIG106-71 for constant-bandwidth channels (table B-l) The+25-volt outputs from the amplifier provide +100-percentdeviation of the VCOs Using a mix of A and B channelsprovides an optimum combination of data frequency responseresolution percentage of deviation and channel density in
22
each multiplex
The system is designed to provide 1000-hertz datachannel bandwidth on all A channels and 2000-hertz channelbandwidth on all B channels The 14 VCO outputs are mixedonto a common bus which provides the output signal to berecorded An external 28-volt battery is used to power theRSCM
Each RSCM weighs under 9 kilograms (20 lbm) and coversapproximately 390 square centimeters (60 in2 ) of floorspace All input and output connections and finaladjustments are accessible from the top of the module
System Accuracy
Table B-2 represents the system errors for the dataacquisition system The values are taken from the componentspecifications As there are several informationconversions through the system there was an attempt totranslate the specifications into a common error domainEach device in the system has a set of parameters thatrepresent its performance in a particular region of themultidimensional space (eg an accelerometer converts anacceleration into a voltage (actually an energy conversion)with some nonlinearity of information conversion) There isa conversion from analog voltage to frequency with acorresponding nonlinearity in the VCO The tape recorderhas to handle the information mechanically with highaccuracy because a change in tape speed represents a changein frequency which in turn represents a change in theoriginal analog voltage
Tape Recorders
The tape recorder has 14 IRIG-compatible channels withthe recording channels individually controlled so thatmultiple recording passes may be made on the same tapeCapstan speed accuracy of 001 percent is obtained by use ofa tape speed compensator system while flutter is held to022 percent Time base and dynamic skew are 05 and 25microseconds respectively
23
APPENDIX C
DESCRIPTION OF VEHICLE TEST TRACK
The test track used to conduct the tests described inthis report is located in Phoenix Arizona The track isowneamp and opeiated byDynamicScincea subsidiary ofTalley Industries
The test track is a paved continuous two-lane 32-kilometer- (2-mile-) long oval with an adjacent40 000-square-meter (10-acre) skid pad The inner lane ofthe track is not banked and was used for all cycle tests andall constant-speed tests of 56 kilometers per hour (35 mph)or under The outer lane has zero lateral acceleration at80 kilometers per hour (50 mph) and was used for tests over56 kilometers per hour (35 mph) An elevation survey of thetrack is shown in figure C-I Average grade is 066 percenton the northern straight section and 076 percent on thesouthern straight section The surface of the track andskid pad is asphaltic concrete with a dry locked-wheel skidnumber of 82 and a wet locked-wheel skid number of 71
Wet and dry braking-in-turn tests were conducted on theskid pad vet recovery tests were conducted on the testtrack after driving through the wet-brake water troughlocated near the northern straight section of the trackBoth 20- and 30-percent grades are available for parkingbrake tests
24
APPENDIX D
VEHICLE PREPARATION AND TEST PROCEDURE
Vehicle Preparation
When a vehicle was received at the test track a numberof checks were made to assure that it was ready forperformance tests These checks were recorded on a vehiclepreparation check sheet such as the one shown in figureD-l The vehicle was examined for physical damage when it was removed from the transport truck and before it wasaccepted from the shipper Before the vehicle was operateda complete visual check was made of the entire vehicleincluding wiring batteries motor and controller Thevehicle was weighed and compared with the manufacturersspecified curb weight The gross vehicle weight (GVW) wasdetermined from the vehicle sticker GVW If themanufacturer did not recommend a GVW it was determined byadding 68 kilograms (150 lbm) per passenger plus any payloadweight to the vehicle curb weight
The wheel alignment was checked compared andcorrected to the manufacturers recommended alignmentvalues The battery was charged and specific gravitiestaken to determine if the batteries were equalized If notan equalizing charge was applied to the batteries Theintegrity of the internal interconnections and the batteryterminals was checked by drawing either 300 amperes or thevehicle manufacturers maximum allowed current load from thebattery through a load bank for 5 minutes If thetemperature of the battery terminals or interconnectionsrose more than 60 degrees Celsius above ambient the test was terminated and the terminal was cleaned or the batteryreplaced The batteries were then recharged and a battery capacity check was made The battery was discharged inaccordance with the battery manufacturers recommendationsTo pass this test the capacity must be within 20 percent ofthe manufacturers published capacity at the published rate
The vehicle manufacturer was contacted for hisrecommendations concerning the maximum speed of the vehicletire pressures and procedures for driving the vehicle Thevehicle was photographed head-on with a 270-millimetertelephoto lens from a distance of about 305 meters (100 ft)in order to determine the frontal area
Test Procedure
Each day before a test a test checklist was usedTwo samples of these checklists are shown in figure D-2
25
The first item under driver instructions on the testchecklist is to complete the pretest checklist (fig D-3)
Data taken before during and after each test wereentered on the vehicle data sheet (fig D-4) These datainclude
(1) Average specific gravity of the battery
(2) Tire pressures
(3) Fifth-wheel tire pressure
(4) Test weight of the vehicle
(5) Weather information
(6) Battery temperatures
(7) Time the test was started
(8) Time the test was stopped
(9) Ampere-hours out of the battery
(10) Fifth-wheel distance count
(11) Odometer readings before and after the tests
The battery charge data taken during the charge cycle werealso recorded on this data sheet These data include theaverage specific gravity of the battery after the test thekilowatt-hours and ampere-hours put into the battery duringthe charge and the total time of the charge
To prepare for a test the specific gravities werefirst measured for each cell and recorded The tirepressures were measured and the vehicle was weighed Theweight was brought up to the GVW by adding sandbags Theinstrumentation was connected and power from theinstrumentation battery was applied All instruments wereturned on and warmed up The vehicle was towed to thestarting point on the track If the data were beingtelemetered precalibrations were applied to both themagnetic tape and the oscillograph The fifth-wheeldistance counter and ampere-hour integrator counter werereset to zero and thermocouple reference 3unctions wereturned on The test was started and was carried out inaccordance with the test checklist When the test wasterminated the vehicle was brought to a stop and thepost-test checks were made in accordance with the post-test
26
checklist (fig D-5) The driver recorded on the vehicledata sheet the time the odometer reading the ampere hourintegrator reading and the fifth-wheel distance readingThe post-calibration steps were then applied to the magnetictape and the oscillograph At the end of the test weatherdata were recorded on the vehicle data sheet Allinstrumentation power was turned off the instrumentationbattery was disconnected and the fifth wheel was raisedThe vehicle was then towed back to the garage the post-testspecific gravities were measured for all cells and thevehicle was placed on charge
After the test the engineer conducting the test completed a test summary sheet (fig D-6) This data sheetprovides a brief summary of the pertinent informationreceived from the test Another data sheet the engineersdata sheet (fig D-7) was also filled out This data sheetsummarizes the engineers evaluation of the test andprovides a record of problems malfunctions changes toinstrumentation etc that occurred during the test
Weather data - Wind velocity and direction and ambienttemperature were measured at the beginning and at the end ofeach test and every hour during the test The windanemometer was located about 18 meters (6 ft) from theground near the southern straight section of the track Theambient temperature readings were taken at theinstrumentation trailer near the west curve of the trackDuring most of the test period the winds were variable andgusty
Determination of maximum speed - The maximum speed ofthe vehicle was determined in the following manner Thevehicle was fully charged and loaded to gross vehicleweight After one warmup lap the vehicle was driven atwide-open throttle for three laps around the track Theminimum speed for each lap was recorded and the average wascalculated This average was called the vehicle maximumspeed This speed takes into account track variability andmaximum vehicle loading This quantity was then reduced by5 percent and called the recommended maximum cruise testspeed
Cycle timer - The cycle timer (fig D-8) was designedto assist the Vehicle driver in accurately driving SAEschedules B C and D The required test profile ispermanently stored on a programmable read-only memory(PROM) which is the heart of the instrument This profile is continuously reproduced on one needle of a dual-movementanalog meter shown in the figure The second needle isconnected to the output of the fifth wheel and the driver
27
matches needles to accurately drive the required schedule
One second before each speed transition (egacceleration to cruise or cruise to coast) an audio signalsounds to forewarn the driver of a change A longerduration audio signal sounds after the idle period toephasfze the st-art of a new cycle The total number oftest cycles driven is stored in a counter and can bedisplayed at any time with a pushbutton (to conserve power)
28
REFERENCES
1 Sargent Noel B Maslowski Edward A Soltis RichardF and Schuh Richard M Baseline Tests of the C H Waterman DAF Electric Passenger Vehicle NASA TM-737571977
2 Society of Automotive Engineers Inc Electric VehicleTest Procedure - SAE J227a Feb 1976
3 Battronics Minivan Service and Parts Manual BattronicTruck Corp Boyertown Pa
4 Franz Gary J Performance and Operation Tests of aBattery Powered Multi-Purpose Work Vehicle Manufacturedby Boyertown Auto Body Works Boyertown Pennsylvaniafor the Electric Vehicle Council New York New YorkDana Corp 1973
29
I - SL OF T R S FOR MTTA C nNIVAN
(a) sI nut+s
Test-date ar Test ohton n Wind Teper- -Range- Cycle Curret Cr t Dergy Tndicatd (oistant speed
Figure B-2 - Remote signal conditioning modulediagram
ORIGINAL PAGE IS OE POOR QUALITY44
DISTANCE km (1t) (9000) (8000) (7000)
1 shy3ORTlHERN $1RAIGHi 0
0(
2)5 SOUTHERN STRAIGHT- 5 000)1-3
0
DI00) (2000) (3000) (4 0O)
(a)Track diagram
12shy
z- 4
1shy
-12 - -8 II II I
(b)Grade -- 12 [NO4- 10- SOUTHERN NORTHERN
STRAIGHT STRAIGHT
30 I 25 - 2
Fz 20 I 15 0 4 I
10 5 21
0 J ORIGINAL PAGE l o 10002O0
DISTANCE in 400~opOO IAT
POOR QUALM I I I I I I 0 2000 4000 6000 8000 10000
DISTANCE ft
(c)Elevation
Figure C-I - Characteristics of Dynamic Science Test Track Phoenix Arizona
1 Vehicle
2 Date received 3 Checked for damage - date 4 Wheel alignment -date 5 Battery checked and equalized - date 6 Curb weight determined Ibm Date 7 Gross vehicle weight Ibm
8 300-Ampere test - date 9 Manufacturers recommendations
Maximum speed mph Tire pressures psi Front Rear Driving procedures
Figure D-1 - Vehicle preparation check sheet
45
Vehicle _m -- mph range test ___ gear
Driver Instructions1 Complete pretest checklist2 While on track recheck
Integrator - light on in operate position zeroed Speedometer - set on _ mph center Vehicle __cycle test gearDistance - on reset lighted Attenuator - on reset lighted Driver Instructons
3 At signal from control center accelerate moderately to _ mph I Complete pretest checklist 4Maintain -+ mph with minimal accelerator movement 2While on track recheck5 Integrator - light on in operate position zeroedSWhen vehicle isno longer able to maintain __ mph brake moderately to full stop Speedometer - set on - mph center 6Complete post-test checklist and other documentation Distance - on reset lightedRecording Attenuator - on reset selector on 1001 Set oscillograph zeros at Channel] Zero in Cycle timer - verify scheduled timing with stop watch
3 30 3At signal from control center perform cycletest using cycle timer as basis for detershy4 4 5 mining length of each phase of performance cycle Use programmed stop watch as 6 5 0 backup device Cycle Consists of
o 10 75 Accelerate to __ mph in __ s 12 11 Cruise at mph for s 13 12 14 20 Coast for s
2Record all channels on magnetic tape Check inputs at beginning of test to verify Brake to complete stop in s recording Hold in stop position for _ s
3Run cals on all channels Repeat entire cycle until vehicle isunable to meet acceleration time Moderately brake 4 Remove all channels from oscillograph except 3and 4 to acomplete stop 5 Start recording 15 sbefore start of test at oscillograph speed of 01Inls and tape speed 4 Complete post-test checklist and other documentation
of Lnls Recordingshy6After 15 min into test connect channels 6 10 12 13 and 14 to oscillograph and record 1Record all channels on magnetic tape at_ ins Check all channels to veriy
aburst at 100 nis while veh icle is in chopper mode input at beginning of test 7Remove channels 6 10 12 13 and 14 from oscillograph and continue test at 0 1 ins 2Record speed and distance on oscillograph at_ mns
with channels 3and 4only 3 Start recordingdata 15 sbefore beginning test 8 Document all ambient conditions at beginning once every hou rand at the end of the 4Document ambient conditions at beginning once every hour and at the end of the testtest Items recorded shall include temperature wind speed and direction significant Items recorded shall include temperature wind speed and direction significant windwind gusts and corrected barometric pressure gusts and corrected barometric pressure
-J (al Constant-speed test t)) Driving cycle test v i7)Figure D-2 - Test checklists
0-~
1 Record specific gravity readings after removing vehicle from charge and disconnect charger instrumentation Fill in charge data portion of data sheet from previous test Add water to batteries as necessary recording amount added Check and reshycord 5th wheel tire pressure and vehicle tire pressure
2 Connect (Connect alligator clips to instrumentation battery last))neter on a strument battery a
(a)inverter to instrument batterygo)Integrator input leadTeprteF
(c) Integrator power to inverter d)Starred Hf5th wheel jumper cable e)Cycle timer power and speed signal input cables (f)Spn up and calibrate 5th wheel
Check times
3 Record test weight - includes driver and ballast with 5th wheel raised
eN 4 Turn on (a)Inverter motor speed sensor thermocouple reference junctions integrator
and digital voltmeter Set integrator on Operate (b)Fifth wheel readout and switching interface units (2) (Select distance for exshy
panded scale range )
C C 1
5 Tow vehicle onto track with 5th wheel raised Precalhbrations
Tape data system Oscillograph
Reset 5th wheel distance Ampere-hour meter Thermocouple readout switches on Record
Turn on thermocouple reference junctions Lower 5th wheel Set hub loading
6Be sure data sheet isproperly filled out to this point tower
Check watch time with control
7 Proceed with test
Figure D-3 - Pretest checklist
Vehicle Battery system
Test Date Track data Driver Navigator
Average pretest specific gravity Open-circuit voltage V Tire pressure before test psi
Right front_ Left front Right rear Left rear Tire pressure after test psi
Right front __ Left front Right rear__ Left rear Fifth-wheel pressure psi _ (calibrated __ psi)Weather Initial Duringtest Final
Temperature OF Wind speed mph Wind direction Pressure in Hg
Battery temperature OF Before After Motor temperature OF Before After
Time Start Stop _
Odometer reading miles Start _ Stop Current out Ah _ Current in (regenerative) Ah Fifth wheel Basis for termination of tests
Charge data Average post-test specific gravity Open-circuit voltage V Charger used Charger input voltage V Battery temperature OF Before charge After charge _ Power kwh Start End Tota I Time Start EndTotal charge time mm
Current iput Ah Average specific gravity after charge
Approval
Figure D-4 - Track and charge data
1 Recordtime immediately at completion of test Turn off key switch
2 Complete track data sheet (a)Odometer stop0) Ampere-hour integrator(c)5th wheel distance (d)Read temperature (e)Calibrate data system (f) Record weather data
3 Turn off inverter thermocouple reference junctions
4 Disconnect 12-olt instrument battery red lead
5 Raise 5th wheel
6 Tow vehicle off track
7 Start charge procedure (specific gravities)
8 Check specific gravityon instrument battery If less than 1 220 remove from vehicle and charge to full capacity
9 Check water level in accessory batteries Add water as necessary
Figure D-5 - Post-test checklist
Vehicle Test Date Test conditions
Temperature OF Wind speed mph _ at Barometer reading in Hg _ Other
Test results Test time h Range milesCyclesCurrent out of battery AhCurrent into battery AhCharge time hPower into battery kWh
Magnetic tape NO_ Speed ins
Comments
Figure D-6 - Test summary sheet
48
Vehicle Test Date Engineer Reason for test tcheccout component check scheduled test etc)
Limitation on test tmalfunction data system protlem brake drag etc)
Changes to vehicle prior to test (repair change batteries etc)
Other comments
Evaluation of test Range miles
Current out Ah
Current in Al
Power in kWh
Energy consumption kWhlmile Was planned driving cycle followed
General comments
Figure D-7 - Engineers data sheet
112
Figure D-amp - Cycle timer
49 ORIGINAL PAGE iaOF POR QUALr1
NATIONAL AERONAUTICS AND SPACE ADMINISTRATION WASHINGTON D C 20546
________POSTAGE AND FEES PALO NATIONAI AERONAUTICS ANDOFFICIAL BUSINESS SPACE ADMINIS1RATION
PENALTY FOR PIVATE uSE $30o SPECIAL FOURTH-CLASS RATE 45I
BOOK 4S
(Section 158If UndeliverablePOSTMASTR Pota anual) Do Not Return
106 Size m(in) height 055 (215) width 025 (10)
length 056 (22)
107 Weight kg (Ibm)
108 Automatic turnoff feature yes
110 Body
111 Manufacturer and type Battronic van
I 2 Materials steel
113 Number of doors and type 3 left and right sliding rear hinqed
114 Number of windows and type 2 pane windshield 1 pane eachfront quarter 2 pane sliding each side door 1 pane eachrear quarter 1 pane rear door
115 Number of seats and type 2 bucket front
116 Cargo space volume m 3 (ft 476 (168)
117 Cargo space dimensions m (ft) height 163 (64) width183 (72) length 183 (72) minus wheel well
120 Chassis
121 Frame1211 Type and manufacturer Battronic Truck Corp box
1212 Materials steel
121 3 Modifications
122 Springs and shocks1221 Type and manufacturer springs - 6 leaf laminated
Data acquired from the test vehicle are conditionedonboard the vehicle and transmitted to the Data AcquisitionCenter where they are demodulated and recorded on magnetictape (fig B-I)
The following paragraphs provide a detailed descriptionof system components Instrumentation calibrationprocedures and test procedures relative to the dataacquisition system are also described
Signal Conditioning Equipment
The signal conditioning equipment has a modular orbuilding-block configuration The basic building block isthe remote signal conditioning module (RSCM) which consistsof all the necessary functions required to take the basictransducer information and store it on magnetic tape EachRSCM handles 14 data channels
Internally the RSCM consists of all the necessarycomponents required to signal condition modulate ontoInter-Range Instrumentation Group (IRIG) constant-bandwidthfrequency-modulated (FM) channels and transmit a transduceroutput signal to a remote tape recorder Figure B-2 is thesystem diagram defining this RSCM
The signal conditioning amplifiers in the front end ofthe RSCM provide suitable gain and balance to normalize alltransducer outputs into common formats and to drive thevoltage-controlled oscillators (VCOs) Each amplifier hasa built-in isolated bridge power supply regulated at 50volts DC that negates loading effects from other transducersand changes in output due to supply battery variationsThis power supply is used either alone divided down by01-percent metal film resistors or in series with othersupplies to provide a highly accurate and stable voltageinsertion calibration of the entire system channel by channel
The VCOs convert analog voltages to afrequency-modulated unbalanced signal The centerfrequencies of the VCOs are set at values defined by IRIG106-71 for constant-bandwidth channels (table B-l) The+25-volt outputs from the amplifier provide +100-percentdeviation of the VCOs Using a mix of A and B channelsprovides an optimum combination of data frequency responseresolution percentage of deviation and channel density in
22
each multiplex
The system is designed to provide 1000-hertz datachannel bandwidth on all A channels and 2000-hertz channelbandwidth on all B channels The 14 VCO outputs are mixedonto a common bus which provides the output signal to berecorded An external 28-volt battery is used to power theRSCM
Each RSCM weighs under 9 kilograms (20 lbm) and coversapproximately 390 square centimeters (60 in2 ) of floorspace All input and output connections and finaladjustments are accessible from the top of the module
System Accuracy
Table B-2 represents the system errors for the dataacquisition system The values are taken from the componentspecifications As there are several informationconversions through the system there was an attempt totranslate the specifications into a common error domainEach device in the system has a set of parameters thatrepresent its performance in a particular region of themultidimensional space (eg an accelerometer converts anacceleration into a voltage (actually an energy conversion)with some nonlinearity of information conversion) There isa conversion from analog voltage to frequency with acorresponding nonlinearity in the VCO The tape recorderhas to handle the information mechanically with highaccuracy because a change in tape speed represents a changein frequency which in turn represents a change in theoriginal analog voltage
Tape Recorders
The tape recorder has 14 IRIG-compatible channels withthe recording channels individually controlled so thatmultiple recording passes may be made on the same tapeCapstan speed accuracy of 001 percent is obtained by use ofa tape speed compensator system while flutter is held to022 percent Time base and dynamic skew are 05 and 25microseconds respectively
23
APPENDIX C
DESCRIPTION OF VEHICLE TEST TRACK
The test track used to conduct the tests described inthis report is located in Phoenix Arizona The track isowneamp and opeiated byDynamicScincea subsidiary ofTalley Industries
The test track is a paved continuous two-lane 32-kilometer- (2-mile-) long oval with an adjacent40 000-square-meter (10-acre) skid pad The inner lane ofthe track is not banked and was used for all cycle tests andall constant-speed tests of 56 kilometers per hour (35 mph)or under The outer lane has zero lateral acceleration at80 kilometers per hour (50 mph) and was used for tests over56 kilometers per hour (35 mph) An elevation survey of thetrack is shown in figure C-I Average grade is 066 percenton the northern straight section and 076 percent on thesouthern straight section The surface of the track andskid pad is asphaltic concrete with a dry locked-wheel skidnumber of 82 and a wet locked-wheel skid number of 71
Wet and dry braking-in-turn tests were conducted on theskid pad vet recovery tests were conducted on the testtrack after driving through the wet-brake water troughlocated near the northern straight section of the trackBoth 20- and 30-percent grades are available for parkingbrake tests
24
APPENDIX D
VEHICLE PREPARATION AND TEST PROCEDURE
Vehicle Preparation
When a vehicle was received at the test track a numberof checks were made to assure that it was ready forperformance tests These checks were recorded on a vehiclepreparation check sheet such as the one shown in figureD-l The vehicle was examined for physical damage when it was removed from the transport truck and before it wasaccepted from the shipper Before the vehicle was operateda complete visual check was made of the entire vehicleincluding wiring batteries motor and controller Thevehicle was weighed and compared with the manufacturersspecified curb weight The gross vehicle weight (GVW) wasdetermined from the vehicle sticker GVW If themanufacturer did not recommend a GVW it was determined byadding 68 kilograms (150 lbm) per passenger plus any payloadweight to the vehicle curb weight
The wheel alignment was checked compared andcorrected to the manufacturers recommended alignmentvalues The battery was charged and specific gravitiestaken to determine if the batteries were equalized If notan equalizing charge was applied to the batteries Theintegrity of the internal interconnections and the batteryterminals was checked by drawing either 300 amperes or thevehicle manufacturers maximum allowed current load from thebattery through a load bank for 5 minutes If thetemperature of the battery terminals or interconnectionsrose more than 60 degrees Celsius above ambient the test was terminated and the terminal was cleaned or the batteryreplaced The batteries were then recharged and a battery capacity check was made The battery was discharged inaccordance with the battery manufacturers recommendationsTo pass this test the capacity must be within 20 percent ofthe manufacturers published capacity at the published rate
The vehicle manufacturer was contacted for hisrecommendations concerning the maximum speed of the vehicletire pressures and procedures for driving the vehicle Thevehicle was photographed head-on with a 270-millimetertelephoto lens from a distance of about 305 meters (100 ft)in order to determine the frontal area
Test Procedure
Each day before a test a test checklist was usedTwo samples of these checklists are shown in figure D-2
25
The first item under driver instructions on the testchecklist is to complete the pretest checklist (fig D-3)
Data taken before during and after each test wereentered on the vehicle data sheet (fig D-4) These datainclude
(1) Average specific gravity of the battery
(2) Tire pressures
(3) Fifth-wheel tire pressure
(4) Test weight of the vehicle
(5) Weather information
(6) Battery temperatures
(7) Time the test was started
(8) Time the test was stopped
(9) Ampere-hours out of the battery
(10) Fifth-wheel distance count
(11) Odometer readings before and after the tests
The battery charge data taken during the charge cycle werealso recorded on this data sheet These data include theaverage specific gravity of the battery after the test thekilowatt-hours and ampere-hours put into the battery duringthe charge and the total time of the charge
To prepare for a test the specific gravities werefirst measured for each cell and recorded The tirepressures were measured and the vehicle was weighed Theweight was brought up to the GVW by adding sandbags Theinstrumentation was connected and power from theinstrumentation battery was applied All instruments wereturned on and warmed up The vehicle was towed to thestarting point on the track If the data were beingtelemetered precalibrations were applied to both themagnetic tape and the oscillograph The fifth-wheeldistance counter and ampere-hour integrator counter werereset to zero and thermocouple reference 3unctions wereturned on The test was started and was carried out inaccordance with the test checklist When the test wasterminated the vehicle was brought to a stop and thepost-test checks were made in accordance with the post-test
26
checklist (fig D-5) The driver recorded on the vehicledata sheet the time the odometer reading the ampere hourintegrator reading and the fifth-wheel distance readingThe post-calibration steps were then applied to the magnetictape and the oscillograph At the end of the test weatherdata were recorded on the vehicle data sheet Allinstrumentation power was turned off the instrumentationbattery was disconnected and the fifth wheel was raisedThe vehicle was then towed back to the garage the post-testspecific gravities were measured for all cells and thevehicle was placed on charge
After the test the engineer conducting the test completed a test summary sheet (fig D-6) This data sheetprovides a brief summary of the pertinent informationreceived from the test Another data sheet the engineersdata sheet (fig D-7) was also filled out This data sheetsummarizes the engineers evaluation of the test andprovides a record of problems malfunctions changes toinstrumentation etc that occurred during the test
Weather data - Wind velocity and direction and ambienttemperature were measured at the beginning and at the end ofeach test and every hour during the test The windanemometer was located about 18 meters (6 ft) from theground near the southern straight section of the track Theambient temperature readings were taken at theinstrumentation trailer near the west curve of the trackDuring most of the test period the winds were variable andgusty
Determination of maximum speed - The maximum speed ofthe vehicle was determined in the following manner Thevehicle was fully charged and loaded to gross vehicleweight After one warmup lap the vehicle was driven atwide-open throttle for three laps around the track Theminimum speed for each lap was recorded and the average wascalculated This average was called the vehicle maximumspeed This speed takes into account track variability andmaximum vehicle loading This quantity was then reduced by5 percent and called the recommended maximum cruise testspeed
Cycle timer - The cycle timer (fig D-8) was designedto assist the Vehicle driver in accurately driving SAEschedules B C and D The required test profile ispermanently stored on a programmable read-only memory(PROM) which is the heart of the instrument This profile is continuously reproduced on one needle of a dual-movementanalog meter shown in the figure The second needle isconnected to the output of the fifth wheel and the driver
27
matches needles to accurately drive the required schedule
One second before each speed transition (egacceleration to cruise or cruise to coast) an audio signalsounds to forewarn the driver of a change A longerduration audio signal sounds after the idle period toephasfze the st-art of a new cycle The total number oftest cycles driven is stored in a counter and can bedisplayed at any time with a pushbutton (to conserve power)
28
REFERENCES
1 Sargent Noel B Maslowski Edward A Soltis RichardF and Schuh Richard M Baseline Tests of the C H Waterman DAF Electric Passenger Vehicle NASA TM-737571977
2 Society of Automotive Engineers Inc Electric VehicleTest Procedure - SAE J227a Feb 1976
3 Battronics Minivan Service and Parts Manual BattronicTruck Corp Boyertown Pa
4 Franz Gary J Performance and Operation Tests of aBattery Powered Multi-Purpose Work Vehicle Manufacturedby Boyertown Auto Body Works Boyertown Pennsylvaniafor the Electric Vehicle Council New York New YorkDana Corp 1973
29
I - SL OF T R S FOR MTTA C nNIVAN
(a) sI nut+s
Test-date ar Test ohton n Wind Teper- -Range- Cycle Curret Cr t Dergy Tndicatd (oistant speed
Figure B-2 - Remote signal conditioning modulediagram
ORIGINAL PAGE IS OE POOR QUALITY44
DISTANCE km (1t) (9000) (8000) (7000)
1 shy3ORTlHERN $1RAIGHi 0
0(
2)5 SOUTHERN STRAIGHT- 5 000)1-3
0
DI00) (2000) (3000) (4 0O)
(a)Track diagram
12shy
z- 4
1shy
-12 - -8 II II I
(b)Grade -- 12 [NO4- 10- SOUTHERN NORTHERN
STRAIGHT STRAIGHT
30 I 25 - 2
Fz 20 I 15 0 4 I
10 5 21
0 J ORIGINAL PAGE l o 10002O0
DISTANCE in 400~opOO IAT
POOR QUALM I I I I I I 0 2000 4000 6000 8000 10000
DISTANCE ft
(c)Elevation
Figure C-I - Characteristics of Dynamic Science Test Track Phoenix Arizona
1 Vehicle
2 Date received 3 Checked for damage - date 4 Wheel alignment -date 5 Battery checked and equalized - date 6 Curb weight determined Ibm Date 7 Gross vehicle weight Ibm
8 300-Ampere test - date 9 Manufacturers recommendations
Maximum speed mph Tire pressures psi Front Rear Driving procedures
Figure D-1 - Vehicle preparation check sheet
45
Vehicle _m -- mph range test ___ gear
Driver Instructions1 Complete pretest checklist2 While on track recheck
Integrator - light on in operate position zeroed Speedometer - set on _ mph center Vehicle __cycle test gearDistance - on reset lighted Attenuator - on reset lighted Driver Instructons
3 At signal from control center accelerate moderately to _ mph I Complete pretest checklist 4Maintain -+ mph with minimal accelerator movement 2While on track recheck5 Integrator - light on in operate position zeroedSWhen vehicle isno longer able to maintain __ mph brake moderately to full stop Speedometer - set on - mph center 6Complete post-test checklist and other documentation Distance - on reset lightedRecording Attenuator - on reset selector on 1001 Set oscillograph zeros at Channel] Zero in Cycle timer - verify scheduled timing with stop watch
3 30 3At signal from control center perform cycletest using cycle timer as basis for detershy4 4 5 mining length of each phase of performance cycle Use programmed stop watch as 6 5 0 backup device Cycle Consists of
o 10 75 Accelerate to __ mph in __ s 12 11 Cruise at mph for s 13 12 14 20 Coast for s
2Record all channels on magnetic tape Check inputs at beginning of test to verify Brake to complete stop in s recording Hold in stop position for _ s
3Run cals on all channels Repeat entire cycle until vehicle isunable to meet acceleration time Moderately brake 4 Remove all channels from oscillograph except 3and 4 to acomplete stop 5 Start recording 15 sbefore start of test at oscillograph speed of 01Inls and tape speed 4 Complete post-test checklist and other documentation
of Lnls Recordingshy6After 15 min into test connect channels 6 10 12 13 and 14 to oscillograph and record 1Record all channels on magnetic tape at_ ins Check all channels to veriy
aburst at 100 nis while veh icle is in chopper mode input at beginning of test 7Remove channels 6 10 12 13 and 14 from oscillograph and continue test at 0 1 ins 2Record speed and distance on oscillograph at_ mns
with channels 3and 4only 3 Start recordingdata 15 sbefore beginning test 8 Document all ambient conditions at beginning once every hou rand at the end of the 4Document ambient conditions at beginning once every hour and at the end of the testtest Items recorded shall include temperature wind speed and direction significant Items recorded shall include temperature wind speed and direction significant windwind gusts and corrected barometric pressure gusts and corrected barometric pressure
-J (al Constant-speed test t)) Driving cycle test v i7)Figure D-2 - Test checklists
0-~
1 Record specific gravity readings after removing vehicle from charge and disconnect charger instrumentation Fill in charge data portion of data sheet from previous test Add water to batteries as necessary recording amount added Check and reshycord 5th wheel tire pressure and vehicle tire pressure
2 Connect (Connect alligator clips to instrumentation battery last))neter on a strument battery a
(a)inverter to instrument batterygo)Integrator input leadTeprteF
(c) Integrator power to inverter d)Starred Hf5th wheel jumper cable e)Cycle timer power and speed signal input cables (f)Spn up and calibrate 5th wheel
Check times
3 Record test weight - includes driver and ballast with 5th wheel raised
eN 4 Turn on (a)Inverter motor speed sensor thermocouple reference junctions integrator
and digital voltmeter Set integrator on Operate (b)Fifth wheel readout and switching interface units (2) (Select distance for exshy
panded scale range )
C C 1
5 Tow vehicle onto track with 5th wheel raised Precalhbrations
Tape data system Oscillograph
Reset 5th wheel distance Ampere-hour meter Thermocouple readout switches on Record
Turn on thermocouple reference junctions Lower 5th wheel Set hub loading
6Be sure data sheet isproperly filled out to this point tower
Check watch time with control
7 Proceed with test
Figure D-3 - Pretest checklist
Vehicle Battery system
Test Date Track data Driver Navigator
Average pretest specific gravity Open-circuit voltage V Tire pressure before test psi
Right front_ Left front Right rear Left rear Tire pressure after test psi
Right front __ Left front Right rear__ Left rear Fifth-wheel pressure psi _ (calibrated __ psi)Weather Initial Duringtest Final
Temperature OF Wind speed mph Wind direction Pressure in Hg
Battery temperature OF Before After Motor temperature OF Before After
Time Start Stop _
Odometer reading miles Start _ Stop Current out Ah _ Current in (regenerative) Ah Fifth wheel Basis for termination of tests
Charge data Average post-test specific gravity Open-circuit voltage V Charger used Charger input voltage V Battery temperature OF Before charge After charge _ Power kwh Start End Tota I Time Start EndTotal charge time mm
Current iput Ah Average specific gravity after charge
Approval
Figure D-4 - Track and charge data
1 Recordtime immediately at completion of test Turn off key switch
2 Complete track data sheet (a)Odometer stop0) Ampere-hour integrator(c)5th wheel distance (d)Read temperature (e)Calibrate data system (f) Record weather data
3 Turn off inverter thermocouple reference junctions
4 Disconnect 12-olt instrument battery red lead
5 Raise 5th wheel
6 Tow vehicle off track
7 Start charge procedure (specific gravities)
8 Check specific gravityon instrument battery If less than 1 220 remove from vehicle and charge to full capacity
9 Check water level in accessory batteries Add water as necessary
Figure D-5 - Post-test checklist
Vehicle Test Date Test conditions
Temperature OF Wind speed mph _ at Barometer reading in Hg _ Other
Test results Test time h Range milesCyclesCurrent out of battery AhCurrent into battery AhCharge time hPower into battery kWh
Magnetic tape NO_ Speed ins
Comments
Figure D-6 - Test summary sheet
48
Vehicle Test Date Engineer Reason for test tcheccout component check scheduled test etc)
Limitation on test tmalfunction data system protlem brake drag etc)
Changes to vehicle prior to test (repair change batteries etc)
Other comments
Evaluation of test Range miles
Current out Ah
Current in Al
Power in kWh
Energy consumption kWhlmile Was planned driving cycle followed
General comments
Figure D-7 - Engineers data sheet
112
Figure D-amp - Cycle timer
49 ORIGINAL PAGE iaOF POR QUALr1
NATIONAL AERONAUTICS AND SPACE ADMINISTRATION WASHINGTON D C 20546
________POSTAGE AND FEES PALO NATIONAI AERONAUTICS ANDOFFICIAL BUSINESS SPACE ADMINIS1RATION
PENALTY FOR PIVATE uSE $30o SPECIAL FOURTH-CLASS RATE 45I
BOOK 4S
(Section 158If UndeliverablePOSTMASTR Pota anual) Do Not Return
1242 Gear ratios rear axle 307 transfer box 11 and
1196
1243 Driveline ratio 6021 and 3071
125 Steering1251 Type and manufacturer worm and nut (recirculating
ball) Saginaw
1252 Turning ratio 241
1253 Turning diameter m (ft) 113 (37)
12 6 Brakes 1261 Front hydraulic drum
1262 Rear hydraulic drum
12 63 Parking mechanical on rear axle two-position cable
1264 Regenerative no
12 7 Tires127 1 Manufacturer and type Firestone Transport 110 6-ply
rating load range C
12 72 Size 670-15 1273 Pressure kPa (psi)
(45)Front 310
Rear 310 (45)
1274 Rolling radius m (in) 033 (129)1275 Wheel weight kg (ibm)
Without drum
With drum 23 (507)
1276 Wheel track m (in)
FrontRear
130 Performance131 Manufacturer-specified maximum speed (wide-open throttle) kmh (mph)
132 Manufacturer-recommended maximum cruise speed (wide-open throttle)
Data acquired from the test vehicle are conditionedonboard the vehicle and transmitted to the Data AcquisitionCenter where they are demodulated and recorded on magnetictape (fig B-I)
The following paragraphs provide a detailed descriptionof system components Instrumentation calibrationprocedures and test procedures relative to the dataacquisition system are also described
Signal Conditioning Equipment
The signal conditioning equipment has a modular orbuilding-block configuration The basic building block isthe remote signal conditioning module (RSCM) which consistsof all the necessary functions required to take the basictransducer information and store it on magnetic tape EachRSCM handles 14 data channels
Internally the RSCM consists of all the necessarycomponents required to signal condition modulate ontoInter-Range Instrumentation Group (IRIG) constant-bandwidthfrequency-modulated (FM) channels and transmit a transduceroutput signal to a remote tape recorder Figure B-2 is thesystem diagram defining this RSCM
The signal conditioning amplifiers in the front end ofthe RSCM provide suitable gain and balance to normalize alltransducer outputs into common formats and to drive thevoltage-controlled oscillators (VCOs) Each amplifier hasa built-in isolated bridge power supply regulated at 50volts DC that negates loading effects from other transducersand changes in output due to supply battery variationsThis power supply is used either alone divided down by01-percent metal film resistors or in series with othersupplies to provide a highly accurate and stable voltageinsertion calibration of the entire system channel by channel
The VCOs convert analog voltages to afrequency-modulated unbalanced signal The centerfrequencies of the VCOs are set at values defined by IRIG106-71 for constant-bandwidth channels (table B-l) The+25-volt outputs from the amplifier provide +100-percentdeviation of the VCOs Using a mix of A and B channelsprovides an optimum combination of data frequency responseresolution percentage of deviation and channel density in
22
each multiplex
The system is designed to provide 1000-hertz datachannel bandwidth on all A channels and 2000-hertz channelbandwidth on all B channels The 14 VCO outputs are mixedonto a common bus which provides the output signal to berecorded An external 28-volt battery is used to power theRSCM
Each RSCM weighs under 9 kilograms (20 lbm) and coversapproximately 390 square centimeters (60 in2 ) of floorspace All input and output connections and finaladjustments are accessible from the top of the module
System Accuracy
Table B-2 represents the system errors for the dataacquisition system The values are taken from the componentspecifications As there are several informationconversions through the system there was an attempt totranslate the specifications into a common error domainEach device in the system has a set of parameters thatrepresent its performance in a particular region of themultidimensional space (eg an accelerometer converts anacceleration into a voltage (actually an energy conversion)with some nonlinearity of information conversion) There isa conversion from analog voltage to frequency with acorresponding nonlinearity in the VCO The tape recorderhas to handle the information mechanically with highaccuracy because a change in tape speed represents a changein frequency which in turn represents a change in theoriginal analog voltage
Tape Recorders
The tape recorder has 14 IRIG-compatible channels withthe recording channels individually controlled so thatmultiple recording passes may be made on the same tapeCapstan speed accuracy of 001 percent is obtained by use ofa tape speed compensator system while flutter is held to022 percent Time base and dynamic skew are 05 and 25microseconds respectively
23
APPENDIX C
DESCRIPTION OF VEHICLE TEST TRACK
The test track used to conduct the tests described inthis report is located in Phoenix Arizona The track isowneamp and opeiated byDynamicScincea subsidiary ofTalley Industries
The test track is a paved continuous two-lane 32-kilometer- (2-mile-) long oval with an adjacent40 000-square-meter (10-acre) skid pad The inner lane ofthe track is not banked and was used for all cycle tests andall constant-speed tests of 56 kilometers per hour (35 mph)or under The outer lane has zero lateral acceleration at80 kilometers per hour (50 mph) and was used for tests over56 kilometers per hour (35 mph) An elevation survey of thetrack is shown in figure C-I Average grade is 066 percenton the northern straight section and 076 percent on thesouthern straight section The surface of the track andskid pad is asphaltic concrete with a dry locked-wheel skidnumber of 82 and a wet locked-wheel skid number of 71
Wet and dry braking-in-turn tests were conducted on theskid pad vet recovery tests were conducted on the testtrack after driving through the wet-brake water troughlocated near the northern straight section of the trackBoth 20- and 30-percent grades are available for parkingbrake tests
24
APPENDIX D
VEHICLE PREPARATION AND TEST PROCEDURE
Vehicle Preparation
When a vehicle was received at the test track a numberof checks were made to assure that it was ready forperformance tests These checks were recorded on a vehiclepreparation check sheet such as the one shown in figureD-l The vehicle was examined for physical damage when it was removed from the transport truck and before it wasaccepted from the shipper Before the vehicle was operateda complete visual check was made of the entire vehicleincluding wiring batteries motor and controller Thevehicle was weighed and compared with the manufacturersspecified curb weight The gross vehicle weight (GVW) wasdetermined from the vehicle sticker GVW If themanufacturer did not recommend a GVW it was determined byadding 68 kilograms (150 lbm) per passenger plus any payloadweight to the vehicle curb weight
The wheel alignment was checked compared andcorrected to the manufacturers recommended alignmentvalues The battery was charged and specific gravitiestaken to determine if the batteries were equalized If notan equalizing charge was applied to the batteries Theintegrity of the internal interconnections and the batteryterminals was checked by drawing either 300 amperes or thevehicle manufacturers maximum allowed current load from thebattery through a load bank for 5 minutes If thetemperature of the battery terminals or interconnectionsrose more than 60 degrees Celsius above ambient the test was terminated and the terminal was cleaned or the batteryreplaced The batteries were then recharged and a battery capacity check was made The battery was discharged inaccordance with the battery manufacturers recommendationsTo pass this test the capacity must be within 20 percent ofthe manufacturers published capacity at the published rate
The vehicle manufacturer was contacted for hisrecommendations concerning the maximum speed of the vehicletire pressures and procedures for driving the vehicle Thevehicle was photographed head-on with a 270-millimetertelephoto lens from a distance of about 305 meters (100 ft)in order to determine the frontal area
Test Procedure
Each day before a test a test checklist was usedTwo samples of these checklists are shown in figure D-2
25
The first item under driver instructions on the testchecklist is to complete the pretest checklist (fig D-3)
Data taken before during and after each test wereentered on the vehicle data sheet (fig D-4) These datainclude
(1) Average specific gravity of the battery
(2) Tire pressures
(3) Fifth-wheel tire pressure
(4) Test weight of the vehicle
(5) Weather information
(6) Battery temperatures
(7) Time the test was started
(8) Time the test was stopped
(9) Ampere-hours out of the battery
(10) Fifth-wheel distance count
(11) Odometer readings before and after the tests
The battery charge data taken during the charge cycle werealso recorded on this data sheet These data include theaverage specific gravity of the battery after the test thekilowatt-hours and ampere-hours put into the battery duringthe charge and the total time of the charge
To prepare for a test the specific gravities werefirst measured for each cell and recorded The tirepressures were measured and the vehicle was weighed Theweight was brought up to the GVW by adding sandbags Theinstrumentation was connected and power from theinstrumentation battery was applied All instruments wereturned on and warmed up The vehicle was towed to thestarting point on the track If the data were beingtelemetered precalibrations were applied to both themagnetic tape and the oscillograph The fifth-wheeldistance counter and ampere-hour integrator counter werereset to zero and thermocouple reference 3unctions wereturned on The test was started and was carried out inaccordance with the test checklist When the test wasterminated the vehicle was brought to a stop and thepost-test checks were made in accordance with the post-test
26
checklist (fig D-5) The driver recorded on the vehicledata sheet the time the odometer reading the ampere hourintegrator reading and the fifth-wheel distance readingThe post-calibration steps were then applied to the magnetictape and the oscillograph At the end of the test weatherdata were recorded on the vehicle data sheet Allinstrumentation power was turned off the instrumentationbattery was disconnected and the fifth wheel was raisedThe vehicle was then towed back to the garage the post-testspecific gravities were measured for all cells and thevehicle was placed on charge
After the test the engineer conducting the test completed a test summary sheet (fig D-6) This data sheetprovides a brief summary of the pertinent informationreceived from the test Another data sheet the engineersdata sheet (fig D-7) was also filled out This data sheetsummarizes the engineers evaluation of the test andprovides a record of problems malfunctions changes toinstrumentation etc that occurred during the test
Weather data - Wind velocity and direction and ambienttemperature were measured at the beginning and at the end ofeach test and every hour during the test The windanemometer was located about 18 meters (6 ft) from theground near the southern straight section of the track Theambient temperature readings were taken at theinstrumentation trailer near the west curve of the trackDuring most of the test period the winds were variable andgusty
Determination of maximum speed - The maximum speed ofthe vehicle was determined in the following manner Thevehicle was fully charged and loaded to gross vehicleweight After one warmup lap the vehicle was driven atwide-open throttle for three laps around the track Theminimum speed for each lap was recorded and the average wascalculated This average was called the vehicle maximumspeed This speed takes into account track variability andmaximum vehicle loading This quantity was then reduced by5 percent and called the recommended maximum cruise testspeed
Cycle timer - The cycle timer (fig D-8) was designedto assist the Vehicle driver in accurately driving SAEschedules B C and D The required test profile ispermanently stored on a programmable read-only memory(PROM) which is the heart of the instrument This profile is continuously reproduced on one needle of a dual-movementanalog meter shown in the figure The second needle isconnected to the output of the fifth wheel and the driver
27
matches needles to accurately drive the required schedule
One second before each speed transition (egacceleration to cruise or cruise to coast) an audio signalsounds to forewarn the driver of a change A longerduration audio signal sounds after the idle period toephasfze the st-art of a new cycle The total number oftest cycles driven is stored in a counter and can bedisplayed at any time with a pushbutton (to conserve power)
28
REFERENCES
1 Sargent Noel B Maslowski Edward A Soltis RichardF and Schuh Richard M Baseline Tests of the C H Waterman DAF Electric Passenger Vehicle NASA TM-737571977
2 Society of Automotive Engineers Inc Electric VehicleTest Procedure - SAE J227a Feb 1976
3 Battronics Minivan Service and Parts Manual BattronicTruck Corp Boyertown Pa
4 Franz Gary J Performance and Operation Tests of aBattery Powered Multi-Purpose Work Vehicle Manufacturedby Boyertown Auto Body Works Boyertown Pennsylvaniafor the Electric Vehicle Council New York New YorkDana Corp 1973
29
I - SL OF T R S FOR MTTA C nNIVAN
(a) sI nut+s
Test-date ar Test ohton n Wind Teper- -Range- Cycle Curret Cr t Dergy Tndicatd (oistant speed
Figure B-2 - Remote signal conditioning modulediagram
ORIGINAL PAGE IS OE POOR QUALITY44
DISTANCE km (1t) (9000) (8000) (7000)
1 shy3ORTlHERN $1RAIGHi 0
0(
2)5 SOUTHERN STRAIGHT- 5 000)1-3
0
DI00) (2000) (3000) (4 0O)
(a)Track diagram
12shy
z- 4
1shy
-12 - -8 II II I
(b)Grade -- 12 [NO4- 10- SOUTHERN NORTHERN
STRAIGHT STRAIGHT
30 I 25 - 2
Fz 20 I 15 0 4 I
10 5 21
0 J ORIGINAL PAGE l o 10002O0
DISTANCE in 400~opOO IAT
POOR QUALM I I I I I I 0 2000 4000 6000 8000 10000
DISTANCE ft
(c)Elevation
Figure C-I - Characteristics of Dynamic Science Test Track Phoenix Arizona
1 Vehicle
2 Date received 3 Checked for damage - date 4 Wheel alignment -date 5 Battery checked and equalized - date 6 Curb weight determined Ibm Date 7 Gross vehicle weight Ibm
8 300-Ampere test - date 9 Manufacturers recommendations
Maximum speed mph Tire pressures psi Front Rear Driving procedures
Figure D-1 - Vehicle preparation check sheet
45
Vehicle _m -- mph range test ___ gear
Driver Instructions1 Complete pretest checklist2 While on track recheck
Integrator - light on in operate position zeroed Speedometer - set on _ mph center Vehicle __cycle test gearDistance - on reset lighted Attenuator - on reset lighted Driver Instructons
3 At signal from control center accelerate moderately to _ mph I Complete pretest checklist 4Maintain -+ mph with minimal accelerator movement 2While on track recheck5 Integrator - light on in operate position zeroedSWhen vehicle isno longer able to maintain __ mph brake moderately to full stop Speedometer - set on - mph center 6Complete post-test checklist and other documentation Distance - on reset lightedRecording Attenuator - on reset selector on 1001 Set oscillograph zeros at Channel] Zero in Cycle timer - verify scheduled timing with stop watch
3 30 3At signal from control center perform cycletest using cycle timer as basis for detershy4 4 5 mining length of each phase of performance cycle Use programmed stop watch as 6 5 0 backup device Cycle Consists of
o 10 75 Accelerate to __ mph in __ s 12 11 Cruise at mph for s 13 12 14 20 Coast for s
2Record all channels on magnetic tape Check inputs at beginning of test to verify Brake to complete stop in s recording Hold in stop position for _ s
3Run cals on all channels Repeat entire cycle until vehicle isunable to meet acceleration time Moderately brake 4 Remove all channels from oscillograph except 3and 4 to acomplete stop 5 Start recording 15 sbefore start of test at oscillograph speed of 01Inls and tape speed 4 Complete post-test checklist and other documentation
of Lnls Recordingshy6After 15 min into test connect channels 6 10 12 13 and 14 to oscillograph and record 1Record all channels on magnetic tape at_ ins Check all channels to veriy
aburst at 100 nis while veh icle is in chopper mode input at beginning of test 7Remove channels 6 10 12 13 and 14 from oscillograph and continue test at 0 1 ins 2Record speed and distance on oscillograph at_ mns
with channels 3and 4only 3 Start recordingdata 15 sbefore beginning test 8 Document all ambient conditions at beginning once every hou rand at the end of the 4Document ambient conditions at beginning once every hour and at the end of the testtest Items recorded shall include temperature wind speed and direction significant Items recorded shall include temperature wind speed and direction significant windwind gusts and corrected barometric pressure gusts and corrected barometric pressure
-J (al Constant-speed test t)) Driving cycle test v i7)Figure D-2 - Test checklists
0-~
1 Record specific gravity readings after removing vehicle from charge and disconnect charger instrumentation Fill in charge data portion of data sheet from previous test Add water to batteries as necessary recording amount added Check and reshycord 5th wheel tire pressure and vehicle tire pressure
2 Connect (Connect alligator clips to instrumentation battery last))neter on a strument battery a
(a)inverter to instrument batterygo)Integrator input leadTeprteF
(c) Integrator power to inverter d)Starred Hf5th wheel jumper cable e)Cycle timer power and speed signal input cables (f)Spn up and calibrate 5th wheel
Check times
3 Record test weight - includes driver and ballast with 5th wheel raised
eN 4 Turn on (a)Inverter motor speed sensor thermocouple reference junctions integrator
and digital voltmeter Set integrator on Operate (b)Fifth wheel readout and switching interface units (2) (Select distance for exshy
panded scale range )
C C 1
5 Tow vehicle onto track with 5th wheel raised Precalhbrations
Tape data system Oscillograph
Reset 5th wheel distance Ampere-hour meter Thermocouple readout switches on Record
Turn on thermocouple reference junctions Lower 5th wheel Set hub loading
6Be sure data sheet isproperly filled out to this point tower
Check watch time with control
7 Proceed with test
Figure D-3 - Pretest checklist
Vehicle Battery system
Test Date Track data Driver Navigator
Average pretest specific gravity Open-circuit voltage V Tire pressure before test psi
Right front_ Left front Right rear Left rear Tire pressure after test psi
Right front __ Left front Right rear__ Left rear Fifth-wheel pressure psi _ (calibrated __ psi)Weather Initial Duringtest Final
Temperature OF Wind speed mph Wind direction Pressure in Hg
Battery temperature OF Before After Motor temperature OF Before After
Time Start Stop _
Odometer reading miles Start _ Stop Current out Ah _ Current in (regenerative) Ah Fifth wheel Basis for termination of tests
Charge data Average post-test specific gravity Open-circuit voltage V Charger used Charger input voltage V Battery temperature OF Before charge After charge _ Power kwh Start End Tota I Time Start EndTotal charge time mm
Current iput Ah Average specific gravity after charge
Approval
Figure D-4 - Track and charge data
1 Recordtime immediately at completion of test Turn off key switch
2 Complete track data sheet (a)Odometer stop0) Ampere-hour integrator(c)5th wheel distance (d)Read temperature (e)Calibrate data system (f) Record weather data
3 Turn off inverter thermocouple reference junctions
4 Disconnect 12-olt instrument battery red lead
5 Raise 5th wheel
6 Tow vehicle off track
7 Start charge procedure (specific gravities)
8 Check specific gravityon instrument battery If less than 1 220 remove from vehicle and charge to full capacity
9 Check water level in accessory batteries Add water as necessary
Figure D-5 - Post-test checklist
Vehicle Test Date Test conditions
Temperature OF Wind speed mph _ at Barometer reading in Hg _ Other
Test results Test time h Range milesCyclesCurrent out of battery AhCurrent into battery AhCharge time hPower into battery kWh
Magnetic tape NO_ Speed ins
Comments
Figure D-6 - Test summary sheet
48
Vehicle Test Date Engineer Reason for test tcheccout component check scheduled test etc)
Limitation on test tmalfunction data system protlem brake drag etc)
Changes to vehicle prior to test (repair change batteries etc)
Other comments
Evaluation of test Range miles
Current out Ah
Current in Al
Power in kWh
Energy consumption kWhlmile Was planned driving cycle followed
General comments
Figure D-7 - Engineers data sheet
112
Figure D-amp - Cycle timer
49 ORIGINAL PAGE iaOF POR QUALr1
NATIONAL AERONAUTICS AND SPACE ADMINISTRATION WASHINGTON D C 20546
________POSTAGE AND FEES PALO NATIONAI AERONAUTICS ANDOFFICIAL BUSINESS SPACE ADMINIS1RATION
PENALTY FOR PIVATE uSE $30o SPECIAL FOURTH-CLASS RATE 45I
BOOK 4S
(Section 158If UndeliverablePOSTMASTR Pota anual) Do Not Return
APPENDIX B
DATA ACQUISITION
Data acquired from the test vehicle are conditionedonboard the vehicle and transmitted to the Data AcquisitionCenter where they are demodulated and recorded on magnetictape (fig B-I)
The following paragraphs provide a detailed descriptionof system components Instrumentation calibrationprocedures and test procedures relative to the dataacquisition system are also described
Signal Conditioning Equipment
The signal conditioning equipment has a modular orbuilding-block configuration The basic building block isthe remote signal conditioning module (RSCM) which consistsof all the necessary functions required to take the basictransducer information and store it on magnetic tape EachRSCM handles 14 data channels
Internally the RSCM consists of all the necessarycomponents required to signal condition modulate ontoInter-Range Instrumentation Group (IRIG) constant-bandwidthfrequency-modulated (FM) channels and transmit a transduceroutput signal to a remote tape recorder Figure B-2 is thesystem diagram defining this RSCM
The signal conditioning amplifiers in the front end ofthe RSCM provide suitable gain and balance to normalize alltransducer outputs into common formats and to drive thevoltage-controlled oscillators (VCOs) Each amplifier hasa built-in isolated bridge power supply regulated at 50volts DC that negates loading effects from other transducersand changes in output due to supply battery variationsThis power supply is used either alone divided down by01-percent metal film resistors or in series with othersupplies to provide a highly accurate and stable voltageinsertion calibration of the entire system channel by channel
The VCOs convert analog voltages to afrequency-modulated unbalanced signal The centerfrequencies of the VCOs are set at values defined by IRIG106-71 for constant-bandwidth channels (table B-l) The+25-volt outputs from the amplifier provide +100-percentdeviation of the VCOs Using a mix of A and B channelsprovides an optimum combination of data frequency responseresolution percentage of deviation and channel density in
22
each multiplex
The system is designed to provide 1000-hertz datachannel bandwidth on all A channels and 2000-hertz channelbandwidth on all B channels The 14 VCO outputs are mixedonto a common bus which provides the output signal to berecorded An external 28-volt battery is used to power theRSCM
Each RSCM weighs under 9 kilograms (20 lbm) and coversapproximately 390 square centimeters (60 in2 ) of floorspace All input and output connections and finaladjustments are accessible from the top of the module
System Accuracy
Table B-2 represents the system errors for the dataacquisition system The values are taken from the componentspecifications As there are several informationconversions through the system there was an attempt totranslate the specifications into a common error domainEach device in the system has a set of parameters thatrepresent its performance in a particular region of themultidimensional space (eg an accelerometer converts anacceleration into a voltage (actually an energy conversion)with some nonlinearity of information conversion) There isa conversion from analog voltage to frequency with acorresponding nonlinearity in the VCO The tape recorderhas to handle the information mechanically with highaccuracy because a change in tape speed represents a changein frequency which in turn represents a change in theoriginal analog voltage
Tape Recorders
The tape recorder has 14 IRIG-compatible channels withthe recording channels individually controlled so thatmultiple recording passes may be made on the same tapeCapstan speed accuracy of 001 percent is obtained by use ofa tape speed compensator system while flutter is held to022 percent Time base and dynamic skew are 05 and 25microseconds respectively
23
APPENDIX C
DESCRIPTION OF VEHICLE TEST TRACK
The test track used to conduct the tests described inthis report is located in Phoenix Arizona The track isowneamp and opeiated byDynamicScincea subsidiary ofTalley Industries
The test track is a paved continuous two-lane 32-kilometer- (2-mile-) long oval with an adjacent40 000-square-meter (10-acre) skid pad The inner lane ofthe track is not banked and was used for all cycle tests andall constant-speed tests of 56 kilometers per hour (35 mph)or under The outer lane has zero lateral acceleration at80 kilometers per hour (50 mph) and was used for tests over56 kilometers per hour (35 mph) An elevation survey of thetrack is shown in figure C-I Average grade is 066 percenton the northern straight section and 076 percent on thesouthern straight section The surface of the track andskid pad is asphaltic concrete with a dry locked-wheel skidnumber of 82 and a wet locked-wheel skid number of 71
Wet and dry braking-in-turn tests were conducted on theskid pad vet recovery tests were conducted on the testtrack after driving through the wet-brake water troughlocated near the northern straight section of the trackBoth 20- and 30-percent grades are available for parkingbrake tests
24
APPENDIX D
VEHICLE PREPARATION AND TEST PROCEDURE
Vehicle Preparation
When a vehicle was received at the test track a numberof checks were made to assure that it was ready forperformance tests These checks were recorded on a vehiclepreparation check sheet such as the one shown in figureD-l The vehicle was examined for physical damage when it was removed from the transport truck and before it wasaccepted from the shipper Before the vehicle was operateda complete visual check was made of the entire vehicleincluding wiring batteries motor and controller Thevehicle was weighed and compared with the manufacturersspecified curb weight The gross vehicle weight (GVW) wasdetermined from the vehicle sticker GVW If themanufacturer did not recommend a GVW it was determined byadding 68 kilograms (150 lbm) per passenger plus any payloadweight to the vehicle curb weight
The wheel alignment was checked compared andcorrected to the manufacturers recommended alignmentvalues The battery was charged and specific gravitiestaken to determine if the batteries were equalized If notan equalizing charge was applied to the batteries Theintegrity of the internal interconnections and the batteryterminals was checked by drawing either 300 amperes or thevehicle manufacturers maximum allowed current load from thebattery through a load bank for 5 minutes If thetemperature of the battery terminals or interconnectionsrose more than 60 degrees Celsius above ambient the test was terminated and the terminal was cleaned or the batteryreplaced The batteries were then recharged and a battery capacity check was made The battery was discharged inaccordance with the battery manufacturers recommendationsTo pass this test the capacity must be within 20 percent ofthe manufacturers published capacity at the published rate
The vehicle manufacturer was contacted for hisrecommendations concerning the maximum speed of the vehicletire pressures and procedures for driving the vehicle Thevehicle was photographed head-on with a 270-millimetertelephoto lens from a distance of about 305 meters (100 ft)in order to determine the frontal area
Test Procedure
Each day before a test a test checklist was usedTwo samples of these checklists are shown in figure D-2
25
The first item under driver instructions on the testchecklist is to complete the pretest checklist (fig D-3)
Data taken before during and after each test wereentered on the vehicle data sheet (fig D-4) These datainclude
(1) Average specific gravity of the battery
(2) Tire pressures
(3) Fifth-wheel tire pressure
(4) Test weight of the vehicle
(5) Weather information
(6) Battery temperatures
(7) Time the test was started
(8) Time the test was stopped
(9) Ampere-hours out of the battery
(10) Fifth-wheel distance count
(11) Odometer readings before and after the tests
The battery charge data taken during the charge cycle werealso recorded on this data sheet These data include theaverage specific gravity of the battery after the test thekilowatt-hours and ampere-hours put into the battery duringthe charge and the total time of the charge
To prepare for a test the specific gravities werefirst measured for each cell and recorded The tirepressures were measured and the vehicle was weighed Theweight was brought up to the GVW by adding sandbags Theinstrumentation was connected and power from theinstrumentation battery was applied All instruments wereturned on and warmed up The vehicle was towed to thestarting point on the track If the data were beingtelemetered precalibrations were applied to both themagnetic tape and the oscillograph The fifth-wheeldistance counter and ampere-hour integrator counter werereset to zero and thermocouple reference 3unctions wereturned on The test was started and was carried out inaccordance with the test checklist When the test wasterminated the vehicle was brought to a stop and thepost-test checks were made in accordance with the post-test
26
checklist (fig D-5) The driver recorded on the vehicledata sheet the time the odometer reading the ampere hourintegrator reading and the fifth-wheel distance readingThe post-calibration steps were then applied to the magnetictape and the oscillograph At the end of the test weatherdata were recorded on the vehicle data sheet Allinstrumentation power was turned off the instrumentationbattery was disconnected and the fifth wheel was raisedThe vehicle was then towed back to the garage the post-testspecific gravities were measured for all cells and thevehicle was placed on charge
After the test the engineer conducting the test completed a test summary sheet (fig D-6) This data sheetprovides a brief summary of the pertinent informationreceived from the test Another data sheet the engineersdata sheet (fig D-7) was also filled out This data sheetsummarizes the engineers evaluation of the test andprovides a record of problems malfunctions changes toinstrumentation etc that occurred during the test
Weather data - Wind velocity and direction and ambienttemperature were measured at the beginning and at the end ofeach test and every hour during the test The windanemometer was located about 18 meters (6 ft) from theground near the southern straight section of the track Theambient temperature readings were taken at theinstrumentation trailer near the west curve of the trackDuring most of the test period the winds were variable andgusty
Determination of maximum speed - The maximum speed ofthe vehicle was determined in the following manner Thevehicle was fully charged and loaded to gross vehicleweight After one warmup lap the vehicle was driven atwide-open throttle for three laps around the track Theminimum speed for each lap was recorded and the average wascalculated This average was called the vehicle maximumspeed This speed takes into account track variability andmaximum vehicle loading This quantity was then reduced by5 percent and called the recommended maximum cruise testspeed
Cycle timer - The cycle timer (fig D-8) was designedto assist the Vehicle driver in accurately driving SAEschedules B C and D The required test profile ispermanently stored on a programmable read-only memory(PROM) which is the heart of the instrument This profile is continuously reproduced on one needle of a dual-movementanalog meter shown in the figure The second needle isconnected to the output of the fifth wheel and the driver
27
matches needles to accurately drive the required schedule
One second before each speed transition (egacceleration to cruise or cruise to coast) an audio signalsounds to forewarn the driver of a change A longerduration audio signal sounds after the idle period toephasfze the st-art of a new cycle The total number oftest cycles driven is stored in a counter and can bedisplayed at any time with a pushbutton (to conserve power)
28
REFERENCES
1 Sargent Noel B Maslowski Edward A Soltis RichardF and Schuh Richard M Baseline Tests of the C H Waterman DAF Electric Passenger Vehicle NASA TM-737571977
2 Society of Automotive Engineers Inc Electric VehicleTest Procedure - SAE J227a Feb 1976
3 Battronics Minivan Service and Parts Manual BattronicTruck Corp Boyertown Pa
4 Franz Gary J Performance and Operation Tests of aBattery Powered Multi-Purpose Work Vehicle Manufacturedby Boyertown Auto Body Works Boyertown Pennsylvaniafor the Electric Vehicle Council New York New YorkDana Corp 1973
29
I - SL OF T R S FOR MTTA C nNIVAN
(a) sI nut+s
Test-date ar Test ohton n Wind Teper- -Range- Cycle Curret Cr t Dergy Tndicatd (oistant speed
Figure B-2 - Remote signal conditioning modulediagram
ORIGINAL PAGE IS OE POOR QUALITY44
DISTANCE km (1t) (9000) (8000) (7000)
1 shy3ORTlHERN $1RAIGHi 0
0(
2)5 SOUTHERN STRAIGHT- 5 000)1-3
0
DI00) (2000) (3000) (4 0O)
(a)Track diagram
12shy
z- 4
1shy
-12 - -8 II II I
(b)Grade -- 12 [NO4- 10- SOUTHERN NORTHERN
STRAIGHT STRAIGHT
30 I 25 - 2
Fz 20 I 15 0 4 I
10 5 21
0 J ORIGINAL PAGE l o 10002O0
DISTANCE in 400~opOO IAT
POOR QUALM I I I I I I 0 2000 4000 6000 8000 10000
DISTANCE ft
(c)Elevation
Figure C-I - Characteristics of Dynamic Science Test Track Phoenix Arizona
1 Vehicle
2 Date received 3 Checked for damage - date 4 Wheel alignment -date 5 Battery checked and equalized - date 6 Curb weight determined Ibm Date 7 Gross vehicle weight Ibm
8 300-Ampere test - date 9 Manufacturers recommendations
Maximum speed mph Tire pressures psi Front Rear Driving procedures
Figure D-1 - Vehicle preparation check sheet
45
Vehicle _m -- mph range test ___ gear
Driver Instructions1 Complete pretest checklist2 While on track recheck
Integrator - light on in operate position zeroed Speedometer - set on _ mph center Vehicle __cycle test gearDistance - on reset lighted Attenuator - on reset lighted Driver Instructons
3 At signal from control center accelerate moderately to _ mph I Complete pretest checklist 4Maintain -+ mph with minimal accelerator movement 2While on track recheck5 Integrator - light on in operate position zeroedSWhen vehicle isno longer able to maintain __ mph brake moderately to full stop Speedometer - set on - mph center 6Complete post-test checklist and other documentation Distance - on reset lightedRecording Attenuator - on reset selector on 1001 Set oscillograph zeros at Channel] Zero in Cycle timer - verify scheduled timing with stop watch
3 30 3At signal from control center perform cycletest using cycle timer as basis for detershy4 4 5 mining length of each phase of performance cycle Use programmed stop watch as 6 5 0 backup device Cycle Consists of
o 10 75 Accelerate to __ mph in __ s 12 11 Cruise at mph for s 13 12 14 20 Coast for s
2Record all channels on magnetic tape Check inputs at beginning of test to verify Brake to complete stop in s recording Hold in stop position for _ s
3Run cals on all channels Repeat entire cycle until vehicle isunable to meet acceleration time Moderately brake 4 Remove all channels from oscillograph except 3and 4 to acomplete stop 5 Start recording 15 sbefore start of test at oscillograph speed of 01Inls and tape speed 4 Complete post-test checklist and other documentation
of Lnls Recordingshy6After 15 min into test connect channels 6 10 12 13 and 14 to oscillograph and record 1Record all channels on magnetic tape at_ ins Check all channels to veriy
aburst at 100 nis while veh icle is in chopper mode input at beginning of test 7Remove channels 6 10 12 13 and 14 from oscillograph and continue test at 0 1 ins 2Record speed and distance on oscillograph at_ mns
with channels 3and 4only 3 Start recordingdata 15 sbefore beginning test 8 Document all ambient conditions at beginning once every hou rand at the end of the 4Document ambient conditions at beginning once every hour and at the end of the testtest Items recorded shall include temperature wind speed and direction significant Items recorded shall include temperature wind speed and direction significant windwind gusts and corrected barometric pressure gusts and corrected barometric pressure
-J (al Constant-speed test t)) Driving cycle test v i7)Figure D-2 - Test checklists
0-~
1 Record specific gravity readings after removing vehicle from charge and disconnect charger instrumentation Fill in charge data portion of data sheet from previous test Add water to batteries as necessary recording amount added Check and reshycord 5th wheel tire pressure and vehicle tire pressure
2 Connect (Connect alligator clips to instrumentation battery last))neter on a strument battery a
(a)inverter to instrument batterygo)Integrator input leadTeprteF
(c) Integrator power to inverter d)Starred Hf5th wheel jumper cable e)Cycle timer power and speed signal input cables (f)Spn up and calibrate 5th wheel
Check times
3 Record test weight - includes driver and ballast with 5th wheel raised
eN 4 Turn on (a)Inverter motor speed sensor thermocouple reference junctions integrator
and digital voltmeter Set integrator on Operate (b)Fifth wheel readout and switching interface units (2) (Select distance for exshy
panded scale range )
C C 1
5 Tow vehicle onto track with 5th wheel raised Precalhbrations
Tape data system Oscillograph
Reset 5th wheel distance Ampere-hour meter Thermocouple readout switches on Record
Turn on thermocouple reference junctions Lower 5th wheel Set hub loading
6Be sure data sheet isproperly filled out to this point tower
Check watch time with control
7 Proceed with test
Figure D-3 - Pretest checklist
Vehicle Battery system
Test Date Track data Driver Navigator
Average pretest specific gravity Open-circuit voltage V Tire pressure before test psi
Right front_ Left front Right rear Left rear Tire pressure after test psi
Right front __ Left front Right rear__ Left rear Fifth-wheel pressure psi _ (calibrated __ psi)Weather Initial Duringtest Final
Temperature OF Wind speed mph Wind direction Pressure in Hg
Battery temperature OF Before After Motor temperature OF Before After
Time Start Stop _
Odometer reading miles Start _ Stop Current out Ah _ Current in (regenerative) Ah Fifth wheel Basis for termination of tests
Charge data Average post-test specific gravity Open-circuit voltage V Charger used Charger input voltage V Battery temperature OF Before charge After charge _ Power kwh Start End Tota I Time Start EndTotal charge time mm
Current iput Ah Average specific gravity after charge
Approval
Figure D-4 - Track and charge data
1 Recordtime immediately at completion of test Turn off key switch
2 Complete track data sheet (a)Odometer stop0) Ampere-hour integrator(c)5th wheel distance (d)Read temperature (e)Calibrate data system (f) Record weather data
3 Turn off inverter thermocouple reference junctions
4 Disconnect 12-olt instrument battery red lead
5 Raise 5th wheel
6 Tow vehicle off track
7 Start charge procedure (specific gravities)
8 Check specific gravityon instrument battery If less than 1 220 remove from vehicle and charge to full capacity
9 Check water level in accessory batteries Add water as necessary
Figure D-5 - Post-test checklist
Vehicle Test Date Test conditions
Temperature OF Wind speed mph _ at Barometer reading in Hg _ Other
Test results Test time h Range milesCyclesCurrent out of battery AhCurrent into battery AhCharge time hPower into battery kWh
Magnetic tape NO_ Speed ins
Comments
Figure D-6 - Test summary sheet
48
Vehicle Test Date Engineer Reason for test tcheccout component check scheduled test etc)
Limitation on test tmalfunction data system protlem brake drag etc)
Changes to vehicle prior to test (repair change batteries etc)
Other comments
Evaluation of test Range miles
Current out Ah
Current in Al
Power in kWh
Energy consumption kWhlmile Was planned driving cycle followed
General comments
Figure D-7 - Engineers data sheet
112
Figure D-amp - Cycle timer
49 ORIGINAL PAGE iaOF POR QUALr1
NATIONAL AERONAUTICS AND SPACE ADMINISTRATION WASHINGTON D C 20546
________POSTAGE AND FEES PALO NATIONAI AERONAUTICS ANDOFFICIAL BUSINESS SPACE ADMINIS1RATION
PENALTY FOR PIVATE uSE $30o SPECIAL FOURTH-CLASS RATE 45I
BOOK 4S
(Section 158If UndeliverablePOSTMASTR Pota anual) Do Not Return
TABLE III - ACCELERATION CHARACTERISTICS OF BATTRONIC MINIVAN
Figure B-2 - Remote signal conditioning modulediagram
ORIGINAL PAGE IS OE POOR QUALITY44
DISTANCE km (1t) (9000) (8000) (7000)
1 shy3ORTlHERN $1RAIGHi 0
0(
2)5 SOUTHERN STRAIGHT- 5 000)1-3
0
DI00) (2000) (3000) (4 0O)
(a)Track diagram
12shy
z- 4
1shy
-12 - -8 II II I
(b)Grade -- 12 [NO4- 10- SOUTHERN NORTHERN
STRAIGHT STRAIGHT
30 I 25 - 2
Fz 20 I 15 0 4 I
10 5 21
0 J ORIGINAL PAGE l o 10002O0
DISTANCE in 400~opOO IAT
POOR QUALM I I I I I I 0 2000 4000 6000 8000 10000
DISTANCE ft
(c)Elevation
Figure C-I - Characteristics of Dynamic Science Test Track Phoenix Arizona
1 Vehicle
2 Date received 3 Checked for damage - date 4 Wheel alignment -date 5 Battery checked and equalized - date 6 Curb weight determined Ibm Date 7 Gross vehicle weight Ibm
8 300-Ampere test - date 9 Manufacturers recommendations
Maximum speed mph Tire pressures psi Front Rear Driving procedures
Figure D-1 - Vehicle preparation check sheet
45
Vehicle _m -- mph range test ___ gear
Driver Instructions1 Complete pretest checklist2 While on track recheck
Integrator - light on in operate position zeroed Speedometer - set on _ mph center Vehicle __cycle test gearDistance - on reset lighted Attenuator - on reset lighted Driver Instructons
3 At signal from control center accelerate moderately to _ mph I Complete pretest checklist 4Maintain -+ mph with minimal accelerator movement 2While on track recheck5 Integrator - light on in operate position zeroedSWhen vehicle isno longer able to maintain __ mph brake moderately to full stop Speedometer - set on - mph center 6Complete post-test checklist and other documentation Distance - on reset lightedRecording Attenuator - on reset selector on 1001 Set oscillograph zeros at Channel] Zero in Cycle timer - verify scheduled timing with stop watch
3 30 3At signal from control center perform cycletest using cycle timer as basis for detershy4 4 5 mining length of each phase of performance cycle Use programmed stop watch as 6 5 0 backup device Cycle Consists of
o 10 75 Accelerate to __ mph in __ s 12 11 Cruise at mph for s 13 12 14 20 Coast for s
2Record all channels on magnetic tape Check inputs at beginning of test to verify Brake to complete stop in s recording Hold in stop position for _ s
3Run cals on all channels Repeat entire cycle until vehicle isunable to meet acceleration time Moderately brake 4 Remove all channels from oscillograph except 3and 4 to acomplete stop 5 Start recording 15 sbefore start of test at oscillograph speed of 01Inls and tape speed 4 Complete post-test checklist and other documentation
of Lnls Recordingshy6After 15 min into test connect channels 6 10 12 13 and 14 to oscillograph and record 1Record all channels on magnetic tape at_ ins Check all channels to veriy
aburst at 100 nis while veh icle is in chopper mode input at beginning of test 7Remove channels 6 10 12 13 and 14 from oscillograph and continue test at 0 1 ins 2Record speed and distance on oscillograph at_ mns
with channels 3and 4only 3 Start recordingdata 15 sbefore beginning test 8 Document all ambient conditions at beginning once every hou rand at the end of the 4Document ambient conditions at beginning once every hour and at the end of the testtest Items recorded shall include temperature wind speed and direction significant Items recorded shall include temperature wind speed and direction significant windwind gusts and corrected barometric pressure gusts and corrected barometric pressure
-J (al Constant-speed test t)) Driving cycle test v i7)Figure D-2 - Test checklists
0-~
1 Record specific gravity readings after removing vehicle from charge and disconnect charger instrumentation Fill in charge data portion of data sheet from previous test Add water to batteries as necessary recording amount added Check and reshycord 5th wheel tire pressure and vehicle tire pressure
2 Connect (Connect alligator clips to instrumentation battery last))neter on a strument battery a
(a)inverter to instrument batterygo)Integrator input leadTeprteF
(c) Integrator power to inverter d)Starred Hf5th wheel jumper cable e)Cycle timer power and speed signal input cables (f)Spn up and calibrate 5th wheel
Check times
3 Record test weight - includes driver and ballast with 5th wheel raised
eN 4 Turn on (a)Inverter motor speed sensor thermocouple reference junctions integrator
and digital voltmeter Set integrator on Operate (b)Fifth wheel readout and switching interface units (2) (Select distance for exshy
panded scale range )
C C 1
5 Tow vehicle onto track with 5th wheel raised Precalhbrations
Tape data system Oscillograph
Reset 5th wheel distance Ampere-hour meter Thermocouple readout switches on Record
Turn on thermocouple reference junctions Lower 5th wheel Set hub loading
6Be sure data sheet isproperly filled out to this point tower
Check watch time with control
7 Proceed with test
Figure D-3 - Pretest checklist
Vehicle Battery system
Test Date Track data Driver Navigator
Average pretest specific gravity Open-circuit voltage V Tire pressure before test psi
Right front_ Left front Right rear Left rear Tire pressure after test psi
Right front __ Left front Right rear__ Left rear Fifth-wheel pressure psi _ (calibrated __ psi)Weather Initial Duringtest Final
Temperature OF Wind speed mph Wind direction Pressure in Hg
Battery temperature OF Before After Motor temperature OF Before After
Time Start Stop _
Odometer reading miles Start _ Stop Current out Ah _ Current in (regenerative) Ah Fifth wheel Basis for termination of tests
Charge data Average post-test specific gravity Open-circuit voltage V Charger used Charger input voltage V Battery temperature OF Before charge After charge _ Power kwh Start End Tota I Time Start EndTotal charge time mm
Current iput Ah Average specific gravity after charge
Approval
Figure D-4 - Track and charge data
1 Recordtime immediately at completion of test Turn off key switch
2 Complete track data sheet (a)Odometer stop0) Ampere-hour integrator(c)5th wheel distance (d)Read temperature (e)Calibrate data system (f) Record weather data
3 Turn off inverter thermocouple reference junctions
4 Disconnect 12-olt instrument battery red lead
5 Raise 5th wheel
6 Tow vehicle off track
7 Start charge procedure (specific gravities)
8 Check specific gravityon instrument battery If less than 1 220 remove from vehicle and charge to full capacity
9 Check water level in accessory batteries Add water as necessary
Figure D-5 - Post-test checklist
Vehicle Test Date Test conditions
Temperature OF Wind speed mph _ at Barometer reading in Hg _ Other
Test results Test time h Range milesCyclesCurrent out of battery AhCurrent into battery AhCharge time hPower into battery kWh
Magnetic tape NO_ Speed ins
Comments
Figure D-6 - Test summary sheet
48
Vehicle Test Date Engineer Reason for test tcheccout component check scheduled test etc)
Limitation on test tmalfunction data system protlem brake drag etc)
Changes to vehicle prior to test (repair change batteries etc)
Other comments
Evaluation of test Range miles
Current out Ah
Current in Al
Power in kWh
Energy consumption kWhlmile Was planned driving cycle followed
General comments
Figure D-7 - Engineers data sheet
112
Figure D-amp - Cycle timer
49 ORIGINAL PAGE iaOF POR QUALr1
NATIONAL AERONAUTICS AND SPACE ADMINISTRATION WASHINGTON D C 20546
________POSTAGE AND FEES PALO NATIONAI AERONAUTICS ANDOFFICIAL BUSINESS SPACE ADMINIS1RATION
PENALTY FOR PIVATE uSE $30o SPECIAL FOURTH-CLASS RATE 45I
BOOK 4S
(Section 158If UndeliverablePOSTMASTR Pota anual) Do Not Return
TABLE IV - GRADEABILITY OF BATTRONIC MINIVAN ORIGINAL PAGE IS (a) In high gear OF POOR QUALITY
Figure B-2 - Remote signal conditioning modulediagram
ORIGINAL PAGE IS OE POOR QUALITY44
DISTANCE km (1t) (9000) (8000) (7000)
1 shy3ORTlHERN $1RAIGHi 0
0(
2)5 SOUTHERN STRAIGHT- 5 000)1-3
0
DI00) (2000) (3000) (4 0O)
(a)Track diagram
12shy
z- 4
1shy
-12 - -8 II II I
(b)Grade -- 12 [NO4- 10- SOUTHERN NORTHERN
STRAIGHT STRAIGHT
30 I 25 - 2
Fz 20 I 15 0 4 I
10 5 21
0 J ORIGINAL PAGE l o 10002O0
DISTANCE in 400~opOO IAT
POOR QUALM I I I I I I 0 2000 4000 6000 8000 10000
DISTANCE ft
(c)Elevation
Figure C-I - Characteristics of Dynamic Science Test Track Phoenix Arizona
1 Vehicle
2 Date received 3 Checked for damage - date 4 Wheel alignment -date 5 Battery checked and equalized - date 6 Curb weight determined Ibm Date 7 Gross vehicle weight Ibm
8 300-Ampere test - date 9 Manufacturers recommendations
Maximum speed mph Tire pressures psi Front Rear Driving procedures
Figure D-1 - Vehicle preparation check sheet
45
Vehicle _m -- mph range test ___ gear
Driver Instructions1 Complete pretest checklist2 While on track recheck
Integrator - light on in operate position zeroed Speedometer - set on _ mph center Vehicle __cycle test gearDistance - on reset lighted Attenuator - on reset lighted Driver Instructons
3 At signal from control center accelerate moderately to _ mph I Complete pretest checklist 4Maintain -+ mph with minimal accelerator movement 2While on track recheck5 Integrator - light on in operate position zeroedSWhen vehicle isno longer able to maintain __ mph brake moderately to full stop Speedometer - set on - mph center 6Complete post-test checklist and other documentation Distance - on reset lightedRecording Attenuator - on reset selector on 1001 Set oscillograph zeros at Channel] Zero in Cycle timer - verify scheduled timing with stop watch
3 30 3At signal from control center perform cycletest using cycle timer as basis for detershy4 4 5 mining length of each phase of performance cycle Use programmed stop watch as 6 5 0 backup device Cycle Consists of
o 10 75 Accelerate to __ mph in __ s 12 11 Cruise at mph for s 13 12 14 20 Coast for s
2Record all channels on magnetic tape Check inputs at beginning of test to verify Brake to complete stop in s recording Hold in stop position for _ s
3Run cals on all channels Repeat entire cycle until vehicle isunable to meet acceleration time Moderately brake 4 Remove all channels from oscillograph except 3and 4 to acomplete stop 5 Start recording 15 sbefore start of test at oscillograph speed of 01Inls and tape speed 4 Complete post-test checklist and other documentation
of Lnls Recordingshy6After 15 min into test connect channels 6 10 12 13 and 14 to oscillograph and record 1Record all channels on magnetic tape at_ ins Check all channels to veriy
aburst at 100 nis while veh icle is in chopper mode input at beginning of test 7Remove channels 6 10 12 13 and 14 from oscillograph and continue test at 0 1 ins 2Record speed and distance on oscillograph at_ mns
with channels 3and 4only 3 Start recordingdata 15 sbefore beginning test 8 Document all ambient conditions at beginning once every hou rand at the end of the 4Document ambient conditions at beginning once every hour and at the end of the testtest Items recorded shall include temperature wind speed and direction significant Items recorded shall include temperature wind speed and direction significant windwind gusts and corrected barometric pressure gusts and corrected barometric pressure
-J (al Constant-speed test t)) Driving cycle test v i7)Figure D-2 - Test checklists
0-~
1 Record specific gravity readings after removing vehicle from charge and disconnect charger instrumentation Fill in charge data portion of data sheet from previous test Add water to batteries as necessary recording amount added Check and reshycord 5th wheel tire pressure and vehicle tire pressure
2 Connect (Connect alligator clips to instrumentation battery last))neter on a strument battery a
(a)inverter to instrument batterygo)Integrator input leadTeprteF
(c) Integrator power to inverter d)Starred Hf5th wheel jumper cable e)Cycle timer power and speed signal input cables (f)Spn up and calibrate 5th wheel
Check times
3 Record test weight - includes driver and ballast with 5th wheel raised
eN 4 Turn on (a)Inverter motor speed sensor thermocouple reference junctions integrator
and digital voltmeter Set integrator on Operate (b)Fifth wheel readout and switching interface units (2) (Select distance for exshy
panded scale range )
C C 1
5 Tow vehicle onto track with 5th wheel raised Precalhbrations
Tape data system Oscillograph
Reset 5th wheel distance Ampere-hour meter Thermocouple readout switches on Record
Turn on thermocouple reference junctions Lower 5th wheel Set hub loading
6Be sure data sheet isproperly filled out to this point tower
Check watch time with control
7 Proceed with test
Figure D-3 - Pretest checklist
Vehicle Battery system
Test Date Track data Driver Navigator
Average pretest specific gravity Open-circuit voltage V Tire pressure before test psi
Right front_ Left front Right rear Left rear Tire pressure after test psi
Right front __ Left front Right rear__ Left rear Fifth-wheel pressure psi _ (calibrated __ psi)Weather Initial Duringtest Final
Temperature OF Wind speed mph Wind direction Pressure in Hg
Battery temperature OF Before After Motor temperature OF Before After
Time Start Stop _
Odometer reading miles Start _ Stop Current out Ah _ Current in (regenerative) Ah Fifth wheel Basis for termination of tests
Charge data Average post-test specific gravity Open-circuit voltage V Charger used Charger input voltage V Battery temperature OF Before charge After charge _ Power kwh Start End Tota I Time Start EndTotal charge time mm
Current iput Ah Average specific gravity after charge
Approval
Figure D-4 - Track and charge data
1 Recordtime immediately at completion of test Turn off key switch
2 Complete track data sheet (a)Odometer stop0) Ampere-hour integrator(c)5th wheel distance (d)Read temperature (e)Calibrate data system (f) Record weather data
3 Turn off inverter thermocouple reference junctions
4 Disconnect 12-olt instrument battery red lead
5 Raise 5th wheel
6 Tow vehicle off track
7 Start charge procedure (specific gravities)
8 Check specific gravityon instrument battery If less than 1 220 remove from vehicle and charge to full capacity
9 Check water level in accessory batteries Add water as necessary
Figure D-5 - Post-test checklist
Vehicle Test Date Test conditions
Temperature OF Wind speed mph _ at Barometer reading in Hg _ Other
Test results Test time h Range milesCyclesCurrent out of battery AhCurrent into battery AhCharge time hPower into battery kWh
Magnetic tape NO_ Speed ins
Comments
Figure D-6 - Test summary sheet
48
Vehicle Test Date Engineer Reason for test tcheccout component check scheduled test etc)
Limitation on test tmalfunction data system protlem brake drag etc)
Changes to vehicle prior to test (repair change batteries etc)
Other comments
Evaluation of test Range miles
Current out Ah
Current in Al
Power in kWh
Energy consumption kWhlmile Was planned driving cycle followed
General comments
Figure D-7 - Engineers data sheet
112
Figure D-amp - Cycle timer
49 ORIGINAL PAGE iaOF POR QUALr1
NATIONAL AERONAUTICS AND SPACE ADMINISTRATION WASHINGTON D C 20546
________POSTAGE AND FEES PALO NATIONAI AERONAUTICS ANDOFFICIAL BUSINESS SPACE ADMINIS1RATION
PENALTY FOR PIVATE uSE $30o SPECIAL FOURTH-CLASS RATE 45I
BOOK 4S
(Section 158If UndeliverablePOSTMASTR Pota anual) Do Not Return
TABLE V - ROAD ENERGY CONSUMPTION FOR TABLE VI - ROAD POWER REQUIREMENTS
BATTWONIC MINIVAN FOR BATTRONIC MINIVAN
Vehicle speed Road energy consumed Vehicle speed Road power required
Figure B-2 - Remote signal conditioning modulediagram
ORIGINAL PAGE IS OE POOR QUALITY44
DISTANCE km (1t) (9000) (8000) (7000)
1 shy3ORTlHERN $1RAIGHi 0
0(
2)5 SOUTHERN STRAIGHT- 5 000)1-3
0
DI00) (2000) (3000) (4 0O)
(a)Track diagram
12shy
z- 4
1shy
-12 - -8 II II I
(b)Grade -- 12 [NO4- 10- SOUTHERN NORTHERN
STRAIGHT STRAIGHT
30 I 25 - 2
Fz 20 I 15 0 4 I
10 5 21
0 J ORIGINAL PAGE l o 10002O0
DISTANCE in 400~opOO IAT
POOR QUALM I I I I I I 0 2000 4000 6000 8000 10000
DISTANCE ft
(c)Elevation
Figure C-I - Characteristics of Dynamic Science Test Track Phoenix Arizona
1 Vehicle
2 Date received 3 Checked for damage - date 4 Wheel alignment -date 5 Battery checked and equalized - date 6 Curb weight determined Ibm Date 7 Gross vehicle weight Ibm
8 300-Ampere test - date 9 Manufacturers recommendations
Maximum speed mph Tire pressures psi Front Rear Driving procedures
Figure D-1 - Vehicle preparation check sheet
45
Vehicle _m -- mph range test ___ gear
Driver Instructions1 Complete pretest checklist2 While on track recheck
Integrator - light on in operate position zeroed Speedometer - set on _ mph center Vehicle __cycle test gearDistance - on reset lighted Attenuator - on reset lighted Driver Instructons
3 At signal from control center accelerate moderately to _ mph I Complete pretest checklist 4Maintain -+ mph with minimal accelerator movement 2While on track recheck5 Integrator - light on in operate position zeroedSWhen vehicle isno longer able to maintain __ mph brake moderately to full stop Speedometer - set on - mph center 6Complete post-test checklist and other documentation Distance - on reset lightedRecording Attenuator - on reset selector on 1001 Set oscillograph zeros at Channel] Zero in Cycle timer - verify scheduled timing with stop watch
3 30 3At signal from control center perform cycletest using cycle timer as basis for detershy4 4 5 mining length of each phase of performance cycle Use programmed stop watch as 6 5 0 backup device Cycle Consists of
o 10 75 Accelerate to __ mph in __ s 12 11 Cruise at mph for s 13 12 14 20 Coast for s
2Record all channels on magnetic tape Check inputs at beginning of test to verify Brake to complete stop in s recording Hold in stop position for _ s
3Run cals on all channels Repeat entire cycle until vehicle isunable to meet acceleration time Moderately brake 4 Remove all channels from oscillograph except 3and 4 to acomplete stop 5 Start recording 15 sbefore start of test at oscillograph speed of 01Inls and tape speed 4 Complete post-test checklist and other documentation
of Lnls Recordingshy6After 15 min into test connect channels 6 10 12 13 and 14 to oscillograph and record 1Record all channels on magnetic tape at_ ins Check all channels to veriy
aburst at 100 nis while veh icle is in chopper mode input at beginning of test 7Remove channels 6 10 12 13 and 14 from oscillograph and continue test at 0 1 ins 2Record speed and distance on oscillograph at_ mns
with channels 3and 4only 3 Start recordingdata 15 sbefore beginning test 8 Document all ambient conditions at beginning once every hou rand at the end of the 4Document ambient conditions at beginning once every hour and at the end of the testtest Items recorded shall include temperature wind speed and direction significant Items recorded shall include temperature wind speed and direction significant windwind gusts and corrected barometric pressure gusts and corrected barometric pressure
-J (al Constant-speed test t)) Driving cycle test v i7)Figure D-2 - Test checklists
0-~
1 Record specific gravity readings after removing vehicle from charge and disconnect charger instrumentation Fill in charge data portion of data sheet from previous test Add water to batteries as necessary recording amount added Check and reshycord 5th wheel tire pressure and vehicle tire pressure
2 Connect (Connect alligator clips to instrumentation battery last))neter on a strument battery a
(a)inverter to instrument batterygo)Integrator input leadTeprteF
(c) Integrator power to inverter d)Starred Hf5th wheel jumper cable e)Cycle timer power and speed signal input cables (f)Spn up and calibrate 5th wheel
Check times
3 Record test weight - includes driver and ballast with 5th wheel raised
eN 4 Turn on (a)Inverter motor speed sensor thermocouple reference junctions integrator
and digital voltmeter Set integrator on Operate (b)Fifth wheel readout and switching interface units (2) (Select distance for exshy
panded scale range )
C C 1
5 Tow vehicle onto track with 5th wheel raised Precalhbrations
Tape data system Oscillograph
Reset 5th wheel distance Ampere-hour meter Thermocouple readout switches on Record
Turn on thermocouple reference junctions Lower 5th wheel Set hub loading
6Be sure data sheet isproperly filled out to this point tower
Check watch time with control
7 Proceed with test
Figure D-3 - Pretest checklist
Vehicle Battery system
Test Date Track data Driver Navigator
Average pretest specific gravity Open-circuit voltage V Tire pressure before test psi
Right front_ Left front Right rear Left rear Tire pressure after test psi
Right front __ Left front Right rear__ Left rear Fifth-wheel pressure psi _ (calibrated __ psi)Weather Initial Duringtest Final
Temperature OF Wind speed mph Wind direction Pressure in Hg
Battery temperature OF Before After Motor temperature OF Before After
Time Start Stop _
Odometer reading miles Start _ Stop Current out Ah _ Current in (regenerative) Ah Fifth wheel Basis for termination of tests
Charge data Average post-test specific gravity Open-circuit voltage V Charger used Charger input voltage V Battery temperature OF Before charge After charge _ Power kwh Start End Tota I Time Start EndTotal charge time mm
Current iput Ah Average specific gravity after charge
Approval
Figure D-4 - Track and charge data
1 Recordtime immediately at completion of test Turn off key switch
2 Complete track data sheet (a)Odometer stop0) Ampere-hour integrator(c)5th wheel distance (d)Read temperature (e)Calibrate data system (f) Record weather data
3 Turn off inverter thermocouple reference junctions
4 Disconnect 12-olt instrument battery red lead
5 Raise 5th wheel
6 Tow vehicle off track
7 Start charge procedure (specific gravities)
8 Check specific gravityon instrument battery If less than 1 220 remove from vehicle and charge to full capacity
9 Check water level in accessory batteries Add water as necessary
Figure D-5 - Post-test checklist
Vehicle Test Date Test conditions
Temperature OF Wind speed mph _ at Barometer reading in Hg _ Other
Test results Test time h Range milesCyclesCurrent out of battery AhCurrent into battery AhCharge time hPower into battery kWh
Magnetic tape NO_ Speed ins
Comments
Figure D-6 - Test summary sheet
48
Vehicle Test Date Engineer Reason for test tcheccout component check scheduled test etc)
Limitation on test tmalfunction data system protlem brake drag etc)
Changes to vehicle prior to test (repair change batteries etc)
Other comments
Evaluation of test Range miles
Current out Ah
Current in Al
Power in kWh
Energy consumption kWhlmile Was planned driving cycle followed
General comments
Figure D-7 - Engineers data sheet
112
Figure D-amp - Cycle timer
49 ORIGINAL PAGE iaOF POR QUALr1
NATIONAL AERONAUTICS AND SPACE ADMINISTRATION WASHINGTON D C 20546
________POSTAGE AND FEES PALO NATIONAI AERONAUTICS ANDOFFICIAL BUSINESS SPACE ADMINIS1RATION
PENALTY FOR PIVATE uSE $30o SPECIAL FOURTH-CLASS RATE 45I
BOOK 4S
(Section 158If UndeliverablePOSTMASTR Pota anual) Do Not Return
TABLE VII - ENERGY CONSUMPTION FOR
BATTRONIC MINIVAN
Vehicle speed Energy consumption
kmh mph MJkm kWhmile
402 250 170 076
402 250 139 62
595 370 222 99
595 370 217 97
724 450 340 152
724 450 302 135
837 520 356 159
837 520 450 201
TABLE VIII - EV-330 CELL CHARACTERISTICS
Cell height m (in) 045 (177)
Cell width m (in) 009 (35)
Cell length m (in) 016 (62)
Weight (trayed) kg (ibm) 215 (473)
Cell acid volume liters (qt) 31 (33)
Number of plates per cell 13
Cycle life number of cycles 400
35
OV0o
TABLE B-i - CONSTANT-BANDWIDTH CHANNELS
-IN EACH REMOTE SIGNAL-CONDITIONING
MODULE FOR WATERMAN DAF
IRIG Center Deviationconstant- frequency kHzbandwidth kHzchannel
Figure B-2 - Remote signal conditioning modulediagram
ORIGINAL PAGE IS OE POOR QUALITY44
DISTANCE km (1t) (9000) (8000) (7000)
1 shy3ORTlHERN $1RAIGHi 0
0(
2)5 SOUTHERN STRAIGHT- 5 000)1-3
0
DI00) (2000) (3000) (4 0O)
(a)Track diagram
12shy
z- 4
1shy
-12 - -8 II II I
(b)Grade -- 12 [NO4- 10- SOUTHERN NORTHERN
STRAIGHT STRAIGHT
30 I 25 - 2
Fz 20 I 15 0 4 I
10 5 21
0 J ORIGINAL PAGE l o 10002O0
DISTANCE in 400~opOO IAT
POOR QUALM I I I I I I 0 2000 4000 6000 8000 10000
DISTANCE ft
(c)Elevation
Figure C-I - Characteristics of Dynamic Science Test Track Phoenix Arizona
1 Vehicle
2 Date received 3 Checked for damage - date 4 Wheel alignment -date 5 Battery checked and equalized - date 6 Curb weight determined Ibm Date 7 Gross vehicle weight Ibm
8 300-Ampere test - date 9 Manufacturers recommendations
Maximum speed mph Tire pressures psi Front Rear Driving procedures
Figure D-1 - Vehicle preparation check sheet
45
Vehicle _m -- mph range test ___ gear
Driver Instructions1 Complete pretest checklist2 While on track recheck
Integrator - light on in operate position zeroed Speedometer - set on _ mph center Vehicle __cycle test gearDistance - on reset lighted Attenuator - on reset lighted Driver Instructons
3 At signal from control center accelerate moderately to _ mph I Complete pretest checklist 4Maintain -+ mph with minimal accelerator movement 2While on track recheck5 Integrator - light on in operate position zeroedSWhen vehicle isno longer able to maintain __ mph brake moderately to full stop Speedometer - set on - mph center 6Complete post-test checklist and other documentation Distance - on reset lightedRecording Attenuator - on reset selector on 1001 Set oscillograph zeros at Channel] Zero in Cycle timer - verify scheduled timing with stop watch
3 30 3At signal from control center perform cycletest using cycle timer as basis for detershy4 4 5 mining length of each phase of performance cycle Use programmed stop watch as 6 5 0 backup device Cycle Consists of
o 10 75 Accelerate to __ mph in __ s 12 11 Cruise at mph for s 13 12 14 20 Coast for s
2Record all channels on magnetic tape Check inputs at beginning of test to verify Brake to complete stop in s recording Hold in stop position for _ s
3Run cals on all channels Repeat entire cycle until vehicle isunable to meet acceleration time Moderately brake 4 Remove all channels from oscillograph except 3and 4 to acomplete stop 5 Start recording 15 sbefore start of test at oscillograph speed of 01Inls and tape speed 4 Complete post-test checklist and other documentation
of Lnls Recordingshy6After 15 min into test connect channels 6 10 12 13 and 14 to oscillograph and record 1Record all channels on magnetic tape at_ ins Check all channels to veriy
aburst at 100 nis while veh icle is in chopper mode input at beginning of test 7Remove channels 6 10 12 13 and 14 from oscillograph and continue test at 0 1 ins 2Record speed and distance on oscillograph at_ mns
with channels 3and 4only 3 Start recordingdata 15 sbefore beginning test 8 Document all ambient conditions at beginning once every hou rand at the end of the 4Document ambient conditions at beginning once every hour and at the end of the testtest Items recorded shall include temperature wind speed and direction significant Items recorded shall include temperature wind speed and direction significant windwind gusts and corrected barometric pressure gusts and corrected barometric pressure
-J (al Constant-speed test t)) Driving cycle test v i7)Figure D-2 - Test checklists
0-~
1 Record specific gravity readings after removing vehicle from charge and disconnect charger instrumentation Fill in charge data portion of data sheet from previous test Add water to batteries as necessary recording amount added Check and reshycord 5th wheel tire pressure and vehicle tire pressure
2 Connect (Connect alligator clips to instrumentation battery last))neter on a strument battery a
(a)inverter to instrument batterygo)Integrator input leadTeprteF
(c) Integrator power to inverter d)Starred Hf5th wheel jumper cable e)Cycle timer power and speed signal input cables (f)Spn up and calibrate 5th wheel
Check times
3 Record test weight - includes driver and ballast with 5th wheel raised
eN 4 Turn on (a)Inverter motor speed sensor thermocouple reference junctions integrator
and digital voltmeter Set integrator on Operate (b)Fifth wheel readout and switching interface units (2) (Select distance for exshy
panded scale range )
C C 1
5 Tow vehicle onto track with 5th wheel raised Precalhbrations
Tape data system Oscillograph
Reset 5th wheel distance Ampere-hour meter Thermocouple readout switches on Record
Turn on thermocouple reference junctions Lower 5th wheel Set hub loading
6Be sure data sheet isproperly filled out to this point tower
Check watch time with control
7 Proceed with test
Figure D-3 - Pretest checklist
Vehicle Battery system
Test Date Track data Driver Navigator
Average pretest specific gravity Open-circuit voltage V Tire pressure before test psi
Right front_ Left front Right rear Left rear Tire pressure after test psi
Right front __ Left front Right rear__ Left rear Fifth-wheel pressure psi _ (calibrated __ psi)Weather Initial Duringtest Final
Temperature OF Wind speed mph Wind direction Pressure in Hg
Battery temperature OF Before After Motor temperature OF Before After
Time Start Stop _
Odometer reading miles Start _ Stop Current out Ah _ Current in (regenerative) Ah Fifth wheel Basis for termination of tests
Charge data Average post-test specific gravity Open-circuit voltage V Charger used Charger input voltage V Battery temperature OF Before charge After charge _ Power kwh Start End Tota I Time Start EndTotal charge time mm
Current iput Ah Average specific gravity after charge
Approval
Figure D-4 - Track and charge data
1 Recordtime immediately at completion of test Turn off key switch
2 Complete track data sheet (a)Odometer stop0) Ampere-hour integrator(c)5th wheel distance (d)Read temperature (e)Calibrate data system (f) Record weather data
3 Turn off inverter thermocouple reference junctions
4 Disconnect 12-olt instrument battery red lead
5 Raise 5th wheel
6 Tow vehicle off track
7 Start charge procedure (specific gravities)
8 Check specific gravityon instrument battery If less than 1 220 remove from vehicle and charge to full capacity
9 Check water level in accessory batteries Add water as necessary
Figure D-5 - Post-test checklist
Vehicle Test Date Test conditions
Temperature OF Wind speed mph _ at Barometer reading in Hg _ Other
Test results Test time h Range milesCyclesCurrent out of battery AhCurrent into battery AhCharge time hPower into battery kWh
Magnetic tape NO_ Speed ins
Comments
Figure D-6 - Test summary sheet
48
Vehicle Test Date Engineer Reason for test tcheccout component check scheduled test etc)
Limitation on test tmalfunction data system protlem brake drag etc)
Changes to vehicle prior to test (repair change batteries etc)
Other comments
Evaluation of test Range miles
Current out Ah
Current in Al
Power in kWh
Energy consumption kWhlmile Was planned driving cycle followed
General comments
Figure D-7 - Engineers data sheet
112
Figure D-amp - Cycle timer
49 ORIGINAL PAGE iaOF POR QUALr1
NATIONAL AERONAUTICS AND SPACE ADMINISTRATION WASHINGTON D C 20546
________POSTAGE AND FEES PALO NATIONAI AERONAUTICS ANDOFFICIAL BUSINESS SPACE ADMINIS1RATION
PENALTY FOR PIVATE uSE $30o SPECIAL FOURTH-CLASS RATE 45I
BOOK 4S
(Section 158If UndeliverablePOSTMASTR Pota anual) Do Not Return
Figure 1 - Battronic Minivan
Figure 2 - View of Battronic Minivan showing access to cargo area through rear door
37 Ljmkttur
~C-U-
Figure 3 - View of area under front hood showing silicon-controlled-rectifier direct-current chopper controller
Figure 4 - View through rear door showing right battery pack Charger is immediately in front of passenger seat
38
5
124 3
-1V III BRleajjSB0HIGH O3fl
so
50 KHe
14020 20
a lB B 3 9a SB 0 2MPH
VEHICLE SPEED
Figure7 - Range at aconstant speed for BattronlC Minivan Test dalesJanuary 17 to April 1 1977
ODIGINAL PAGE Is i 5 OOR DE QUALITYI
90BB+2 DitSCHRfl= 3 shy0 XLWZ
-BOX DI CHRREt 0 a x
70 x 0shy
30 50 HHt H
20 3
0102 10
0 2 0 10 20 3 q30 EG
TIME 5ECfNDS
(a)Inhigh gear
7ZEB- x
xxxu-i 55
30H
0 lB 0 i 0 0 50 so 70 D B so le TIMEt SECONDS
O)In low gear
Figure 8 - Vehicle acceleration
40
E13
9 5 5 2 5OO
5X-q0Z 4 2
DLECHRRE1Z
515CHRlRSU2 H-00 1gt CNR=~
36 32 22OMXQCHIIRGE
2M x-eX HBW0Z
ocSCiHRmRE Ogt1SCHRG
3 0-I xo
I
0
H H 0
xxxg0uNH xp
LEIB
14
tH4i4HHm
H14
HH
HH
X xx
xxp H K XD
(a)In high gear (a) In high gear
bE
2525 214
qIS 2amp
11= 3I
2 isI -H
x
H H XCC x X x
H
_Ishy
-X
=2
4 H H CXXxx ishy
x X- H
KNfH 0 I0 20 30 I9 SO
MPH VEHICLE SPEED
O In low gear
Figure 9 - Acceleration as a function of speed for Battronic Minivan date March 12 1977
Test
21 KNIH
is 20l 3qEJ5 G PHl
VEIIOLE SPEEI)
0))In tw gear
Figure 10 - Gradeability as a function of speed for Battronic Minivan Test date March 12 1977
ttl Iq I I
0 q
Bti0 a0o VD-
Figure 11 - Road energy as afunction of speed for Battronic Minivan shyhigh gear Test date March 12 1977
26 82 22
200 on
Is2 1
II 12
00 1 2
B 10 2 0 4 o Gi 70 H 91 IO
VEHICLE SPED
Figure1]2 - Road power as a function of speed for Battronic Minivan -high gear Test dale March 1Z2197
42
Z
2 5S
H
5
0gtLW
X----Hl H
ER
CRR
x
x
0 K--
C
KH3 a I 20 3 90 w B
NPH VEHICLE SPEED
Figure 13 -Energy consumption as a function of speed for Battrolc MinLshyvan Test dates January 17 to April 1 1977
0
IsX
BoE
z xx
MPH
w
Fit a=)
320
640 2 X=)
I
mm o
1g H I
2 I(RV5BVlaVs
HTTETER
L
toshy
0i to 20 30 913 OUTPUT CURRENT RHMPS
FO 60
Figure 14040
9
-Charger efficiency as a function of current for Battraic0)I IIT 2 I(RrTBETI
Figure B-2 - Remote signal conditioning modulediagram
ORIGINAL PAGE IS OE POOR QUALITY44
DISTANCE km (1t) (9000) (8000) (7000)
1 shy3ORTlHERN $1RAIGHi 0
0(
2)5 SOUTHERN STRAIGHT- 5 000)1-3
0
DI00) (2000) (3000) (4 0O)
(a)Track diagram
12shy
z- 4
1shy
-12 - -8 II II I
(b)Grade -- 12 [NO4- 10- SOUTHERN NORTHERN
STRAIGHT STRAIGHT
30 I 25 - 2
Fz 20 I 15 0 4 I
10 5 21
0 J ORIGINAL PAGE l o 10002O0
DISTANCE in 400~opOO IAT
POOR QUALM I I I I I I 0 2000 4000 6000 8000 10000
DISTANCE ft
(c)Elevation
Figure C-I - Characteristics of Dynamic Science Test Track Phoenix Arizona
1 Vehicle
2 Date received 3 Checked for damage - date 4 Wheel alignment -date 5 Battery checked and equalized - date 6 Curb weight determined Ibm Date 7 Gross vehicle weight Ibm
8 300-Ampere test - date 9 Manufacturers recommendations
Maximum speed mph Tire pressures psi Front Rear Driving procedures
Figure D-1 - Vehicle preparation check sheet
45
Vehicle _m -- mph range test ___ gear
Driver Instructions1 Complete pretest checklist2 While on track recheck
Integrator - light on in operate position zeroed Speedometer - set on _ mph center Vehicle __cycle test gearDistance - on reset lighted Attenuator - on reset lighted Driver Instructons
3 At signal from control center accelerate moderately to _ mph I Complete pretest checklist 4Maintain -+ mph with minimal accelerator movement 2While on track recheck5 Integrator - light on in operate position zeroedSWhen vehicle isno longer able to maintain __ mph brake moderately to full stop Speedometer - set on - mph center 6Complete post-test checklist and other documentation Distance - on reset lightedRecording Attenuator - on reset selector on 1001 Set oscillograph zeros at Channel] Zero in Cycle timer - verify scheduled timing with stop watch
3 30 3At signal from control center perform cycletest using cycle timer as basis for detershy4 4 5 mining length of each phase of performance cycle Use programmed stop watch as 6 5 0 backup device Cycle Consists of
o 10 75 Accelerate to __ mph in __ s 12 11 Cruise at mph for s 13 12 14 20 Coast for s
2Record all channels on magnetic tape Check inputs at beginning of test to verify Brake to complete stop in s recording Hold in stop position for _ s
3Run cals on all channels Repeat entire cycle until vehicle isunable to meet acceleration time Moderately brake 4 Remove all channels from oscillograph except 3and 4 to acomplete stop 5 Start recording 15 sbefore start of test at oscillograph speed of 01Inls and tape speed 4 Complete post-test checklist and other documentation
of Lnls Recordingshy6After 15 min into test connect channels 6 10 12 13 and 14 to oscillograph and record 1Record all channels on magnetic tape at_ ins Check all channels to veriy
aburst at 100 nis while veh icle is in chopper mode input at beginning of test 7Remove channels 6 10 12 13 and 14 from oscillograph and continue test at 0 1 ins 2Record speed and distance on oscillograph at_ mns
with channels 3and 4only 3 Start recordingdata 15 sbefore beginning test 8 Document all ambient conditions at beginning once every hou rand at the end of the 4Document ambient conditions at beginning once every hour and at the end of the testtest Items recorded shall include temperature wind speed and direction significant Items recorded shall include temperature wind speed and direction significant windwind gusts and corrected barometric pressure gusts and corrected barometric pressure
-J (al Constant-speed test t)) Driving cycle test v i7)Figure D-2 - Test checklists
0-~
1 Record specific gravity readings after removing vehicle from charge and disconnect charger instrumentation Fill in charge data portion of data sheet from previous test Add water to batteries as necessary recording amount added Check and reshycord 5th wheel tire pressure and vehicle tire pressure
2 Connect (Connect alligator clips to instrumentation battery last))neter on a strument battery a
(a)inverter to instrument batterygo)Integrator input leadTeprteF
(c) Integrator power to inverter d)Starred Hf5th wheel jumper cable e)Cycle timer power and speed signal input cables (f)Spn up and calibrate 5th wheel
Check times
3 Record test weight - includes driver and ballast with 5th wheel raised
eN 4 Turn on (a)Inverter motor speed sensor thermocouple reference junctions integrator
and digital voltmeter Set integrator on Operate (b)Fifth wheel readout and switching interface units (2) (Select distance for exshy
panded scale range )
C C 1
5 Tow vehicle onto track with 5th wheel raised Precalhbrations
Tape data system Oscillograph
Reset 5th wheel distance Ampere-hour meter Thermocouple readout switches on Record
Turn on thermocouple reference junctions Lower 5th wheel Set hub loading
6Be sure data sheet isproperly filled out to this point tower
Check watch time with control
7 Proceed with test
Figure D-3 - Pretest checklist
Vehicle Battery system
Test Date Track data Driver Navigator
Average pretest specific gravity Open-circuit voltage V Tire pressure before test psi
Right front_ Left front Right rear Left rear Tire pressure after test psi
Right front __ Left front Right rear__ Left rear Fifth-wheel pressure psi _ (calibrated __ psi)Weather Initial Duringtest Final
Temperature OF Wind speed mph Wind direction Pressure in Hg
Battery temperature OF Before After Motor temperature OF Before After
Time Start Stop _
Odometer reading miles Start _ Stop Current out Ah _ Current in (regenerative) Ah Fifth wheel Basis for termination of tests
Charge data Average post-test specific gravity Open-circuit voltage V Charger used Charger input voltage V Battery temperature OF Before charge After charge _ Power kwh Start End Tota I Time Start EndTotal charge time mm
Current iput Ah Average specific gravity after charge
Approval
Figure D-4 - Track and charge data
1 Recordtime immediately at completion of test Turn off key switch
2 Complete track data sheet (a)Odometer stop0) Ampere-hour integrator(c)5th wheel distance (d)Read temperature (e)Calibrate data system (f) Record weather data
3 Turn off inverter thermocouple reference junctions
4 Disconnect 12-olt instrument battery red lead
5 Raise 5th wheel
6 Tow vehicle off track
7 Start charge procedure (specific gravities)
8 Check specific gravityon instrument battery If less than 1 220 remove from vehicle and charge to full capacity
9 Check water level in accessory batteries Add water as necessary
Figure D-5 - Post-test checklist
Vehicle Test Date Test conditions
Temperature OF Wind speed mph _ at Barometer reading in Hg _ Other
Test results Test time h Range milesCyclesCurrent out of battery AhCurrent into battery AhCharge time hPower into battery kWh
Magnetic tape NO_ Speed ins
Comments
Figure D-6 - Test summary sheet
48
Vehicle Test Date Engineer Reason for test tcheccout component check scheduled test etc)
Limitation on test tmalfunction data system protlem brake drag etc)
Changes to vehicle prior to test (repair change batteries etc)
Other comments
Evaluation of test Range miles
Current out Ah
Current in Al
Power in kWh
Energy consumption kWhlmile Was planned driving cycle followed
General comments
Figure D-7 - Engineers data sheet
112
Figure D-amp - Cycle timer
49 ORIGINAL PAGE iaOF POR QUALr1
NATIONAL AERONAUTICS AND SPACE ADMINISTRATION WASHINGTON D C 20546
________POSTAGE AND FEES PALO NATIONAI AERONAUTICS ANDOFFICIAL BUSINESS SPACE ADMINIS1RATION
PENALTY FOR PIVATE uSE $30o SPECIAL FOURTH-CLASS RATE 45I
BOOK 4S
(Section 158If UndeliverablePOSTMASTR Pota anual) Do Not Return
NATIONAL AERONAUTICS AND SPACE ADMINISTRATION WASHINGTON D C 20546
________POSTAGE AND FEES PALO NATIONAI AERONAUTICS ANDOFFICIAL BUSINESS SPACE ADMINIS1RATION
PENALTY FOR PIVATE uSE $30o SPECIAL FOURTH-CLASS RATE 45I
BOOK 4S
(Section 158If UndeliverablePOSTMASTR Pota anual) Do Not Return