55
Risk & Regulation Studies in October 2009 The BC Agricultural Land Reserve: A Critical Assessment by Diane Katz
| Date post: | 01-Aug-2018 |
| Category: |
Documents |
| Upload: | phamkhuong |
| View: | 215 times |
| Download: | 0 times |
Risk & RegulationStudies in
October 2009
The BC Agricultural Land Reserve: A Critical Assessment
by Diane Katz

Risk & RegulationStudies in
October 2009
The BC Agricultural Land Reserve: A Critical Assessment
by Diane Katz

Contents
Executive summary l 3
Introduction l 6
The establishment of the Agricultural Land Reserve l 9
Agriculture in Canada l 14
Agriculture in British Columbia l 18
Collateral effects of the ALR l 31
Summary l 37
Recommendations l 38
References l 40
About the author l 49
Acknowledgments l 49
About this publication l 50
Supporting the Fraser Institute l 51
About the Fraser Institute l 52
Editorial Advisory Board l 53
The BC Agricultural Land Reserve: A Critical Assessment l 3
www.fraserinstitute.org l Fraser Institute
Executive summary
British Columbians have grappled with land use restrictions that rank among Canada’s most severe since the Agricultural Land Reserve (ALR) was estab-lished in 1973. The rationale for denying citizens the full use of 4.7 million hectares of property has shifted over time, from rescuing the “family farm” to preserving “green space” and, most recently, protecting the “local” food sup-ply. The costs of this social engineering, which include soaring housing prices resulting from a scarcity of land for development and the incalculable loss of property owners’ economic freedom, are substantial. This paper examines some of these costs in order to promote a re-evaluation of the government’s excessive interference in the agricultural sector.
Champions of the ALR claim that the land use controls are necessary to ensure a “local” food supply. But BC consumers have shown an undeni-able preference for greater choice. The vast majority of BC consumers buy great quantities of imports and base their purchase decisions on a range of legitimate factors, including price, variety, and convenience, rather than product origin alone. Indeed, after three decades of the ALR regime, BC farmers produce just one-third of the food needed in the province to meet the standards of a “healthy” diet (British Columbia, Ministry of Agriculture and Lands, 2006).
The land scarcity created by the ALR has rendered Vancouver hous-ing the most “severely unaffordable” of any major city in the 265 metropoli-tan markets across Canada, the United States, Australia, New Zealand, the United Kingdom, and Ireland, as analyzed by Wendell Cox and Hugh Pavletich (2009) in their fifth annual International Housing Affordability Survey. Only Honolulu, Hawaii, and Australia’s Gold and Sunshine Coasts were costlier. Indeed, according to the survey, all of Canada’s “severely unaffordable” mar-kets were in British Columbia, and none of the “affordable” markets were located in the province.
Contrary to the intent of the ALR’s architects, the land reserve has not halted the decline in the number of BC farms or the loss of “family farms.” Nor has it nurtured a new generation of farmers. In fact, the number of farms in British Columbia has declined 9% in the past decade (British Columbia, Ministry of Agriculture and Lands, 2007). The proportion of owner-operators also is falling: between 1986 and 2006, the total amount of BC farmland rented or leased grew nearly 35% (Statistics Canada, 2008d).
In Metro Vancouver, where proponents once claimed the ALR would prove most effective, there has been a 66% decline in the number of farmers under the age of 35 over the past 10 years. As a Metro Vancouver Sustainability

4 l The BC Agricultural Land Reserve: A Critical Assessment
Fraser Institute l www.fraserinstitute.org
Report notes, “This would suggest that young people do not consider farming a viable economic venture or find the cost of entering the market prohibitive” (Metro Vancouver, 2009).
The very premise of the ALR is anachronistic. Advances in agronomy and biotechnology have dramatically increased yields, thereby easing demand for farmland. For example, reflecting land substitution, BC greenhouse area grew 305% between 1986 and 2006 (Statistics Canada, 2008c).
The existence of the land reserve is largely based on the notion that locally grown agricultural products are inherently healthier, safer, and more environmentally friendly, and that they are a necessary component of a reliable and secure food supply. This belief is known as “localism.” But a simple adherence to “food miles” [1] does not account for the variety of
“inputs,” such as energy, irrigation and fertilizer, that are necessary to grow food. Researchers have discovered that the most significant “cost” of food miles, by a large margin, is consumers’ shopping trips to the store and not the commercial distribution of food. Furthermore, the more consumers rely on unprocessed, locally grown agricultural products—thereby necessitating more frequent trips to the store and longer trips to farms and farmers’ mar-kets—the more food miles increase.
The localism movement also fails to account for the “comparative advantages” of Canada’s trading partners (i.e., the ability of other countries to produce products or services more efficiently and at lower cost). These advan-tages allow Canadians to enjoy plentiful quantities of coffee and bananas from Columbia, wine and cheese from France, gin from Britain, and rice from India, among other imports. Likewise, Canada produces a variety of products more efficiently than others elsewhere. Agriculture exports from BC, which totaled $1.6 billion in 2008 (BC Stats, 2009a), generate income for farm investment and employment.
Architects of the land reserve evidently distrusted the market to pro-vide adequate food supplies for BC residents. But there is plenty of evidence that the farm sector was expanding to meet the demands of a growing pop-ulation long before the land reserve was imposed. Even in the midst of a post-World War II housing boom, farm area in British Columbia actually increased 29% between 1951 and 1976 (Statistics Canada, 2009a). Between 1921 and 1976, land area for growing vegetables increased 604%, the num-ber of cattle increased 230%, and the number of chickens increased 397% (Statistics Canada, 2009a). In fact, the amount of farmland dedicated to field crops and vegetables was greater before the creation of the Agricultural Land Reserve than after.
1 The National Sustainable Agriculture Information Service (2008) defines “food miles” as the distance food travels from farm to plate.

The BC Agricultural Land Reserve: A Critical Assessment l 5
www.fraserinstitute.org l Fraser Institute
While some advocates regard the ALR as sacrosanct, it is entirely rea-sonable for citizens to question the legitimacy of a regime by which the gov-ernment deprives property owners of the use of their land—and the public of the tremendous benefits of markets—in order to indulge special inter-est groups that expect the general populace to shoulder the costs of their preferences.
Good intentions alone do not constitute sound policy, and history is crowded with examples of governments mismanaging natural resources. In the case of the ALR, the substantial direct costs of the presumed public good—farmland preservation—have been foisted upon a minority of citizens, and the indirect costs have fallen disproportionately upon those who can least afford them. Not only has the Agricultural Land Reserve failed to achieve some of its fundamental goals, but the government’s excessive interference in the agriculture sector has also imposed significant costs, including the highest home prices in Canada.
6 l The BC Agricultural Land Reserve: A Critical Assessment
Fraser Institute l www.fraserinstitute.org
Introduction
The Agricultural Land Reserve (ALR), established in British Columbia in 1973, has long been lauded as a model of progressivism by champions of govern-ment land use control. The provincial ban on the subdivision or development of the 4.7 million hectares that constitute the reserve has wrested control over land use decisions from landowners and local authorities in the affected areas. As this report documents, this centralization of zoning power, [2] a precept of the “smart growth” [3] canon, set British Columbia on a problematic course that has unduly taxed citizens and lowered standards of living across the province.
Proponents contend that the Agricultural Land Reserve serves “a com-pelling public interest” by sustaining local agriculture and shielding farmland from urban encroachment (Miller, 2004). As Gary Runka, the first general manager of the commission that manages the ALR, notes, “The establish-ment of the ALR was intended to be a permanent shift away from the view that ‘farmland is urban land in waiting’ and towards the view that ‘farmland is food production land for present and future generations’ ” (Runka, 2006).
The central conceit of land control schemes like the ALR is the notion that the government is better equipped than the transformative powers of markets to supply the public with both necessities, such as food, and ameni-ties, such as “green space.” But there is abundant evidence to the contrary.
For example, in the decades before the ALR was established, agricul-tural production in BC increased dramatically to meet the demands of a grow-ing population. Land area for growing vegetables increased 604% between 1921 and 1976, the number of cattle increased 230%, and the number of chickens increased 397%—all without the presence of farmland preservation dictates (Statistics Canada, 2009a). Meanwhile, advances in agronomy and biotechnology have dramatically increased yields, thereby easing demand for farmland, and global trade in food has delivered unparalleled choice and lower costs to many countries.
Various opinion surveys indicate broad public support for the Agricultural Land Reserve. But it is reasonable to wonder how many people
2 According to Gary Runka (2006), “The [ALR’s] relationship to local government plans and bylaws was abundantly clear. This was a provincial initiative … and as such, local governments were expected to … conform with … the ALR boundary.”
3 The term “smart growth” refers to a set of urban planning principles that favors high-density urban development and mass transit in place of suburban development and automobility.

The BC Agricultural Land Reserve: A Critical Assessment l 7
www.fraserinstitute.org l Fraser Institute
would actually voice opposition to “green space” or “saving the family farm.” Beyond their abstract notions of the existence value of local farms, the actual behavior of British Columbians speaks volumes. Rather than restricting their food purchases to locally grown products, the vast majority of consumers buy great quantities of imports and base their purchase decisions on a range of factors, including price, variety, and convenience, rather than product origin alone.
The disconnect between survey results and the public’s actions is not surprising, considering that many policy makers, academics, and media treat the ALR as sacrosanct and thus immune from the critical evaluation that all public policies should periodically undergo. [4] As Christopher Garrish notes in his 2003 paper on the land reserve,
a decade of complaint by agricultural producers that the ALR is a broken piece of legislation has resulted in very little substantive change. It has be-come a relatively easy and accepted practice to see such charges dismissed as the mere ranting of a self-serving and disgruntled minority of farmers seeking to have their land excluded from the reserve. That a number of independent reviews have corroborated their opinion that the commis-sion has lacked a clear mandate and definable purpose in preserving a working agricultural landscape is seldom reported. (2003: 38)
This report attempts to penetrate that analytic vacuum by examining some of the drawbacks and unintended consequences of the land reserve. While some ALR advocates will object, it is incumbent upon citizens to ques-tion the legitimacy of a system by which the government deprives property owners of the free use of their land—and the public of the tremendous ben-efits of markets—in order to indulge special interest groups who favor hay fields over houses and expect the general populace to shoulder the costs of their preferences.
Agriculture in Canada is encumbered by a host of misguided policies, including quotas and price supports that inflate the cost of food and dis-tort farming practices. This paper will focus only on the Agricultural Land Reserve, paying particular attention to the notion that locally grown agri-cultural products are inherently healthier, safer, and more environmentally
4 For example, in a “value-for-money” audit conducted in the mid-1990s, BC’s auditor general concluded that the authorities have failed to assess the secondary effects of the ALR, including the effects on land prices, land use, and tax revenues. Consequently, he recommended that “efforts should be made to obtain such information and provide it to policy-makers so that the full effects of the program can be understood” (Office of the Auditor General of British Columbia, 1994).
8 l The BC Agricultural Land Reserve: A Critical Assessment
Fraser Institute l www.fraserinstitute.org
benign, and that growing food locally is the only way to maintain a secure food supply.
This paper begins with an overview of the ALR’s structure, followed by an examination of agricultural trends and food channels in Canada and British Columbia. The sufficiency of BC’s agriculture is also analyzed, as are the health and safety claims of “locavores.” [5] The effects of land scarcity in the province also are addressed before the paper concludes with recommen-dations for policy reform.
5 “Locavores” only eat food grown within their “foodshed,” typically within a radius of no more than 100 miles from their residence.

The BC Agricultural Land Reserve: A Critical Assessment l 9
www.fraserinstitute.org l Fraser Institute
The establishment of the Agricultural Land Reserve
In the 1960s, concerns emerged in Canada, and elsewhere, about the conver-sion of farmland for development. In response to those concerns, the Lower Mainland Regional Planning Board [6] proposed to prohibit development on more than half of the Lower Mainland’s “usable” land area (ALC, n.d., History). The plan was approved by the provincial government in 1966, but effectively rendered obsolete the following year after provincial authorities expropri-ated more than 1,600 hectares of prime farmland for a new port terminal, the Roberts Bank Superport, abutting the Strait of Georgia (Quayle, 1998).
Although prevalent at the time, claims about the modern-day indis-criminate paving of farmland were largely baseless. In fact, Canada’s urban population had surpassed its rural population by 1921 (Statistics Canada, 2008a). Moreover, the province’s farmland area actually increased nearly 24% between 1951 and 1971, from 1.9 million hectares to 2.4 million hectares (Statistics Canada, 2009a). Even today, less than 1% of British Columbia’s land area is “urbanized” [7] (Statistics Canada, 2005), and the province has about the same amount of forest area as it did prior to European settlement (Shangaan Webservices Inc., n.d., Forestry).
Nonetheless, farmland preservation was a “hot issue” in the 1972 pro-vincial election (ALC, n.d., History). In the wake of a victory for the New Democratic Party, newly appointed Agriculture Minister David Stupich announced that the government would put forth legislation to prohibit the rezoning of farmland.
Predictably, Stupich’s announcement provoked a barrage of rezon-ing applications from property owners hoping to avoid the coming land use restrictions (ALC, n.d., History). Consequently, on December 21, 1972, the provincial government instituted a “freeze” on the subdivision or change in use of all property assessed as farmland or deemed suitable for agriculture (Runka, 2006). A follow-up order issued a month later further delineated the
6 The Lower Mainland Regional Planning Board was established in 1949 to coordinate plan-ning among the region’s 22 municipalities. The catastrophic Fraser River flood in 1948 persuaded officials of the need for flood plans that transcended municipal boundaries, and thus provided the impetus for creating a regional planning board. For more informa-tion, see British Columbia, Ministry of Community and Rural Development (n.d.).
7 Statistics Canada defines “urbanized” areas as centers of 1,000 or more people with a population density of 400 or more inhabitants per square kilometer.
10 l The BC Agricultural Land Reserve: A Critical Assessment
Fraser Institute l www.fraserinstitute.org
affected property as parcels of more than two acres with a Class 1-4 rating in agricultural capability under the Canada Land Inventory (CLI) (Agriculture and Agri-Food Canada, 2008a). [8]
The Agricultural Land Reserve was formalized under the Land Commission Act on April 18, 1973. Section 6 of the statute authorized the newly created Agricultural Land Commission to preserve agricultural land, encourage family farming, and encourage local governments to accommo-date agriculture in their policies. The commission was also given the power to create parks and assemble property for development. [9] The initial boundar-ies of the ALR were largely determined by 1975 (ALC, n.d., History).
The original reserve encompassed more than 4.7 million hectares—about 5% of the province’s land area, but about 50% of its non-mountainous land (Seabrooke et al., 2004). Property designations were based, in part, upon classifications derived from the CLI. The land inventory classifications, how-ever, relate to soil conditions, which alone do not determine the suitability of land for crops or livestock. Whether a parcel of land is cultivated or used for grazing livestock also depends on a host of ever-changing factors, including the cost of inputs, proximity to transportation and distribution facilities, and fluctuations in supply and demand (ALC, n.d., What is Agricultural Land). Thus, the land reserve designations were somewhat arbitrary from the start, and they treated agriculture as an entirely static enterprise despite centuries of evidence to the contrary.
Regional districts across the province were responsible for proposing the creation of land reserve parcels within their boundaries, but the deci-sion ultimately rested with the Agricultural Land Commission. In this way, the government seized control of land use in the province and, in so doing, imposed governmental decision making, which is often driven by special interests and political expediency, in place of market forces, which are driven by consumer preferences and property rights.
Ironically, the same folks whom the government was presumably intent on saving were among the ALR’s most vehement opponents. Indeed, the 1973 Land Commission Act specified that reserve land would not be deemed as expropriated in order to avoid the cost of compensating property owners for the effective seizure of their land. Former commission general manager Gary Runka recalls the ire of farmers whose land values plummeted overnight
8 The CLI rates the capability of land for agriculture, forestry, wildlife, and recreation. Class 1 soils have “no significant limitations” for growing crops; Class 2 have “moderate limita-tions”; Class 3 have “moderately severe” limitations; and Class 4 have “severe” limitations that restrict the range of crops that can be grown or require special conservation practices (Agriculture and Agri-Food Canada, 2008a).
9 The commission was relieved of that power in 1977 as it replicated the mandate of other government agencies.

The BC Agricultural Land Reserve: A Critical Assessment l 11
www.fraserinstitute.org l Fraser Institute
because of the ALR. “While, within some circles in BC and certainly outside BC, the government was praised for their bold action to save threatened farmland, some segments of the BC public were outraged at the imposition of the farmland freeze,” remembers Runka (2006). “Many farmers, although finding it increasingly difficult to farm in the wave of development pressure on their land, were furious at what they saw as a removal of their right to make profits from the sale of prime farmland for development purposes.” According to Runka, “Some of the largest gatherings that have ever taken place on the lawns of the BC Legislature occurred in protest of the farmland freeze and the establishment of the ALR” (Runka, 2006).
As partial recompense for the loss of property value, farmlands within the ALR were granted a 50% reduction in school taxes. [10] The province also offers preferential property tax rates for agricultural land. [11] This gen-erally means that property taxes are lower for farms than for similar non-agricultural properties. [12] But in areas where development pressures run strong, the tax breaks do not come close to compensating land owners for their lower property values; comparable land outside the ALR can easily fetch five to 10 times the price per acre of parcels tied up within the reserve (Scott et al., 1996). On the other hand, the tax breaks can result in the inclusion of marginal land in the reserve.
The economic constraints on property owners within the land reserve are dramatic considering the growth in the value of BC property over the last few decades. This median home price in British Columbia increased 75% between 2001 and 2006, compared to an average increase of 49% nationally (Statistics Canada, 2006a).
Since the Land Commission Act was passed, various governments have amended the act, both expanding and limiting the powers of the Agricultural Land Commission. For example, in 1977 the Social Credit government eased the appeals process for landowners whose applications to exclude property from the ALR were rejected by the Agricultural Land Commission. Originally, appeals to the provincial Cabinet could be made only with the approval of
10 Specifically, 50% of the assessed value of land is exempt from school taxes if the land is classified as a farm or designated as land within the reserve (British Columbia, n.d., School Tax Exemptions).
11 In order for land to be classified as a farm, property owners must meet minimum gross income requirements from the sale of agricultural products. Income requirements vary according to farm size. Farmland values vary by soil type, productive capacity, and loca-tion, and range from about $500 to $5,000 per acre. See Farm Assessment Review Panel (2009) for more information.
12 Farmers also were granted some protection from nuisance complaints by olfactory-afflicted neighbors under the 1996 Farm Practices Protection Act (Runka, 2006).
12 l The BC Agricultural Land Reserve: A Critical Assessment
Fraser Institute l www.fraserinstitute.org
the commission. But a 1977 amendment allowed a landowner to request an appeal directly from the Minister of Environment. [13]
Of considerable controversy was a 1988 order-in-council that effec-tively forced the Agricultural Land Commission to allow the development of golf courses within the ALR (Runka, 2006). The order was rescinded in 1991, but not before 181 golf course proposals—some of which included resort hotels—were submitted, encompassing 8,400 hectares of land within the reserve. Ultimately, 89 proposals were allowed to proceed, subject to local bylaws and the land commission’s conditions (Quayle, 1998).
The golf course imbroglio is but one example of the regulatory capri-ciousness that has characterized the ALR throughout its history. The arbitrary nature of some of the commission’s actions was underscored in a 1994 audit of the commission by the BC auditor general, which concluded:
the Commission needs clearer direction, improved management pro-cesses, and better information about the results it is achieving if it is to carry out its role adequately and provide full public accountability on its performance … Although the legislation gives the Commission a general mandate to preserve agricultural land, the Commission has not estab-lished clear objectives for doing so. Without such objectives, the long-term direction for the ALR is unclear and there is insufficient informa-tion against which actual results can be compared. (Office of the Auditor General of British Columbia, 1994: 3)
The commission is currently composed of a chairperson and 18 com-missioners organized into three-person panels, each representing six regions (South Coastal, Island, Okanagan, Kootenay, Interior, and North). Each panel reviews applications for the inclusion or the exclusion of property in the land reserve. All applications to the commission must first be approved by the municipality in which the property is located. However, the Land Commission Act, as a provincial statue, supersedes local government bylaws.
The commission has considerable discretion in determining land sta-tus. As the Agricultural Land Commission (2009) notes in its most recent annual report, “The Commission must look beyond the boundaries of the property in question and consider the impact on surrounding agricultural activities, current or future.” Clearly, regulatory decision-making based only upon speculation constitutes unchecked authority.
Furthermore, economic imperatives in the agriculture industry go largely ignored. For example, the commission routinely disallows the sub-division of farm property for the purpose of raising capital to invest in agri-cultural operations. According to the commission, “While that might appear
13 Direct appeals were eliminated in 1993.

The BC Agricultural Land Reserve: A Critical Assessment l 13
www.fraserinstitute.org l Fraser Institute
to have some merit in particular instances, the Commission usually consid-ers the long-term negative implications of splitting properties to override the short-term benefit of obtaining additional capital” (Agricultural Land Commission, 2009). On the other hand, government entities have had far more success with the commission. Local officials have succeeded in exclud-ing 96,639 hectares from the land reserve compared to only 42,437 hectares for private landowners (Agricultural Land Commission, 2009).
Simply put, the commission acts as both judge and jury, and property owners who wish to enjoy the true value of their land have little recourse.

14 l The BC Agricultural Land Reserve: A Critical Assessment
Fraser Institute l www.fraserinstitute.org
Agriculture in Canada
The importance of agriculture to British Columbia must be measured in the context of Canada’s overall agricultural sector. As less than 3% of BC’s land base is categorized as capable of sustaining a range of crops, the province relies on the rest of the country, particularly Saskatchewan, Alberta and Ontario, as well as the rest of the world, for its food supply.
The amount of farm area in Canada, which has changed little in recent decades, totals nearly 68 million hectares, or 7% of the country’s total land area (Statistics Canada, 2008d). The amount of land used for crops varies from year to year, but in 2006, when the most recent Census of Agriculture was undertaken, about 36 million hectares were used for growing crops (Statistics Canada, 2008d).
About 81% of all farmland in Canada is located in the Prairies: Saskatchewan accounts for 38.5%, Alberta for 31.2%, and Manitoba for 11.4%. Among the other provinces, Ontario holds 8% of the nation’s farmland, Quebec 5%, and British Columbia a mere 4.2% (Agriculture and Agri-Food Canada, 2008d). The number of farms in Canada has been falling (figure 1) despite numerous attempts by federal, provincial, and local governments to subsidize farm operations: the number of farms dropped by 11% between 1996 and 2001, and by another 7% between 2001 and 2006 (Agriculture and Agri-Food Canada, 2008b).
To a large extent, the smaller number of farms reflects consolidation in agriculture, advances in technology, and improved productivity, which has outpaced productivity gains in both the manufacturing and business sectors (Agriculture and Agri-Food Canada, 2008c).
Some of the increase in the productivity of cropland can be explained by a 25.2% decline in summer fallow. The use of “no-till seeding” to retain soil moisture has reduced the need to leave land fallow for a year (Statistics Canada, 2002). Moreover, animal productivity, measured in pork production per sow, has increased by more than 38% due to improved genetics, animal nutrition, and health, as well as improved animal handling. Total milk produc-tion has remained constant, but the output per cow has increased dramatically. As a result, Canada’s total dairy herd has dropped by half (Agriculture and Agri-Food Canada, 2008c) and far less farmland is needed for dairy operations.
The average farm has grown in size from 231 hectares in 1986 to 295 hectares in 2006 (Statistics Canada, 2008d). Farms in Saskatchewan are the largest, with an average land area of 586 hectares. Farms in Newfoundland and Labrador are the smallest, with an average land area of only 65 hectares (Agriculture and Agri-Food Canada, 2008b).

Num
ber
of f
arm
s
Figure 1: Total number of farms in Canada, 1986 to 2006
Source: Statistics Canada, 2008f.
100,000
200,000
300,000
400,000
20062001199619911986
The BC Agricultural Land Reserve: A Critical Assessment l 15
www.fraserinstitute.org l Fraser Institute
In recent decades, larger farms have generated a growing share of Canada’s agricultural production. In the past decade, the share of total agricultural production by very large farms (gross revenues of more than $500,000) has increased from 29% to 55% (Agriculture and Agri-Food Canada, 2008c). In contrast, the share of production by farms with revenues of less than $250,000 declined from 52% to 27% (Agriculture and Agri-Food Canada, 2008c).
The increase in the share of production by larger farms is not unique to Canada (Agriculture and Agri-Food Canada, 2008c). Larger farms are gener-ally more efficient by virtue of economies of scale and the optimization of new technologies—improvements that smaller “family farms” either cannot afford or lack the technical expertise to implement.
The transition to larger farms also reflects the larger proportion of agricultural operations with higher revenues. For example, the number of farms reporting gross receipts of $250,000 or more has increased from 3% of all farms in 1981 to 17% of farms in 2006. Moreover, the number of farms reporting gross receipts of $1 million or more has increased from 1,080 in 1981 to 5,902 in 2006 (Agriculture and Agri-Food Canada, 2008b). In 2004, the average net worth of a Canadian farm was $897,600, com-pared to $551,500 in 1993. This reflects an increase in assets (land values, in particular), an increase in average farm size, and the value of agricultural

Figure 2: Distribution of farms in Canada by gross receipts, 2006
Source: Agriculture and Agri-Food Canada, 2008d.
Low income – 19%
Non-family farm – 1%
Pension – 19%
Medium business focused – 15%
Large business focused – 14%
Small business focused – 11%
Very large business focused – 10%
Lifestyle – 11%
16 l The BC Agricultural Land Reserve: A Critical Assessment
Fraser Institute l www.fraserinstitute.org
quotas. [14] Indeed, program payments to farms with revenues of $250,000 or more tripled between 1995 and 2005 (Agriculture and Agri-Food Canada, 2008d).
At the other end of the spectrum, nearly half of Canada’s farms earn less than $35,000 per year, are operated by farmers aged 65 and older (or farmers aged 60 to 64 who receive a pension), and are “lifestyle” farms (their owners earn more off-farm income than farm-related income) (figure 2).
Despite expanded trade opportunities globally, Canadian taxpayers supply substantially more support to agriculture than they did in the past. Support payments totaled an estimated $8.4 billion in fiscal year 2006/2007, equal to 40% of the sector’s GDP—the second largest level ever recorded (Agriculture and Agri-Food Canada, 2008d). Provincial tax exemptions and rebates associated with primary agriculture for 2006/2007 were estimated at $490 million (Agriculture and Agri-Food Canada, 2008e). Still, nearly half of all farm operators supplement their income with an off-farm job
14 An agricultural quota is effectively a license to sell a specific quantity of a commodity as set by the government under supply management programs that limit production in order to maintain higher prices.
The BC Agricultural Land Reserve: A Critical Assessment l 17
www.fraserinstitute.org l Fraser Institute
(Statistics Canada, 2008b), which provides about 60% of their annual earnings (Agriculture and Agri-Food Canada, 2008d).
Among the most notable trends of late is the dramatic expansion of Canada’s greenhouse area, which increased by 205% between 1986 and 2006 (Statistics Canada, 2008c). Between 2001 and 2006, vegetables surpassed flowers as Canada’s main greenhouse product (Agriculture and Agri-Food Canada, 2008b). Ontario, with over 126 million square feet, is home to 53% of Canada’s total greenhouse area. After Ontario, British Columbia and Quebec have the most greenhouse area, with 57 million square feet and 30 million square feet, respectively (Agriculture and Agri-Food Canada, 2008b). Greenhouse production can be particularly efficient in regions where farm-land is in short supply or costly to maintain. On a square meter basis, green-house productivity can be 20 times higher than field crop production (British Columbia, Ministry of Agriculture and Lands, 2006).
Canada exports about half of the food it produces and imports about half of the food consumed in the country (Statistics Canada, 2006b). This benefits both producers and consumers. In relative terms, Canada is the fourth-larg-est exporter and fifth-largest importer of agricultural and agri-food products worldwide; its total agri-trade was valued at $50 billion in 2006 (Agriculture and Agri-Food Canada, 2008d). The North American Free Trade Agreement has dramatically expanded Canada’s import and export markets; agriculture exports to the United States have quadrupled since 1991, while exports to Mexico have increased nine-fold. Canada also exports processed food prod-ucts to 185 other countries (Agriculture and Agri-Food Canada, 2008d).

Table 1: Classification of the agricultural capability of BC lands
Agricultural capability % of BC’s land base
Land in the Agricultural Land Reserve 5.0
CLI Class 1-4 (No significant limitations to severe limitations) 2.7
CLI Class 1-3 (No significant limitations to moderately severe limitations) 1.1
CLI Class 1 (No significant limitations in use for crops) 0.06
Land in the ALR suitable for tree fruit production 0.04
Source: Smith, 1998.
18 l The BC Agricultural Land Reserve: A Critical Assessment
Fraser Institute l www.fraserinstitute.org
Agriculture in British Columbia
British Columbia was not made for farming. Mountains span vast regions of the province, rainfall is very heavy in places, and extreme cold temperatures truncate growing seasons across the north. About three-quarters of BC’s land lies above 1,000 meters in elevation, and more than 18% is rock, ice, or tundra (Royal British Columbia Museum, 2004). Indeed, only 1.1% of BC land is con-sidered to be suitable for a broad range of agriculture (table 1) (Smith, 1998).
British Columbia ranks sixth among the provinces in farm cash receipts (British Columbia, Ministry of Agriculture and Lands, n.d.). Compared to much of Canada and more arable regions of the world, the province’s agri-cultural capacity is miniscule (Holbek, 1998). This is exacerbated by the fact that a considerable amount of land in the agricultural reserve is not cultivated; only 25% to 50% of the ALR is actively farmed at any given time (Garrish, 2003). As Christopher Garrish (2003) argues, this suggests that the value of the ALR “does not appear to be in its ability to encourage agriculture, although this was one of its founding mandates.”
BC farms do manage to produce a range of goods (table 2). For exam-ple, grain is grown in the prairie landscape of the Peace River region, live-stock operations are common in the foothills of the southern interior, the Okanagan Valley is well suited to growing tree fruits and grapes, and the Fraser Valley produces vegetables, milk, eggs, chicken, turkeys, pork, and berries (Shangaan Webservices Inc., n.d., Agriculture).
The Agricultural Land Reserve has not shielded British Columbia from some of the same agricultural trends experienced nationally and internation-ally. The number of BC farms peaked in 1996 at 21,748, but fell to 19,844 in

Table 2: Select BC commodities (by hectare use) and livestock (by number), 2006
Product Hectares Number
Wheat 23,076
Oats 32,802
Barley 24,589
Corn 13,242
Canola 26,018
Alfalfa 202,019
Total vegetables 6,957
Total fruits 19,822
Total pigs 135,826
Total cattle 800,855
Total sheep 61,033
Chickens 18,341,907
Source: Statistics Canada, 2007d.
The BC Agricultural Land Reserve: A Critical Assessment l 19
www.fraserinstitute.org l Fraser Institute
2006, a decline of nearly 9% (British Columbia, Ministry of Agriculture and Lands, 2007). This was accompanied by a 23% increase in the average farm size, from 116 hectares in 1996 to 143 hectares in 2006 (British Columbia, Ministry of Agriculture and Lands, 2007), which indicates a consolidation of agricultural operations. Indeed, the number of family farms fell 8% between 1996 and 2006. This change was accompanied by a substantial increase in the number of farms with gross receipts in excess of $250,000 annually (table 3).
Furthermore, the land reserve has not nurtured a new generation of farmers (figure 3). The number of farmers under the age of 35 in British Columbia declined 26% between 2001 and 2006—virtually the same rate of decline in Canada as a whole (Statistics Canada, 2007c). Officials consider this troubling evidence that young people either do not consider farming to be a viable enterprise and/or they cannot afford the cost of buying into the agricultural quota system (Metro Vancouver, 2009). Clearly, the Agricultural Land Reserve has not nurtured a new generation of farmers.
Also noteworthy is the increase in the amount of BC farm area rented or leased. Between 1986 and 2006, that amount grew nearly 35%, from 953,952 hectares to 1.3 million hectares (Statistics Canada, 2008d). In con-trast, Saskatchewan and Alberta posted increases of only 2% and 4%, respec-tively. Analysts regard the phenomenon as evidence that farmsteads are being

Figure 3: Average age of farm operators in British Columbia, 1991 to 2006
Source: Statistics Canada, 2009b.
40
50
60
2006200119961991
Ag
e (y
ears
)
Table 3: Number of farms in British Columbia, classified by gross receipts, 1971 to 2006
Gross receipts ($) 1971 1976 1981 1986 1991 1996 2001 2006
< 2,500 9,756 9,396 6,415 5,364 4,707 3,813 2,908 2,527
2,500-4,999 2,170 2,377 3,060 2,807 2,693 4,443 4,097 3,954
5,000-9,999 2,016 2,047 2,487 2,456 2,624 3,274 3,082 2,985
10,000-24,999 2,282 2,297 2,802 2,832 2,965 3,413 3,426 3,194
25,000-49,999 1,295 1,256 1,748 1,757 1,818 1,959 1,936 2,037
50,000-99,999 594 1,116 1,346 1,231 1,416 1,533 1,464 1,592
100,000-249,999 226 943 1,491 1,472 1,494 1,589 1,509 1,536
250,000-499,999 45 502 801 978 1,006 879 889
> 500,000 16 161 343 530 805 989 1,130
< 10,000 10,087 9,466
500,000-999,999 618
1,000,000-1,999,999 328
> 2,000,000 184
Note: All dollar values are given in current dollars for each respective year.
Source: British Columbia, Ministry of Agriculture and Lands, 2007.
20 l The BC Agricultural Land Reserve: A Critical Assessment
Fraser Institute l www.fraserinstitute.org

The BC Agricultural Land Reserve: A Critical Assessment l 21
www.fraserinstitute.org l Fraser Institute
used as residences, and that aging farmers have left to generate income from property they no longer can cultivate themselves and which they cannot sell for development. In either case, the Agricultural Land Reserve has evidently failed to sustain the number of farm owner-operators in BC.
Some of this decline may be due to the poor economics of farming in BC. For many farmers, agriculture alone does not pay enough to cover the bills. Some 54.9% of BC farm operators supplemented their income with an off-farm job in 2005 (Statistics Canada, 2008b).
Mirroring the national expansion of greenhouses, greenhouse area in BC grew 305% between 1986 and 2006 (Statistics Canada, 2008c). This change reflects ingenuity and innovation unforeseen by ALR advocates. Greenhouse production now accounts for a substantial part BC’s overall agricultural pro-duction. For example, greenhouse-grown vegetables and flowers use 0.01% of British Columbia’s total farmland to generate 21% of the total value of agri-cultural production in the province (British Columbia Greenhouse Growers’ Association, 2007). Furthermore, greenhouse production now meets 48% of tomato consumption in the province, 150% of bell pepper consumption, and 75% of cucumber consumption (British Columbia, Ministry of Agriculture and Lands, 2006).
The mix of commodities grown in BC, which has changed over the years, currently reflects a decline in emphasis on field crops, [15] vegetables, and tree fruits, in favor of nursery products, berries, and livestock (tables 4a and 4b). In fact, there was more farmland dedicated to field crops and veg-etables before the advent of the Agricultural Land Reserve than in 2006, when the latest agricultural census was undertaken. The amount of farmland used for crops actually declined by 5.1% between 2001 and 2006 (British Columbia, Ministry of Agriculture and Lands, 2007).
BC farmers currently produce only 48% of the foods consumed in the province. When comparing current agricultural production to the dietary guidelines of Canada’s Food Guide to Healthy Eating, the “self-reliance quotient” of BC agriculture drops to 34% (British Columbia, Ministry of Agriculture and Lands, 2006). This is because the recommendations call for higher levels of fruit and vegetable intake than BC residents actually con-sume, and BC is not “self-reliant” in that its home-grown production is not on par with the recommended intake for British Columbians (table 5). In fact, the province imports about three times as much fruit as it exports (British Columbia, Ministry of Agriculture and Lands, 2006). [16]
15 The term “field crops” refers to a range of grains (wheat, oats, barley, corn rye, etc.), as well as potatoes, peas, hay, and other fodder.
16 There is no evidence that the Agricultural Land Reserve induces British Columbians to include more fresh fruits and vegetables in their diet. BC residents consume about the same number of fruit and vegetable servings per day as other Canadians (Statistics Canada,

Table 4a: BC farm area devoted to various commodities (hectares), 1971 to 2006
1971 1976 1981 1986 1991 1996 2001 2006
Field crops 416,769 465,205 541,867 542,548 526,832 536,175 389,987 351,554
Vegetables 7,250 7,464 7,867 7,568 8,275 7,117 7,277 6,957
Berries/Grapes 7,145 7,687 10,436 12,038
Tree fruits 11,513 10,956 10,735 9,924 8,367 7,057
Nursery products/Sod 1,244 2,204 3,302 4,149 5,044 5,349
Source: British Columbia, Ministry of Agriculture and Lands, 2007.
Table 4b: Livestock raised on BC farms (number), 1971 to 2006
1971 1976 1981 1986 1991 1996 2001 2006
Cattle 573,171 690,443 789,841 689,957 752,414 814,103 814,949 800,855
Pigs 78,621 55,549 254,895 216,895 223,776 174,169 165,816 135,826
Sheep/Lambs 53,112 42,729 66,988 57,243 74,136 71,603 83,307 61,033
Poultry 7,861,488 9,772,121 9,975,871 9,229,529 11,284,526 13,759,261 18,820,347 18,341,907
Source: British Columbia, Ministry of Agriculture and Lands, 2007.
Table 5: BC-grown foods as a proportion of BC consumption and recommended intake, 2001
Food group Home-grown production as a % of recommended intake
Home-grown production as a % of consumption
Dairy 45 57
Meat 66 64
Fruits 39 159
Vegetables 41 43
Grain 15 14
Source: British Columbia, Ministry of Agriculture and Lands, 2006.
22 l The BC Agricultural Land Reserve: A Critical Assessment
Fraser Institute l www.fraserinstitute.org
To produce enough food locally to meet the recommended dietary standards for the BC population in 2025, given existing technology, the amount of farmland with access to irrigation would need to increase by 92,000 hectares, or 49% above 2005 levels (British Columbia, Ministry of
2004). According to federal figures, 54% of BC residents eat five or less servings of fruits and vegetables daily, compared to 55% in Ontario, 52% in Quebec, and 56% in Alberta. A smaller proportion—about 37%—of British Columbians consumes between five and 10 servings per day, compared to 36% in Ontario, 38% in Quebec, and 33% in Alberta.

The BC Agricultural Land Reserve: A Critical Assessment l 23
www.fraserinstitute.org l Fraser Institute
Agriculture and Lands, 2006). To maintain the current level of agricultural “self-reliance” in 2025, farmers would need to increase production by 30% over 2001 levels (British Columbia, Ministry of Agriculture and Lands, 2006).
Food processing
Food processing contributes about $1.9 billion annually to BC’s gross domes-tic product (GDP), about 6% of the total GDP for goods produced in British Columbia (British Columbia, Ministry of Agriculture and Lands, n.d.).
The food processing industry is composed primarily of small- to medium-sized companies with fewer than 50 employees. Taken together, these companies process some 200 agricultural and 80 seafood commodities (British Columbia, Ministry of Agriculture and Lands, n.d.). Nearly half of the firms are located in Metro Vancouver and the Fraser Valley; another 30% are located in the Okanagan Valley and the coastal regions (British Columbia, Ministry of Agriculture and Lands, n.d.).
The industry is not sustained by local agriculture alone. Abundant energy, water, and other natural resources, as well as transportation and communication networks and ties to the Pacific Rim, make the province an attractive location for the food processing industry.
Localism
That the BC population has grown in close proximity to prime agricultural land is no mystery. Settlers located where their basic needs could best be met. Advances in transportation, refrigeration, and food preservation have since eliminated the need for people to reside close to farmland. Consequently, urban growth has extended into rural areas.
Despite this progression, there has emerged in recent years a move-ment dedicated to the proposition that locally grown foods are a necessity, that they are safer, tastier, more nutritious, more environmentally friendly, and even the best hope for world peace. As “Eat BC,” a provincial campaign to promote local foods, explains:
By supporting local growers and suppliers you help the environment, re-ducing your carbon-footprint by limiting the amount of shipping and fuel consumption needed to get the seasonal foods to you. The more local food we consume, the higher the demand = the more farmers are needed to supply the products and voila! A healthier local economy, more local jobs within agriculture and a stronger, more vibrant local food system. BC food and beverages – Fresher, Faster! It’s Fresh, Local and Tasty! (Eat BC!, n.d.)

24 l The BC Agricultural Land Reserve: A Critical Assessment
Fraser Institute l www.fraserinstitute.org
This penchant for localism is but the latest justification for the exis-tence of the Agricultural Land Reserve. There may be entirely legitimate reasons why individuals would want to eat only locally grown products. But as a matter of public policy, localism imposes hefty, unwarranted costs on consumers.
The concept of localism originated in Southern Europe, where food producers regard geography as a criterion for certifying the authenticity of specialty products (Agriculture and Agri-Food Canada, 2007). For exam-ple, champagne cannot be called champagne unless it is produced in the Champagne region of France, just as Parmesan is a legally protected label in Europe, referring exclusively to the cheese produced in a specific region of Northern Italy.
Today, however, localism is associated with the rejection of global trade and agricultural technology, and is based upon a rather romanticized image of the “family farm.” The acceptance of this “ethic” reflects a degree of ignorance of (or a lack of appreciation for) the forces that have driven the development of modern farming and the expansion of global trade.
For example, Alisa Smith, in a chronicle of her year on a “100-mile diet,” frets that her high-rent Vancouver neighborhood lacks chickens and cows. “It was the bourgeois reform movement of the late nineteenth century that banished livestock to the countryside,” she writes (Smith and Mackinnon, 2007). In reality, cohabiting with livestock would not be a particularly pleas-ant experience. In his book The Good Old Days — They Were Terrible! Otto L. Bettmann notes that the “images of idyllic simplicity” many associate with the family farm are grossly inaccurate. “In place of a neat rose garden, an expanse of muck and manure surrounded the farmhouse, sucking at boots and exud-ing a pestilential stench that attracted swarms of flies, ticks and worms to amplify the miseries of man and beast,” Bettmann writes.
Smith’s love affair with local produce was not without its price, how-ever. The honey she purchased as a substitute for imported sugar cost $11 a pound (compared to five pounds of sugar for $2.59). Nor could she find a local supply of her favorite legumes. And when she and her co-author J.B. Mackinnon finally tracked down wheat for bread, they discovered it was infested with weevils, which they picked out by hand at their kitchen table.
There is substantial evidence that locally produced food is not neces-sarily superior—environmentally, nutritionally, or economically. A rigorous application of localism could actually undermine nutrition. Reduced access to a full range of products, as well as higher prices resulting from a more limited food supply, would reduce consumption of high-value fruits, vegetables, and other components of a healthy diet. Moreover, by reducing the disciplining effects of agricultural competition, farm operators would have less incentive to increase productivity and eliminate waste, thereby reducing the environ-mental impacts of agriculture.

The BC Agricultural Land Reserve: A Critical Assessment l 25
www.fraserinstitute.org l Fraser Institute
The concept of “food miles,” a central tenet of localism, equates the dis-tance that food travels to “environmental sustainability.” [17] But the odometer approach to calculating environmental impact is far too simplistic for so com-plex an equation. As researcher David J. Hess notes, “The connection between localism and environmental dividends is variable and tenuous” (Hess, 2008). Indeed, researchers commissioned by Britain’s Department of Environment, Food, and Rural Affairs concluded that “a single indicator based on total food kilometers is an inadequate indicator of sustainability” (Smith et al., 2005).
Consider, for example, that the dominant system of food supply involves trucking products from central distribution centers to suppliers and supermarkets across a metropolitan area. This reduces the environmental impacts per ton of food. Local farmers may travel fewer miles to deliver their goods to the market, but they do so in smaller vehicles that carry lighter loads. Thus, as the British researchers recently discovered, the lesser distance to markets for locally grown products is offset by the smaller vehicles and lighter loads.
The British researchers also found that the most significant “cost” of food miles, by a large margin, was consumers’ shopping trips to the store, and not the planes, trains, ships, and trucks that distribute food worldwide. They found that if the number of consumers who relied on unpro cessed, locally grown agricultural products increased, then total food miles would also increase because more frequent trips to the store would be nec essary and consumers would have to drive longer distances to shop at farms and farmers markets. In British Columbia, for example, there are more than 1,100 supermarkets [18] compared to only about 105 farmers markets throughout the province (BC Association of Farmers’ Markets, n.d.).
Furthermore, the simple food miles equation does not account for the variety of “inputs,” such as energy, irrigation, and fertilizer, that are neces-sary to grow food. Caroline Saunders, a professor at New Zealand’s Lincoln University, conducted “life cycle” analyses of inputs for food products and concluded that “Food miles is a very simplistic concept relating to the dis-tance food travels as a measure of its impact on the environment … it is not the distance that should be assessed but the total energy used, production to plate, including transport” (Saunders et al., 2006). For example, raising lamb in New Zealand and shipping it to Britain actually consumes less energy than raising lamb in Britain because farming in New Zealand is less energy-intensive (Saunders et al., 2006). As the Saunders study notes, “The energy used in producing lamb in the UK is four times higher than the energy used
17 The National Sustainable Agriculture Information Service (2008) defines “food miles” as the distance food travels from farm to plate.”
18 The number of “supermarkets” does not include smaller grocery stores and markets in the province (Statistics Canada, 2007b).

26 l The BC Agricultural Land Reserve: A Critical Assessment
Fraser Institute l www.fraserinstitute.org
by New Zealand lamb producers, even after including the energy used in transporting New Zealand lamb to the UK.” The same holds true for dairy products and apples.
Indeed, the “comparative advantages” of Canada’s trading partners are precisely why the country imports coffee and bananas from Columbia, wine and cheese from France, gin from Britain, and rice from India, among other products. No doubt these products could be produced in Canada, but the price would make them unaffordable to most people.
For its part, British Columbia produces high-quality greenhouse tomatoes that are sold to the United States, while it imports less expensive field tomatoes from California. Yearling cattle raised in BC are often sold to Alberta, where they are fed for a time before slaughter. Some of this meat is shipped back to British Columbia for consumption.
Comparative advantage in agriculture is particularly important to Canada, where agricultural land is in relatively short supply, growing seasons are short, and the climate is extremely variable. According to analysts with the Mercatus Institute at George Mason University, “Physical environments that require significant heating and/or cold protection technologies entail much greater energy consumption than more favorable climates, often on a scale that dwarfs the energy requirements associated with the transpor-tation of agricultural products from more remote locations” (Shimizu and Desrochers, 2008).
As for locavores’ distaste for modern agricultural technology, agrono-mist Norman Borlaug, widely regarded as “the father of the ‘Green Revolution,’ ” has pointed out that modern agriculture has allowed us to set aside tens of millions of acres of farmland as wilderness (Bailey, 2000). Between 1960 and 1990, for example, new agricultural methods allowed farmers to more than double production of the 17 most important food, feed, and fiber crops grown in the United States—on 25 million fewer acres of farmland.
David Baxter, writing on the future of the ALR, characterizes localism as “unrealistic isolationism”:
The basis of the [farm] preservationist argument is that we need to have agricultural land to feed current and future generations of British Columbians, to ensure that we have food supply security, and a sustain-able economy … Playing strongly to emotions and fear rather than logic and fact, this argument is, at best, unrealistic isolationism. Unrealistic because there is no way the province’s agricultural resources can pos-sibly feed our current population … let alone our future population of 6 million. This is true not only with respect to the volume of produce that our land and climate can produce … but also the range of food they can produce. … Simply put, we are dependent—overwhelmingly dependent—on other parts of the world for our food supply. We always have been and

The BC Agricultural Land Reserve: A Critical Assessment l 27
www.fraserinstitute.org l Fraser Institute
we always will be … It makes no more sense to attempt to ensure that the province have a secure internal food supply than it does that Kitsilano or Atlin have one … It is not logical to accept a food trade relationship between the Lower Mainland and the Okanagan basin, but not to accept one between the Lower Mainland and Alberta or Quebec. And if we can accept food trade with Alberta and Quebec, why cannot we accept it with Washington State and Thailand? If there is a concern with food supply security, interdependence, not local production, is the direction we should follow. (Baxter, 1998)
Geographic food flows through British Columbia
Although BC’s total land area amounts to about 925,000 square kilometers, the vast majority of the province is wholly unsuited to cultivating crops or raising livestock. Consequently, the province has no choice but to engage in inter-provincial trade, as well as trade with nations around the globe. It is well-positioned to do so, given its close proximity to the United States and its direct access to the Pacific Ocean. Imports provide the province with an abundant and affordable supply of both fresh produce and processed foods. In the absence of trade, consumers would pay higher prices for food while losing access to a host of higher quality products (Shimizu and Desrochers, 2008).
Agricultural exports, which totaled $1.6 billion in 2008 (BC Stats, 2009a), generate income for farm investment and employment. Agricultural exports are also helping to offset the slump in BC lumber sales due to the virtual collapse of the US housing market. But to a considerable degree, pro-vincial commodities depend upon imports to add value to products that will be exported. For example, 31% of the content in crop and animal prod-ucts exported from British Columbia includes components that have been imported into the province (Horne, 2008). In fact, the import content in BC’s agricultural exports is generally higher than that in other provincial exports. The export value of BC agricultural products is thus dependent on imports, providing further evidence that “self-reliance” is unachievable.
It is also important to put the value of BC’s agricultural exports in context. Relative to other commodities, agricultural products account for less than 5% of all exports originating in BC (table 6). Therefore, while the land reserve helps to generate some export revenue, that contribution must be weighed against the tremendous costs it imposes on the province.
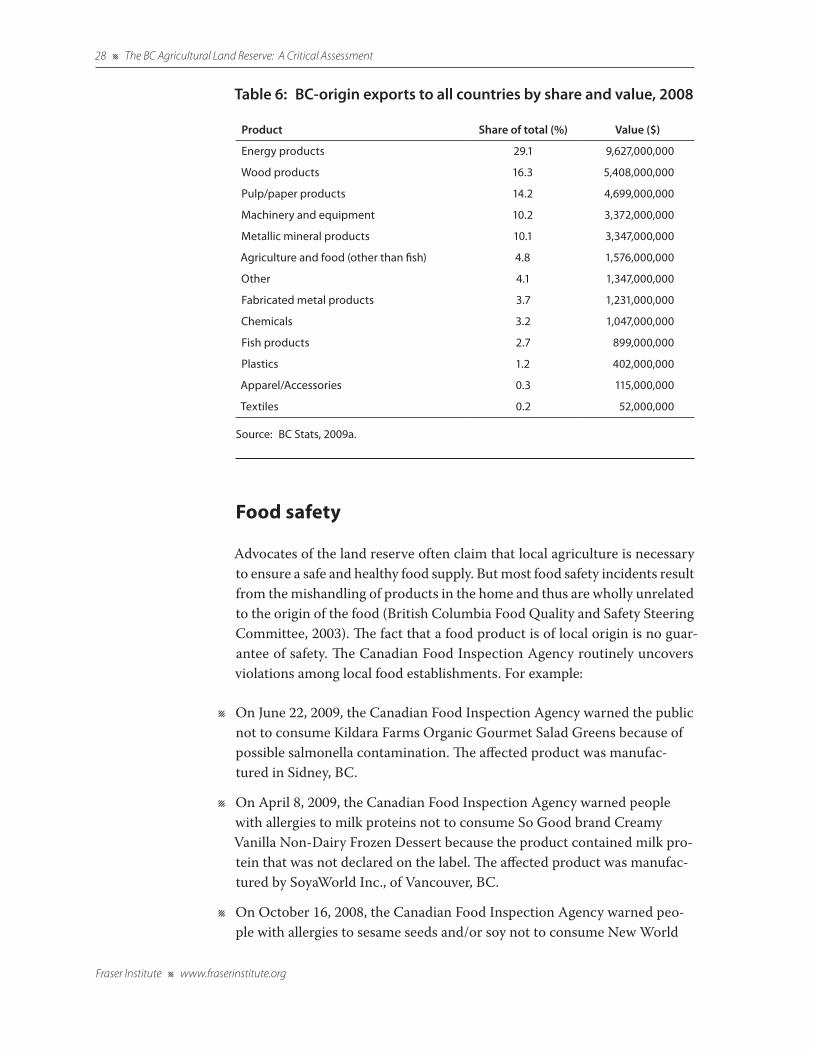
Table 6: BC-origin exports to all countries by share and value, 2008
Product Share of total (%) Value ($)
Energy products 29.1 9,627,000,000
Wood products 16.3 5,408,000,000
Pulp/paper products 14.2 4,699,000,000
Machinery and equipment 10.2 3,372,000,000
Metallic mineral products 10.1 3,347,000,000
Agriculture and food (other than fish) 4.8 1,576,000,000
Other 4.1 1,347,000,000
Fabricated metal products 3.7 1,231,000,000
Chemicals 3.2 1,047,000,000
Fish products 2.7 899,000,000
Plastics 1.2 402,000,000
Apparel/Accessories 0.3 115,000,000
Textiles 0.2 52,000,000
Source: BC Stats, 2009a.
28 l The BC Agricultural Land Reserve: A Critical Assessment
Fraser Institute l www.fraserinstitute.org
Food safety
Advocates of the land reserve often claim that local agriculture is necessary to ensure a safe and healthy food supply. But most food safety incidents result from the mishandling of products in the home and thus are wholly unrelated to the origin of the food (British Columbia Food Quality and Safety Steering Committee, 2003). The fact that a food product is of local origin is no guar-antee of safety. The Canadian Food Inspection Agency routinely uncovers violations among local food establishments. For example:
l On June 22, 2009, the Canadian Food Inspection Agency warned the public not to consume Kildara Farms Organic Gourmet Salad Greens because of possible salmonella contamination. The affected product was manufac-tured in Sidney, BC.
l On April 8, 2009, the Canadian Food Inspection Agency warned people with allergies to milk proteins not to consume So Good brand Creamy Vanilla Non-Dairy Frozen Dessert because the product contained milk pro-tein that was not declared on the label. The affected product was manufac-tured by SoyaWorld Inc., of Vancouver, BC.
l On October 16, 2008, the Canadian Food Inspection Agency warned peo-ple with allergies to sesame seeds and/or soy not to consume New World

The BC Agricultural Land Reserve: A Critical Assessment l 29
www.fraserinstitute.org l Fraser Institute
Natural Foods Tofu Burgers, Vegi Burgers, and Lentil Burgers. The affected products contained sesame seeds or soy that was not declared on the label. The affected products were manufactured by New World Natural Foods, of Burnaby, BC.
l On August 1, 2008, federal authorities warned consumers with milk aller-gies that the label of some René Rey Sun, Moon, Stars Dark Chocolate failed to disclose milk protein as an ingredient. Consumption of these products could cause serious or life-threatening reactions in persons with milk allergies.
l On September 19, 2007, an employee of the Aberdeen Farm Market in Coldstream, British Columbia, pled guilty in provincial court to sell-ing food prepared under unsanitary conditions—in this case, processing unpasteurized apple juice under an open-raftered roof where birds were roosting. (Canadian Food Inspection Agency, 2009)
Consumer preferences
While brimming with enthusiasm, the “Eat BC” campaign’s claims about the superiority of local foods—that they are “fresh” and “tasty”—are overstated. For example, the Center for Consumer Research [19] conducted double-blind taste trials of tomatoes and bell peppers purchased from farmers’ markets and supermarkets in the same city. They found that there was no difference in flavor preference for the tomatoes, although bell peppers from the farmers’ market were preferred (Sommer et al., 2006).
Another double-blind taste test comparing farmers’ market pro-duce and grocery store produce (Sommer et al., 1982) found mixed results. Subjects preferred tomatoes, peaches, apricots, and watermelon from the farmers’ markets, but rated the supermarket apples and cantaloupe as supe-rior. There was virtually no difference in consumers’ preference for honeydew melon, carrots, and dried peaches. These results led the researchers to make the following conclusion:
We are willing to concede that in shopping time and effort, the supermar-ket, which is open 10-12 hours a day, 6-7 days of the week throughout the entire year, is a more convenient outlet than a seasonal farmers’ market open 3-5 hours one or two days a week. The typical supermarket can provide one-stop shopping while the farmers’ market, in its purest form which carries only seasonal produce, cannot. (Sommer et al., 1982: 135)
19 Authors R. Sommer and H. Knight are affiliated with the Center for Consumer Research, University of California, Davis, CA.

30 l The BC Agricultural Land Reserve: A Critical Assessment
Fraser Institute l www.fraserinstitute.org
Survey results indicate that there is broad support for the Agricultural Land Reserve, but many households are not hungry for fresh produce: some 49% of Canadians say they and their family “would eat more healthfully if the nutritious options tasted better” (Ipsos Reid, 2005), and 61% say they would
“like to eat healthier but they don’t want to give up eating their favorite foods” (Ipsos Reid, 2005).
The BC Agricultural Land Reserve: A Critical Assessment l 31
www.fraserinstitute.org l Fraser Institute
Collateral effects of the ALR
In many ways, British Columbia is Canada’s most dynamic province, its appeal enhanced by a dramatic setting of sea and mountains, as well as economic opportunities. The province’s population has swelled as a result, from about 2.5 million in 1975 to 4.4 million in 2008 (BC Stats, 2009b). However, not all fast-growing markets have experienced the same dramatic spikes in housing costs that have plagued the province (Cox and Pavletich, 2009).
The Agricultural Land Reserve encompasses 21% of the land area in the Lower Mainland. [20] The land use restrictions have contributed to making housing in Vancouver the most “severely unaffordable” of 265 major metropolitan markets in Canada, the United States, Australia, New Zealand, the United Kingdom, and Ireland, according to the 2009 International Housing Affordability Survey (Cox and Pavletich, 2009). Only Honolulu, Hawaii, and Australia’s Gold and Sunshine Coasts were costlier. Indeed, all of Canada’s “severely unaffordable” markets were in British Columbia, and none of the “affordable” markets were located in the province. Average house prices in British Columbia are the highest among the Canadian prov-inces (figure 4).
Dr. Shlomo Angel, an adjunct professor of urban planning at New York University, explains that land supply bottlenecks, such as the one created by the ALR, lead to increases in land prices and, since land is a major housing input, to increases in house prices. “The more stringent the restrictions, the less is the housing market able to respond to increased demand, and the more likely house prices are to increase,” he notes. “And when residential land is very difficult to come by, housing becomes unaffordable” (Cox and Pavletich, 2009). The rapid pace of population growth in the province has only exacer-bated the problem. As figure 5 indicates, BC housing has not kept pace with population growth.
In his 2007 paper on Metro Vancouver’s Livable Region Strategic Plan, Randal O’Toole reports that the cost of a lot was 10% to 20% of the total cost of a new single-family home in most metropolitan areas in 1966. By 1976, this cost had increased to 25% to 30% of the total cost in most metropolitan areas. But in Vancouver, the lot price represented a whopping 49% of the price of a home.
High housing costs are particularly problematic for low-income and moderate-income families. Research by C. Tsuriel Somerville of the University
20 The Lower Mainland includes all municipalities in Metro Vancouver and the Fraser Valley Regional District.

Figure 4: Average home prices in the Canadian provinces, all housing types, August 2008
Figure 5: BC population and housing starts, 1981 to 2006
0
100,000
200,000
300,000
400,000
500,000
CAPENBNSMNNLQCSKONABBC
Source: Canadian Real Estate Association, 2008.
0
1,000,000
2,000,000
3,000,000
4,000,000
5,000,000
20062001199619911981
Source: Statistics Canada, 2009c.
Housing starts
Population
Dol
lars
32 l The BC Agricultural Land Reserve: A Critical Assessment
Fraser Institute l www.fraserinstitute.org
of British Columbia confirms the obvious: “restrictions on the supply of new [housing] units lower the supply of affordable units” (Somerville and Mayer, 2003). “This occurs because increases in the demand for higher quality units raise the returns to maintenance, repairs, and renovations of lower quality units, as landlords have a stronger incentive to upgrade them to a higher quality, higher return housing submarket,” Somerville notes.
The BC Agricultural Land Reserve: A Critical Assessment l 33
www.fraserinstitute.org l Fraser Institute
Ever-escalating housing costs make the “new urbanist” [21] dream of mixed-income communities a nightmare of economic segregation and deny families the opportunity to build wealth through property acquisition. This inability to purchase property in the city means that cities cannot be “an engine of upward social mobility”—one of the city’s primary historic roles (Kotkin, 2007).
Younger families at the beginning of their careers, and thus at the lower end of the income scale, are hit particularly hard by higher housing prices. According to census data, nearly 54% of Metro Vancouver homeowners aged 25 and under spent 30% or more of their income on shelter, compared to about 19% for those aged 55 to 64 (BC Stats, 2007).
The lack of affordable housing in Vancouver is due, in part, to hous-ing preferences. According to a recent survey by the Royal Bank of Canada, detached homes were the housing type of choice for 72% of Canadians who said they were likely to buy a home in the next two years. Condominiums were preferred by only 10%, while semi-detached units were preferred by 7%. Townhouses, the least popular option, were preferred by 6% (Royal Bank of Canada, 2007). In contrast, single-family detached homes comprised only 35.5% of all occupied private dwellings in Metro Vancouver in 2006, down from 45.5% in 1996 and 53.3% in 1986 (figure 6). In 2006, apartment build-ings accounted for 53.4% of all occupied private dwellings (BC Stats, 2007), up from 44% in 1996. Between 1981 and 1996, the number of condominiums in the Vancouver metropolitan area skyrocketed by 347%. Across Canada, single-family detached homes comprise 55% of all private dwellings, accord-ing to the 2006 Census (Statistics Canada, 2007a). But in British Columbia, the proportion is 49%—the lowest among all the provinces with the exception of Quebec (46%) (figure 7).
Even government officials acknowledge that affordable housing in the province is hard to come by. “Owning a home is not an option for many households,” the 2009 Metro Vancouver Sustainability Report notes (Metro Vancouver, 2009). In 2008, the cost of home ownership in Vancouver as a percentage of typical household income was 74.8% for a bungalow, 57.1% for a townhouse, and 43.1% for a condo (Royal Bank of Canada, 2008). At the same time, the number of homeless people living on the street and in shelters
21 “New urbanism” is a movement that promotes designing neighborhoods for a mix of uses and income levels, with a particular focus on pedestrians and mass transit. According to this design principle, neighborhoods should be diverse in use and population; com-munities should be designed for the pedestrian and transit as well as the car; cities and towns should be shaped by physically defined and universally accessible public spaces and community institutions; and urban places should be framed by architecture and landscape design that celebrate local history, climate, ecology, and building practice.

Figure 6: Single-family detached homes as a proportion of all dwellings in Metro Vancouver, 2006
Figure 7: Single-family detached homes as a proportion of all households, by province, 2006
30
40
50
60
20062001199619911986
Source: Metro Vancouver, 2007.
Source: Statistics Canada, 2008f.
0
10
20
30
40
50
60
70
80
CAQCBCONABNSMBNBPENLSK
Prop
orti
on o
f all
dw
ellin
gs
Prop
orti
on o
f all
hou
seh
old
s
34 l The BC Agricultural Land Reserve: A Critical Assessment
Fraser Institute l www.fraserinstitute.org
is increasing (table 7). In a 2008 survey, almost 100 fully employed individuals were counted in emergency shelters (Metro Vancouver, 2009).
The artificial constraints on land for development created by the ALR and the BC government’s focus on increased density in urban areas have also created a looming shortage of commercial real estate. In the past two decades, for example, the population of downtown Vancouver has doubled (New York

Table 7: Metro Vancouver homeless population, 2002, 2005, and 2008
Year Living on the streets Living in shelters
2002 333 788
2005 1,127 1,047
2008 1,574 1,086
Source: Metro Vancouver, 2009.
The BC Agricultural Land Reserve: A Critical Assessment l 35
www.fraserinstitute.org l Fraser Institute
Times, 2007, Jan. 17). According to a 2006 BC land use study, “in the medium to longer term, demand for job space could exceed what current zoning could supply, especially in the Downtown” (City of Vancouver, 2006).
The effects of land use controls on the cost of housing and commercial space are rarely considered by policy makers, according to a 1978 task force report by the Greater Vancouver Regional District (now Metro Vancouver). It noted that “often planners do not appreciate, and do not even care to be told, the cost/consequences of their decisions.” The report also pointed out that municipal officials have incentives to restrict development outside their borders and to promote only more expensive (and thus more tax-produc-ing) developments inside their borders. They “resist cheaper land” based on
“money, not principle” (O’Toole, 2007).
Transportation
Though population density in British Columbia has increased dramatically (figure 8), commuters are not behaving as the architects of “smart growth” predicted. As figure 9 illustrates, 72% of workers in British Columbia continue to drive a car, truck, or van to work, while less than 10% use public transporta-tion and 7% walk (Statistics Canada, 2008e). In fact, the proportion of British Columbians who use public transit to get to work actually lags behind transit usage in Quebec, Ontario, and the nation as a whole.
Proponents of government land use controls often claim that limits on development produce environmental benefits. They argue that if people are forced to live in higher-density neighborhoods rather than in suburbs, then more people will come to rely on mass transit and thus produce less automotive emissions. But that is not the case. People who cannot afford homes in close proximity to their jobs face long daily commutes that consume more fuel. As the number of commuters increases so also does congestion. The increased congestion induces stop-and-go traffic which, in turn, results

Figure 8: Population density in British Columbia, 1981 to 2006
Source: Statistics Canada, 2009d.
Figure 9: Mode of transportation used to go to work, by province, 2006
Source: Statistics Canada, 2008e.
2
3
4
5
200620011996199119861981
0
20
40
60
80
100
BCABSKMBONQCNBNSPENLCA
Num
ber
of p
erso
ns
per
sq
. km
% o
f pop
ulat
ion
Car/truck/van as driverPublic transitWalk
36 l The BC Agricultural Land Reserve: A Critical Assessment
Fraser Institute l www.fraserinstitute.org
in more idling and thus greater vehicle emissions. Furthermore, long com-mutes detract from time with family. According to the Urban Development Institute, long commutes also cost employers through higher rates of absen-teeism and decreased productivity caused by fatigue (Urban Development Institute, 2007).

The BC Agricultural Land Reserve: A Critical Assessment l 37
www.fraserinstitute.org l Fraser Institute
Summary
Few democracies have instituted the kind of government land use controls that have existed in British Columbia for the past three decades. The revo-cation of property rights and the centralization of zoning authority deprive citizens of the freedom to use their land and the means to generate wealth from their investment. This regime is made all the worse by its false promises about sustaining agriculture and improving nutrition and food safety, as well as its failure to deliver most of the other benefits offered as justification for the ALR by its architects. The Agricultural Land Reserve has not encour-aged family farming. It has not nurtured a new generation of farm operators. Nor has it shielded the farm sector from changes in agriculture experienced across Canada and around the world. Instead, it has enabled the government to manipulate the farmland inventory, with the result that the cost of agricul-tural land is now beyond the reach of a new generation. The artificial scarcity of land for development has diminished the housing choices of families and created barriers to the upward mobility by which societies have improved throughout history. The ALR is not only harmful but unnecessary; human ingenuity and market forces are fully capable of meeting the food demands of British Columbia’s growing population through increased productivity and efficiency.

38 l The BC Agricultural Land Reserve: A Critical Assessment
Fraser Institute l www.fraserinstitute.org
Recommendations
The policy failures of the Agricultural Land Reserve and its costly conse-quences supply ample justification to dismantle the program. The restora-tion of property rights and economic freedom to BC landowners would have immediate and long-lasting benefits, including new investment, relief from inordinately high housing costs, and a more productive, efficient agriculture industry.
Such a dramatic change, after 35 years of the ALR, would undoubt-edly provoke citizen concern, if not vehement opposition among special interest groups that benefit most from the status quo. But terminating the Agricultural Land Reserve need not mean the end of farmland preservation. There already exists a network of accomplished land conservancies through-out Canada. With adjustments to the federal and provincial tax codes, this network could engage in significant farmland preservation. Relying on private organizations to achieve policy objectives is a time-tested approach.
As an interim measure, property owners within the reserve should have, at the very least, the option of excluding their land based on simple criteria—i.e., proof of ownership predating designation of the property as reserve land and a demonstration that the property is more valuable out-side the reserve. The Agricultural Land Commission could be granted the authority to negotiate a purchase of the property if it wanted to preserve it as farmland.
Ultimately, the preservation of farmland should be relegated to the private sector. In addition to several private land trusts that operate nation-ally, there already exist more than two dozen such organizations in British Columbia (University of Guelph, 2003). Nationwide, the number of land trusts increased 33% between 1998 and 2001, indicating considerable public endorsement of their mission (Watkins and Hilts, 2001). A survey of land trusts found that BC groups already protect more than 40,000 acres in the province. The Nature Conservancy of Canada has acquired an additional 435,856 acres in the province (Watkins and Hilts, 2001).
Private trusts would enjoy far greater flexibility than the government to customize covenants [22] to attract property owners whose land would maxi-mize farm preservation goals. Steven J. Eagle, a professor of law at George Mason University, notes that such flexibility would enhance program results:
22 A conservation covenant is a legal agreement made between a landowner and a land trust that stipulates how the land may and may not be used. For example, covenants routinely bar any new development on land.

The BC Agricultural Land Reserve: A Critical Assessment l 39
www.fraserinstitute.org l Fraser Institute
the goals that conservation easements are to be consensual in nature and custom-tailored to individual circumstances and desires largely are viti-ated in those states in which government (or government and one land trust) has a monopoly on holder status. In such a jurisdiction one could expect the full panoply of bureaucratic regulations and a “one-size-fits-all” approach, resulting in fewer landowners entering into conservation easements than otherwise would be the case. The more freely non-profit (and for-profit) organizations are allowed to act as easement holders, the more likely landowners would be to participate. (1998: 8)
Private preservation efforts are also more equitable. The cost of land use preferences are borne by those who want the benefit.
A range of tax incentives currently exist to entice land donations or the sale of development rights to private groups. Some changes will be necessary to apply the incentives to farmland preservation.
Under federal law, for example, individual donors of an “ecogift” [23] are entitled to a charitable tax receipt from the recipient of the gift (Environment Canada, 2005b). If there has been a capital gain on the property, only 25% of the gain is required to be counted as income in the year of the donation. If an “ecogift” is donated to a registered charity, the charitable tax receipt may be used to offset 100% of the donor’s income. Any unused portion of the tax receipt may offset income for up to five years. Similar tax advantages are avail-able to property owners who sell development rights to a private land trust.
At the provincial level, BC tax assessors have been directed to give “consideration” to the terms of any conservation agreement in calculating the value of property. The conveyance of land to a registered charity is also exempt from the provincial land transfer tax.
A compelling case can be made that the tax code should not favor open land over developed land. To the extent open space is valued, investors can be relied upon to supply it—in the absence of government interference. But if politicians insist upon involvement, better results will be achieved if the government offers incentives rather than employs force.
23 Environment Canada (2005a) defines an “ecogift” as “a donation of land or an interest in land - such as a conservation easement, covenant or servitude - that has been certified as ‘ecologically sensitive’ according to specific national and provincial criteria. Generally speaking, ecologically sensitive lands are areas or sites that currently, or could in the future, significantly contribute to the conservation of Canada’s biodiversity and environ-mental heritage.”
40 l The BC Agricultural Land Reserve: A Critical Assessment
Fraser Institute l www.fraserinstitute.org
References
Agricultural Land Commission [ALC] (n.d.). What is Agricultural Land. Government of British Columbia. <http://www.alc.gov.bc.ca/alr/what_is_ag_
land.htm>.
Agricultural Land Commission [ALC] (n.d.). History of the Agricultural Land Reserve. Government of British Columbia. <http://www.alc.gov.bc.ca/
publications/Alr_history.htm>.
Agricultural Land Commission [ALC] (2009). Annual Report 2008-2009. Government of British Columbia. <http://www.alc.gov.bc.ca/publications/
Annual_Report_2009/pdf/ALCReportFull.pdf>, as of September 21, 2009.
Agricultural Land Commission Act, S.B.C. 2002, c. 36.
Agriculture and Agri-Food Canada (2007). Local and Regional Food Economies in Canada: Status Report. Government of Canada. <http://www4.
agr.gc.ca/resources/prod/doc/pol/pub/econ_can/pdf/econ_can_e.pdf>.
Agriculture and Agri-Food Canada (2008a). Overview of Classification Methodology for Determining Land Capability for Agriculture. Government of Canada. <http://sis.agr.gc.ca/cansis/nsdb/cli/classdesc.html>, as of September 21, 2009. Last updated November 27, 2008.
Agriculture and Agri-Food Canada (2008b). Special Features: Census of Agriculture Summary. Government of Canada. <http://www4.agr.gc.ca/AAFC-
AAC/display-afficher.do?id=1205766026093&lang=eng>, as of September 21, 2009. Last updated March 17, 2008.
Agriculture and Agri-Food Canada (2008c). Changing Structure of Primary Agriculture. Government of Canada. <http://www4.agr.gc.ca/AAFC-AAC/
display-afficher.do?id=1201189157429&lang=eng#c>, as of September 21, 2009.
Agriculture and Agri-Food Canada (2008d). An Overview of the Canadian Agriculture and Agri-Food System. Government of Canada. <http://www4.
agr.gc.ca/AAFC-AAC/display-afficher.do?id=1204750285466&lang=eng>, as of September 21, 2009.

The BC Agricultural Land Reserve: A Critical Assessment l 41
www.fraserinstitute.org l Fraser Institute
Agriculture and Agri-Food Canada (2008e). Government and the Agriculture and Agri-Food Sector: Government Expenditures in Canada. Government of Canada. <http://www4.agr.gc.ca/AAFC-AAC/display-afficher.
do?id=1205853623962&lang=eng>, as of October 12, 2009.
Agriculture and Agri-Food Canada (2008f). Components of the Agriculture and Agri-Food System: Primary Agriculture. Government of Canada. <http://www4.agr.gc.ca/AAFC-AAC/display-afficher.do?id=1205852740
840&lang=eng>.
Bailey, Ronald (2000). Billions Served: Norman Borlaug interviewed by Ron Bailey. Reason (April). <http://reason.com/archives/2000/04/01/billions-served-
norman-borlaug>.
Baxter, David (1998). Demographic Trends and the Future of the Agricultural Land Reserve in British Columbia. Government of British Columbia, Agricultural Land Commission. <http://www.alc.gov.bc.ca/
Publications/Archives/Visioning_Project_docs/visionpaperdavid.htm>, as of September 21, 2009.
BC Association of Farmers’ Markets (n.d.). Find a Farmers’ Market. <http://
www.bcfarmersmarket.org/findamarket.asp>.
BC Stats (2007). 2006 Census Profile: Greater Vancouver, CD. Government of British Columbia. <http://www.tol.bc.ca/files/web_files/planning/EDO/2006_
Census_Profile_-_GVRD.pdf>.
BC Stats (2009a). Exports (BC Origin): 1999–2008. Government of British Columbia. <http://www.bcstats.gov.bc.ca/pubs/exp/exp_ann.pdf>, as of September 21, 2009.
BC Stats (2009b). BC Quarterly Population, 1951-2009. Government of British Columbia. <http://www.bcstats.gov.bc.ca/data/pop/pop/BCQrtPop.asp>, as of September 21, 2009.
Bettmann, Otto (1974). The Good Old Days—They Were Terrible! Random House.
British Columbia (n.d.). School Tax Exemptions. Government of British Columbia. <http://www.sbr.gov.bc.ca/business/Property_Taxes/School_Property_
Tax/exemptions.htm>.

42 l The BC Agricultural Land Reserve: A Critical Assessment
Fraser Institute l www.fraserinstitute.org
British Columbia, Ministry of Agriculture and Lands (n.d.). Industry Profile. Government of British Columbia. <http://www.agf.gov.bc.ca/aboutind/profile.
htm>, as of September 21, 2009.
British Columbia, Ministry of Agriculture and Lands (2006). BC’s Food Self-Reliance: Can BC’s Farmers Feed Our Growing Population? Government of British Columbia. <http://www.agf.gov.bc.ca/resmgmt/Food_Self_Reliance/
BCFoodSelfReliance_Report.pdf>.
British Columbia, Ministry of Agriculture and Lands (2007). 2006 Census of Agriculture and Historical Comparisons. Government of British Columbia. <http://www.gov.bc.ca/al/mediaroom/fastfacts/2007/2006_
agriculture_census_colour.pdf>.
British Columbia, Ministry of Community and Rural Development (n.d.). Mini-Histories: Regional Districts Part 2: J. Everett Brown and New Directions in the 1950s. Government of British Columbia. <http://www.
cd.gov.bc.ca/lgd/history/mini_histories/regional_districts_part_two.htm>.
British Columbia Food Quality and Safety Steering Committee (2003). Food Quality and Safety Strategic Plan: 5 Year Plan, 2004/05 - 2008/09. Investment Agriculture Foundation of British Columbia. <http://www.iafbc.
ca/funding_available/programs/FQS/documents/FQS-strategic_plan.pdf>.
British Columbia Greenhouse Growers’ Association (2007). Agricultural Advantage: BC’s Greenhouse Vegetables. <http://www.bcgreenhouse.ca/
documents/BCGGA%20Agriculture%20Advantage%20Brochure%202007.pdf>, as of September 21, 2009.
Canadian Food Inspection Agency (2008). Company Fined for Illegally Processing Fish for Export. Prosecution Bulletin. Government of Canada. <http://www.inspection.gc.ca/english/corpaffr/projud/2008/20080104be.shtml>.
Canadian Food Inspection Agency (2009). Food Recall Archives. Govern-ment of Canada. <http://www.inspection.gc.ca/english/corpaffr/recarapp/recal2e.
shtml>, as of September 23, 2009. Last updated September 5, 2009.
City of Vancouver (2006). Metropolitan Core Jobs and Economy Land Use Plan. <http://vancouver.ca/commsvcs/planning/corejobs/research.htm>, as of September 21, 2009.
Cotteleer, Geerte, Tracy Stobbe, and G. Cornelis van Kooten (2007). Farmland Conservation in The Netherlands and British Columbia, Canada:

The BC Agricultural Land Reserve: A Critical Assessment l 43
www.fraserinstitute.org l Fraser Institute
A Comparative Analysis Using GIS-based Hedonic Pricing Models. Working Paper No. 2007-06. University of Victoria, Resource Economics and Policy Analysis. <http://web.uvic.ca/~kooten/REPA/WorkingPaper2007-06.pdf>, as of September 21, 2009.
Cox, Wendell (2004). Myths about Urban Growth and the Toronto Greenbelt. Fraser Institute Digital Publication (December). Fraser Institute.
Cox, Wendell, and Hugh Pavletich (2009). 5th Annual Demographia International Housing Affordability Survey: 2009. Demographia. <http://
www.demographia.com/dhi.pdf>.
Eagle, S.J. (1998). Conservation Easements and Private Land Stewardship. Center for Private Conservation. <http://mason.gmu.edu/~seagle/pubs/1998_
Conservation_Easements_(CEI).pdf>.
Eat BC! (n.d.). About Eat BC! British Columbia Restaurant and Foodservices Association and the British Columbia Agriculture Council. <http://www.eatbc.com/abouteatbc/abouteatbc.html>.
Environment Canada (2005a). The Ecological Gifts Program. Government of Canada. <http://www.cws-scf.ec.gc.ca/egp-pde/default.
asp?lang=En&n=8D5251D3-1>. Last updated September 16, 2005.
Environment Canada (2005b). The Ecological Gifts Program: What Are the Tax Benefits? Environment Canada. <http://www.cws-scf.ec.gc.ca/egp-pde/
default.asp?lang=En&n=6C0F56D5-1>.
Farm Assessment Review Panel (2009). Farm Assessment Review Panel: 2009 Report. <http://www.farmassessmentreview.ca/FARP_Report_July_31_2009.pdf>.
Garrish, Christopher (2003). Unscrambling the Omelette: Understanding British Columbia’s Agricultural Land Reserve. BC Studies 136 (Winter): 25–55.
Hess, David J. (2008). Localism and the Environment. Sociology Compass 2, 2: 625–38. <http://www.blackwell-compass.com/subject/sociology/article_
view?article_id=soco_articles_bpl082>.
Holbek, Niels (1998). British Columbia Agriculture – 2025: Looking Ahead the Next Twenty-five Years. Government of British Columbia, Agricultural Land Commission. <http://www.alc.gov.bc.ca/publications/archives/Visioning_
Project_docs/visionpaperniels.htm>, as of September 21, 2009.
44 l The BC Agricultural Land Reserve: A Critical Assessment
Fraser Institute l www.fraserinstitute.org
Horne, Garry (2008). The Import Content of Exports: A British Columbia Perspective. BC Stats. <http://www.bcstats.gov.bc.ca/data/bus_stat/busind/
trade/ICE2008.pdf>, as of September 23, 2009.
Ipsos Reid (2005). Nine in Ten Canadians Say They Try to Eat Healthfully, But Want to Do Better. News release (January 26). Ipsos Reid.
Kotkin, Joel (2007). Opportunity Urbanism: An Emerging Paradigm for the 21st Century. Joel Kotkin and the Greater Houston Partnership. <http://
americandreamcoalition.org/landuse/KotkinReportOU.pdf>.
Metro Vancouver (2007). 2006 Census Bulletin #4: Dwellings by Type and Tenure. <http://www.metrovancouver.org/about/publications/
Publications/2006census_dwell_Dec2007.pdf>.
Metro Vancouver (2009). Metro Vancouver Sustainability Report. <http://www.metrovancouver.org/about/publications/Publications/
SustainabilityReport2009.pdf>, as of September 21, 2009.
Miller, K. (2004). Message from the Chair. Reserve Opinion 1, 9 (June). <http://www.alc.gov.bc.ca/Publications/ReserveOpinion/index.htm>, as of September 21, 2009.
National Sustainable Agriculture Information Service (2008). Food Miles: Background and Marketing. National Center for Appropriate Technology. <http://www.attra.org/attra-pub/foodmiles.html>.
New York Times (2007, January 17). The Zoning Policy that Worked Too Well. New York Times.
Office of the Auditor General of British Columbia (1994). Value-for-Money Audits: Provincial Agricultural Land Commission, 1994/95 (Report 2). <http://www.bcauditor.com/pubs/1994/report2/provincial-agricultural-land-
commission-value-money-audit>.
O’Toole, Randal (2007). Unlivable Strategies: The Greater Vancouver Regional District and the Livable Region Strategic Plan. Public Policy Sources No. 88. Fraser Institute. <http://www.fraserinstitute.org/
researchandpublications/publications/4923.aspx>.
Quayle, Moura (1998). Stakes in the Ground: Provincial Interest in the Agricultural Land Commission Act. Government of British Columbia. <http://www.agf.gov.bc.ca/polleg/quayle/stakes.htm>.

The BC Agricultural Land Reserve: A Critical Assessment l 45
www.fraserinstitute.org l Fraser Institute
Royal Bank of Canada (2007). Canadians Don’t Expect Mortgage Rates to Rise, but Do Expect Housing Prices to Go Up, says RBC Survey. News release (March 6). <http://www.rbc.com/newsroom/20070306ownership.html>.
Royal Bank of Canada (2008). Saskatchewan’s Housing Affordability Remains Poor, says RBC Economics. News release (December 8). <http://
www.rbc.com/newsroom/pdf/20081208-housing-sk.pdf>, as of October 12, 2009.
Royal British Columbia Museum (2004). Journeys and Transformations: British Columbia Landscapes. <http://www.royalbcmuseum.bc.ca/exhibits/
journeys/english/overview_city.html>.
Runka, Gary (2006). BC’s Agricultural Land Reserve—Its Historical Roots. Speech, given at the World Planners Congress Seminar, Planning for Food, Vancouver, British Columbia, June 21, 2006.
Saunders, Caroline, Andrew Barber, and Greg Taylor (2006). Food Miles – Comparative Energy/Emissions Performance of New Zealand’s Agriculture Industry. Research Report No. 285. Lincoln University.
Scott, Anthony, John Robinson, and David Cohen (eds.) (1996). Managing Natural Resources in British Columbia: Markets, Regulations, and Sustainable Development. University of British Columbia Press.
Seabrooke, William, Paul Kent, and Hebe Hwee Hong How (eds.) (2004). International Real Estate: An Institutional Approach. Blackwell.
Shangaan Webservices Inc. (n.d.). Information on BC: Agriculture in British Columbia. <http://www.britishcolumbia.com/information/details.asp?id=31>.
Shangaan Webservices Inc. (n.d.). Information on BC: Forestry in British Columbia. <http://www.britishcolumbia.com/information/details.asp?id=36>.
Shimizu, Hiroko, and Pierre Desrochers (2008). Yes We Have No Bananas: A Critique of the ‘Food Miles’ Perspective. Policy Primer No. 8. George Mason University, Mercatus Center. <http://www.mercatus.org/
PublicationDetails.aspx?id=24612>.
Smith, Alisa, and J.B. Mackinnon (2007). Plenty: Eating Locally on the 100 Mile Diet. Three Rivers Press.
Smith, Alison, Paul Watkiss, Geoff Tweddle, Alan McKinnon, Mike Browne, Alistair Hunt, Colin Treleven, Chris Nash, and Sam Cross (2005).

46 l The BC Agricultural Land Reserve: A Critical Assessment
Fraser Institute l www.fraserinstitute.org
The Validity of Food Miles as an Indicator of Sustainable Development. Government of the United Kingdom, Department of Environment, Food, and Rural Affairs. <https://statistics.defra.gov.uk/esg/reports/foodmiles/
execsumm.pdf>.
Smith, Barry E. (1998). Planning for Agriculture. Government of British Columbia, Agricultural Land Commission. <http://www.alc.gov.bc.ca/
Publications/planning/Planning_for_Agriculture/index.htm>.
Somerville, C. Tsuriel, and Christopher J. Mayer (2003). Government Regulation and Changes in the Affordable Housing Stock. Economic Policy Review 9, 2 (June): 45–62. <http://www.newyorkfed.org/research/
epr/03v09n2/0306some.pdf>.
Sommer, R., H. Knight, and B. Sommer (2006). Comparison of Farmers’ Market, and Supermarket Produce: Tomatoes and Bell Peppers. Journal of Food Science 44, 5: 1474–77. <http://www3.interscience.wiley.com/
journal/119600234/abstract>.
Sommer, Robert, Margot Stumpf, and Henry Bennett (1982). Quality of Farmers’ Market Produce: Flavor and Pesticide Residues. Journal of Consumer Affairs 16, 1: 130–36.
Statistics Canada (2002). 2001 Census of Agriculture - Canadian Farm Operations in the 21st Century. The Daily (May 15). <http://www.statcan.
gc.ca/daily-quotidien/020515/dq020515a-eng.htm>, as of September 21, 2009.
Statistics Canada (2004). Dietary Practices by Sex, Household Population Aged 12 and Over, Canada, Provinces, Territories, Health Regions and Peer Groups, 2003. <http://www.statcan.gc.ca/pub/82-221-x/00604/t/th/4150171-eng.
htm>.
Statistics Canada (2005). The Loss of Dependable Agricultural Land in Canada. Rural and Small Town Canada Analysis Bulletin 6, 1 (January). Catalogue No. 21-006-XIE. <http://www.statcan.gc.ca/pub/21-006-x/21-006-
x2005001-eng.pdf>.
Statistics Canada (2006a). Changing Patterns in Canadian Homeownership and Shelter Costs, 2006 Census. Catalogue No. 97-554-X. <http://www12.
statcan.gc.ca/english/census06/analysis/shelter/pdf/97-554-XIE2006001.pdf>.
Statistics Canada (2006b). Study: Canadian Agriculture Year-end Review. The Daily (June 5).

The BC Agricultural Land Reserve: A Critical Assessment l 47
www.fraserinstitute.org l Fraser Institute
Statistics Canada, (2007a). Private Households by Structural Type of Dwelling, by Province and Territory (2006 Census). <http://www40.statcan.
gc.ca/l01/cst01/famil55c-eng.htm>, as of September 21, 2009. Last updated October 12, 2007.
Statistics Canada (2007b). Retail Trade, Operating Statistics, by Province and Territory. CANSIM Table No. 080-0011. <http://www40.statcan.ca/l01/
cst01/trad38k-eng.htm>.
Statistics Canada (2007c). Number of Farm Operators by Age by Number of Operators per Farm - Total Number of Operators and Under 35 Years, Census Years 2006 and 2001. <http://www.statcan.gc.ca/pub/95-629-
x/8/4182955-eng.htm>.
Statistics Canada (2007d). Agriculture Overview, Canada and the Provinces - Hay and Field Crops, Census Years 2006 and 2001. <http://www.statcan.
gc.ca/pub/95-629-x/1/4123806-eng.htm>.
Statistics Canada (2008a). Structure and Change in Canada’s Rural Demography: An Update to 2006. Rural and Small Town Canada Analysis Bulletin 7, 7. Catalogue No. 21-006-X. Statistics Canada.
Statistics Canada (2008b). Census of Agriculture Counts 19,844 Farms in British Columbia. <http://tinyurl.com/yfjo8fm>, as of September 21, 2009.
Statistics Canada (2008c). Area of Fruit, Berries and Nuts, Vegetables, Sod, Nursery and Greenhouse Products, by Province (Census of Agriculture, 1986 to 2006). <http://www40.statcan.gc.ca/l01/cst01/agrc31k-eng.htm>, as of September 21, 2009. Last updated October 29, 2008.
Statistics Canada (2008d). Total Farm Area, Land Tenure and Land in Crops, by Province (Census of Agriculture, 1986 to 2006). <http://www40.
statcan.gc.ca/l01/cst01/agrc25a-eng.htm>. Last updated October 31, 2008.
Statistics Canada (2008e). Employed Labour Force by Mode of Transportation, Both Sexes, Percentage Distribution, for Canada, Provinces and Territories of Residence – 20% Sample Data. Catalogue No. 97-561-XWE2006002. <http://www12.statcan.ca/english/census06/data/highlights/
POW/Table603.cfm?SR=1>. Last updated June 2, 2009.
Statistics Canada (2008f). Occupied Dwellings, by Structural type, Canada, Provinces and Territories, 2006 Census. <http://www.statcan.gc.ca/pub/63-
224-x/2007000/5006564-eng.htm>.
48 l The BC Agricultural Land Reserve: A Critical Assessment
Fraser Institute l www.fraserinstitute.org
Statistics Canada (2009a). A Statistical Portrait of Agriculture, Canada and provinces: Census Years 1921 to 2006. <http://www.statcan.gc.ca/pub/95-632-
x/2007000/t/4185570-eng.htm#59 >. Last updated January 30, 2009.
Statistics Canada (2009b). Snapshot of Canadian Agriculture. <http://www.
statcan.gc.ca/ca-ra2006/articles/snapshot-portrait-eng.htm#5>.
Statistics Canada (2009c). Table 025-0008: Canada Mortgage and Housing Corporation, Housing Starts, Under Construction and Completions, All Areas, Quarterly. <http://cansim2.statcan.gc.ca/cgi-win/cnsmcgi.exe?Lang=E&Ro
otDir=CII/&ResultTemplate=CII/CII___&Array_Pick=1&ArrayId=0270008>.
Statistics Canada (2009d). Table 153-0037: Selected Population Characteristics, Canada, Provinces and Territories, Every 5 Years. <http://
cansim2.statcan.gc.ca/cgi-win/cnsmcgi.exe?Lang=E&RootDir=CII/&ResultTemplate
=CII/CII___&Array_Pick=1&ArrayId=1530037>.
University of Guelph (2003). Canada Land Trust Directory: 2003. University of Guelph, Center for Land and Water Stewardship. <http://www.
uoguelph.ca/~claws/conference/landtrustdirectory.html>.
Urban Development Institute (2007). A New Agenda for Canada’s Urban Environment. <http://www.udi.bc.ca/Publications/UDI/UDI_New.Urban.Agenda.
feb.07.pdf>, as of September 21, 2009.
Watkins, Melissa, and Stew Hilts (2001). Land Trusts Emerge as an Important Conservation Force in Canada. University of Guelph. <http://
www.uoguelph.ca/~claws/conference/landtrustsincanada.doc>.
The BC Agricultural Land Reserve: A Critical Assessment l 49
www.fraserinstitute.org l Fraser Institute
About the author
Diane KatzDiane Katz is the Director of Risk, Environment and Energy Policy at the Fraser Institute. She has more than two decades of experience in research and writing about public policy, including six years as the Director of Science, Environment and Technology for the Mackinac Center for Public Policy and nine years as a member of The Detroit News editorial board, specializing in sci-ence and the environment, telecommunications and technology, and the auto industry. Ms. Katz has been awarded several fellowships, including the Jack R. Howard Science Reporting Institute at the California Institute of Technology; the Paul Miller Washington Reporting Program; the Kinship Conservation Institute; and the Political Economy Research Center. She has testified before the US Congress, as well as a number of state legislatures, and was appointed to represent the State Policy Network, a coalition of more than 50 think tanks across the United States, on the American Legislative Exchange Council. She has been published in the Wall Street Journal, Washington Times, National Review, Weekly Standard, Reason Magazine, and dozens of regional and local newspapers. Ms. Katz graduated with a B.Ph. from Thomas Jefferson College and an M.A. from the University of Michigan.
Acknowledgments
The author would like to thank Dr. Samuel Staley and Randal O’Toole for their helpful comments on an earlier draft of this report. Special thanks go to Kristin Fryer for her skillful editing and considerable patience. The author would also like to thank Dean Pelkey for his advice and counsel, which were greatly appreciated.
Any remaining errors, omissions, or mistakes are the sole responsibil-ity of the author. As the author has worked independently, the views and analysis expressed in this document are her own, and do not necessarily represent the views of the supporters, trustees, or other staff of the Fraser Institute.

50 l The BC Agricultural Land Reserve: A Critical Assessment
Fraser Institute l www.fraserinstitute.org
About this publication
Periodically, the Fraser Institute publishes timely and comprehensive stud-ies of current issues in economics and public policy. This study is one such example belonging to a series of related publications.
DistributionThese publications are available from <http://www.fraserinstitute.org> in Portable Document Format (PDF) and can be read with Adobe Acrobat® or with Adobe Reader®, which is available free of charge from Adobe Systems Inc. To download Adobe Reader, go to this link: <http://www.adobe.com/products/
acrobat/readstep2.html> with your browser. We encourage you to install the most recent version.
Ordering publicationsFor information about ordering the printed publications of the Fraser Institute, please contact the publications coordinator
l e-mail: [email protected]
l telephone: 604.688.0221 ext. 580; or, toll-free, 1.800.665.3558 ext. 580 l fax: 604.688.8539
MediaFor media enquiries, please contact our Communications Department:
l 604.714.4582 l e-mail: [email protected]
DisclaimerThe author of this publication has worked independently and opinions expressed by her are, therefore, her own, and do not necessarily reflect the opinions of the supporters, trustees, or other staff of the Fraser Institute. This publication in no way implies that the Fraser Institute, its trustees, or staff are in favor of, or oppose the passage of, any bill; or that they support or oppose any particular political party or candidate.
CopyrightCopyright © 2009 by the Fraser Institute. All rights reserved. No part of this publication may be reproduced in any manner whatsoever without written permission except in the case of brief passages quoted in critical articles and reviews.

The BC Agricultural Land Reserve: A Critical Assessment l 51
www.fraserinstitute.org l Fraser Institute
ISSN1918-8323 (online version)
Date of issueOctober 2009
Editing and productionKristin Fryer
DesignLindsey Thomas Martin
Cover designBill Ray
Images for coverSous les dossiers © Karl Bolf, Fotolia; red tape © Stockbyte, Punchstock; Balance © Alon Othnay, Fotolia; Question mark © Stephen Coburn, Fotolia; Treehugger © Leah-Anne Thompson, Fotolia; Stop © Alexander Samoilov, Fotolia
Supporting the Fraser Institute
To learn how to support the Fraser Institute, please contact
l Development Department, Fraser Institute Fourth Floor, 1770 Burrard Street Vancouver, British Columbia, V6J 3G7 Canada
l telephone, toll-free: 1.800.665.3558 ext. 586
l e-mail: [email protected]
52 l The BC Agricultural Land Reserve: A Critical Assessment
Fraser Institute l www.fraserinstitute.org
About the Fraser Institute
Our vision is a free and prosperous world where individuals benefit from greater choice, competitive markets, and personal responsibility. Our mission is to measure, study, and communicate the impact of competitive markets and government interventions on the welfare of individuals.
Founded in 1974, we are an independent research and educational organization with locations throughout North America and international partners in over 70 countries. Our work is financed by tax-deductible con-tributions from thousands of individuals, organizations, and foundations. In order to protect its independence, the Institute does not accept grants from government or contracts for research.
菲沙研究所的願景乃一自由而昌盛的世界,當中每個人得以從更豐富的
選擇、具競爭性的市場及自我承擔責任而獲益。我們的使命在於量度、
研究並使人知悉競爭市場及政府干預對個人福祉的影響。
Nous envisageons un monde libre et prospère, où chaque personne bénéfi-cie d’un plus grand choix, de marchés concurrentiels et de responsabilités individuelles. Notre mission consiste à mesurer, à étudier et à communi-quer l’effet des marchés concurrentiels et des interventions gouvernemen-tales sur le bien-être des individus.
Nuestra visión es un mundo libre y próspero donde los individuos se bene-ficien de una mayor oferta, la competencia en los mercados y la responsabi-lidad individual. Nuestra misión es medir, estudiar y comunicar el impacto de la competencia en los mercados y la intervención gubernamental en el bienestar de los individuos.
تتمثل رؤيتنا يف وجود عامل حر ومزدهر يستفيد فيه األفراد من القدرة عىل االختيار بشكل أما رسالتنا فهي قياس، ودراسة، وتوصيل تأثري . أكرب، واألسواق التنافسية، واملسؤولية الشخصية
.األسواق التنافسية والتدخالت الحكومية املتعلقة بالرفاه االجتامعي لألفراد

The BC Agricultural Land Reserve: A Critical Assessment l 53
www.fraserinstitute.org l Fraser Institute
Prof. Armen Alchian
Prof. Terry Anderson
Prof. Robert Barro
Prof. Michael Bliss
Prof. James M. Buchanan†
Prof. Jean-Pierre Centi
Prof. Thomas J. Courchene**
Prof. John Chant
Prof. Bev Dahlby
Prof. Erwin Diewert
Prof. Stephen Easton
Prof. J.C. Herbert Emery
Prof. Jack L. Granatstein
Prof. Herbert G. Grubel
Prof. Friedrich A. Hayek* †
Prof. James Gwartney
Prof. H.G. Johnson*
Prof. Ronald W. Jones
Dr. Jerry Jordan
Prof. David Laidler**
Prof. Richard G. Lipsey**
Prof. Ross McKitrick
Prof. Michael Parkin
Prof. F.G. Pennance*
Prof. Friedrich Schneider
Prof. L.B. Smith
Prof. George Stigler* †
Mr. Vito Tanzi
Sir Alan Walters
Prof. Edwin G. West*
Editorial Advisory Board
* deceased; ** withdrawn; † Nobel Laureate


