34
THE BCG STRATEGY CUP 2017 Case solution

THE BCG
STRATEGY CUP
2017
Case solution

Recap of the case questions
Proximus asked you to reflect on connectivity in the Millennial
generation
In these slides, you will find the answers to the quantitative questions
of this case
1. What is the total mobile data consumption of all Millennials in
Belgium?
2. What is the Millennial telecom market size in Belgium?

Estimating mobile data consumption of Millennials
Proximus management has asked you to answer the following questions:
Question 1.a:
What was the total mobile data consumption of all Millennials in 2016 in Belgium (in TB)?
Question 1.b:
What will be the total mobile data consumption of all Millennials in 2020 in Belgium (in TB)?

Mobile data consumption of Millennials
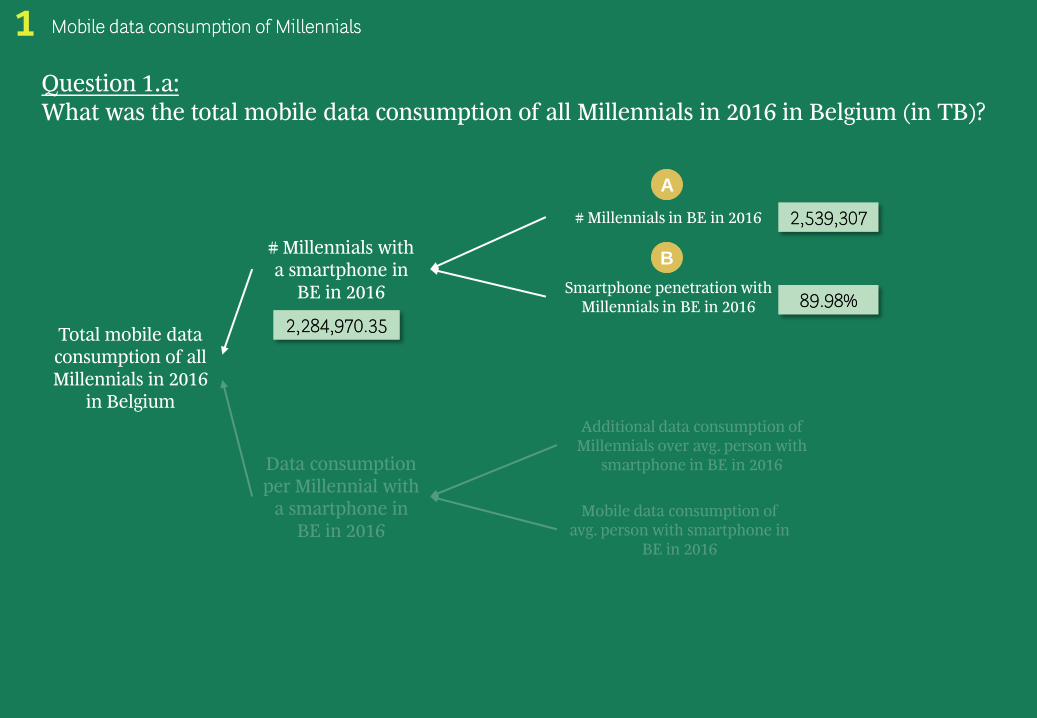
Question 1.a:
What was the total mobile data consumption of all Millennials in 2016 in Belgium (in TB)?
# Millennials with
a smartphone in
BE in 2016
Data consumption
per Millennial with
a smartphone in
BE in 2016
Total mobile data
consumption of all
Millennials in 2016
in Belgium
# Millennials in BE in 2016
Smartphone penetration with
Millennials in BE in 2016
Additional data consumption of
Millennials over avg. person with
smartphone in BE in 2016
Mobile data consumption of
avg. person with smartphone in
BE in 2016
Mobile data consumption of Millennials

Mobile data consumption of Millennials
Question 1.a:
What was the total mobile data consumption of all Millennials in 2016 in Belgium (in TB)?
# Millennials with
a smartphone in
BE in 2016
Total mobile data
consumption of all
Millennials in 2016
in Belgium
# Millennials in BE in 2016
A
In 2016, Millennials are 18-35 years old
In 2016, there are 2,539,307 people in
Belgium of age 18-35
Presentation from
Knowledge Team -
Generations
Data file – Belgian
population per age

Question 1.a:
What was the total mobile data consumption of all Millennials in 2016 in Belgium (in TB)?
# Millennials with
a smartphone in
BE in 2016
Total mobile data
consumption of all
Millennials in 2016
in Belgium
# Millennials in BE in 2016
Smartphone penetration with
Millennials in BE in 2016
Mobile data consumption of Millennials
A
2,539,307
In 2016, Millennials are 52% more
equipped with smartphones than an
average person in Belgium
In 2016, the smartphone penetration in
Belgium is 59.20%
Email from Knowledge
Team – Smartphone
penetration
Data file –
Smartphone
penetration
1,52 x 59.20%
B
Question 1.a:
What was the total mobile data consumption of all Millennials in 2016 in Belgium (in TB)?
# Millennials with
a smartphone in
BE in 2016
Data consumption
per Millennial with
a smartphone in
BE in 2016
Total mobile data
consumption of all
Millennials in 2016
in Belgium
# Millennials in BE in 2016
Smartphone penetration with
Millennials in BE in 2016
Additional data consumption of
Millennials over avg. person with
smartphone in BE in 2016
Mobile data consumption of
avg. person with smartphone in
BE in 2016
Mobile data consumption of Millennials
A
2,539,307
B
89.98%
2,284,970.35
Question 1.a:
What was the total mobile data consumption of all Millennials in 2016 in Belgium (in TB)?
Data consumption
per Millennial with
a smartphone in
BE in 2016
Total mobile data
consumption of all
Millennials in 2016
in Belgium
Additional data consumption of
Millennials over avg. person with
smartphone in BE in 2016
Mobile data consumption of
avg. person with smartphone in
BE in 2016
Mobile data consumption of Millennials

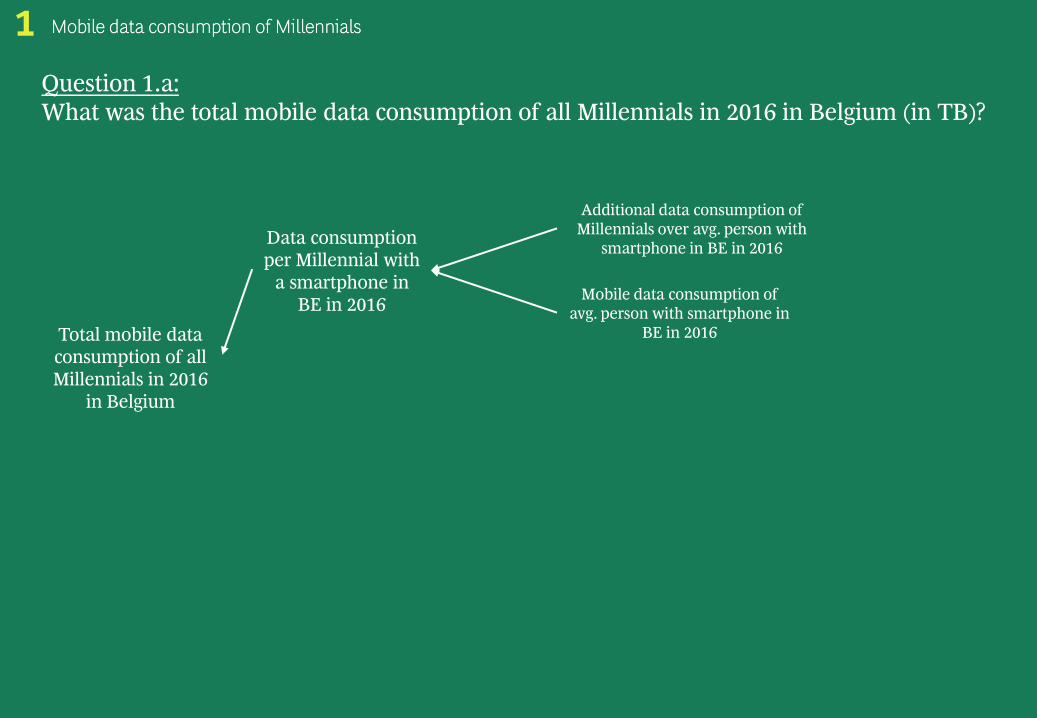
Question 1.a:
What was the total mobile data consumption of all Millennials in 2016 in Belgium (in TB)?
Data consumption
per Millennial with
a smartphone in
BE in 2016
Total mobile data
consumption of all
Millennials in 2016
in Belgium
Additional data consumption of
Millennials over avg. person with
smartphone in BE in 2016
Mobile data consumption of Millennials
C
Millennials consume 36% more mobile
data in 2016 than an average person
Email from
Knowledge Team –
Data consumption in
Belgium

Question 1.a:
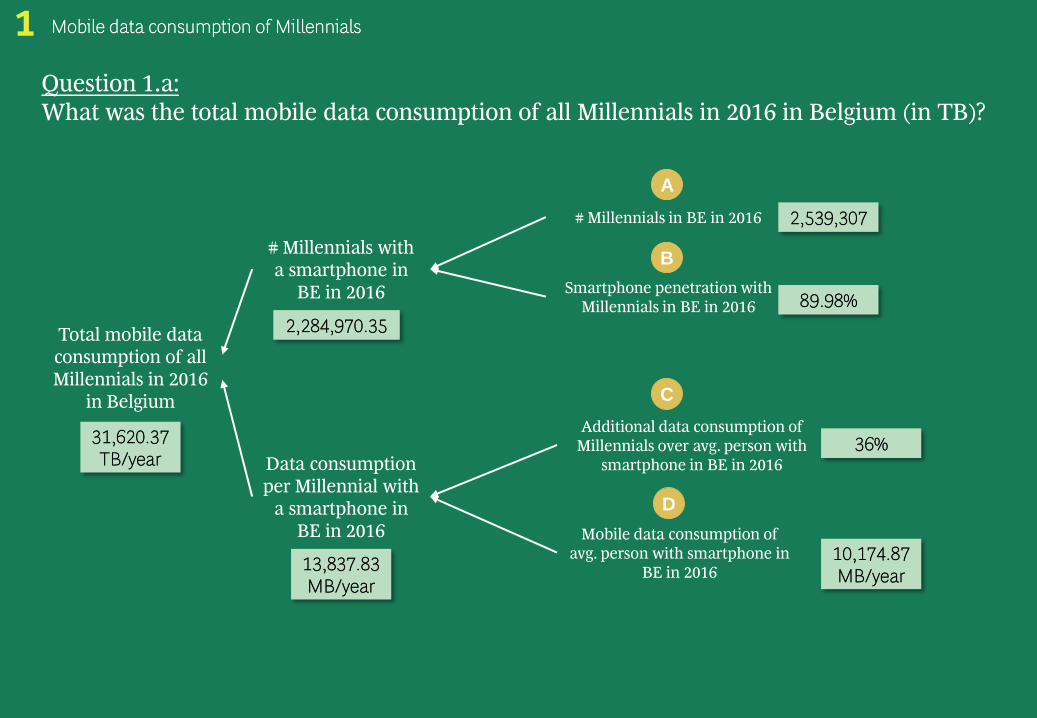
What was the total mobile data consumption of all Millennials in 2016 in Belgium (in TB)?
Data consumption
per Millennial with
a smartphone in
BE in 2016
Total mobile data
consumption of all
Millennials in 2016
in Belgium
Additional data consumption of
Millennials over avg. person with
smartphone in BE in 2016
Mobile data consumption of
avg. person with smartphone in
BE in 2016
Mobile data consumption of Millennials
C
36%
We have found for Belgium that 75% of
total mobile data consumption is content
from Youtube and 25% from other
sources. An average MP4 format Youtube
video consumes 14.53 MB/minute and
an average smartphone user watches 43
minutes and 46 seconds of Youtube
content on mobile every month.
Email from
Knowledge Team –
Data consumption in
Belgium
12 x 14.53 x 43.77
0.75
12 months per year
Question 1.a:
What was the total mobile data consumption of all Millennials in 2016 in Belgium (in TB)?
# Millennials with
a smartphone in
BE in 2016
Data consumption
per Millennial with
a smartphone in
BE in 2016
Total mobile data
consumption of all
Millennials in 2016
in Belgium
# Millennials in BE in 2016
Smartphone penetration with
Millennials in BE in 2016
Additional data consumption of
Millennials over avg. person with
smartphone in BE in 2016
Mobile data consumption of
avg. person with smartphone in
BE in 2016
Mobile data consumption of Millennials
A
2,539,307
B
89.98%
C
36%
10,174.87
MB/year
D
13,837.83
MB/year
31,620.37
TB/year
2,284,970.35

Mobile data consumption of Millennials
Question 1.b:
What was the total mobile data consumption of all Millennials in 2016 in Belgium (in TB)?
# Millennials with
a smartphone in
BE in 2020
Data consumption
per Millennial with
a smartphone in
BE in 2020
Total mobile data
consumption of all
Millennials in 2020
in Belgium
# Millennials in BE in 2020
Smartphone penetration with
Millennials in BE in 2020
Additional data consumption of
Millennials over avg. person with
smartphone in BE in 2020
Mobile data consumption of
avg. person with smartphone in
BE in 2020
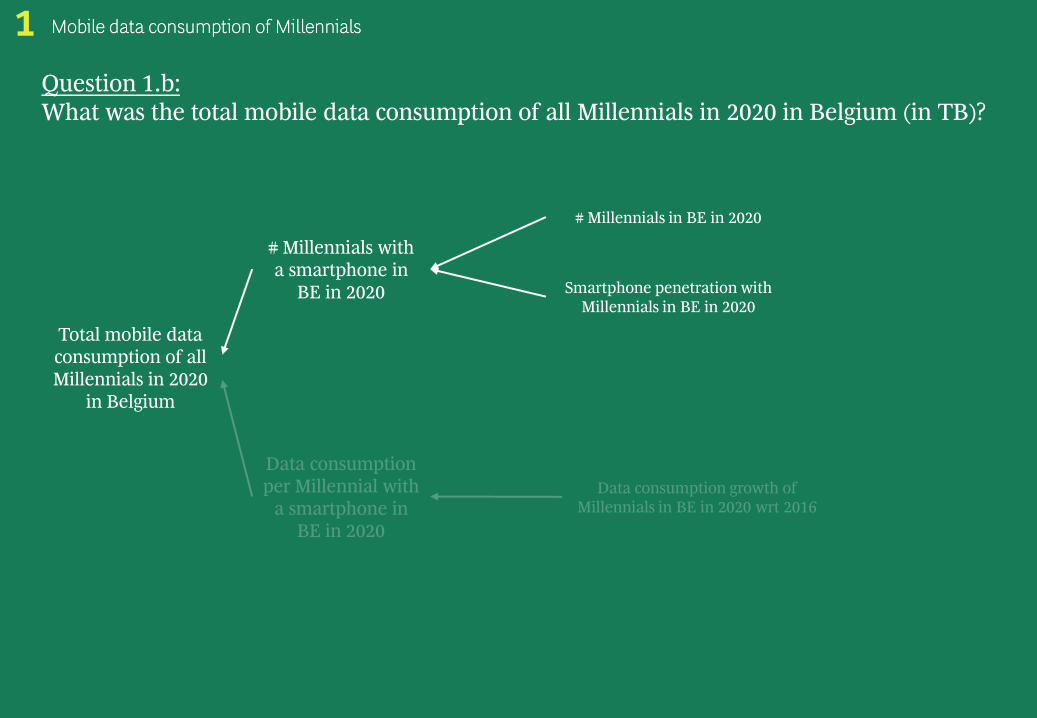
Question 1.b:
What was the total mobile data consumption of all Millennials in 2020 in Belgium (in TB)?
# Millennials with
a smartphone in
BE in 2020
Data consumption
per Millennial with
a smartphone in
BE in 2020
Total mobile data
consumption of all
Millennials in 2020
in Belgium
# Millennials in BE in 2020
Smartphone penetration with
Millennials in BE in 2020
Mobile data consumption of Millennials
Data consumption growth of
Millennials in BE in 2020 wrt 2016

Mobile data consumption of Millennials
# Millennials with
a smartphone in
BE in 2020
Total mobile data
consumption of all
Millennials in
Belgium in 2020
# Millennials in BE in 2020
A
In 2020, Millennials are 22-39 years old
In 2020, there are 2,646,390 people in
Belgium of age 22-39
Add 2020-2016 = 4
years to the data
for 2016
Data file – Belgian
population per age
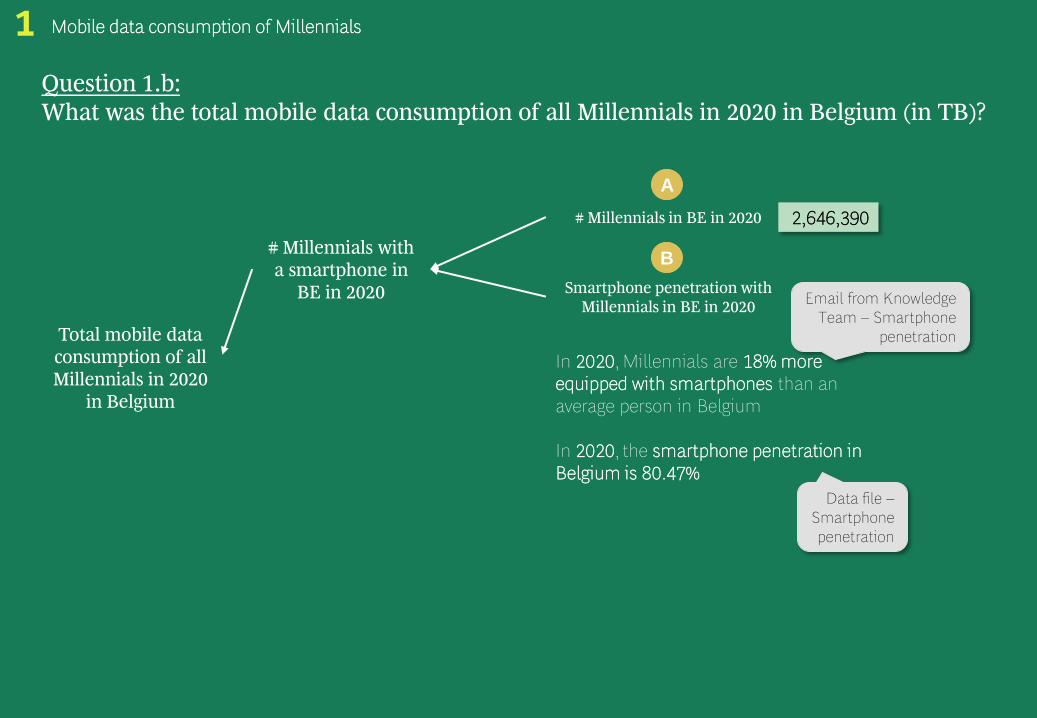
Question 1.b:
What was the total mobile data consumption of all Millennials in 2020 in Belgium (in TB)?
# Millennials with
a smartphone in
BE in 2020
Total mobile data
consumption of all
Millennials in 2020
in Belgium
# Millennials in BE in 2020
Smartphone penetration with
Millennials in BE in 2020
Mobile data consumption of Millennials
A
2,646,390
In 2020, Millennials are 18% more
equipped with smartphones than an
average person in Belgium
In 2020, the smartphone penetration in
Belgium is 80.47%
Email from Knowledge
Team – Smartphone
penetration
Data file –
Smartphone
penetration
Question 1.b:
What was the total mobile data consumption of all Millennials in 2020 in Belgium (in TB)?
B

# Millennials with
a smartphone in
BE in 2020
Data consumption
per Millennial with
a smartphone in
BE in 2020
Total mobile data
consumption of all
Millennials in 2020
in Belgium
# Millennials in BE in 2020
Smartphone penetration with
Millennials in BE in 2020
Mobile data consumption of Millennials
A
2,646,390
B
94.96%
2,512,880.23
Data consumption growth of
Millennials in BE in 2020 wrt 2016
Question 1.b:
What was the total mobile data consumption of all Millennials in 2020 in Belgium (in TB)?

Data consumption
per Millennial with
a smartphone in
BE in 2020
Total mobile data
consumption of all
Millennials in 2020
in Belgium
Mobile data consumption of Millennials
Data consumption growth of
Millennials in BE in 2020 wrt 2016
Question 1.b:
What was the total mobile data consumption of all Millennials in 2020 in Belgium (in TB)?

Data consumption
per Millennial with
a smartphone in
BE in 2020
Total mobile data
consumption of all
Millennials in 2020
in Belgium
Data consumption growth of
Millennials in BE in 2020 wrt 2016
Mobile data consumption of Millennials
C
Growth factor in mobile data
consumption with smartphone between
2016 and 2020 was 3.89
Data file – Data
consumption
Western Europe
3.89 x 13,837.83 MB/year 53,792.93
MB/year
Question 1.b:
What was the total mobile data consumption of all Millennials in 2020 in Belgium (in TB)?

# Millennials with
a smartphone in
BE in 2020
Data consumption
per Millennial with
a smartphone in
BE in 2020
Total mobile data
consumption of all
Millennials in 2020
in Belgium
# Millennials in BE in 2020
Smartphone penetration with
Millennials in BE in 2020
Mobile data consumption of Millennials
A
B
135,175.20
TB/year
Data consumption growth of
Millennials in BE in 2020 wrt 2016
C
53792.93
MB/year
2,646,390
94.96%
Question 1.b:
What was the total mobile data consumption of all Millennials in 2020 in Belgium (in TB)?
2,512,880.23

In the second part, you are asked to answer the following questions:
Question 2.a:
How large was the Belgian Millennial fixed services market in 2016 (in €)?
Question 2.b:
How large was the Belgian Millennial mobile services market in 2016 (in €)?
Question 2.c:
What was the total Millennials telecom market size in Belgium in 2016 (in €)?
Total Millennial market size in Belgium
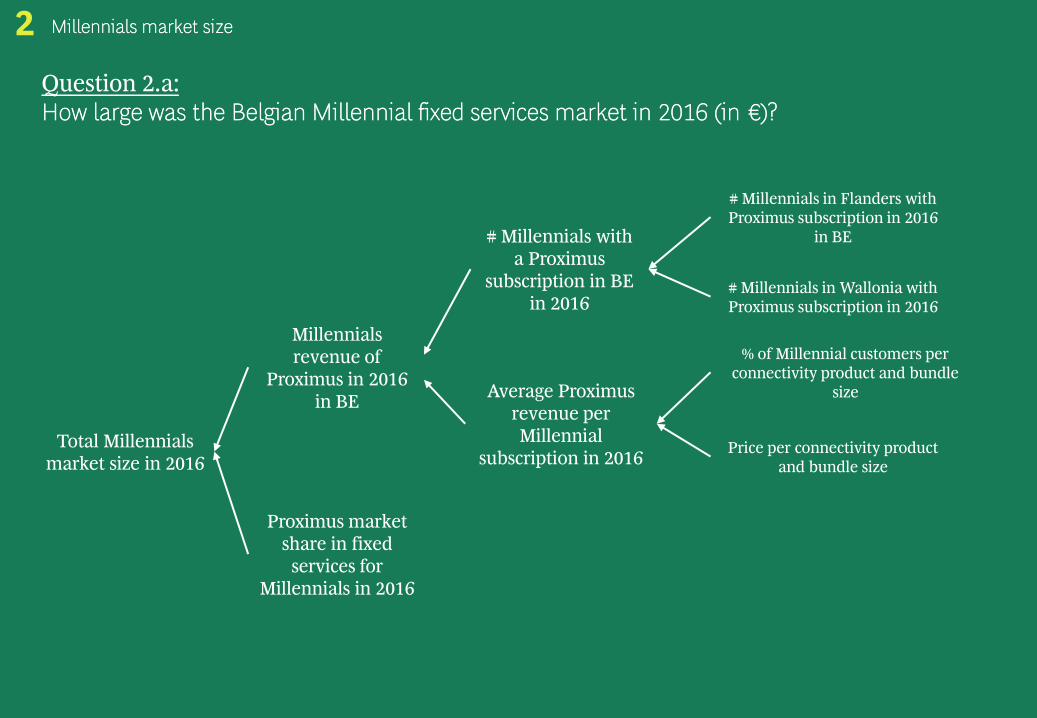
Question 2.a:
How large was the Belgian Millennial fixed services market in 2016 (in €)?
Millennials market size
# Millennials with
a Proximus
subscription in BE
in 2016
Average Proximus
revenue per
Millennial
subscription in 2016 Total Millennials
market size in 2016
# Millennials in Flanders with
Proximus subscription in 2016
in BE
# Millennials in Wallonia with
Proximus subscription in 2016
% of Millennial customers per
connectivity product and bundle
size
Price per connectivity product
and bundle size
Millennials
revenue of
Proximus in 2016
in BE
Proximus market
share in fixed
services for
Millennials in 2016

Question 2.a:
How large was the Belgian Millennial fixed services market in 2016 (in €)?
Millennials market size
# Millennials with
a Proximus
subscription in BE
in 2016
Total Millennials
market size in 2016
# Millennials in Flanders with
Proximus subscription in 2016
in BE
# Millennials in Wallonia with
Proximus subscription in 2016
% of Millennial customers per
connectivity product and bundle
size in 2016
Price per connectivity product
and bundle size in 2016
Millennials
revenue of
Proximus in 2016
in BE
Proximus market
share in fixed
services for
Millennials in 2016
Average Proximus
revenue per
Millennial
subscription in 2016

Question 2.a:
How large was the Belgian Millennial fixed services market in 2016 (in €)?
Millennials market size
# Millennials with
a Proximus
subscription in BE
in 2016
Total Millennials
market size in 2016
# Millennials in Flanders with
Proximus subscription in 2016
in BE
# Millennials in Wallonia with
Proximus subscription in 2016
Millennials
revenue of
Proximus in 2016
in BE There are 4,612,914 households in
Belgium,
16.23% of Belgian households are
Millennial households
60% of Millennial households are in
Flanders, the other 40% are in Wallonia
Our share in Wallonia is 55% of the
Millennial households,
Our share in Flanders is 40% of the
Millennial households
Data file –Belgian
households
E-mail from KT –
Millennial
households
There are 4,612,914 x 16.23% x 60% x40%
Millennial households in Flanders with
Proximus subscription and
4,612,914 x 16.23% x 40% x 55% in Wallonia E-mail from
Proximus –
Millennial market
share fixed services

Question 2.a:
How large was the Belgian Millennial fixed services market in 2016 (in €)?
Millennials market size
# Millennials with
a Proximus
subscription in BE
in 2016
Average Proximus
revenue per
Millennial
subscription in 2016 Total Millennials
market size in 2016
# Millennials in Flanders with
Proximus subscription in 2016
in BE
# Millennials in Wallonia with
Proximus subscription in 2016
% of Millennial customers per
connectivity product and bundle
size in 2016
Price per connectivity product
and bundle size in 2016
Millennials
revenue of
Proximus in 2016
in BE
Proximus market
share in fixed
services for
Millennials
179,682
164,709
344,390.93

Question 2.a:
How large was the Belgian Millennial fixed services market in 2016 (in €)?
Millennials market size
Average Proximus
revenue per
Millennial
subscription in 2016
Total Millennials
market size in 2016
% of Millennial customers per
connectivity product and
bundle size in 2016
Price per connectivity product
and bundle size in 2016
Millennials
revenue of
Proximus in 2016
in BE
Email from Proximus –
Connectivity products ranges
Millennials fixed services
Data file – Connectivity
products fixed services
% of customers start comfort maxi
Internet 2% 11% 3%
Int & tel 0% 1% 0%
Int & tv 5% 32% 9%
Int, TV, tel 4% 26% 7%
Prices per month start comfort maxi
Internet €27.5 €38.95 €48.2
Int & tel €45.95 €53.95 €65.95
Int & tv €46.95 €54.95 €65.95
Int, TV, tel €58.95 €63.95 €74.95
Weighted avg rev. per month start comfort maxi
Internet €0.44 €4.36 €1.54
Int & tel €0.09 €0.76 €0.26
Int & tv €2.112 €17.30 €5.94
Int, TV, tel €2.18 €16.56 €5.55

Question 2.a:
How large was the Belgian Millennial fixed services market in 2016 (in €)?
Millennials market size
# Millennials with
a Proximus
subscription in BE
in 2016
Average Proximus
revenue per
Millennial
subscription in 2016 Total Millennials
market size in 2016
# Millennials in Flanders with
Proximus subscription in 2016
in BE
# Millennials in Wallonia with
Proximus subscription in 2016
% of Millennial customers per
connectivity product and bundle
size in 2016
Price per connectivity product
and bundle size in 2016
Millennials
revenue of
Proximus in 2016
in BE
Proximus market
share in fixed
services for
Millennials
179,682
164,709
€685.25
€235,992,409.82
42.90%
€550,098,857.39
Email from Proximus - Market
shares Proximus in Belgian
telecom market
344,390.93
Question 2.a:
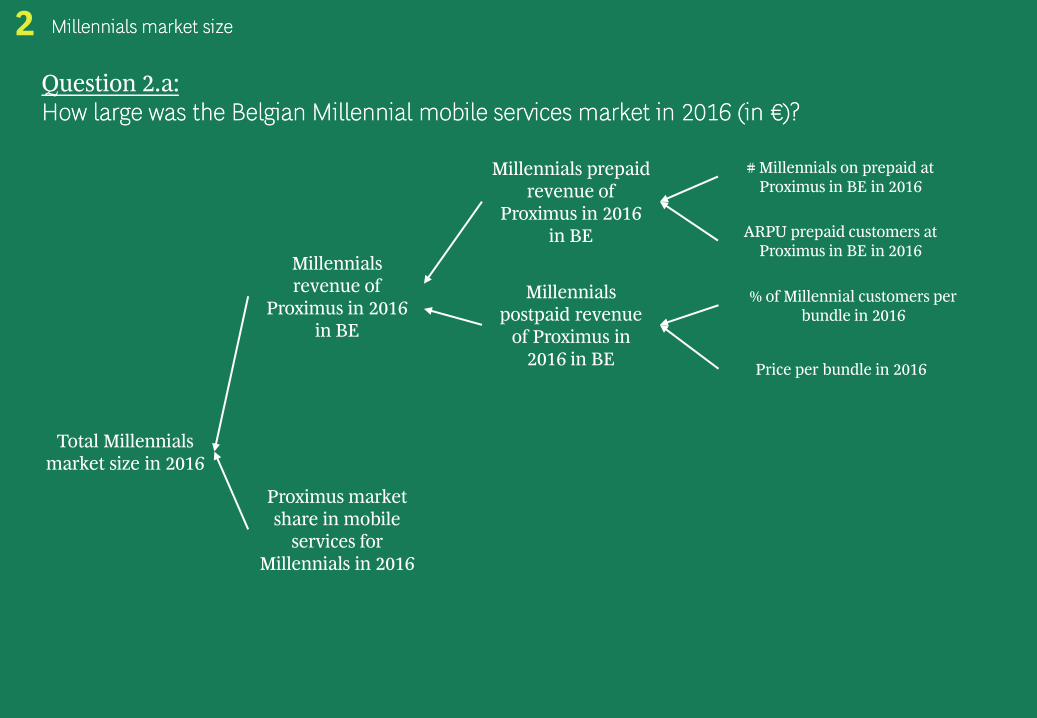
How large was the Belgian Millennial mobile services market in 2016 (in €)?
Millennials market size
Total Millennials
market size in 2016
Millennials
revenue of
Proximus in 2016
in BE
Proximus market
share in mobile
services for
Millennials in 2016
Millennials prepaid
revenue of
Proximus in 2016
in BE
Millennials
postpaid revenue
of Proximus in
2016 in BE
ARPU prepaid customers at
Proximus in BE in 2016
# Millennials on prepaid at
Proximus in BE in 2016
% of Millennial customers per
bundle in 2016
Price per bundle in 2016

Question 2.a:
How large was the Belgian Millennial mobile services market in 2016 (in €)?
Millennials market size
Total Millennials
market size in 2016
Millennials
revenue of
Proximus in 2016
in BE
Millennials prepaid
revenue of
Proximus in 2016
in BE ARPU prepaid customers at
Proximus in BE in 2016
# Millennials on prepaid at
Proximus in BE in 2016
There are 2,285,067 Millenials with a
smartphone in BE in 2016
40% of Belgian Millennials are on
prepaid in 2016
Proximus serves 38% of Belgian
Millennial prepaid customers in 2016
an average customer spends 9,6
euro/month
Question 1
Email from Knowledge Team -
Postpaid mobile services
Email from Knowledge Team -
Prepaid mobile services
347,330.24
€115.2 €40,012,416
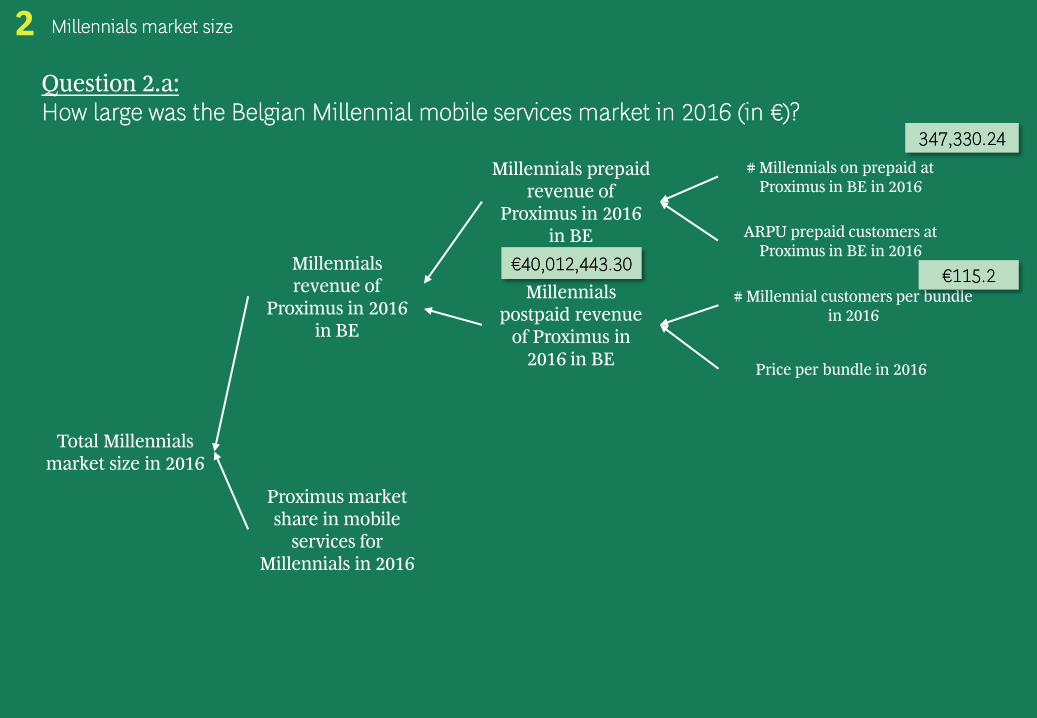
Question 2.a:
How large was the Belgian Millennial mobile services market in 2016 (in €)?
Millennials market size
Total Millennials
market size in 2016
Millennials
revenue of
Proximus in 2016
in BE
Proximus market
share in mobile
services for
Millennials in 2016
Millennials prepaid
revenue of
Proximus in 2016
in BE
Millennials
postpaid revenue
of Proximus in
2016 in BE
ARPU prepaid customers at
Proximus in BE in 2016
# Millennials on prepaid at
Proximus in BE in 2016
# Millennial customers per bundle
in 2016
Price per bundle in 2016
€40,012,443.30 €115.2
347,330.24

Question 2.a:
How large was the Belgian Millennial mobile services market in 2016 (in €)?
Millennials market size
Total Millennials
market size in 2016
Millennials
revenue of
Proximus in 2016
in BE
Proximus market
share in mobile
services for
Millennials in 2016
Millennials prepaid
revenue of
Proximus in 2016
in BE
Millennials
postpaid revenue
of Proximus in
2016 in BE
ARPU prepaid customers at
Proximus in BE in 2016
# Millennials on prepaid at
Proximus in BE in 2016
% of Millennial customers per
bundle in 2016
Price per bundle in 2016

Question 2.a:
How large was the Belgian Millennial mobile services market in 2016 (in €)?
Millennials market size
Total Millennials
market size in 2016
Millennials
revenue of
Proximus in 2016
in BE
Millennials
postpaid revenue
of Proximus in
2016 in BE
33.90%
# Millennial customers per bundle
in 2016
Price per bundle in 2016
Bundle % of Millennial customers
Proximus 10 8%
Proximus 15 52%
Proximus 25 24%
Proximus 45 10%
Proximus 65 6%
Bundle Price
Proximus 10 €10
Proximus 15 €15
Proximus 25 €25
Proximus 45 €45
Proximus 65 €65
Bundle
Weighted avg. rev
per month
Proximus 10 €0.8
Proximus 15 €7.8
Proximus 25 €6.0
Proximus 45 €4.5
Proximus 65 €3.9
Total €23.00
Total incl. out of bundle €27.14
Email from Knowledge Team -
Postpaid mobile services
60% of Millennials in Belgium are on
postpaid in 2016
Proximus serves 30% of Millennials on
Postpaid in Belgium in 2016
The average % out of bundle
consumption for postpaid services is
18%
€325.68 12 times the
monthly price
€133,956,132.15
411,312.12

Question 2.a:
How large was the Belgian Millennial mobile services market in 2016 (in €)?
Millennials market size
Total Millennials
market size in 2016
Millennials
revenue of
Proximus in 2016
in BE
Proximus market
share in mobile
services for
Millennials in 2016
Millennials prepaid
revenue of
Proximus in 2016
in BE
Millennials
postpaid revenue
of Proximus in
2016 in BE
ARPU prepaid customers at
Proximus in BE in 2016
# Millennials on prepaid at
Proximus in BE in 2016
# Millennial customers per bundle
in 2016
Price per bundle in 2016
€115.2
€325.68
33.90% Email from Proximus -
Market shares Proximus in
Belgian telecom market
€173,968,575.45
€513.181.638,51
€133,956,132.15
€40,012,443.30
347,330.24
411,312.12


