This PDF is a selection from an out-of-print volume from the National Bureau of Economic Research Volume Title: International Financial Transactions and Business Cycles Volume Author/Editor: Oskar Morgenstern Volume Publisher: Princeton University Press Volume ISBN: 0-870-14091-4 Volume URL: http://www.nber.org/books/morg59-1 Publication Date: 1959 Chapter Title: The Behavior of Long-Term Interest Rates Chapter Author: Oskar Morgenstern Chapter URL: http://www.nber.org/chapters/c9469 Chapter pages in book: (p. 442 - 506)
Transcript
This PDF is a selection from an out-of-print volume from theNational Bureau of Economic Research
Volume Title: International Financial Transactions and BusinessCycles
Volume Author/Editor: Oskar Morgenstern
Volume Publisher: Princeton University Press
Volume ISBN: 0-870-14091-4
Volume URL: http://www.nber.org/books/morg59-1
Publication Date: 1959
Chapter Title: The Behavior of Long-Term Interest Rates
Chapter Author: Oskar Morgenstern
Chapter URL: http://www.nber.org/chapters/c9469
Chapter pages in book: (p. 442 - 506)
CHAPTER IX
THE BEHAVIOR OF LONG-TERMINTEREST RATES
Section 1. The Significance of Long-Tenn Interest Rates
In this chapter an attempt is made to discover hcw long.term interest rates in our four countries are related, and to find outwhether and how these relationships influence capital movements,stock prices, etc., thus contributing to the international dependenceof the various business cycles. We shall also investigate to someextent the highly significant connections between the long-termand short-term rates in each country and compare these relation-ships with each other. This will involve making use of the resultsobtained in Chapters III and IV concerning the international be-havior of short-term rates.
The long-term rate has played a fundamental role in businesscycle theories; it is therefore obvious that we should look to thosetheories for guidance and shall want to examine them, In theirturn, in the light of our own materiaL The interrelation of thevarious types of interest rates is itself a problem, far beyond thescope of the present investigation. Nevertheless we hope to makea small contribution to its elucidation, If only by presenting thematerial collected for this chapter and analyzed for our ownpurposes. Data about long-term interest rates are unfortunately noteasily obtained for long periods and for several countries.
It was difficult to choose a proper, representative short-termrate for each country and to determine whether it underwent hn-portant functional changes (of. the discussion on pp. 76 if.). It isfar more difficult to find suitable long-term interest rates. Althoughbusiness cycle theory until very recently has run In terms of the'rate of interestat best distinguishing only between a short-termand a long-term rateeconomists have become Increasingly awareof the artificiality of this approach. This becomes particularly clearin respect to long-term rates. The various short-term rates are soclosely related to each other that no great mistake is made Inpicking any one, as long as only the direction of the movementsand the specific cydes are Important When the absolute stand In
-/ (
SiGNIFICANCE OF LONG-TERM RATES
various countries is to be compared, the matter of the proper choiceassumes greater significance.
While there also are always several simultaneous long-term rates,their interdependence is of a more complicated nature. The riskelement comes much snore to the fore than with short-term rates;this applies both to the varying length of long-term loans andto the different grades of bonds for each duration. Attempts toaccount separately for the pure "interest" and "risk" factors in thegiven market rate have been made, but they have encountered, aswas to be expected, great difficulties. The information in this studyas given by the market rate is al-I the information, considering ourpresent tools of observation. We shall therefore in the following notbe able to make this highly desirable distinction.
There is a great dearth of studies of long-term rates suitable forour purposes. Little has been done in particular regarding inter-national comparisons or transmission of changes from one countryto another.'
(3) The long-term rate has been of great importance in virtuallyall business cycle theories. It is therefore necessary to discuss theprincipal views in order to provide a proper framework for thesubsequent measures. Many of these theories, notable as they are,e.g., that of K. Wicksell, bear no direct and obvious relation topreceding empirical investigations. They seem to have been ab-stracted from the general observation and experience available tothe writers. it is clear that this can at best be only a preliminaryview, to be tested by extensive empirical investigations upon which
a theory may later be erected. The main point of theory is thatthe long-term rate (assuming that there is at least one representative
rate) controls the allocation of investible funds and that the values
of all durable goods move inversely with the rate though theprocess of capitalization. Thus a decline in the rate would drive up,
or more strictly spealdng be identical with, an increase of values
of capital goods. Since other prices, notably labor and raw materials,
would not be thus affected quickly, a gap for profit would appear
most important works are the following: Karin Kock, A Study of In-
terest Rates, London, 1929; Frederick R. Macaulay, Some Theoretical Problems
Suggested by the Movements of interest Rates, Bond Yields and Stock Prices in
the United States since 1856, National Bureau of Economic Research, 1938;
Winfield W. Riefler, Money Rates and Moneii Markets in the United States,
New York, 1930; Carl Snyder, Business Cycles and Business Measurements,
New York, 1927; Jan Tinbergen, Business Cycles In the United Kingdom, 1874-
1914, Amsterdam, 1951.
443
i
REHAVWR OF LONG-TERM iNTEREST RATES
that could be closed by increased production of capital goods. Anexpansion of economic activPy would follow, until the differey.between the profit expectation and the rate of interest has disap-peared due to changes in relative prices.
Another observation is that the rates of interest move with theprice level but show a lag behind the business cycle (as for theevidence of the latter cf. pp. 95 if. for short-term rates, and pages451 if. beiow for long-term rates). This has not been utilized intheories of the cycle to a like extent.
Al) theories seem to emphasize a delay in the adjustment of thelong-term to the movements of the short-term rate. This is stressedl)aidularly for the time before the lower turning point, when theshort-term rate is very low but short-term capital is for a longwhile not transformed into long-term capital, in spite of a veryfavorable differential to the lender large enough to make up for thedifference in type of commitment. The assertion will be amplytested (section 5). Ciearly if there should be notable differencesin that respect, around closely packed lower turning points ofbusiness cycles of different countries, this would account for sub-sequent differences in their expansions and for international shiftsof funds. In other words the alternatives for short-term funds inA are long-term employment in A, or a short-term shift to B, orlong-term use in B (taking only two countries), thus giving riseto capital exports. For all these possibilities there are thresholdsof varying but unknown magnitude. Simple assumptions will runafoul of the facts; for example, we saw in section 3 of Chapter IVthat even among the sensitive short-term rates unaccountably highpermanent differences remained.
To this must be added the possibility of lags, which may workwithin a country or amcng various countries in the media men-tioned above. The rates may be not only interdependent at a givenmoment of time, but in a complicated manner over periods of time.Domestic interdependence of rates has received increasing atten-tion by theorists,2 but it is safe to say that these investigations arefar from concluded, especially in view of the paucity of empiricalexplorations. M. Kalecki3 has made a statistical study of the relationbetween British long-term and short-term rates.
'Cf., e.g., J. Tinbergen, "The Explanation of Interest Rates," QuarterlyJournal of Economics, Vol. i.z, 1947, p. 391 if., and the literature aiscussedthere. Also F. A. Lutz, "The Stnicture of Interest Rates," Quarterly Journal ofEconomics, Vol. Lv, 1940.
'Studies In Economic Dynamics, London, 1943, Chap. is.
444
SIGNiFICANCE OF LONG-TERM RATES
The functional relation is not stable, but varies from country tocountry and even within the same one (at least over longer periods),so that the frequent assertion that the long-term rate can alwaysbe understood as the result of a series of repeated borrowings andlendings at successive short-term rates, if ever valid, is only ofrestricted plausibility. It cannot be used in its present simple formfor a general explanation of the relation of long-term and short-term rates to each other. However, should it hold, it would haveto be extended to international relations too---at least for certaintypes of business.
It is also possible that, instead of comparing interest rates ofdifferent countries, the prospective borrower or investor watchesthe differences of rates in other countries, or, at least as plausibly,the rates of change of the various interest rates. All this leads tostatistical complications of such magnitude that they cannot beresolved with ordinary computational devices; they are therefore notfurther considered at present.
The question arises whether the absolute differences betweenlong-term rates of various countries must also obey the law ofthe solidarity of money markets, which thus would become a lawof the solidarity of capital markets. This would mean acceptingthe values of Tables 74 and 75 for the period of yearly interestshown there. It was very difficult, as the reader will recall, to acceptthe detailed argumentthough not the general ideaof thesolidarity hypothesis as far as short-term rates were concerned.It will be at least as difficult in the present case; but before passingjudgment we shall consider the evidence which, to our knowledge,has never been assembled on a broad systematic basis. It will alsobe instructive to compare the behavior of these differences withthose of the short-term rates. One would also have to see whetherthey conform to the data on capital exports as expressed by foreigncapital issues (cf., however, Chapter X, section 4). In these ques-tions the monetary standard plays a role. If the solidarity hypothesiscan in theory be extended to the long-term rates, it will be necessaryto limit it to the period of the gold standard. For other monetarystandards other principles would have to be worked out, becausesome principles must prevail for intercommunicating economies. Itwould upset our beliefs if we assumed that the differences betweenlong-term rates of different countries could be entirely arbitrary.
We now turn finally to a seemingly trivial, but in fact quitefundamental, question: what is a long-term interest rate? It is
445
£
BEHAVIOR OF LONG-TERM iNTEREST RATES
relatively easy to state what a short-term rate is and consequeflt1no serious trouble was encountered in earlier chapters. There isclear definition of the credit instruments and thus a good descrip.tion of the economico-physical processes that are controlled bythe credit operation. Some of these processes are quite specillcajknown. Not so with the long-term rate. Questions as to the natureof long-term rates were ably and extensively discussed by F. R.Macaulay, op. cit. There is, for example, the problem of how to dealwith differences in maturity of bonds (these being taken as thechief credit instruments), because prices of bonds with longermaturity would necessarily show wider amplitudes in their fluctua..lions. In an international comparison apparent absolute differencmight be misleading if they should be obtained for bonds ofvarying maturity.4 Yield indexes over long periods embody similardifficulties even for one and the same country.
The main difficulty however lies in another direction not con-sidered by Macaulay: when a short-term rate changes, this variationbecomes quickly effective, e.g., for the call money rate, overnight.In other words within one day all credits governed by thi5 rateare extended at the new rate. Changes in the discount rate willalso affect all transactions within perhaps fifteen to thirty days,depending on the distribution of old and new credits, but as arule almost all will have expired in a short time. So we may dis-tinguish between the market rate and the effective rate,5 i.e., theone governing going contracts. The market rate will only graduallybecome effective. But it is the market rate, at which new contractsare being concluded, that determines future operations. In thelong-term capital market nothing has happened for all the bor-rowers under existing contracts,e when the long-term rate has m-creased; only the new additional credit operations are influenced.Yet the statistics show a rise of the market rate, without taking intoaccount that its effectiveness is at first very limited and onlygradually grows into the state of 100 per cent effectiveness. If one
4Th1s will have to be remembered In evaluating some of our statistics,esecia11y those of Tables 115 to 120.This must not be coniused with 1. Fisher's real-rate," which compares aninterest rate with the changes In the price level. Cf. his treatment in The Theoryof interest, New York, 1930.
'As far as their bormwin and lending Is concerned; otherwise they are allaffected Indirectly through the Intermediary channels and the price movementsof the securities.
448
SiGNIFICANCE OF LONG-TERM RATES
has monthly averages of short-term rates, the difference betweenthe (statistical) market rate and the effective rate will not be verylarge. In the long-term market an indefinite period may elapsebefore the prevailing market rate is universally effective.T In fact
such a state will never be reached in view of the length of mostborrowing operatIons and subsequent changes of the market rate.
In order to get true, meaningful information, the market rate, corn-
puted, for example, from bond yields, would have to be weighted
for the amounts of credit outstanding and newly contracted. Con-
sideration would also have to be given to refunding. The theoreti-cally interesting operations are however the new flotations.
This applies to the borrower. The creditor is obviously in an-
other position even vis-à-vis old contracts, since the price change
of bondsexpressing the interest rate variationproduces a capital
loss or gain, which may even be transferred (with inverse sign) to
the debtor, depending on repurchase and callability of the bonds.
If old bonds are sold the yield is for the purchaser an effective rate,
but not for the debtor, who may calculate "cost," for example, on
the old basis.A further complication arises when the teal rates axe considered,
i.e., when correction is made for the movement of price levels. Again
the case is simple when short intervals are taken. Only when one
is confronted, say, with sharp changes on the stock market, will
there be much importance to this correction. But for long-term
operations the movements of price levels become of prime signifi-
cance. So the meaning of I. Fisher's fundamentally correct measure
increases with the length of the period considered or with the ex-
tent of fluctuations of a relevant price index or with both. However
its practical applicability is limited by the extent to which one has
solved the preliminary problem of accounting for the quantitative
distribution of market and effective rate and of old and new se-
curities and their transfers within the period under study. We refer
only in passing to the various lags which may be involved.
These remarks serve as a background for the observation that
the situation becomes almost hopelessly complex when four coun-
tries are to be studied simultaneOuslY. Yet all this information
This livstereris" i.e., the gradual transmissionof effects of changes, Is an
important (eature of economic relatiofl31iPS. A dynamic theory when it once
a pears will have to take the matter fully into account For discussion of price
teory under this aspect of. 0. Morgeustem, WW ch piOgfl0Se op. cit., pp.
650.447
BEHAViOR OF LONG-TERM INTEREST RATESwould be requiied in a field where undoubtedly a high
sensitjvjto changes, rates of change, actual and expected, etc., prevailsQuite aside from the immense computational task, requiringelectronic computers, there simply is no basic informationavailablewhich permits the distinction to be made between market ratesand effective rates. It will be a task for the future to devise tech.niques for collecting statistics which will enable us to gain properinsight into these conditions. Possibly some of the
contradictionsobserved by various students in the behavior of interest rates andof their relations to prices are due to this type of lack of homo-geneity of the material, because some fundamental concepts havenot been applied to the measuremen. We shall ourselves, in thestudy of the relationships between short-term and Iong.term rates(cf. section 4), note further discrepancies of a most disconce.tgnature.The diculties in correlating the movements of the rates ofinterest with price levels may be due to the fact that the rateis a "real" quantity and prices are not; for example, the price levelcould just as well be double what it is even if the rate were the same.The transition from one price level to another, on the other hand,may very well set interest rates into motion until the final state isreached. A truly dynamic theory_which we lack in economicwould describe this transitory process in detail.
Section 2. The Statistics of Long-Term Interest Rates(6) In order to econom space we shall merely state the sourcesand nature of the four long-term rates chosen for our counlrzeswithout going into any diSCUSSiOn of their general background. Thereader will be able to identify our series fully from the descriptionswhich follow.
The principles of selection are the same applied currently in thiswork: (a) the series should be representative for the activity whichit describes or which is controlled by the underlying operation;(b) it should in this sense be internationally comparable; and (c)it should be available for as long a period as possible in orderto conform with the time periods covered by series in relatedfields.The greatest arbitrarji is in (a), while (b) follows almostautomaticaily if a good domestic choice has been made. A goodchoice would be that in which the rate actually applies to large
448
STATISTiCS OF LONG-TERM RATES
scale operations;8 thus yields of municipal bonds would not fallinto this category, but yields of consois would. The internationalcomparability of yields of government bonds is, while not obvious,not an unreasonable assumption. if differences of maturity prevail)this will affect amplitudes of fluctuations but not the cycle turningpoints, which are our primary concern. Maturity differences willalso distort the absolute differences of various rates. These howeverdo not enter significantly into our subsequent discussion. Cycleturning points in the difference will not be materially affectedif such cycles exist at all. Fundamentally the choice is restricted,if not wholly governed, by the third factoravailability. Thisfinally had to settle the issue in each case.
In the following paragraphs we give the sources. Section 3 willthen take up the usual cyclical analysis. Charts 58 to 56 show theseries on a monthly basis. The period covered is variously 1870-1913and from the close of World War I up to 1939. The characterization
of the data by means of frequency distributions is omitted, because
the graphs show clearly very long-range swings and thus makethe computation of the distributions an even more doubtful affair
than in time series having only short-run variations (cyclical orotherwise). Seasonal variations were only observed and therefore
corrected for France and England.(7) The long-term rates are:United States. F. R. Macaulay9 calculated the yields of American
railroad bonds on a monthly basis horn 1857 to 1936. The yields
are based on monthly average prices, the average being the arith-
metic mean of the monthly maxima and minima quotations. "Eco-
nomic drift," i.e., secular and cyclical changes in the index induced
by changes in the grades of the bonds, was eliminated from the
index by means of Macaulay's "4.50 sigma index."10
The Standard Statistics Company computed yields of fifteen
high-grade railroad bonds for the United States and these were used
to complete the United States long-term interest rates to 1938.
Great Britain. Yields of 8 per cent consols are available on a
'A fundamental difference In the financing of securities before World War 1
between the United States and Europe was that In New York it was done
largely by means of credit, while in Europe the proportion of savings was
greateras far as one can know.The Movements of Interest Rates, Bond Yields and Stock Prices In the
United States since 1858, National Bureau of Economic Research, 1938, p.
A142.Ibid., pp. 85ff.
449
BEHAVIOR OF LONG-TERM INTEREST RATES
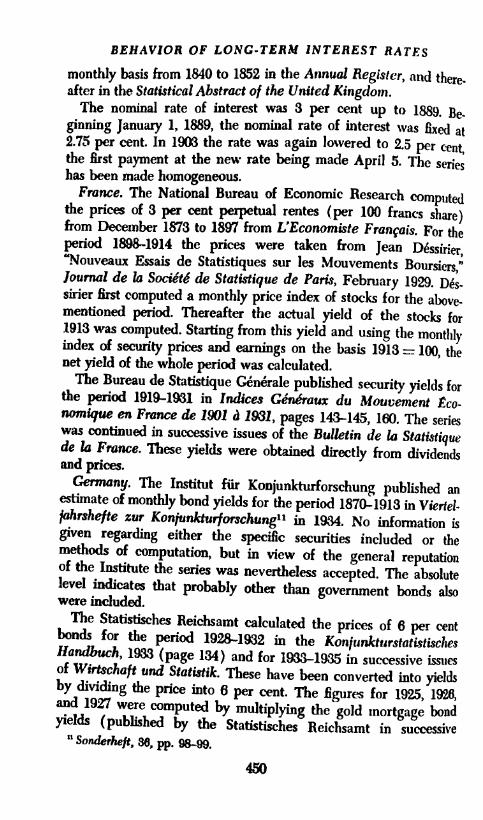
monthly basis from 1840 to 1852 in the Annual Register, and there.after in the Statistical Abstract of the United Kingdom.
The nominal rate of interest was 3 per cent up to 1889. Be.ginning January 1, 1889, the nominal rate of interest was Ibj at2.75 per cent. In 1903 the rate was again lowered to 2.5 per cent,the first payment at the new rate being made April 5. The serieshas been made homogeneous.
France. The National Bureau of Economic Research computedthe prices of 3 per cent perpetual rentes (per 100 francs share)from December 1873 to 1897 from L'Econom&ste Français. For theperiod 1898-1914 the prices were taken from Jean Déssirier,"Nouveaux Essais de Statistiques sur les Mouvements Boursien,"Journal de la Société de Statistique de Pari,i, February 1929. Des-sirier first computed a monthly price index of stocks for the above-mentioned period. Thereafter the actual yield of the stocks for1913 was computed. Starting from this yield and using the monthlyindex of security prices and earnings on the basis 1913 100, thenet yield of the whole period was calculated.
The Bureau de Statistique Gnérale published security yields forthe period 1919-1931 in Indices Généraux du Mouvement Eco-nomique en France de 1!X)1 a 1931, pages 143-145, 160. The serieswas continued in successive issues of the Bulletin de la Statistiquede la France. These yields were obtained directly from dividendsand prices.
Germany. The Institut für Konjunkturforschung published anestimate of monthly bond yields for the period 1870-1913 in Viertel-fahrshefte zur Konjunkturforschung" in 1934. No information isgiven regarding either the specific securities included or themethods of computation, but in view of the general reputationof the Institute the series was nevertheless accepted. The absolutelevel indicates that probably other than government bonds alsowere included,
The Statistisches Reichsamt calculated the prices of 6 per centbonds for the period 1928-1932 in the KonjunkturstatstischesHandbuch, 1933 (page 134) and for 1933-1935 in successive issuesof Wirtschaft und Statistik. These have been converted into yieldsby dividing the price into 6 per cent. The figures for 1925, 1926,and 1927 were computed by multiplying the gold mortgage bondyields (published by the Statistisches Reichsamt in successive
'1Sonderhejt, 36, pp. 98-99.
450
CYCLICAL BEHAVIOR OF LONG-TERM RATES
issues of Wirtschaft und Statistik since 1925)12 for 1926 and 1927by 0.900, which is the average monthly ratio of overlapping figuresof gold mortgage bond yields and 6 per cent bond yields forJanuary-June 1928.
Section 3. Cyclical Behavior of Long-Term Interest Rates
(8) Charts 53 to 56 show that the specific cycles of long-terminterest rates we are able to mark off visually, in applying thestandard definition, are not without elements of ambiguity. Thecycles are sometimes clearly in evidence; at other times they mightbe considered part of a phase of a longer cycle. An instance is
that of German bond yields, where there is a decline from the endof 1878 to the second half of 1889, a movement that is continuedin spite of some interruptions to the middle of 1896, when a generalupward movement begins. Similar conditions prevail in the otherseries.
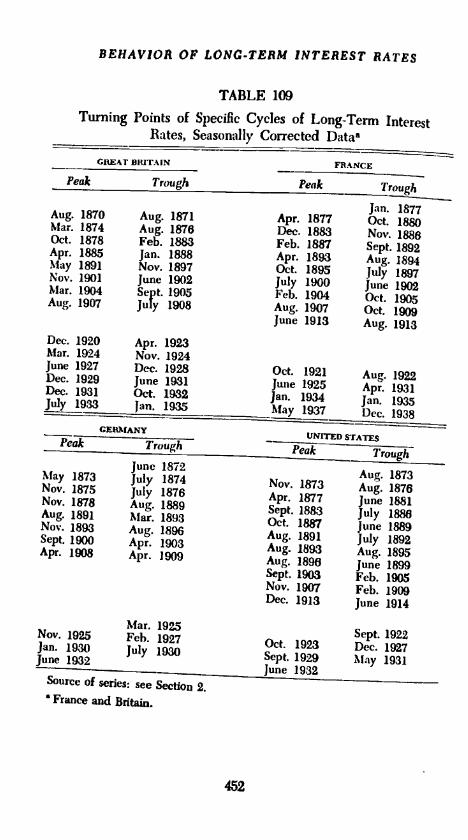
Table 109 gives the dates of the specific cycle turning points and
can be compared with Table 12 containing those of the short-
term rates. In Table 110 we show the number and duration of thespecific cycles for seasonally corrected data. The period coveredis the same as for the short-term rates, February 1878-August 1913,
426 months. Averages were not computed for the period after World
War I.The number of full cycles is very small; for Great Britain five,
France eight, Germany four, and the United States seven. OnlyFrance has the same number of cycles as for the short-term interest
rate; in all other cases there are fewer cycles. This is not un-expected, but not without interest. If the rates of long and shortmaturities are interdependent, then their cycles ought to be. Thus
observed differences must express this interdependence, which may
be of a very complicated nature. Gennan and British cycles are
the longest, 91.2 and 71.4 months respectively, making the first
more than twice as long as those for short-term rates, the second
50 per cent longer. The French cycles are virtually of the same
length for both rates-49.2 and 47.5 months. The percentage shares
ii A simple average of the yields of mortgage bonds with nominal Interest
rates of 5, 6,7, 8, and 10 per cent was struck. Each of the groups is an average
of ten bonds, except in 1928 when the 6 per cent group is an average of four
bonds and in 1927 when the 10 per cent group is an average of eight bonds.
451
BEHAViOR OP LONG-TERM INTEREST RATES
TABLE 109
Turning Points of Specific Cycles of Long-Term InterestRates, Seasonally Corrected 1)ataa
GREAT DRITAIN
Peak Trough
Aug. 1870 Aug. 1871Mar. 1874 Aug. 1876Oct. 1878 Feb. 1883Apr. 1885 Jan. 1888May 1891 Nov. 1897Nov. 1901 June 1902Mar. 1904 Sept. 1905Aug. 1907 July 1908
Aug. 1873Nov. 1873 Aug. 1876Apr. 1877 June 1881Sept. 1883 July 1886Oct. 1887 June 1889Aug. 1891 july 1892Aug. 1893 Aug. 1895Aug. 1896 June 1899Sept. 1903 Feb. 1905Nov. 1907 Feb. 1909Dec. 1913 June 1914
Sept. 1922Oct. 1923 Dec. 1927Sept. 1929 May 1931June 1932
:3
CYCLICAL BEHAVIOR OF LONG-TERM RATES
TABLE 110
Number and Duration of Specific Cycles of Long-Term Interest Ratesof Four Countries, Seasonally Corrected Data
Prewar, February 1818August 1913, 426 months
AVERACEPER CENTb
DURATIONAVERACE DURATION o?: OF SPECIFIC
NUMBER OF: (MONTHS) c'ci.xsEr- Con- Full Er- Con- Full Er- Con-
'Durations of only complete cycles, expansions, and contractions are included in their respec-five columns.
The percentages are calculated from a base equal to the average duration of expansions pluscontractions. This sum is equal to the average duration of cycles only when the number of fullcycles is the same as the number of expansions and contractions.
Only complete cycles are counted; parts of cycles at both ends of a series are dropped.Cycles are measured from trough to txough. Similarly only complete expansions and contractionsare counted in their respective columns.
'Cycles determined by French rentes.
of expansions and contractions are more evenly disiributed than wasthe case for the short-term rates, where there was a clear andgeneral case of longer duration of expansions than of contractions;they exceeded the latter up to 100 per cent. Now the oppositecondition seems to prevail, except in the United States. All this isa reflection of the long swings in the rates referred to above. (It willbe remembered that this relationship between expansions and con-tractions for short-term rates was exactly reversed for 1925-1938.)
At any rate the interdependence cannot be the same for all countries
in view of these differencesprovided the data are satisfactory and
the rates equally representative.However the lack of definition of the pattern of behavior has
also to be viewed in the light of the fact that specific cycles them-
selves are of a far more uncertain nature than those of the short-
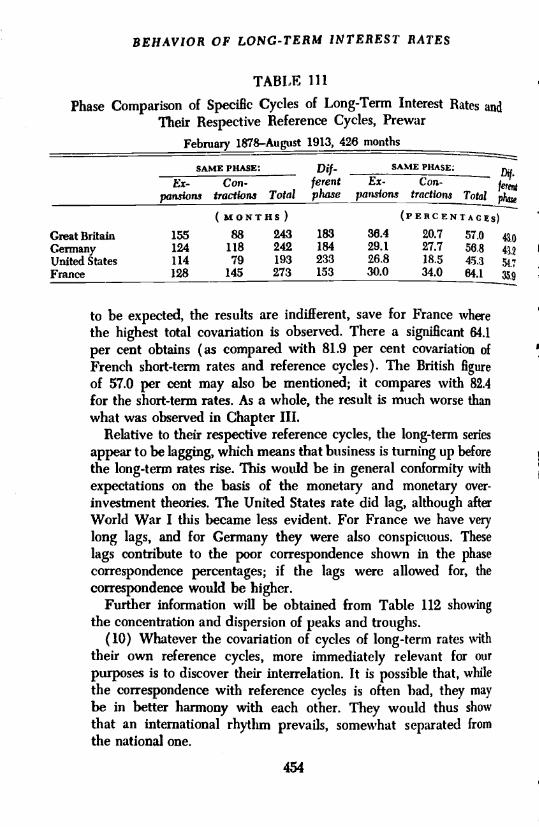
term rates.(9) Taking next the covariation of the long-term rates with their
respective reference cycles, we can be very brief and refer thereader to Table 111, in which the covariations are computed. As is
United States 114 79 193 233 26.8 18.5 45.3 pFrance 128 145 273 153 30.0 34.0 64.1
to be expected, the results are indifferent, save for France wherethe highest total covariation is observed. There a significant 64.1per cent obtains (as compared with 81.9 per cent covariation ofFrench short-term rates and reference cycles). The British figureof 57.0 per cent may also be mentioned; it compares with 82.4for the short-term rates. As a whole, the result is much worse thanwhat was observed in Chapter III.
Relative to their respective reference cycles, the long-term seriesappear to be lagging, which means that business is turning up beforethe long-term rates rise. This would be in general conformity withexpectations on the basis of the monetary and monetary over-investment theories. The United States rate did lag, although afterWorld War I this became less evident. For France we have verylong lags, and for Germany they were also conspicuous. Theselags contribute to the poor correspondence shown in the phasecorrespondence percentages; if the lags were allowed for, thecorrespondence would be higher.
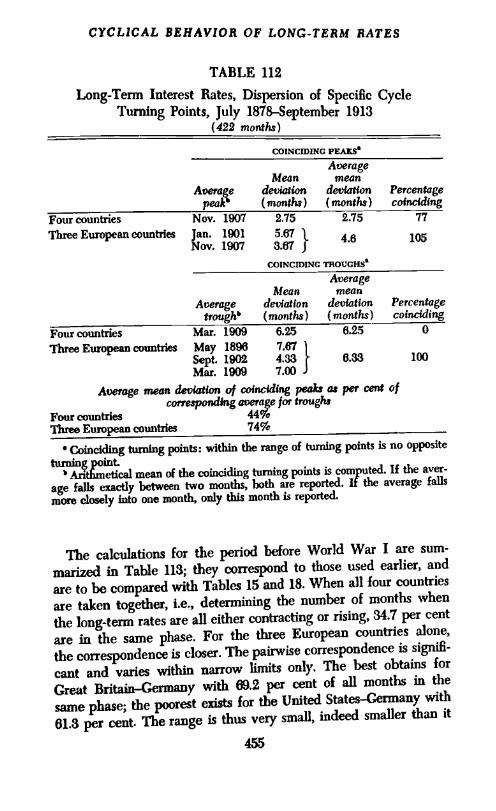
Further information will be obtained from Table 112 showingthe concentration and dispersion of peaks and troughs.
(10) Whatever the covariation of cycles of long-term rates withtheir own reference cycles, more immediately relevant for ourpurposes is to discover their interrelation. It is possible that, whilethe correspondence with reference cycles is often had, they maybe in better harmony with each other. They would thus showthat an international rhythm prevails, somewhat separated fromthe national one.
CYCLiCAL BEHAVIOR OF LONG-TERM RATES
TABLE 112
Long-Term Interest Rates, Dispersion of Specific CycleTurning Points, July 1878September 1913
(422 months)
COINCIDING PEAX?
AverageMean mean
Average deviation deviation Percentagepeak (months) (months) coinciding
Four countries Nov. 1907 2.75 2.75 77
Three EuropeancountTles Jan. 1901 5.67 46 105Nov. 1907 3.67 f
COINCIDING TBOiJCHS
AverageMean mean
Average deviation deviation Percentagetroughb (months) (months) coinciding
Four countries Mar. 1909 6.2.5 6.25 0
Three European countries May 1896 7.61 1
Sept. 1902 4.33 6.33 100Mar. 1909 7.00 J
Average mean deviation of coinciding peaks as per cent ofcorresponding average for troughs
Four countriesThree European countries 74%
Coinciding turning points: within the range of turning points is no opposite
turning . mint.b Axi ii etical mean of the coinciding turning points is computed. If the aver-
age falls exactly between two months, both are reported. If the average fallsmore closely into one month, only this month is reported.
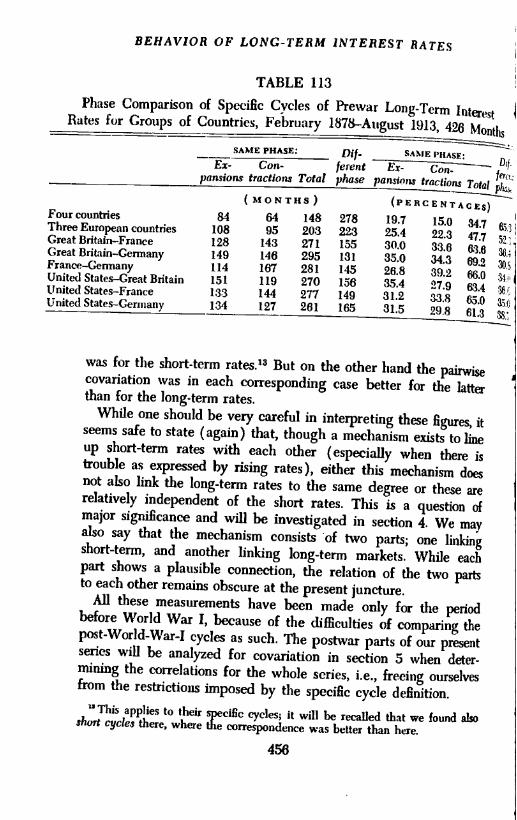
The calculations for the period before World War I are sum-marized in Table 113; they correspond to those used earlier, and
are to be compared with Tables 15 and 18. When all four countries
are taken together, i.e., determining the number of months when
the long-term rates are all either contracting or rising, 34.7 per cent
are in the same phase. For the three European countries alone,
the correspondence is closer. The pairwise correspondence is signifi-
cant and varies within narrow limits only. The best obtains for
Great BritainGermanY with 69.2 per cent of all months in the
same phase; the poorest exists for the United StatesGermany with
61.3 per cent. The range is thus very small, indeed smaller than it
455
BEHAVIOR OF LONG-TERM INTEREST RATES
TABLE 113
Phase Comparison of Specific Cycles of Prewar Long-Term IliterestRates for Croups of Countries, February l878August 1913, 426
Montlu
SAME PHASE: Dif- SAME IHAS5:Ex- Con- ferent ---------____ Dj.
pansions fractions Total phase panrwns Iractions TotalMONTHS) (PERCENTACE
was for the short-term rates.'3 But on the other hand the pairwisecovariation was in each corresponding case better for the latterthan for the long-term rates.
While one should be very careful in interpreting these figures, itseems safe to state (again) that, though a mechanism exists to lineup short-term rates with each other (especially when there istrouble as expressed by rising rates), either this mechauisn doesnot also link the long-term rates to the same degree or these arerelatively independent of the short rates. This is a question ofmajor significance and will be investigated in section 4. We mayalso say that the mechanism consists of two parts; one linkingshort-term, and another linking long-term markets. While eachpart shows a plausible connection, the relation of the two partsto each other remains obscure at the present juncture.
All these measurements have been made only for the periodbefore World War I, because of the difficulties of comparing thepost-World-WarI cycles as such. The postwar parts of our presentseries will be analyzed for covariation in section 5 when deter-mining the correlations for the whole series, i.e., freeing ourselvesfrom the restrictions imposed by the specific cycle definition.
This applies to their specific cycles; it will be recalled that we found alsoshort cycles there, where the correspondence was better than here.
456
j
LONG-TERM RATE DIFFERENTIALS
Section 4. Long-Term interest Rate Differentials
The formation of short-term differentials in Chapter IV wasjustified by assuming the classical mechanism, the working ofwhich was later scrutinized in studying the series in conjunctionwith the exchange rates. The long-term differentials have a lessimmediate and direct foundation. Yet the practical operator ininternational finance has always compared long-term rates of hisown country with those of other countries. When deciding uponthe employment of funds, even when holding short-term capital,the investor not only had in mind the domestic and foreign shortrates, but also the long rates. Long-term foreign investment throughdirect participation, or purchase of foreign bonds, government andprivate, were all obvious possibilities, and indeed common prac-tice, before 1914. After World War I new elements entered thepicture, but large-scale lending operations went on. However irn-perfect the investors' information may have been, they comparedmany interest rates (and thus differentials).
In the following we simply discuss the statistics and leave inter-pretation to a minimum. Charts 51 to 62 show the six series for
prewar and post-World-War-I on which the specific cycles axemarked off. The order in which the differences were formed isparallel to those of the short-term rates (cf Charts 18 to 23) andwe refer to the discussion on pages 125 If. This will make it possibleto compare the two corresponding differentials direcily with eachother'4 regarding cycles and absolute amounts. In respect to thelatter, caution must be exercised, since the difficulties discussed in
section 1 apply of finding long-term ratesespecially over extendedperiodsthat can really be taken as indicating the absolute levelof long-term rates. If it is difficult to form an accurate idea aboutthe rate structure within a country for any length of time, it isfar more difficult to show what "international structure" exists.
The long-term differentials will be investigated in a number
of steps: the static properties as shown by: their frequency dis-
tributions; their cyclical characteristics; and the determination of
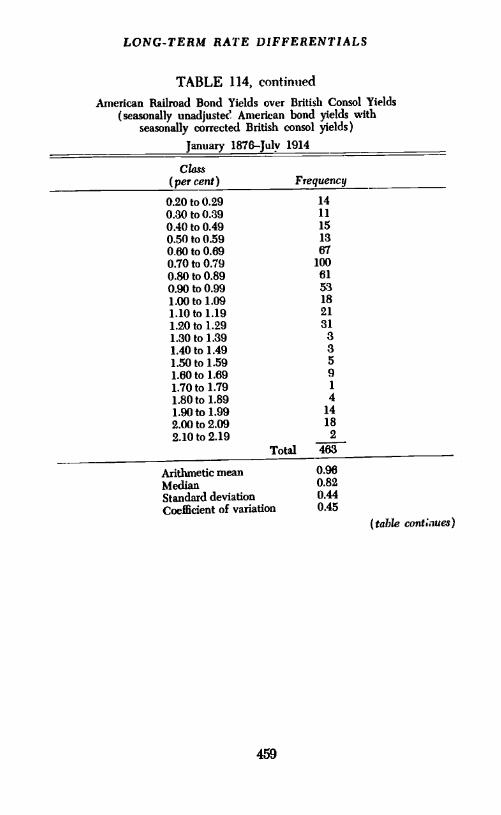
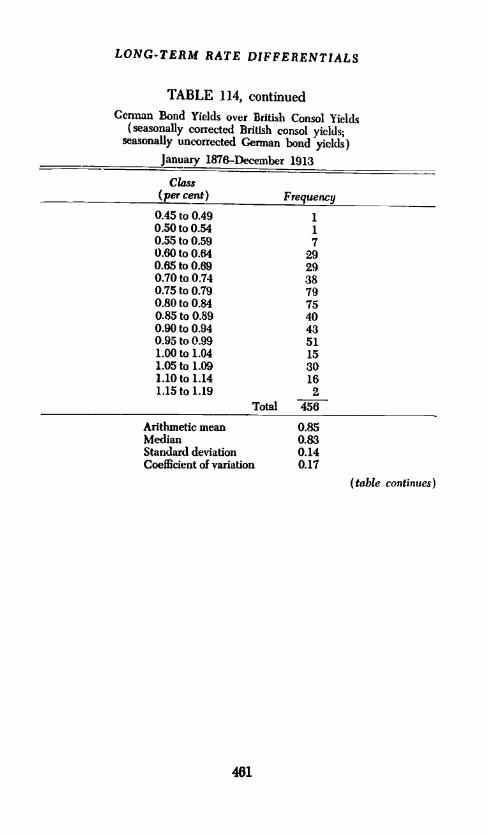
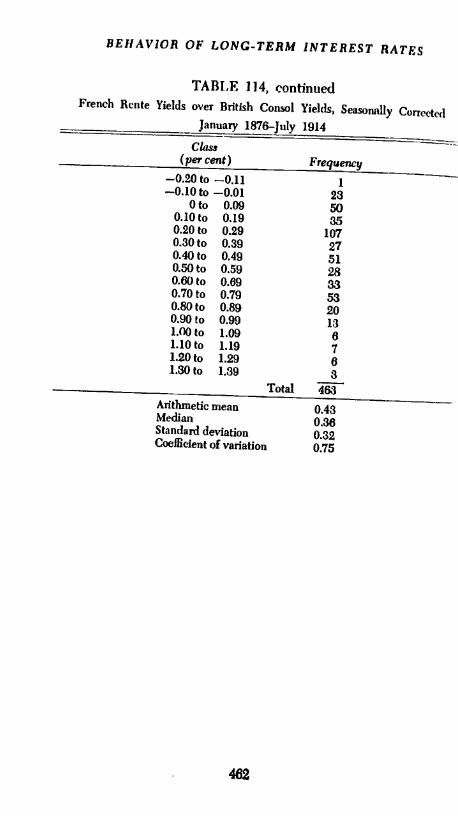
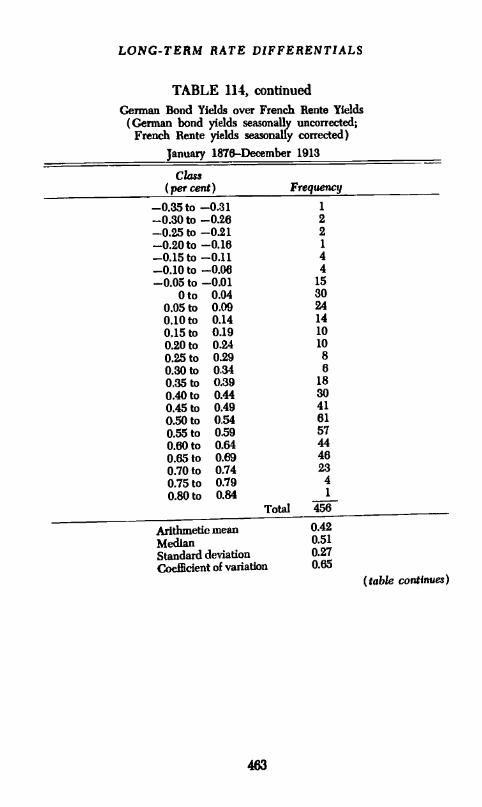
their maximal and minimal differences.The frequency distributions are shown in Table 114 and are
arranged like those of the short-term series. They require thus
Similarly they can be compared with the differentials of official discount
rates of Chapter VIII, section 7.
451
BEHAVIOR OF LONG-TERM INTEREST RATES
TABLE 114
Frequency Distribution of Long-Term Rate Differentialsfor Six Countries
American Railroad Bond Yields over German Bond Yields, Seasonally Corrected
January 1876-July 1914
458
I
A
Class(per cent) Frequency
-0.60 to -0.51 11-0.50 to -0.41 18-0.40 to -0.31 10-0.30 to -0.21 10-0.20 to -0.11 20-0.10 to -0.01 114
Oto 0.09 1150.10 to 0.19 470.20 to 0.29 410.30 to 0.39 150.40 to 0.49 60.50 to 0.59 100.6Oto 0.69 50.70 to 0.79 20.80 to 0.89 80.90 to 0.99 291.00 to 1.09 2
Total 463
Arithmetic mean 0.11Median 0.04Standard deviation 0.33Coefficient of variation 0.3
LONG-TERM RATE DIFFERENTiALS
TABLE 114, continuedAmerican Railroad Bond Yields over British Consol Yields
(seasonally unadjuste? American bond yields withseasonally corrected British consol yields)
January 1876-July 1914
459
(table contiiuea)
Class(per cent) Frequency
0.20 to 0.29 140.30 to 0.38 11
0.40 to 0.49 150.50 to 0.59 13060 to 0.69 670.7OtoO.79 1000.80 to 0.89 610.90 to 0.99 531.00to 1.09 181.10 to 1.19 211.20 to 1.29 311.3Oto 1.39 31.40 to 1.49 31.5Otol.59 51.6Oto 1.69 91.7Oto 1.79 1
1.80 to 1.89 41.9Oto 1.99 142.00 to 2.09 18
2.10 to 2.19 2
Total 463
Arithmetic mean 0.96Median 0.82Standard deviation 0.44Coefficient of variation 0.45
BEHAVIOR OF LONG-TERM INTEREST RATES
TABLE 114, continuedAmerican Railroad Bond Yields over French Rente Yields
Oto 0.04 180.05 to 0.09 140.10 to 0.14 14O.I5to 0.19 160.20 to 0.24 320.25 to 0.29 140.30 to 0.34 130.35 to 0.39 180.40 to 0.44 380.45 to 0.49 380.50 to 0.54 260.55 to 0.59 420.60 to 0.64 400.65 to 0.69 300.70 to 0.74 32O.75to 0.790.80 to 0.84
165
0.85 to 0.89 50.90 to 0.94 9O.95to 0.99 81.00 to 1.04l.OSto 1.09
1271.10 to 1.14 91.15 to 1.19 3
Total
Arithmetic meanMedianStandard deviationCoefllcjent of variation
0.510.520.290.56
LONC-TERM RATE DIFFERENTIALS
TABLE 114, continued
Ceman Bond Yields over British Consol Yields(seasonally corrected British consol yields;
seasonally uncorrected German bond yields)
January 1876December 1913
Class(pei- cent) Frequency
0.45 to 0.49 10.SOto 0.54 10.55 to 0.59 70.60 to 0.54 290.65 to 0.69 290.70 to 0.74 380.75 to 0.79 790.80 to 0.84 750.85 to 0.89 400.90 to 0.94 430.95 to 0.99 511.00to 1.04 151.O5to 1.09 301.lOtol.14 161.lStol.19 2
Total 456
Arithmetic mean 0.85Median 0.83Standard deviation 0.14Coefficient of variation 0.17
(table continues)
461
S
BEhAViOR OF LONG-TERM iNTEREST RATES
TABLE 114, continuedFrench Rente Yields over British Consol Yields, Seasonally Corre(,tl
January 1876-July_1914
Total IWArithmetic mean 0.43Median 0.38Standard deviation 0.32Coefficient of variation 0.75
482
Class(per cent) Frequency
-0.20 to -0.11 1-0.10 to -0.01 23
Oto 0.09 500.lOto 0.19 350.20 to 0.29 1070.30 to 0.39 270.40 to 0.49 510.50 to 0.59 280.60 to 0.69 330.70 to 0.79 530.80 to 0.89 200.90 to 0.99 13l.00to 1.09 61.10 to 1.19 71.20 to 1.29 81.30 to 1.39 3
LONG-TERM RATE DIFFERENTIALS
TABLE 114, continuedGerman Bond Yields over French Rente Yields
(German bond yields seasonally uncorrected;French Rente yields seasonally corrected)
January 1816-December 1913
(table continues)
Class(percent) Frequency
-0.35 to -0.31 1
-0.30 to -0.26 2-0.25 to -0.21 2-0.20 to -0.16 1
-0.15 to -0.11 4-0.10 to -0.06 4-0.05 to -0.01 15
Oto 0.04 300.05 to 0.09 240.10 to 0.14 140.15 to 0.19 100.20 to 0.24 100.25 to 0.29 80.30 to 0.34 60.35 to 0.39 180.40 to 0.44 300.45 to 0.49 410.50 to 0.54 610.55 to 0.59 570.60 to 0.64 440.65 to 0.69 460.70 to 0.74 230.75 to 0.19 4
0.8Oto 0.84Total 458
Arithmetic mean 0.42
Median 0.51
Standard deviation 0.27Coefficient of variation 0.65
463
I
BEHAVIOR OF LONG-TERM INTERESTRATES
TABLE 114, continuedAmerican Railroad Bond Yields over British Consol YjeI(Js
(seasonally unadjusted American bond yields withseasonally corrected British Consol yields)
January l925I)ecenibcr 1938
464
Clasr(pot cent) Frequency
0.60 to 0.41 100.40 to 0.21 320.20 to 0.01 35
Oto 0.19 170.20 to 0.39 260.40 to 0.59 140.60 to 0.79 160.80 to 0.99 101.00to 1.19 61.20 to 1.39 2
Total 168
Arithmetic mean 0.16 IMedian 0.08Standard deviation 0.47Coefficient of variation 2.94
LONG-TERM RATE DIFFERENTIALS
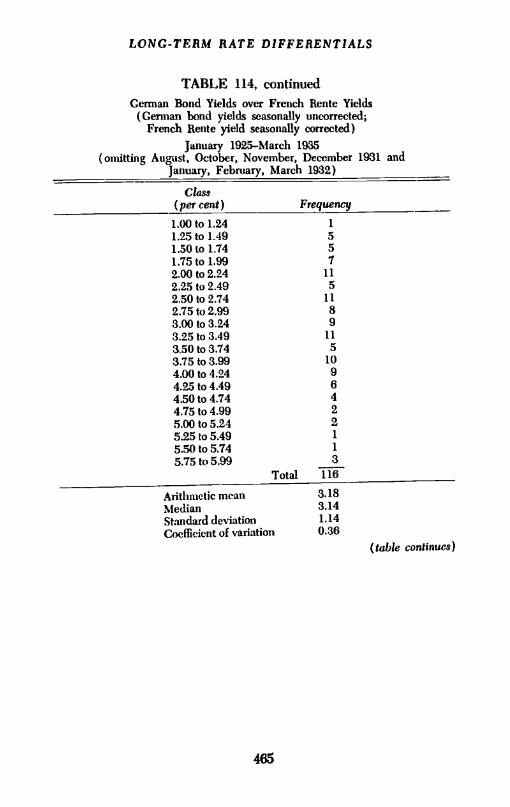
TABLE 114, continuedCerman Bond Yields over French Rente Yields
(Cerman bond yields seasonally uncorrected;French Rente yield seasonally corrected)
January 1925-March 1935(omitting August, October, November, December 1931 and
January, February, March 1932)
465
(table continues)
Cbzss(per cent) Frequency
1.00to 1.24 1
1.2Sto 1.49 5L5Oto 1.74 51.75to 1.992.00 to 2.24 112.25 to 2.49 52.50 to 2.74 112.75 to 2.99 83.00 to 3.24 93.25 to 3.49 113.50 to 3.74 53.75 to 3.99 104.00 to 4.24 9425 to 4.49 64.50 to 4.74 44.75 to 4.99 25.00 to 5.24 25.25 to 5.49 1
5.50 to 5.74 1
5.75 to 5.99 3Total 116
Arithmetic mean 3.18Median 3.14Standard deviation 1.14Coefficient of variation 0.36
S
BEHAVIOR OF LONG-TERM INTERESTRATES
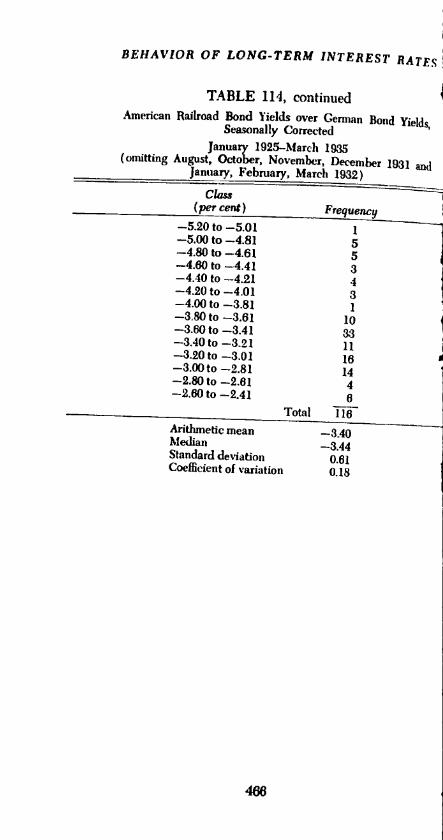
TABLE 114, continuedAmerican Railroad Bond Yields over Cennan Bond Yields
Seasonally CorrectedJanuary 1925-March 1935
(omitting August, October, November, December 1931 andJanuary, February, March 1932)
Class(per cent)
466
Frequency-5.20 to -5.01 1-5.00 to -4.81 5-4.80 to -4.61 5-4.60 to -4.41 3-4.40 to -4.21 4-4.20 to -4.0! 3-4.00 to -3.81 1-3.80 to -3.61 10-3.60 to -3.41 33-3.40 to -3.21 11-3.20 to -3.01 18-3.00 to -2.81 14-2.80 to -2.61 4-2.80 to -2.41 6
Total 116
Arithmetic mean -8.40Median -3.44Standard deviation 0.61Coefficient of variation 0.18
LONG-TERM RATE DIFFERENTIALS
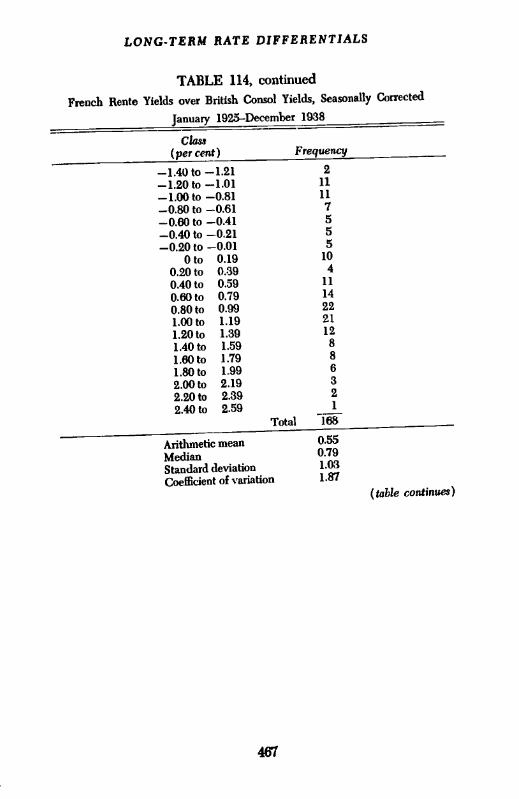
TABLE 114, continuedFrench Rente Yields over British Consol Yields, Seasonally Corrected
January 1925-December 1938
461
-1.4Oto -1.21 2-1.20 to -1.01 11
-1.00 to -0.81 11-0.80 to -0.61 7-0.60 to -0.41 5-0.40 to -0.21 5-0.20 to -0.01 5
Oto 0.19 10
0.20 to 0.39 40.40 to 0.59 11
0.60 to 0.79 14
0.80 to 0.99 22
1.00 to 1.19 21
1.20 to 1.89 12
1.4Oto 1.59 8
1.6Oto 1.79 8
1.8Oto 1.99 6
2.00to 2.19 3
2.20 to 2.39 22.40 to 2.59 1
Total 168
Arithmetic mean 0.55
Median 0.79Standard deviation 1.03Coefficient of variation 1.81
(table continues)
Class(per cent) Frequency
BEhAVIOR 01" L0.\'G-'1'ER1 INTEREST BA
1'l3l E 11-1, COflt!1itI('dA nI(,rjcan Ha ilroad 11(11 d uie'1(I; Ov(r lrenul I llt'u I ' i li!Fwnc'l i lIen te yields seasonal lv ('otr((t e( I; A meric.i ii rai In 0(1
bond yields seasoiatllv itneorueeted
jaioiii-y l)2S-I)('(('t1l!,('r 1933
(per cent')
-2.55 to -2.11 2-2.-It) to -2.20 0--2.25 to -2.11 I
-2.10 to --1.90 3-1.95 to --1.81 5--1.81) to - TOO 3-1.65 to -1.51 3-1.50t -1.36 2-1:35 t -1.21 3-1.2)) II) -1.06 10-1.05 to -0.91 7---0.9(1 to -0.7(3 It)-0.7.i to -0(11 9
0,60 to -0-1(3 10-0.-IS to -0.31 21-0.30 to -0.16 12-0.15 to -0.01 7
0t 0.1.1 40.15 to 0.29 (1
0.30 to 0.44 3O.45to 0.590.60 to 0.74 120.75 to 0.69 130.90 to 1.04 111.OSto 1.19 1
Total 103
Arithmetic medil -0.37Median --t).37Standard de lation 0.88Covl1ickiit of V,triatj(,ij 2.33
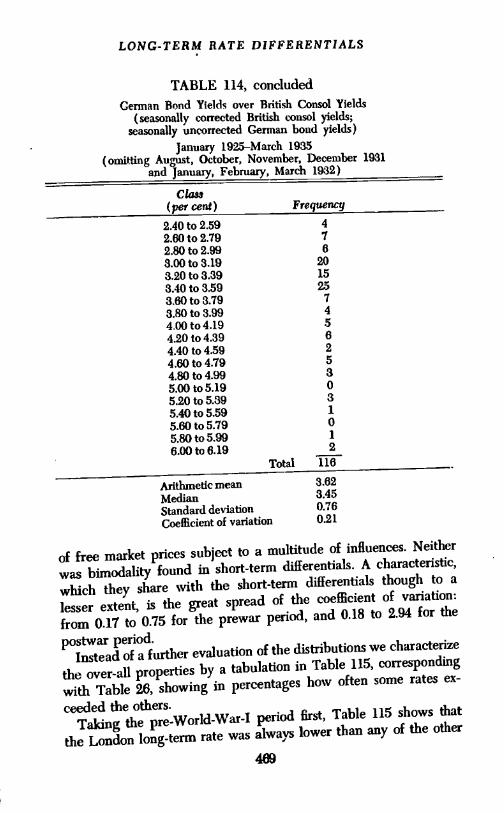
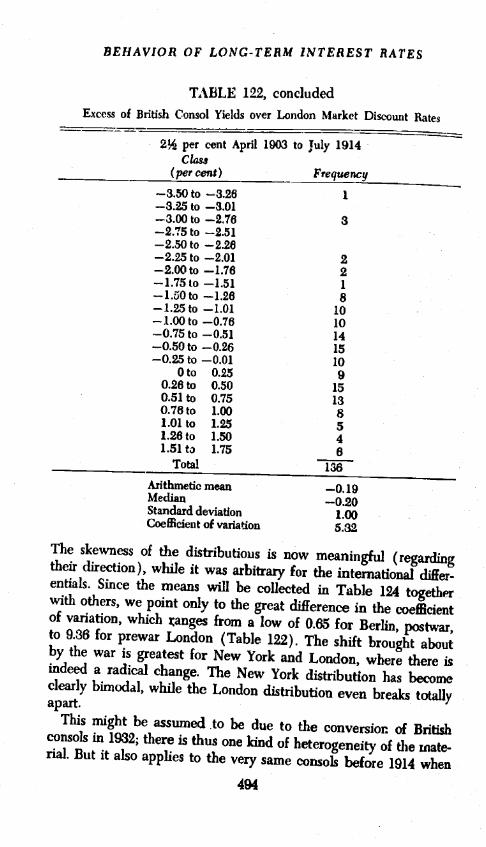
only brief commeiit since we shall discuss their means togetherwith thoSe of others below pg(s -196 Ii. T1i' mark-cd skewnesswhich aI)pears ill SOnIC distributions COtIl(1 of CU1IrS have beeninverted by forming the Opposite (and equivalent) dilTerctT.More iniportant seems to he the appearaiwe of l)imodality in Sonic,especially in the Germflan.jr(Iictl pre-\\'orld_\Varj differential, andthe American_.FrcimcJi and Frencli_nrjtjsli postwar differential, Thisbehavior cannot be explained on grotitids Of pOliCV (as in the caseof the ofcial disco11t rates), since we are dealing with differences
468
Irequeni-t,
LONG-TERM RATE DIFFERENTIALS
TABLE 114, concludedGerman Bond Yields over British Consol Yields
(seasonally corrected British consol yields;seasonally uncorrected German bond yields)
January 1925-March 1935(omitting August, October, November, December 1931
and Januaiy, February, March 1932)
of free market prices subject to a multitude of influences. Neither
was bimodality found in short-term differentials. A characteristic,
which they share with the short-term differentials though to a
lesser extent, is the great spread of the coefficient of variation:
from 0.17 to 0.75 for the prewar period, and 0.18 to 2.94 for the
postwar period.Instead of a further evaluation of the distributions we characterize
the over-all properties by a tabulation in Table 115, corresponding
with Table 26, showing in percentages how often some rates ex-
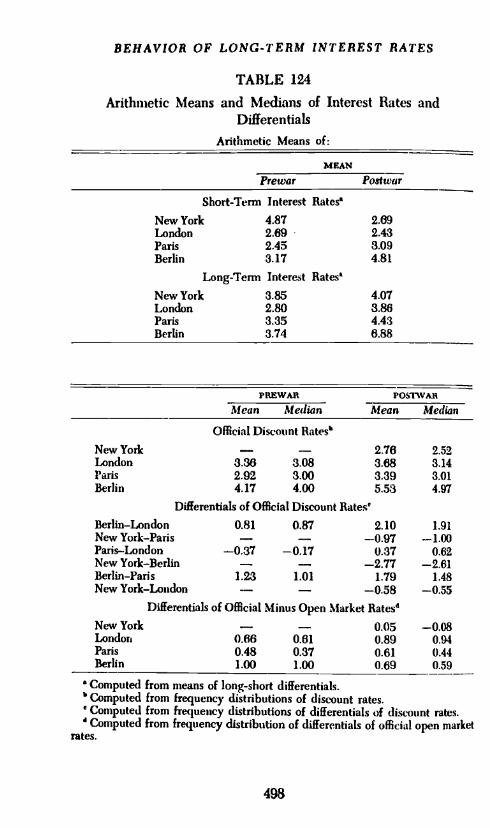
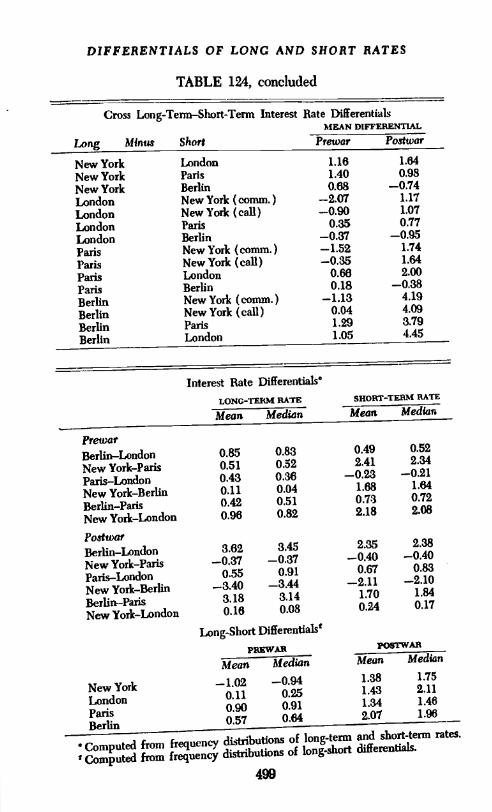
ceeded the others.Taking the preWor1d-WaTI period first, Table 115 shows that
the London long-term rate was always lower than any of the other
489
Class(per cent) Frequency
2.40 to 2.59 42.60 to 2.79 72.80 to 2.99 83.00 to 3.19 203.20 to 3.39 153.40 to 3.59 253.60 to 3.79 73.80 to 3.99 44.00 to4.l9 54.20 to 4.39 64.40 to 4.59 24.60 to 4.79 54.80 to 4.99 35.00 to5.19 05.20 to 5.39 35.40 to 5.59 1
5.60 to 5.79 05.80 to 5.99 1
8.00 to 8.19 2Total 116
Arithmetic mean 3.62
Median 3.45Standard deviation 0.76Coefficient of variation 0.21
13E!JAVIOR OF LONG-TER?tf LVTI:RJ.;g" fl i'x:s
TARLE 115
Long-Term Interest Hate I )ilfereutia Is )('tWcetl Pairs ofCountries Expressed as Percentage of the lotal l'eriod
New \ork or Berlin rate is tiiicoi-rt'ctcd for seasonal varialjoiiJanuary 1876 to July 1914, except iii case of Berlin versus I ouloii and Berlinversus Paris where the 1)criocl is January 1876 to December 1913.January 1925 to I)cceiiiber 1938, except in Berlin versus London, Nvw Yorkersus Berlin, and Berlin versus I'aris where the 1)eriod is January 1925 to March19:35, except for August 1931 and October 1931 to March 19:32 inclusive, forwhich the data are lacking.
three; for the short-term rates, that role, which London could notmaintain in the Postwar years, fell to Paris. Indeed the division inthe mutual relation of London and Paris before 1914 is most in-teresting: (lie picture is fliUc/i more (Ic/mite for f/ic ion g-ferin titanfor i/ic s/mart-term rates. The greater role of London as the pmecapital market expresses itself in these figures again; Paris wasalways liquid in the short run, CXIIil)iting apparently what Wouldnow be called a high liquidity preference. The widest difference,practically 100 per cent, exists both for short-term and long-termrates between New York and Paris; the former of course beingthe higher of the two. After World War I the Cerrmian long-termrate was always higher than those of the other countries; this ishardly surprising. But the fact that such permanent differences aremaintained for hundreds of months is, indeed, remarkable; theinteraction of all these highly
organized money and capital marketsand the vast flows of funds back and forth was not strong enoughto overcome fundamental instjtutjomuil and risk differcflces.15
These indications are Supplemented by the subsequent measure-ments of the maximal differences of long-term rates and theircomparison with those of the short-term rates. Furthermore Tables
In the above the assumption is necessarily made that the absolute levelsof long-term rates of various countries can be compared with confidence, andthat the accuracy of the data warrants the formation of these measures.
470
Prewar" Postivt,rLondon higher than Paris 5.2 27.1Berlin higher than Paris 93.6 100.!)New York higher thrin Paris 98.7 32.7New York higher thaii Berlin 60.5 0 0New lork higher than London I t!0.() 5l .2Berlin hielier than London I 00.!) 1009
LONG-TERM RATE DiFFERENTIALS
118 to 122 give a comprehensive survey of the relative position ofall rates.
(13) Cyclical characteristics. The first question is: should oneexpect cycles, and what should be their properties? Theory givesus no guidance, except perhaps by implication. It was not toodifficult to make a case for the short-term differentials, arid indeedin addition to fairly-well-defined specific cycles, "short cycles" ap-peared also. These were rediscovered in the exchange rates, makingthe existence of a link between them plausible. What mechanismscan be thought of as either producing or regulating cycles amongthe long-term differentials?
If cycles appear, they must be due to lags, differences in ampli-
tudes of cycles of constituent series, and the various combinations
of these factors, but it is difficult now to indicate what forces wouldproduce such regularities. At any rate a profound understandingof the interaction of long-term foreign investment would be re-
quired in order to comprehend the behavior of our series, i.e., itwould be necessary to have information about the amount ofdifferences in long-term rates that induces an investor to jumpthe hurdle of investing in foreign securities, about the different
pulls exercised by simultaneously prevailing rates at home, andabout the evaluation of the risk element. These things have never
been explored systematically, and we shall have to approach the
cycles in a simple, descriptive manner only.
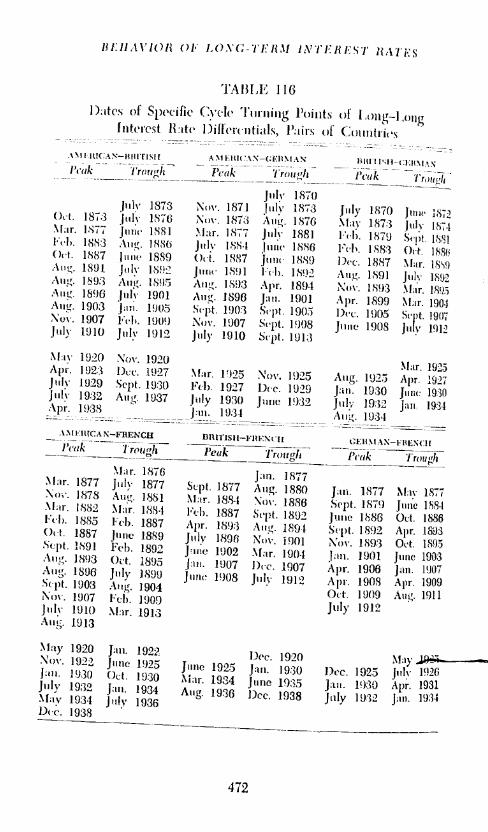
It is seen from Charts 57 to 62 that there axe indeed strong cycles.
The specific cycles are based on the usual criteria, and their dates
are given in Table 116. Just as in the underlying series of the
long-term rates, wide swings appear to exist in addition. Several
specific cycles are of uncertain character, though they fall within
the definition. Some series have very pronounced cycles even before
1914. This is especially noteworthy for the Paris-London differ-
ential, formed for the two most highly developed capital and money
markets of the time. This would seem to indicate that cycles axe
at least not incompatible with a high development. A strong
rhythm is also found for the New York-London series after World
War I, when these two capital markets would have to be con-
sidered as the most active and advanced. The international crises of
1893, 1896, 1901, 1907, and others stand out clearly. After World
War 1 main turns occur in 1920, 1925, 1929, and especially in 1931,
a turn which is often swallowed up in other economic series.
In all cases before 1914 there is a narrowing of fluctuations over
SuI)t, l3fl0t.Mar. I8't9Jul'. 1892Mar. 1895Mar. 1904Si' It. 1907Ju 1912
LONG-TERM RATE DIFFERENTIALS
TABLE 117
Number and Duration of Specific Cycles of Long-Long Interest RateDifferentials for Six Pairs of Countries
AVERAGEPER CENTb
DURATION
AVERAGE DURATION 0?: OF SPECIFICNUMBEROF: (months) CYCLES
Durations of only complete cycles, expansions, and contractions are included in their respec-tive columns.
The percentages are calculated from a base equal to the average duration of expansions pluscontractions. This sum is equal to the average duration of cycles only when the number of cyclesis the same as the number of expansions and contractions.
'Only complete cycles are counted; parts of cycles at both ends of a series are dropped. Cycles
axe measured horn trough to trough. Similarly only complete expansions and contractions arecounted in their respective columns.
time. The differences between the long-term rates became stabilizedaround lower means. The most noteworthy role in that respect is
played by the series involving New York. (This evening out will
become still more evident in Charts 63 and 64 above, where we turn
to the absolute maxima of differentials.) After World War I allsix series, without exception, assume fluctuations of vastly greaterdimensions than they had before, thus again confirming observa-
tions made repeatedly about the profound changes that characterize
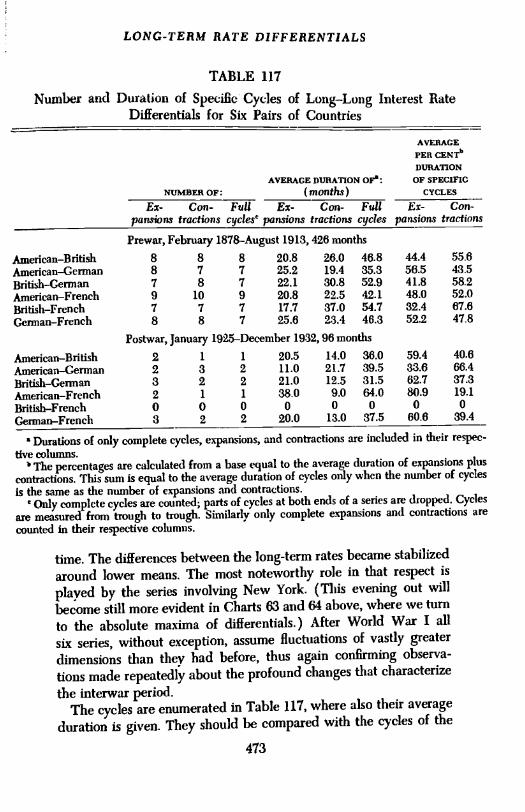
the interwar period.The cycles axe enumerated in Table 117, where also their average
duration is given. They should be compared with the cycles of the
473
Ex- Con- Full Ex- Con- Full Er- Con-pansions fractions cycles' pansions tractions cycles pan.sions tractions
underlying series, shown above in Table 110. The postwar dataare added, but are of small value, because in only two Cases
couldas many as three cycles be distinguished, and in three cases therewere only two cycles. There are nine and eight cycles before
1914for the AmericanFrench and AmericanBritish series and sevenfor each of the remaining pairs. Consequently their average dura-tions differ far less from each other than those of the cycles of thelong-term rates.
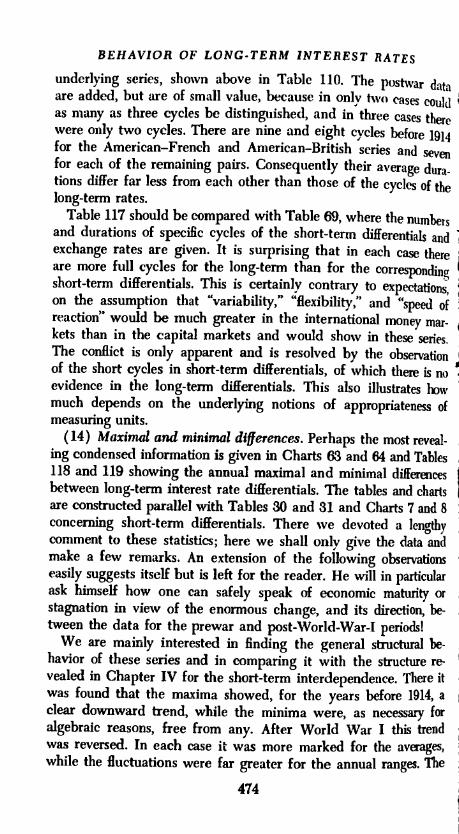
Table 117 should be compared with Table 69, where the numbersand durations of specific cycles of the short-term differentiab andexchange rates are given. It is Surprising that in each case thereare more full cycles for the long-term than for the correspondingshort-term differentials. This is certainly contrary to expectationon the assumption that "variability," "flexibility," and "speed ofreaction" would be much greater in the international money mar-kets than in the capital markets and would show in these series.The conflict is only apparent and is resolved by the observationof the short cycles in short-term differentials, of which there is noevidence in the long-term differentials. This also illustrates howmuch depends on the underlying notions of appropriateness ofmeasuring units.
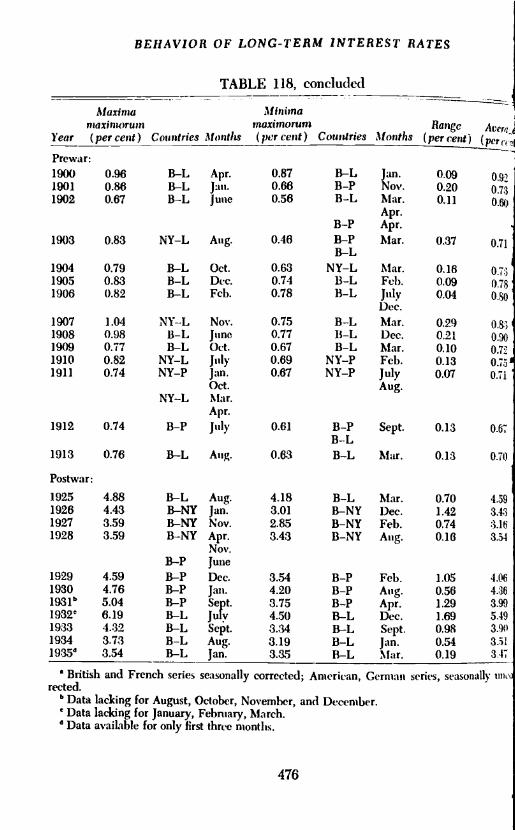
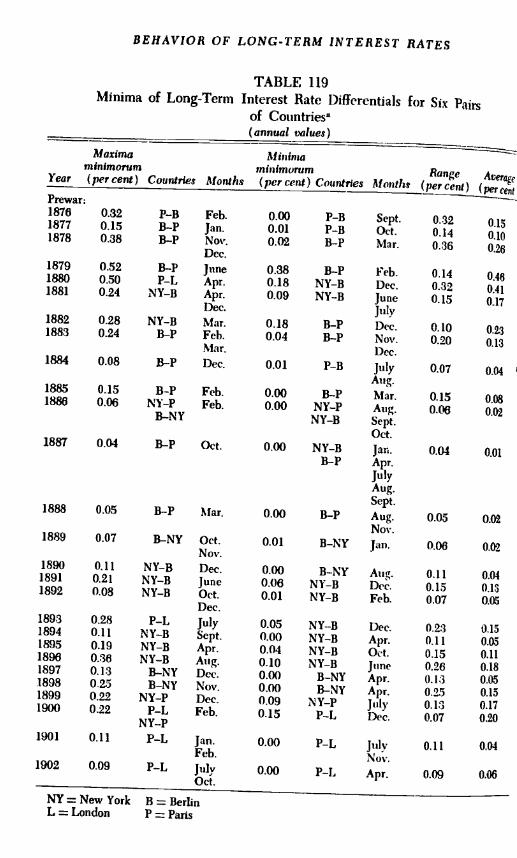
(14) Maximd and minimal differences. Perhaps the most reveal-ing condensed information is given in Charts 63 and 64 and Tables118 and 119 showing the annual maximal and minimal differencesbetween long-term interest rate differentials. The tables and chartsare constructed parallel with Tables 30 and 31 and Charts 7 and 8concerning short-term differentials. There we devoted a lengthycomment to these statistics; here we shall only give the data andmake a few remarks. An extension of the following observationseasily suggests itself but is left for the reader. He will in particularask himself how one can safely speak of economic maturity orstagnation in view of the enormous change, and its direction, be-tween the data for the prewar and post-World-War-I periods!
We are mainly interested in finding the general structural be-havior of these series and in comparing it with the structure re-vealed in Chapter IV for the short-term interdependence. There itwas found that the maxima showed, for the years before 1914, aclear downward trend, while the minima were, as necessary foralgebraic reasons, free from any. After World War I this trendwas reversed. In each case it was more marked for the averages,while the fluctuations were far greater for the annual ranges. The
474
I
Maximatnaximoruni
Year (percent)
Prewar:1816 2.05
187118781879
188018811882
1883188418851886
1887 0.93
1888 0.83
2.142.021.80
1.581.221.27
1.301.24Lii0.79
1898 0.97
1899 1.00
TABLE 118Absolute Maxima of Long-Term Interest Rate Differentials for Six
individual crises show clearly in both sets, although the yearlygraphs cannot provide full detail.
The corresponding construction for the long-term differentialsshows a similar development. The averages, too, exhibit a tendencytoward stability at a level of about 0.75 per cent for the absolutemaximum difference. The minimal difference is virtually zero forthe last ten years before 1914. This was preceded by a period ofsharp decline for the absolute maximum up to 1888; afterwardminor ups and downs occur, holding it below 1 per cent except for
1893 and 1896, when very slight digressions occurred. Up to 1896
the absolute maximum is almost always due to New YorkLondon,while for the short-term rates it was New YorkParis. After thatyear the relation begins to shift around, involving other capitalmarkets too. The minima are from the outset of a more varying
nature.The extraordinary stability of all values at low levels from 1886
on for twenty-seven years is indeed a striking phenomenon that
should be seen in its true significance. It is notable when compared
with the development of these series after World War I andwith the simultaneous behavior of the corresponding data for the
short-term interest rates.'° There the gradual narrowing of the
gap between the maxima and minima was taken to express an in-
creasing improvement of the organization and interaction of inter-
national money markets. It was also viewed as indicating an in-
crease in flows of short-term funds. But it is the persistent differ-
ence in absolute amounts that deserves most attention: beforeWorld War I the absolute maximum of the short-term differentials
is always higher than that of the long-term. The smallest difference
between the two types of differentials is about 0.5 per cent. As
a rule the difference is many times as large, especially in critical
times. Similar differences prevail for the other two series. For the
postWorld-War-I period (Chart 63) the long-term interest differ-
entials are considerably higher than those before 1914, and even
exceed the short-term interest rate differentials.
(15) Chart 64, showing the annual ranges, need only be briefly
referred to. It gives a picture compatible with that of the averages,
but different from that of the short-term rates, where again a (weak)
downward trend appeared. Furthermore the postwar situation,
while it differs from that of the ten years preceding World War I,
11The great difference in scale of the graphs relating to short-term and long-
term differentials must be observed.
477
I
at.
NY = New York B = BerlinL = London P = Paris
- BEHAVIOR OF LONG-TERM INTEREST RATES
TABLE 119Minima of Long-Term Interest Rate Differentials for Six Pairs
of Countries(annual values)
Maxima Minlnwminimorum minlmurum RangeYear (per cent) Countries Months (per cent) Countries Months (per cent)
Phase Cornpai-ison, Prewar, I anig-I a mg I11(l Sliort-Sl,ort l)iIl erentials
I)eeer,ilnr IS7S-April 1910. :37(1 titiutlis
s.\ii:i'tise: Dif- S.'\tt l'II\S[: J)ifLi'- (i in- Jerent Fx- (:-
- fvre,tPairs of con n(ru's pa:tsuiIis trart:i ins /ila! phase
1(rai(ui;i i it a! /Iao
I'eiccit:i-s fir (sp:it1i(iti eotttt'actiii, do not hl to total l)ec:klt&' 1)1 rounding.
has let'ii ol )serve(l l)cforel)ack in the restless 1890's. But theranges ol the bug_term inaximlia deviate after World War Ifound!y from aiivthing P'"'°'1Y noted for thcni. Thus the picturegiven I)V the averages is conlirniecl in that respect.
I f'iw much the various eal)ital markets have been pulled apartiS Seen from the increase in [he postwar miiiiiima, both for averagesand ranges; this too (11(1 not happen for the short-term rates. l'oralgebraic reasons the minima for the pi'e' long-term rates arelower thati those for the short-term rates.'
16) SinCe there is an interest in observing the cyclical coctirui-lion of the 1(lng-tcr?n diffcrc'nliu!s with liwse of the short -term rat('s,we give the result in Table 120. In view of the already variouslyflote(l interdependence of the basic rates, it is noteworthy that thet\V() dii leremitials ShOW a puur\e high correlation, except for thecase of Berlin-Paris, where theuc is unIv a 48.1 (T cent covariation.in all ot her cases it is high, especially for New \orkParis with73.9 PCI cent.
it now appears that not only are there cyehluIi'long-diflerentials 1)111 they even correspond well with those of the short-term diflerentials. For the explanation of the latter it was possilleto use the idea of the monetary mechanism; there is no intuitive
If it cOuld 1)0 shown theoretically that a strict imitcrde1)c,,(Idnce of long-tcrniamid short-term rates exists, then the validity of the solidarity priticiple for theshort-tern, rates implies a similar principle for the long-term rates, with analo-gous limits (see the discussion above on 'permissible limits," Chapter VII).
New Yiirk-Riris 15! 121 27t 91 II.!) 3:3,() 7:39' 9
.35.13t85L93&8
30.1
2&1
LONG-TERM RATE DIFFERENTIALS
TABLE 121
Phase Comparison of Specific Cycles of Long-Term Interest RateDifferentials and Foreign Exchange Rates
Prewar
'September 1887 to July 1908, 250 months.With each pair A-B, the differential of A over B is compared with the exchange of B on A.
or other basis for the cycles in the new series. It might be estab-lished by a theory showing not only the systematic connection of
the two rates but also explaining that this connection is so strong
as to yield high cyclical covariation. In that respect we have already
noted that it is very hard to conceive of a theory covering systematic
connection of the two rates, and subsequent demonstration willmake this even more clear. As to the strength of such connection,the noncyclical correlation is so much weaker than the one re-quiring the additional, preliminary measurement of cycles which,
in this investigation, are essentially determined qualitatively that
we do not even exhibit the indifferent results of the sign correlations.
When a covariation between two series, based on qualitatively
determined cycles, is stronger than when the direction of move-
ment is considered month by month, an interesting situation is
given. The cycle definition obliteratesas it ought to doagood deal of information by stressing another particular aspect of
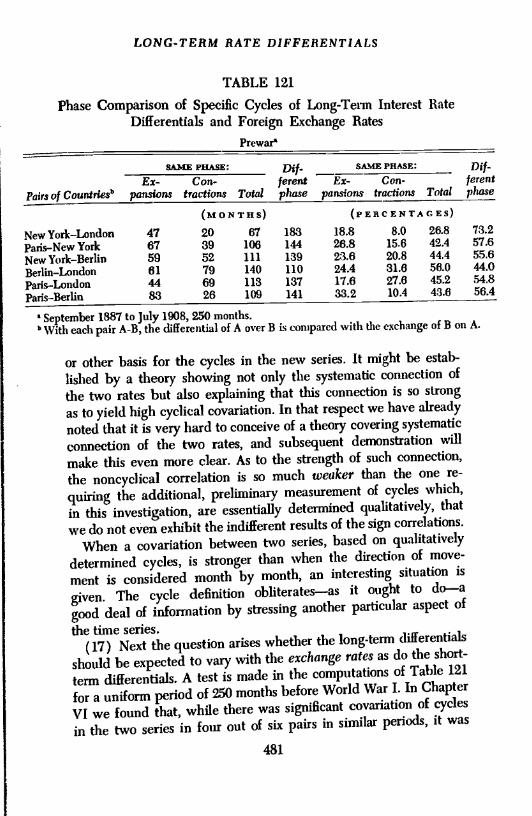
the time series.(17) Next the question arises whether the long-term differentials
should be expected to vary with the exchange rates as do the short-
term differentials. A test is made in the computations of Table 121
for a uniform period of 250 months before World War I. In Chapter
VI we found that, while there was significant covariation of cycles
in the two series in four out of six pairs in similar periods, it was
481
I
Paws of Countrie?
SAME PHASE: Dif-ferentphase
SAME PHASE: Dif-ferentphase
Er-Con-panslons tractions Total
Ex- Con-pensions fractions Total
ON TI! s) ( EEC EN TA C ES)
New YorkLondonparisNew YorkNew YorkBerlinBerlinLondonparisLondonparisBerlin
476759614488
20 6139 10652 11119 14069 11326 109
183144139110137141
18.826.823.624.417.633.2
8.015.620.831.827.810.4
26.842.444.458.045.243.6
73.257.655.644.054.856.4
BEHAVIOR OF LONG-TERM iNTEREST RATES
improved when the notion of short cycles was Introduced. 'flj5could be attributed to the idea of a high speed of reaction
betweenthe two quantities and to the cycle-producing properties of theunderlying mechanism.
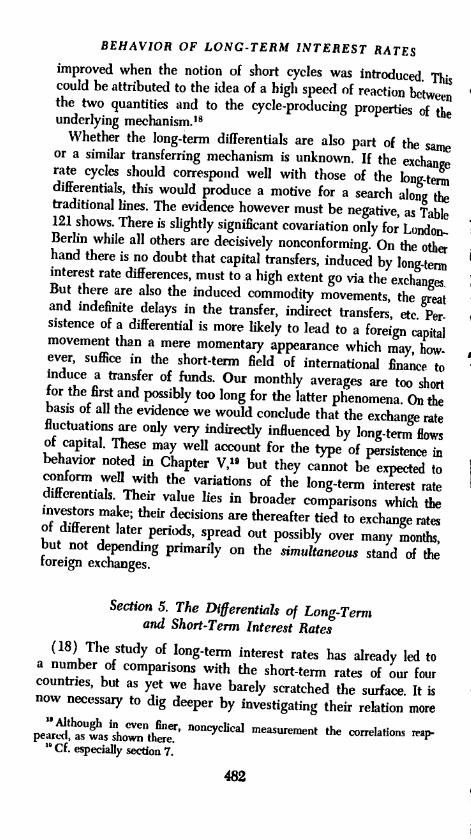
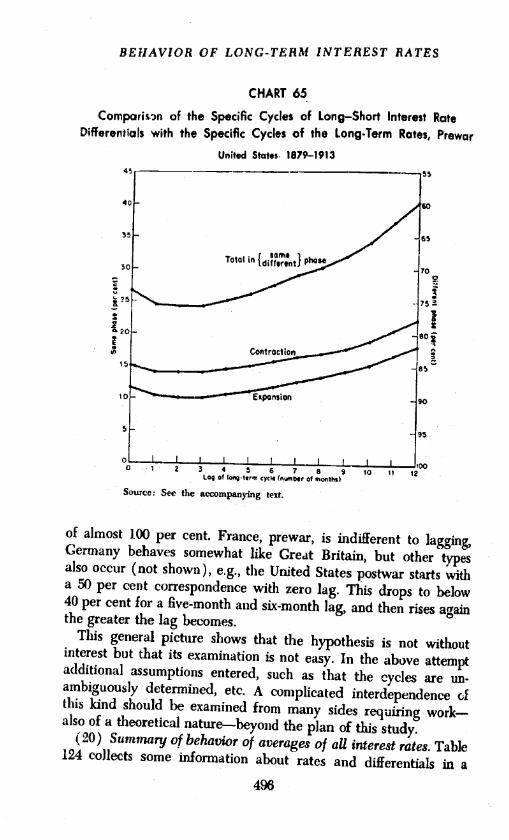
Whether the long-term differentials are also part of the sanleor a similar transferring mechanism is unknown. If the exchangerate cycles should correspond well with those of the longtermdifferentials, this would produce a motive for a search along thetraditional lines. The evidence however must be negative, as Table121 shows. There is slightly significant covariation only for Londo.Berlin while all others are decisively nonconforming. On the otherhand there is no doubt that capital transfers, induced by long-terminterest rate differences, must to a high extent go via the exchanges.But there are also the induced commodity movements, the greatand indefinite delays in the transfer, indirect transfers, etc. Per-sistence of a differential is more likely to lead to a foreign capitalmovement than a mere momentary appearance which may, how.ever, suffice in the short-term field of international finance toinduce a transfer of funds. Our monthly averages are too shortfor the first and possibly too long for the latter phenomena. On thebasis of all the evidence we would conclude that the exchange ratefluctuations are only very indirectly influenced by long-term flowsof capital. These may well account for the type of persistence inbehavior noted in Chapter V,19 but they cannot be expected toconform well with the variations of the long-term interest ratedifferentials. Their value lies in broader comparisons which theinvestors make; their decisions are thereafter tied to exchange ratesof different later periods, spread out possibly over many months,but not depending primarily on the simultaneous stand of theforeign exchanges.
Section 5. The Differentials of Long-Termand Short-Term Interest Rates
(18) The study of long-term interest rates has already led toa number of comparisons with the short-term rates of our fourcountries, but as yet we have barely scratched the surface. It isnow necessary to dig deeper by investigating their relation more
ia Although in even finer, noncyclical measurement the correlations reap-peared, as was shown there.2'Cf. especially section 7.
482
DIFFERENTIALS OF LONG AND SHORT RATES
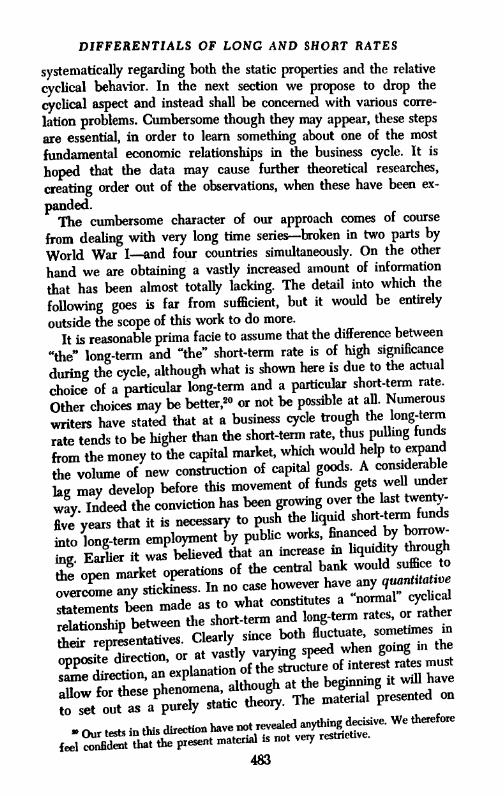
systematically regarding both the static properties and the relativecyclical behavior. In the next section we propose to drop thecyclical aspect and instead shall be concerned with various corre-lation problems. Cumbersome though they may appear, these stepsare essential, in order to learn something about one of the mostfundamental economic relationships in the business cycle. It ishoped that the data may cause further theoretical researches,creating order out of the observations, when these have been ex-
panded.The cumbersome character of our approach comes of course
from dealing with very long time seriesbroken in two parts byWorld War Iand four countries simultaneously. On the otherhand we are obtaining a vastly increased amount of information
that has been almost totally lacking. The detail into which thefollowing goes is far from sufficient, but it would be entirelyoutside the scope of this work to do more.
It is reasonable prima facie to assume that the difference between
"the" long-term and "the" short-term rate is of high significance
during the cycles although what is shown here is due to the actual
choice of a particular long-term and a particular short-term rate.Other choices may be better,2° or not be possible at all. Numerous
writers have stated that at a business cycle trough the long-term
rate tends to be higher than the short-term rate, thus pulling funds
from the money to the capital market, which would help to expand
the volume of new construction of capital goods. A considerable
lag may develop before this movement of funds gets well under
way. Indeed the conviction has been growing over the last twenty-
five years that it is necessary to push the liquid short-term funds
into long-term employment by public works, financed by borrow-
ing. Earlier it was believed that an increase in liquidity through
the open market operations of the central bank would suffice to
overcome any stickiness. In no case however have any qwzntitatit)e
statements been made as to what constitutes a "normal" cyclical
relationship between the short-term and long-term rates, or rather
their representatives. Clearly since both fluctuate, sometimes in
opposite direction, or at vastly varying speed when going in the
same direction, an explanation of the structure of interest rates must
allow for these phenomeflaalthough at the beginning it will have
to set out as a purely static theory. The material presented on
Our tests in this direction have not revealed anything decisive. We therefore
feel confident that the present material is not very restrictive.
483
484
BEHAVIOR OF LONG-TERM iNTEREST RATES
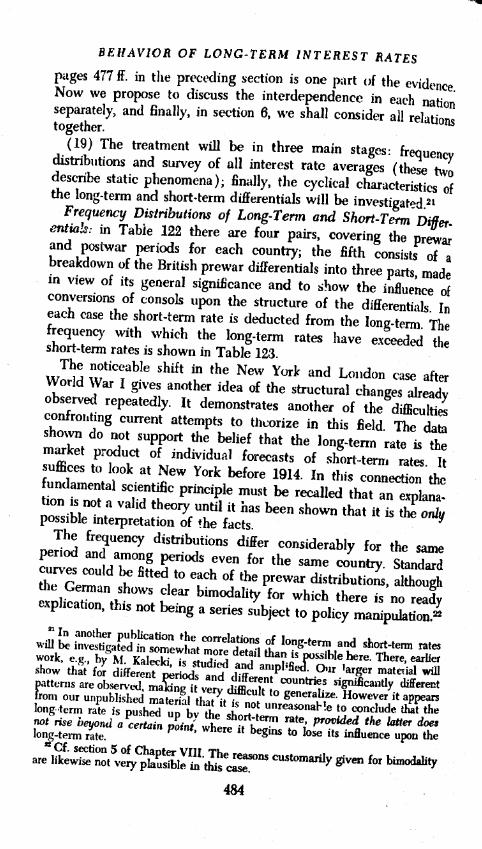
pages 477 if. in the preceding section is one part of the evidenceNow we propose to discuss the interdependence in each nationseparately, and finally, in section 6, we shall consider all re1aUotogether.(19) The treatment will be in three main stages: frequencydistributions and survey of all interest rate averages (these twodescribe static phenomena); finally, the cyclical characteristics ofthe long-term and short-term differentials will be investigated.21
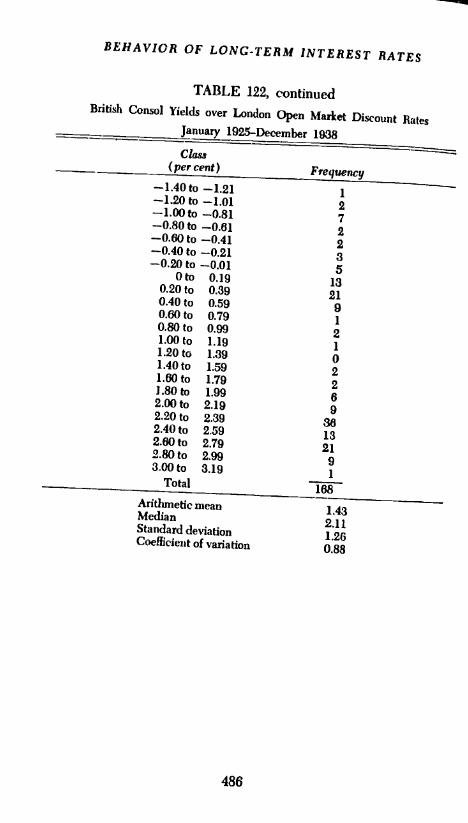
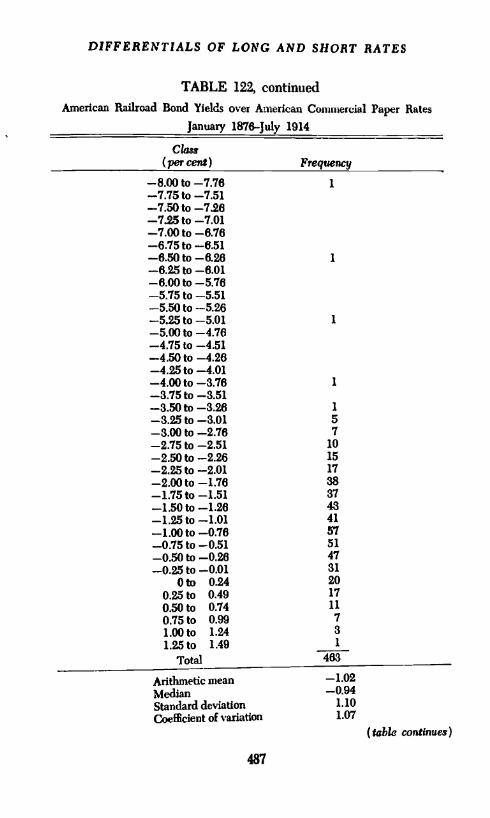
Frequency Distributions of Long-Term and Short-Tes.m Difl.cntia!$: in Table 122 there are four pairs, covering the prewarand postwar periods for each country; the fifth consists of abreakdown of the British prewar differentials into three parts, madein view of its general significance and to show the influence ofconversions of consols upon the structure of the differentials. Ineach case the short-term rate is deducted from the long-term. Thefrequency with which the long-term rates have exceeded theshort-term rates is shown in Table 123.
The noticeable shift in the New York and London case afterWorld War I gives another idea of the structural changes alreadyobserved repeatedly. It demonstrates another of the difcultiesconfronting current attempts to theorize in this field. The datashown do not support the belief that the long-term rate is themarket product of individual forecasts of short-term rates. Itsuces to look at New York before 1914. In this connection thefundamental scientific principle must be recalled that an explana-tion is not a valid theory until it has been shown that it is the only
possible interpretatioii of the facts.The frequency distributions differ considerably for the sameperiod and among periods even for the same country. Standard
curves could be fitted to each of the prewar distributions, althoughthe German shows clear bimodality for which there is no readyexplication, this not being a series subject to policy manipulation.22In another publication the correlations of long-term and short-term rateswill be investigated in somewhat more detail than is possible here. There, earlierwork, e.g., by M. Kaleckj, is studied and ampl.fiecj. Our 1arger matetial willshow that for different periods and different countries significantly differentpatterns are observed, making it very difficult to generalize. However it appearsfrom our unpublished material that it is not unreasonal-!e to conclude that thelong term rate is pushed up by the short-term rate, provided the latter doesnot rise beyond a certain point, where it begins to lose its influence upon thelong-term rate.
Cf. section 5 of Chapter VU!. The reasons cu.stomariiy given for bimodalityare likewise not very plausible in this case.
DIFFERENTIALS OF LONG AND SHORT RATES
TABLE 122
Frequency Distribution of Long-Term-short..Tern InterestRate Differentials, Prewar and Postwar, Seasonally
Corrected DataBritish Consol Yields over London Open Market Discount Rates
January 1876-July 1914
485
(table coUinue3)
Class(percent) Frequency
-3.50 to -3,26 1-3.25 to -3.01 0-3.00 to -2.76 1-2.75 to -2.51 0-2.50 to -2.26 1-2.25 to -2.01 2-2.00to -1.76 6-1.75 to -1.51 16-1.50 to -1.26 16-1.25 to -1.01 19-1.00 to -0.76 18-0.75 to -0.51 19-0.50 to -0.26 47-0.25 to -0.01 44
Oto 0.24 410.25 to 0.49 400.50 to 0.74 380.75 to 0.99 841.00 to 1.24 321.25 to 1.49 361.50 to 1.74 251.75 to 1.99 152.00to 2.24 112.25 to 2.49 1
Total 468
Arithmetic mean 0.11Median 0.25Standard deviation 1.03Coefficient of variation 9.36
BEHAViOR OF LONG-TERM INTEREST RATES
TABLE 122, continuedBritish Consol Yields over London Open Market Discount Rates
January l925-December 1938
-1.40 to -1.21-1.20 to -1.01-1.00 to -0.81-0.80 to -0.01-0.60 to -0.41-0.40 to -0.21-0.20 to -0.01
Oto 0.190.20 to 0.390.40 to 0.590.60 to 0.790.80 to 0.991.00 to 1.191.20 to 1.39l.4Oto 1.59l.00to 1.791.80 to 1.992.00 to 2.192.20 to 2.392.40 to 2.592.60 to 2.792.80 to 2.993.00 to 3.19
Total
Arithmetic meanMedianStandard deviationCoefficjeI)t of variation
DiFFERENTIALS OF LONG AND SHORT RATES
TABLE 122, continuedAmerican Railroad Bond Yields over American Commercial Paper Rates
January 1876-July 1914
Class(per cent) Frequency
-8.00 to -7.78 1-7.75 to -7.51-7.50 to -7.26-7.25 to -7.01-7.00 to -6.76-6.75 to -6.51-8.50 to -6.26 1-6.25 to -6.01-6.00 to -5.76-5.75 to -5.51-5.50 to -5.26-5.25 to -5.01 1-5.00 to -4.76-4.75 to -4.51-4.50 to -4.26-4.25 to -4.01-4.00 to -3.76 1-3.75 to -3.51-3.50 to -3.26 1
-3.25to -3.01 5-3.00 to -2.76 7-2.75 to -2.51 10-2.50 to -2.26 15-2.25 to -2.01 17-2.00 to -1.76 38-1.75 to -1.51 37-1.SOto -1.26 43-1.25to -1.01 41-1.00 to -0.76 51-0.75 to -0.51 51-0.50 to -0.28 47-0.25 to -0.01 31
Oto 0.24 200.25 to 0.49 17
0.50 to 0.74 11
0.75 to 0.99 71.00 to 1.24 31.2.5 to 1.49 1
Total 463
Arithmetic mean -1.02Median -0.94Standard deviation 1.10Coefficient of variation 1.07
487
(table continues)
N
BEHAViOR OF LONG-TERM INTEREST RATES
TABLE 122, continuedAmerican Railroad Bond Yields over American Commercial Paper
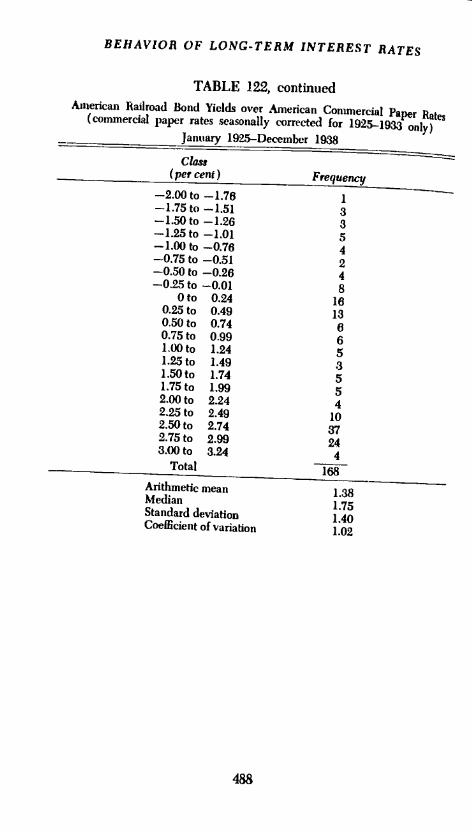
Rates(commercial paper rates seasonally corrected for 1925-1933 only)January 1925-December 1938
488
Class(per cent) Frequency
-2.00to -1.76 1-1.75to -1.51 3-1.SOto -1.26 3-1.25 to -1.01 5-l.00to -0.76 4-0.75 to -0.51 2-0.50 to -0.26 4-0.25 to -0.01 8
Oto 0.24 160.25 to 0.49 130.50 to 0.74 60.75 to 0.99 6l.00to 1.24 5I.25to 1.49 .31.SOto 1.74 5l.75to 1.99 52.00 to 2.24 42.25 to 2.49 102.50 to 2.74 372.75 to 2.993.00 to 3.24
244
Total
Arithmetic meanMedianStandard deviationCoefficient of variation
1.381.751.401.02
DiFFERENTIALS OF LONC AND SHORT RATES
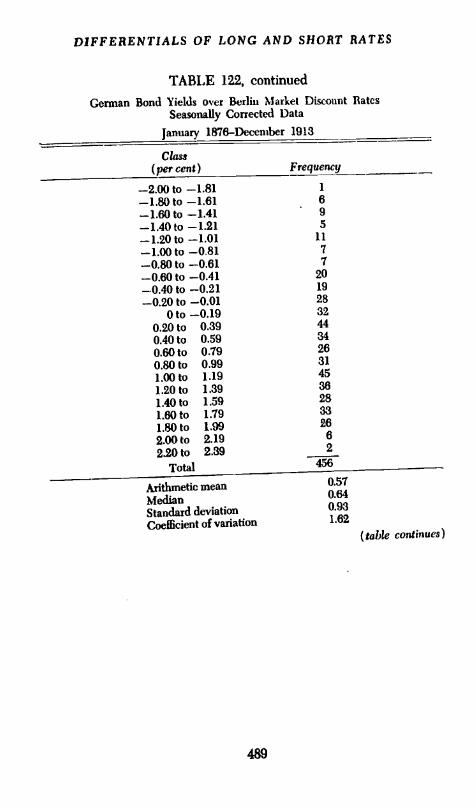
TABLE 122, continuedGerman Bond Yields over Berlin Market Discount Ilatcs
Seasonally Corrected Data
January 1876-December 1913
Class(per cent) Frequency
-2.00 to -1.81 1
-1.80 to -1.61 6-1.6Oto -1.41 9-1.40 to -1.21 5
-1.20 to -1.01 11
-1.00to--0-81 I-0.80 to -0.61 7-0.60 to -0.41 20
-0.40 to -0.21 19
-0.20 to -0.01 28
Oto -0.19 32
0.20 to 0.39 44
0.40 to 0.59 34
0.60 to 0.79 26
0.80 to 0.99 31
1.00to 1.19 45
1.20 to 1.39 38
1.40 to 1.59 28
1.8Oto 1.79 33
1.80 to 1.99 28
2.00 to 2.19 6
2.20 to 2.89
Total
Axithsnetic meanMedianStandard deviationCoefficient of variation
489
456
0.570.840.931.62
(table continues)
'I
BEHAVIOR OF LONG-TERM INTEREST RATES
TABLE 122, continued
German Bond Yields over Berlin Market Discount Rates(Berlin market discount rates seasonally corrected;
German bond yields uncorrected)January 1925-March 1935
(omitting August, October, November, December of 1931 andJanuary, February, March of 1932)
490
Class(per cent) Frequenc/
-0.75 to -0.51 1-0.50 to -0.26 1-0.25 to -001 3
Oto 0.24 50.25 to 0.49 90.50 to 0.74 60.75 to 0.99 71.00to 1.24 41.25to 1.49 81.SOto 1.74 51.75to J.99 62.00 to 2.24 82.25 to 2.49 72.50 to 2.74 102.75 to 2.99 123.00 to 3.24 53.25 to 3.49 33.50 to 3.74 43.75 to 3.99 64.00 to 4.24 04.25 to 4.49 34.50 to 4.74 24.75 to 4.99 05.00 to 5.24 3
Total 116
Arithmetic mean 2.07Median 2.18Standard deviation 1.38Coefficient of variation 0.65
DIFFERENTIALS OF LONG AND SHORT RATES
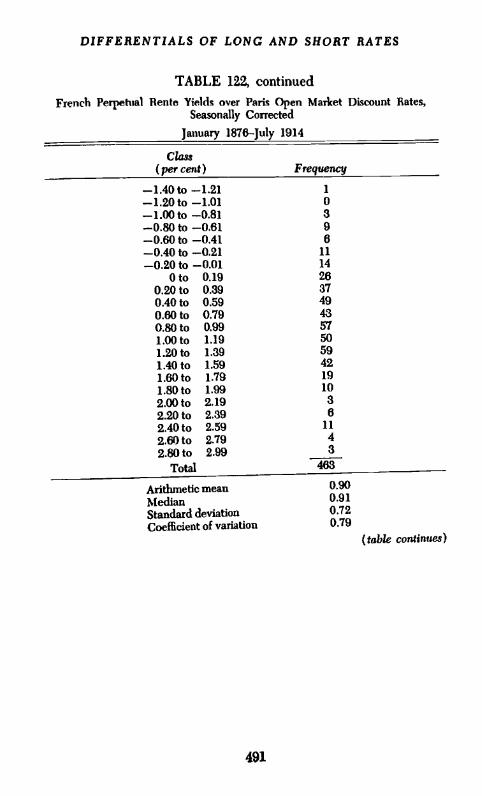
TABLE 122, continuedFrench Perpehial Rente Yields over Paris Open Market Discount Rates,
Seasonally Corrected
January 1876-July 1914
49].
(table continues)
Class(per cent) Frequency
-l.4Oto -1.21 1
-1.20 to -1.01 0-1.00 to -0.81 3-0.80 to -0.61 9-0.60 to -0.41 6-0.4Oto -0.21 11-0.20 to -0.01 14
Oto 0.19 260.20 to 0.39 370.40 to 0.59 490.60 to 0.79 430.80 to 0.99 571.00to 1.19 501.20 to 1.39 591.40 to 1.59 421.60 to 1.79 19
1.8Oto 1.99 10
2.00 to 2.19 32.20 to 2.39 62.40 to 2.59 11
2.60 to 2.79 42.80 to 2.99 3
Total 463
Arithmetic mean 0.90
Median 0.91
Standard deviation 0.72Coefficient of variation 0.79
BEHAVIOR OF LONG-TERM INTEREST RATES
TABLE 122, continued
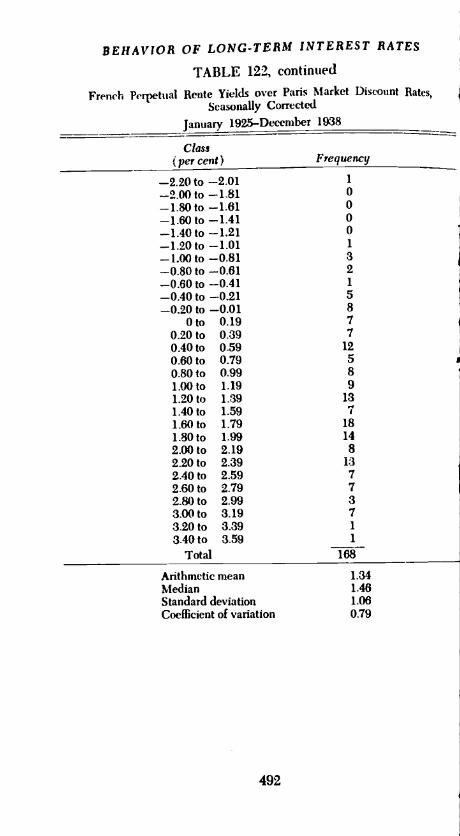
French Perpetual Rente Yields over Paris Market Discount Rates,Seasonally Corrected
January 1925-December 1938
Arithmetic mean 1.34Median 1.46Standard deviation 1.06Coefficient of variation 0.79
Class(percent) Frequency
-2.20 to -2.01 1
-2.00 to -1.81 0-1.SOto -1.81 0-1.6Oto -1.41 0-1.40 to -1.21 0-1.20 to -1.01 1
-1.00 to -0.81 3-0.80 to -0.61 2-0.60 to -0.41 1
-0.40 to -0.21 5-0.20 to -0.01 8
Oto 0.19 70.20 to 0.39 70.40 to 0.59 120.60 to 0.79 50.80 to 0.99 81.00to 1.19 91.20 to 1.39 131.4Oto 1.59 71.60 to 1.79 181.SOto 1.99 142.00to 2.19 82.20 to 2.39 132.40 to 2.59 72.60 to 2.79 72.80 to 2.99 33.00to 3.19 73.20 to 3.39 1
3.40 to 3.59 1
Total
DIFFERENTIALS OF LONG AND SHORT RATES
TABLE 122, continuedExcess of British Consol Yields over London Open Market Discount Rates
Arithmetic meanMedianStandard deviationCoefficient of variation
0.330.381.093.35
493
Arithmetic meanMedianStandard deviationCoefficient of variation
(table continues)
0.310.831.143.64
3 per cent January 1870 toFebruary 1888
Class(per cent) Frequency
2% per cent March 1888 toMarch 1903
Class(pet cent) Frequency
-4.25 to -4.01 1 -8.50 to -3.26 1
-4.00 to -3.76 -3.25 to -3.01-3.75 to -3.51 -3.00 to -2.76 1
-3.50 to -3.26 -2.75 to -2.51-3.25 to -3.01 1 -2.50 to -2.26-3.00 to -2.18-2.75 to -2.51-2.50 to -2.28-2.25 to -2.01-2.00 to -1.76-1.75 to -1.51-1.50 to -1.26-1.25 to -1.01-1.00 to -0.76-0.75 to -0.51-0.50 to -0.26-0.25 to -0.01
Oto 0.250.26 to 0.500.51 to 0.750.76 to 1.001.Olto 1.251.28 to 1.501.51 to 1.75
114
5297
12132320211817141615
-2.25 to -2.01-2.00 to -1.76-1.75 to -1.51-1.50 to -1.26-1.25 to -1.01-1.00 to -0.76-0.75 to -0.51-0.50 to -0.26-0.25 to -0.01
Oto 0.250.26 to 0.500.51 to 0.750.76 to 1.001.Olto 1.251.26 to 1.501.51 to 1.751.76 to 2.002.01 to 2.25
Total
323
161879
101713119
12141118
6181
1.76 to 2.00 10
2.01 to 2.25 8
Total 218
BEHAVIOR OF LONG-TERM iNTEREST RATES
TLBLE 122, concludedExcess of British Consol Yields over London Market Discount Rates
-3.50 to -3.28 1-3.25 to -3.01-3.00 to -2,76 3-2.75 to -2.51-2.50 to -2.26-2.25 to -2.01 2-2.00 to -1.76 2-1.75 to -1.51 1-1.E0to -1.26 8-1.25 to -1.01 10-1.00 to -0.78 10-0.75 to -0.51 14-0.50 to -0.26 15-0.25 to -0.01 10
Oto 0.25 90.28 to 0.50 150.51 to 0.75 130.76to 1.00 8l.Olto 1.25 51.26to 1.50 41.51 t 1.75 8
Total 136
Arithmetic mean -o.igMedian -0.20Standard deviation 1.00Coefficient of variation 5.32
The skewness of the distributious is now meaningful (regardingtheir direction), while it was arbitrary for the international differ-entials. Since the means will be collected in Table 124 togetherwith others, we point only to the great difference in the coefficientof variation, which langes from a low of 0.65 for Berlin, postwar,to 9.36 for prewar London (Table 122). The shift brought aboutby the war is greatest for New York and London, where there isindeed a radical change. The New York distribution has becomeclearly bimodal, while the London distribution even breaks totallyapart.
This might be assumed to be due to the conversion of Britishconsols in 1932; there is thus one kind of heterogeneity of the mate-rial. But it also applies to the very same consols before 1914 when
DIFFERENTIALS OF LONG AND SHORT RATES
TABLE 123
Long-Term Rates Higher than Short-Term Rates
PreWar
(per cent)New York 12.74London 58.98Paris 90.50Berlin 75.22
Postwar
(per cent)82.1488.9087.5095.89
Seasonally corrected data, except for postwar German bond yields. Periodcovered: Prewar, January 1876July 1914; postwar, Berlin, January 1925July1931, September 1931, April 1932March 1935; others, January 1925Decem-ber 1938.
two conversions occurred in March 1888 and in April 1903. How-ever the distribution for the entire period is free of bimodality,Yet in the distribution of Chart 66 breaking the entire period forLondon into these appropriate partsthus making each homo-geneous, as far as the factor of conversions is concernedthereappear two which are not of a highly regular type. So we see thatthe question of heterogeneity of the data is not easily settled.
In this connection the results of a further experiment may bementioned. In view of the plausible hypothesis, mentioned re-peatedly in the literature, that the long-term rate may move (per-
haps with lag) in the same direction as the difference between thelong-term and short-term rate, the following computations weremade: for various periods before and after World War I (depend-ing upon the longest complete specific cycles) for each of the fourcountries the phase covariation between the two series was deter-mined first with no lag of the long-term rate behind the differ-ential, then introducing a monthly lag from one up to twelvemonths. The two sample Charts 65 and 66 show the results for the
United States and Great Britain (prewar). On the left ordinate isshown the percentage of months in the same phase, on the rightordinate the percentage of months in different phases, and on the
horizontal axis the number of months lagged. The chart for Britain
starts with almost 60 per cent of the months in the same phase. The
introduction of a lag decreases the conformity to about 35 per
cent, where it stabilizes. For the United States we start with an
insignificant value of 26.5 per cent, which first drops, but after a
four-month lag rises steadily to over 40 per centan improvement
495
BEHAVIOR OF LONG-TERM INTEREST RATES
CHART 65
Comporin of the Specific Cycles of LongShort Interest RateDifferentials with the Specific Cycles of the Long-Term Rates, Prewar
United States. 1879-1913
0 1 2 3 4 5 6 1 8 9Lag of oag!.r. eel. 1nim'b.r of moi,tho)
Source See the accompanying text.
of almost 100 per cent. France, prewar, is indifferent to lagging,Germany behaves somewhat like Great Britain, but other typesalso occur (not shown), e.g., the United States postwar starts witha 50 per cent correspondence with zero lag. This drops to below40 per cent for a five-month and six-month lag, and then rises againthe greater the lag becomes.
This general picture shows that the hypothesis is not withoutinterest but that its examination is not easy. In the above attemptadditional assumptions entered, such as that the cycles are un-ambiguously determined, etc. A complicated interdependence fthis kind should be examined from many sides requiring workalso of a theoretical naturebeyond the plan of this study.
(20) Summary of behavior of averages of all interest rates. Table124 collects some information about rates and differentials in a
DIFFERENTIALS OF LONG AND SHORT RATES
CHART 66
Comparison of the Specific Cycles of LongShort Interest RateDifferentials with the Specific Cycles of the Long-Term Rates. Prewar
Great Britain, 1879-1908Go
55
50
45
40
2 35
30 70
a,25 75
20 80
IS 85
10
same idifferent I phase
95
497
40
45
50
55
60
0 I t I I I I I I too0 1 2 3 4 5 6 7 8 9 90 II 12
Lo of IOnq-t.'t.. COI. (nwI*Ir of moolbi)
Source: Same as for Chart 65.
065
convenient summary fonn. It contains only means and medians.In addition to the figures already studied, there are the averagesof long-term and short-term "cross differentials." These show theaverage difference between the long-term rate in the first countryand the short-term rate in the second. The meaning of these opera-
"They were in all cases directly obtained from the frequency distributions,except the arithmetic averages for the long-term interest rates, which were com-puted from those of the short-term and the short-term, long-term differentials.Others are likewise interdependent. A few slight disparities are due to repeatedrounding off.
BEHAVIOR OF LONG-TERM INTEREST RATES
TABLE 124
Arithmetic Means and Medians of Interest Rates andDifferentials
Arithmetic Means of:
Computed from'Computed from
Computed fromComputed from
rates.
Short-Term Interest Rates'
Official Discount Rates'
498
means of long-short differentials.frequency distributions of discount rates.frequency distributions of differentials of discount rates.frequency distribution of differentials of official open market
New York 2.78 2.52London 3.36 3.08 3.88 3.14Paris 2.92 3.00 3.39 3.01Berlin 4.17 4.00 5.53 4.97
New York Berlin 0.68 -0.14London New York (comm.) -2.01 1.11
London New York (call) -0.90 1.07
London Paris 0.35 0.77
London Berlin -0.37 -0.95Paris New York (comm.) -1.52 1.74
Paris New York (call) -0.35 1.64
Pans London 0.66 2.00
Paris Berlin 0.18 -0.38Berlin New York (comm.) -1.13 4.19
Berlin New York (call) 0.04 4.09
Berlin Paris 1.29 3.19
Berlin London 1.05 4.45
BEHAVIOR OF LONG-TERM iNTERESTRATES
tions is immediate: the short-term investor at a given placeCOhsiders not only the domestic long-term and foreign short.te ratt\but also foreign long-term rates.
(21) Comparison between the averages of the longiong.,and short-short-term differentials reveals a complicated patter,jWhen both markets are highly organized, the averages forshort-term differentials are higher. This applies to all prewar rehtions except Berlin-London; why this should be an exception ishard to see. After World War I there are only three conformin,pairs left: Paris-London, New York-Paris, and New York-Lond0without doubt the three functioning relationships. So the theoreticexpectation seems to have some justification. The differentialsthe official discount rates were always greater before World War 1than those of the open market short-term rates. After the warhowever the picture is confused. The long-term and short-tern1differentials on the other hand show no regularity in the prewaryears, but are almost identical after the war for the three "regularcenters. For New York this normalization meant also a reversalof signs; before the var the short-term average had been muchhigher than the long-term, indeed exceeding in absolute amountany other. In the postwar period the gap has in all instances be-come wider, in London twelve aixi in Berlin four times as much.On the other hand the (lifferences between the official and openmarket discount rates have changed differently, only hvo haverisen and that of Berlinthe most disturbed markethas fallen,Surely it will be a long while before this evidence can be broughtinto a satisfactory theory. Or it 'ilI have to be discarded. Yet, onwhat grounds? The Present attempts to theorize_without systematicempirical preparation_can be viewed only as guesses; but theymay be suited to open up the subject.
(22) Cyclical clwracferjsljcs and covarfafjo,i. Charts 67 to 70show the four series under consideration There are very markedcycles both for the prewar and postwar periods. It is only from 1933on that they' almost disappear for the United States and GreatBritain, either perfected central management of both basic ratesor stagnation being the explanation. The amplitudes are very large.except for prewar United States where, however, the crises of1873, 1893, and 1896 stand out sharply as troughs. Except forFrance there are seasonal variations before World War I, some-times of an uncertain and complicated nature. They have beeneliminated and the cycles in our tables refer to the corrected data.24
'Consideraflop.s about seasonal variations, and in particular if they occur in
500
DiFFERENTIALS OF LONG AND SHORT RATES
TABLE 125
Dates of Specific Cycle Turning Points of Long-ShortInterest Rate Differentials
GREAT BRITAIN
Peak TroughAug. 1811 Aug. 1870
Nov. 1873Oct. 1876 Aug. 1878Sept. 1879 July 1883June 1885 July 1890Sept. 1892 Aug. 1893Oct. 1894 Dec. 1899Oct. 1901 May 1903Oct. 1904 Nov. 1907Apr. 1909 Apr. 1910Mar. 1911 July 1913May 1923 May 1920
May 1925July 1928 Oct. 1929Sept. 1930 Jan. 1932Jul' 1933 Mar. 1934
GERMANY UNITEI) STATES
Peak Trough Peak Trough
Aug. 1876 May 1877May 1879 Feb. 1882Feb. 1884 Apr. 1885Sept. 1888 Feb. 1887Jan. 1888 Feb. 1890May 1892 Aug. 1893Dec. 1894 Aug. 1896May 1897 Mar. 1900July 1902 Aug. 1903Apr. 1905 July 1907Nov. 1908 Aug. 1910July 1911 Feb. 1913
July 1926 Mar. 1928Jan. 1929 May 1929Aug. 1930 July 1931June 1932 Jan. 1934
Table 126 gives the number and duration of the cycles in the
four countries. In the prewar period, the number ranges fromseven to ten and the average duration from 37.2 to 54.1 months.
differentials, are found on page 137. See also the reference to A. Wald in foot-
note 34, Chapter I.
501
FRANCE
Peak Trough
June 1816 Jan. 1882June 1886 Dec. 1888Feb. 1889 Mar. 1891June 1892 Aug. 1893Aug. 1895 Jan. 1900Sept. 1901 July 1903Aug. 1904 Aug. 1907May 1909 Aug. 1913
Apr. 1925Nov. 1925 Oct. 1926Oct. 1927 June 1929June 1933 Dee. 1935Dec. 1938 July 1937June 1939
July 1871 Sept. 1873Aug. 1876 Oct. 1877Aug. 1878 June 1883Sept. 1885 July 1887Nov. 1888 Dcc. 1890June 1892 July 1893Oct. 1894 Oct. 1896Jan. 1899 Mar. 1900Nov. 1900 Aug. 1903Jan. 1905 Dec. 1907July 1909 June 1910Nov. 1911 June 1913
Oct. 1920Aug. 1922 May 192.3Oct. 1922 Aug. 1929Sept. 1931 Nov. 1931Sept. 1934 Dec. 1936Dcc. 1938
BEHAVIOR OF LONG-TERM INTEREST RATES
TABLE 126
Number and Duration of Specific Cycles of Long-ShortInterest nate
Differentials of Four Countries, Seasonally Corrected Data
Great BritainFranceGermanyUnited States
Great Britain 2 2France 2 2Germany 3 3United States 1 1
Duration of only complete cycles, expansions, and contractions are included intheiirp.live columns.
b The percentages are calculated from a base equal to the average duration of expannons p!that of contractions. This sum is equal to the average duration of cycles only when the nuniof full cycles is the same as the number of expansions and contractions.'Only complete cycles are counted; parts of cycles at both ends of a series are dropped. Cyds
are measured from trough to trough. Similarly only complete expansions and contractin a-counted in their respective columns.
The percentage distribution shows the contractions of the specificcycles always significantly longer than the expansions. The figuresfor the 96-month postwar period are added, but not more than twocycles occur, and the United States has only one. France is interest-mg in that the duration of the cycle has been cut by more thanhalf, but the percentage share of the two phases has remainedvirtually the same.25 As will be seen presently, there is a highdegree of covariation between the cycles of these four series, aremarkable phenomenon indeed.
Because of the greater amplitude of the short-term rates, thedifferential between the long-term and short-term rates tends tobehave like the short-term rate inverted. A comparison, for examp1e
If the whole period 1925-199 is taken, there are four cycles with anaverage duration of four months, showing expansion 53.7 per cent and con-traction 46.3 per cent.
502
;5ae5M
3&7
49.474
fr
UUipINC
LC)th
es
to
In
a
ieto
inC-
DiFFERENTIALS OF LONG AND SHORT RATES
TABLE 127
Phase Comparison of Specific Cycles of Long-Short Interest RateDifferentials and Their Respective Reference Cycles for Four Countries
Great BritainFranceGermanyUnited States
Great BritainFranceGermanyunited States
Dif- SAME PISASE Dif-Ex- Con. jerent Er- Con- ferent
panslons tractions Total phase pansions tract to as Total phase
29144365
SAME PHASE:
(MONTHS)
Prewar: February 1878-August 1913
53 8268 8235 7888 153
Postwa? January 1925-December 1932,96 months
of the peaks (or troughs) of the short-term interest rate with thetroughs (or peaks) in the corresponding long-short differential
(Tables 12 and 125) shows quite a similarity, although not in all
cases.The specific cycles are closely related to their reference cycles, as
can be immediately seen from Table 127 and Charts 61 to 70
where the latter are marked off in the customary way. It is striking
to observe for the three European countries how closely packed
the peaks of one series are with the troughs of the other. For the
United States the correspondence is much smaller, there being
many more reference cycles. This could lead to the interpretation
(cf. Chapter I) that the American differential is by virtue of its
nature more closely tted to the other money markets than to general
domestic American business. But if this is the case here, then the
theoretical implication of this relation must be different from that
for the three European countries. The observations of (mostly
European) theorists that, at a business cycle trough, the differential
should be large referred primarily to European experience.
(23) The covariatiOfl between the differentials and their refer-
ence cycles being negative, Table 127 has to be read correspond-
ingly, i.e., lack of covariation being good correspondence. The true
503
344344348273
(p E BCE N TAG Es)
426 months
6.8 12.43.3 16.0
10.1 8.215.3 20.7
19.2 80.819.2 80.818.3 81.735.9 64.1
39.8 60.428.1 71.932.3 67.718.8 81.3
122317
0
284
1418
38273118
58696578
12.524.017.70
27.14.2
14.618.8
BEHAViOR OF LONG-TERM iNTEREST RATES
TABLE 128
Long-Short Interest Rate Differentials, Dispersion of SpecjCycle Turning Points, February 1878August 1913
(426 months)
Average mean deviation of coinciding peaks as per centof corresponding average for troughs
Four countries 126%Three Europeaii countries 132%
'Coinciding turning points: Within the range of the turning points there is noop)oSite turning point.
Arithmetical mean of the turning points is computed: if the average fallsexactly between two months, both are reported; if the average falls more closelyInto one month, only that month is reported,
Four countries Oct. 1882 8.50Sept. 1890 4.50Aug. 1893 0.50Feb. 1900 1.25 . 2.80 74July 1903 1.00
Sept.Oct. 1907 2.00June 1913 1.88
Three European countries July 1882 7.78Aug. 1890 4.67Aug. 1893 0.44Jan. 1900 1.11 . 2.73 100July 1903 1.11Sept. 1907 1.56June 1913 2.44
Averagepeakb
coINcrnINc PEAK_s
Mean meandeviation deviation(months) (months) Col flCiding
Four countries Jan.Feb. 1888 6.00JuneJuly 1892 1.25
covariation is very high; the figures are among the best observedin this entire study. Similarly Table 128 measures the dispersionof turning points of the two sets of four series by looking for
coincidence of reference cycle troughs with differential peaks and
vice versa.(24) A direct pairwise phase comparison between the long-short
differentials is, in contradistinction to all other previously formed
differentials, possible and desirable. The resulting measurements
are in Table 129. The covariation is very high-in the prewar period
-even when larger groups of countries are formed (always recall-
ing the significance test of section 2 of Chapter II). The best pair-
wise correspondence results for Great Britain-France, with 79.3
per cent of all months in the same phase. In view of the fact that
this refers to the difference between two domestic interest rates,
both subject to domestic policy (the short-term to the central bank,
the long-term, indirectly but strongly in some periods, e.g., through
the management of the public debt), such a figure is truly remark-