THE BENEFIT OF FOLIAR APPLIED COPPER FERTILIZER ON ROMAINE LETTUCE GROWN IN LOW COPPER SOILS OF THE COASTAL SANTA MARIA, CALIFORNIA A Thesis Presented to The Faculty of California Polytechnic State University, San Luis Obispo In Partial Fulfillment Of the Requirements for the Degree Master of Science in Agriculture With a Specialization in Soil Science By Emmy R. Williams March, 2009
Transcript
THE BENEFIT OF FOLIAR APPLIED COPPER FERTILIZER ON ROMAINE LETTUCE GROWN IN LOW COPPER SOILS
OF THE COASTAL SANTA MARIA, CALIFORNIA
A Thesis Presented to
The Faculty of California Polytechnic State University, San Luis Obispo
In Partial Fulfillment Of the Requirements for the Degree
Master of Science in Agriculture With a Specialization in Soil Science
By Emmy R. Williams
March, 2009
ii
Abstract
Emmy R. Williams
The importance of trace elements nutrients to vegetable crops has received more attention in
recent years. Accordingly this experiment investigated the benefit of foliar applied copper
fertilizer on romaine lettuce (Lactuca Sativa Longifolia) grown in low soil Copper (Cu)
concentration in the coastal Santa Maria, California. The various rates of Cu fertilizer applied
include untreated (control), 100, 200, 400 and 800 grams per acre of CuSO4.5H 2O, using a one
time and a split application methods. Three consecutive individual experimental fields were
established starting in late spring through the fall of 2008. The soil texture was a loam in all three
of the experimental fields. Positive responses in weight increase were found due to these
treatments, however was not statistically significant. The maximum responds in weight increase
was identified with the one-time application of 200 and 400 grams/acre of CuSO4 but weight
decline was observed at the higher rates of 800 grams/acre. The optimum weight increases were
between 4.4 and 6 percent higher than the untreated plots. The treatments significantly increased
the uptake of Cu by plants (pvalue <0.001). When analyzed collectively, significant difference
was found in plant weights between the three experimental fields. Crops harvested one week
earlier than scheduled produced 21% lower mean weight than those harvested on time. No
apparent physical damage was identified in plants having leaf cu concentrations exceeding the
suggested toxic level of 150 ppm but weight decline was observed thereafter. In 2009 an
additional experimental field was established in a sandy loam, 8% clay and was completed in
March. Rate of applications was modified to include untreated control, 200, 400 and 500
grams/acre, at one time application only. Again Positive responses in weight increase were
found due to these treatments, however was not statistically significant. The optimum result in
weight increase was found with the application of 200 grams/acre of CuSO4. The overall mean
weights of the plants were comparatively higher than that of the three previous experimental
fields. The weight increase was 7.5% higher than the untreated plots.
Key Words: Foliar; CuSO4.5H 2O (Cu Sulfate Pentahydrate); Trace elements nutrients.
iii
ACKNOWLEDGMENTS
I would like to thank Betteravia Farms for allowing me the time and the materials
necessary to complete this study. I wish to express my sincere appreciation to Mr. Craig Reade,
a partner at Betteravia Farms, his support has been invaluable. I owe much to the late Dr. Ruehr
of Cal Poly, my long time mentor, for his constant attention and encouragements.
I would also like to thank Nutrient Technologies for providing the material to be used in
this experiment.
iv
TABLE OF CONTENTS
Page
LIST OF TABLES……………………………………………………………v LIST OF FIGURES………………….………………………………………vi
CHAPTER I INTRODUCTION…………………………………………………... 1
Purpose for Research Previous research and background Research Objective…………………………………………………..2 The Role of pH and Micronutrients………………………………….3 Factors influencing the availability of micronutrients in the soil The Role of Copper………………………………………………….4 The Function of Copper in the Plants………………………………..5 Soils of the Coastal Santa Barbara and San Luis Obispo Counties….6 Effects of Cu Deficiency on Plants…………………………………..7 Excessive Soil Copper Concentration………………………………..8 Foliar Applied Fertilizer……………………………………………...9 Soil Applied Fertilizer……………………………………………….10 The Experiment Carried Out………………………………………...11 II MATERIALS AND METHODS………………………………..12-14 Soil pH, Electrical Conductivity, Particle Size Distribution, Plant Available Phosphorus and Exchangeable Basic Cations Sample Crop Selected for Foliar Cu Application Investigation……..15 Field Design and Treatments……………………………………15- 16 Plant Tissue Sampling and Preparations…………………………… 17 Phosphate Phosphorus in leaf tissue……………………………….. 18 Metal Ion Concentration in Leaf Tissue Field Harvest Procedure……………………………………………. 19 The Experimental Fields………………………………………….19-21 Statistical Analysis of the Final Plant Data…………………………..22
1. Foliar Cu applied to romaine lettuce in grams………………………………16 per acre for Experimental fields #1 and #2 and #3 in 2008
2. Foliar Cu applied to romaine lettuce in grams per acre for …………………21 Experimental fields #4 Jan-March, 2009
3. Summary of the time frame, planting method and pertinent features of The soils in the four experimental fields…………………………………….22
4. Analysis of variance table for the effect of the experimental fields, the levels, the treatments and the interaction between the levels and the treatments, on the weight of the plants…………………………………..….24
5. Analysis of variance table for the effect of the experimental fields, ………..25
level of application and the treatments, on leaf Cu concentration (ppm)
6. The mean weight of romaine lettuce (lbs/plant) due to the treatments……. 25 7. Summary of the plants’ weight increase due to the treatments,…..…………26
in experimental fields, #1, #2 and #3.
8. Summary of the weight of the romaine lettuce relative to ………………….26 the leaf Cu concentration at harvest
9. Analysis of variance table for the effect of treatments on the weight of…….28 the romaine in experimental field #4 10. The effect of the treatments on the weight and leaf Cu concentration………29
at harvest on experimental field #4 11. Summary of the plants’ weight increase due to the………….………………29
treatments in the experimental field #4
vi
LIST OF FIGURES
Figure Page
1. Map of generalized distribution of cu concentration in legumes of the USA from Kubota, 1983..........................................................................5
2. The effects of the treatments, the experimental fields and the application level on the uptake of leaf cu………………………………………………....27
3. The corelation between leaf cu concentration (ppm) and the weight
of the romaine (lbs)……………………………………………….…………..27
4. The effect of the treatments on the mean weight of the plants in
experimental fields#4……….............................................................................29 5. Photograph illustration of samples from untreated and treated experimental
units after one week in cold storage …………………………………………31
6. Photograph illustration of untreated control and treatment #7 (400 g/acre) after one week in cold storage.........................................................................31
7. Photograph illustration of samples from untreated control and
treatment #9 (800 grams/acre)after one week in cold storage...........................32
8. The effect of application level and treatments on the mean weight of The plants in experimental fields #1, #2, #3.……………….…………………33 9. Photograph illustration of samples from untreated control and treated
samples from experimental field #4 at harvest, March 2009.............................35
10. Photograph illustration of the untreated and treated cross-section samples of the plants from the experimental field #4, March 2009 ................................35
1
INTRODUCTION Purpose for research
The problem of Copper deficient soils
Recent research work on both commercial head lettuce and leaf lettuce including romaine
(Lactuca Sativa Longifolia) in the area of coastal Santa Maria and San Luis Obispo counties of
California identified copper to be the most limiting nutrient. More than 40% of the low yield
fields were below the copper sufficiency range at both growth stages, mid growth and harvest. It
has been suggested that the mean extractable soil copper is below what was reported by Brown
and deBoer in1985 to be representative at that time, for copper in this area (Hartz et al., 2007).
Also, a significant relationship was found between soil extractable copper and pre harvest leaf
copper concentration. The finding was insufficient to set a definite soil copper limit and therefore
a further study was warranted.
Previous Research and Background:
Agriculture is the major producing industry in Santa Barbara county, California which includes
the area of Santa Maria, California . In 2007 it had reached a gross production valued at over one
billion dollars, an increase of $86.6 million (8.5%) from the previous year. It was the second
consecutive year that agriculture has surpassed the one billion dollar benchmark.
2
The production of vegetable crops was the second largest contributor to this revenue, next to fruit
and Nut crops. In 2007, the combined acreage harvested for vegetable crops in Santa Barbara
county was 71,434 acres, of which 17,087 acres was of head and leaf lettuce. Acreage harvested
for leaf lettuce in 2007 was 4,252 with a total value of $ 25,705,118
(The Agriculture Commissioner’s Office, 2008).
Agricultural scientists and growers are continuing to find new ways to improve and enhance crop
growth and crop quality. As the soil/plant laboratory manager of large agriculture producing
firm in Santa Barbara and San Luis Obispo counties of California, this writer has, over the years,
strived to keep abreast of current research, apply recently found alternate methods and test and
analyze new concepts in the field.
The subject of this report is the importance of micronutrients in the soils of the above mentioned
region of California, however, focusing on the paucity of the micronutrient copper in the soils
and the results produced by remediation.
Research Objective
The objective the this study is to investigate the benefit of foliar applied copper sulfate on
romaine lettuce grown in soils having low copper concentration and also, to determine if a one
time application differs from a split application.
3
The role of pH and micronutrients
The established recommended range of soil pH for most vegetable crops, including lettuce is
between 6.5 and 7.2. Between these pH values soil nutrients are in the forms available for plants’
uptake. Micronutrients, such as iron, manganese, copper, zinc, boron and molybdenum, are
needed by plants in much smaller amounts than the macronutrients (nitrate, phosphorus,
potassium and sulfur) but are equally as important.
Factors influencing the availability of micronutrients in the soil
Temperature and moisture are essential factors affecting the availability of micronutrients in the
soil. Most soil micronutrients tend to decrease at low temperature because of reduced root
activitiy and low rates of dissolution and diffusion of nutrients (Cooper, 1973;Fageria et al.,
2002) . The availability of these micronutrients is also influenced by the pH. The
micronutrients, boron, copper, iron, manganese and zinc, favor slightly acidic conditions, and
therefore are available for plants at pH’s between 6 – 6.5. Zinc for example, becomes less
soluble as the pH approaches 7; it forms precipitates, binds with phosphorus, adsorbed on clay
surfaces or on carbonates and becomes, therefore, unavailable for plants. For that reason, at
slightly acidic pH values (between 6.5 - 6.8) result in favorable conditions for plant growth. One
of the major contributors to high soil pH is the imbalance between the ratio of the bases, or the
major cat ions [potassium (K1+), calcium (Ca2+), magnesium (mg2+) and sodium (Na1+)] on the
cat-ion exchange sites. The desired ratio between calcium and magnesium on the exchange sites
is about 65% calcium to 15 % magnesium for a sum of 80%. The remaining 20% is occupied by
4
potassium, sodium and other bases. Any of these four major elements in excess can drive the pH
up and a deficiency of any of them can lower the pH, creating acidic conditions
(Kinsey et al., 2006).
The Role of Copper (Cu)
Copper is essential for both plants and animals. Plant Cu concentration is influenced by plant
species, stage of growth, and various soil properties and by the soil amendments applied. Soil Cu
concentration is markedly affected by the parent material from which the soil formed. Alluvium
is the dominant, unconsolidated surficial deposit of which soils formed in the interior valleys of
California and Arizona. The mean soil Cu concentration in this area is 15 mg kg -1 whereas the
coastal area of California has a mean Cu 54 mg kg-1 and a range between 8-112 mg kg-1. No
consistent difference was found between soils that formed of alluvium of mixed rocks or that of
granitic alluvium (Bradford et al., 1967). Soils with the least amount of Cu, (mean concentration
of 5 ppm) are found in the unconsolidated lower Atlantic Coastal Plain deposits of Florida, North
and South Carolina (Kubota, 1983). A Map showing the geographical distribution pattern of Cu
in legumes was prepared by Kubota, 1983 (Fig. 1), based on samples of various legume forages
grown in a wide range of USA soils. The map shows coastal California where 40-70% of
legumes contain 6-10 mg kg -1 of copper.
5
Fig: 1. Map of the generalized distribution of Cu concentration in legumes of the USA
(Kubota, 1983).
The functions of copper in the plants
The functions of Copper in the plants are: to metabolize nitrogen and carbohydrate and to
synthesize lignin which is essential for the forming of cell wall strength. It also affects flavor
and coloring of the vegetables and their storage ability, which aids to the prevention of diseases.
When soil Cu is adequate roots accumulate Cu in high concentration, mostly in the apoplast
(epidermal cell layer). In Cu deficient soil, root Cu concentrations are low and evidence
indicates that such roots are vulnerable to fungal and bacterial attack (Mortvedt et al., 1991).
Nutrient imbalances in plants, especially latent micronutrients deficiencies, is a problem in
intensive agriculture (Franck and Finck, 1980) in Marschner, 1986). The consequences are not
Areas with 50% or more legume have 10-12+ mg kg-1 of Cu
Areas where 40-70% of legumes have 6-10 mg kg-1 of Cu
Areas where 35% or more of legumes have 6 mg kg-1 or less of Cu
6
only for plant yield but also resistance to and tolerance of diseases and pests as well as for animal
(Kubota et al., 1987) and human nutrition.
The soils of the coastal Santa Barbara and San Luis Obispo Counties
Along the coastal area of San Luis Obispo and Santa Barbara counties, there is an abundance of
serpentine rocks [Mg 6 Si 4 O 10 (OH)8 ] which contain high amount of magnesium. The
weathering of these rocks contributes to an excess amount of magnesium in the soil, an
imbalance which drives the pH up. A Survey of soil test results from coastal Santa Maria,
Guadalupe and Oceano areas, showed the excessive amount of exchangeable magnesium, which
occupied more than 20% on the cat-ion exchange sites. The average pH value in the surveyed
area was 7.35 (Author, 2006).
Apart from the predominantly basic pH in the area, concern for a fungal disease known as
plasmodiophora brassicae Woronin (clubroot) has prompted growers in the area to practice
liming with the intention of keeping the pH high. P brassicae, which infects the roots of cole
crops such as broccoli, cauliflower, favors acidic conditions and well compacted soil (Campbell
et al., 1985). One of the conditions caused by excess magnesium is soil hardening and tightening
(compaction) (Kinsey et al., 2006). Wet field plowing as a result of intensive production in the
area also contribute to soil compaction (Reade, 2006).
7
Various studies have been conducted to improve the quality of lettuce in general. Interest in the
study of romaine lettuce also includes assessing soil and plant nutrient status to increase the
weight and the plant shelf life. Plants having taken up adequate amounts of the needed nutrients
are expected to be less susceptible to diseases or to secondary infections such as botrytis, which
greatly reduce shelf life.
Effects of copper deficiency on plants
Various plant diseases have been found to be related directly or indirectly to copper deficiency.
Wheat plants with insufficient Cu have been found to be also susceptible to stem melanosis,
which is caused by bacteria. The presence of stem melanosis was noted by Kruger et al. (1985) to
identify fields with possible Cu deficiency. Increased susceptibility of cereals to diseases when
Cu is deficient was reviewed by (Graham (1983), and included powdery mildew (Erysiphe
graminis f. sp. avenae), tan spot, ergot [Calviceps purpurea (Fr.) Tul.], take-all
(Gaeumannomyces graminis), and leaf rust. All of these diseases, except ergot, are diseases of
leaf or stem tissue. In addition to the effects on leaf disease susceptibility, evidence exists that
pollen sterility and male sterility are enhanced when Cu is deficient in cereal crops (Graham
1975 ) Cu deficient plants produced smaller anthers, and the pollen had a high incidence of
sterility. This might explain why a head disease of cereals, such as ergot, might have a higher
incidence with Cu deficiency. If the flower is not pollinated, it has a tendency to remain open for
a long period and hence become susceptible to infection by spores of the ergot fungus.
8
Copper deficiency may also play a role in increased infection because of its importance for cell
wall lignification. The most typical anatomical change induced by copper deficiency in higher
plants is impaired lignification of the cell walls. When lignification is disrupted, cell walls are
more susceptible to penetration by fungi (Graham, 1983). This condition gives rise to wilting
(impaired water transport) characteristics of distortion of young leaves, bending and twisting of
stems and twigs in cereals; and reduced disease resistance (Graham, 1983).
Excessive soil Copper Concentration
Excessive soil copper levels have not been a problem in crop production. Toxicity however,
may exist when copper is applied annually for some vegetables, either as a soil amendment or
component of fungicides (Vitosh et al., 1994). When the concentration exceeds 150 ppm in pre
harvest leaf tissue, toxicity may occur (Vitosh, 1994). Toxicity often results in plants stunting,
bluish tint to leaf color and leaf cupping followed by necrosis. The generally recommended soil
DTPA extractable Cu concentration for most vegetable crops are between 1 - 2 ppm. The rates of
soil applied Cu commonly used in highly responsive crops such as lettuce and leaf lettuce are
about 3 – 6 lbs per acre (Vitosh, 1994). A study to evaluate the effect of Cu carrier, Cu rate and
their placement was conducted on hard red spring wheat. They found broadcast application of
CuSO4 worked extremely well, but banded application (shanked into the seed line) did not
correct the deficiency. The yield obtained with broadcasted application of 23.9 lbs per acre was
more than twice as much compared to banded application of the same rate (Varvel, 1983).
Applications of 12 lb Cu and 4 lb Cu per acre for the first two crops, respectively, on virgin land
9
are usually sufficient for subsequent crops (Forsee, 1940; Kretchmer and Forsee, 1964 in
Sanchez, 1990). Sanchez, 1990 stated that no further Cu fertilization is required.
Foliar Applied Fertilizer
Foliar application of copper in the form of inorganic salts, oxides, or chelates are required as a
means of rapidly correcting copper deficiency in soil-grown plants but soil applied copper
fertilizers are more appropriate for long-term effects (Marschner, 1986).
Researchers have found that foliar feeding maintains a better overall nutrient balance within the
plant, which may not be achieved through soil uptake alone. Root distribution, soil temperature,
available soil moisture, soil-nutrient imbalance and other factors can limit nutrient absorption
through the roots. Copper is the most immobile micronutrient, so anything that inhibits new root
growth will inhibit copper uptake. Evidence indicated that when Cu was sprayed on certain
limbs of the Cu-deficient almond tree, the leaves and kernels on unsprayed limbs recovered from
the Cu deficiency and their Cu levels increased significantly, suggesting phloem mobility of Cu
(Kester et al., 1961 in Mortvedt et al., 1991).
Foliar application of fertilizer is not intended to replace soil fertility management and therefore
should be thought of as the last resort to increase the yield (Simonne, 2007). The optimum
ranges for leaf copper level for lettuce are between 5.6 and 8.2 ppm at mid growth and at pre-
harvest between 5 and 8.6 ppm (Hartz et al., 2007).
10
Soil Applied Fertilizer
Various products, liquid or dry fertilizer, to improve the yield of romaine lettuce have been
introduced and are available in the market. CATS or calcium thiosulfate (CaS2O3) is a soil
applied liquid fertilizer recommended to improve the yield of lettuce. CATS is expected to
improve plants’ uptake of micronutrients by providing slight acidity to the root zone which
promotes micronutrients availability. The mechanism is such that sulfate will combine with
magnesium or whichever is in excess and will drive the salt below the rootzone, hence reducing
the ECe (salinity) of the soil (Ruehr, 2006). Lettuce favors low salinity (ECe) therefore CATS
provides an ideal condition.
A recent study to evaluate the performance of CATS and foliar fertilizers for increasing the
weight and quality of romaine lettuce has produced a positive response (Author, 2008). Both
fertilizer methods were applied at rates recommended by each of the two suppliers, Tessenderlo
Kerley and Nutrient Technologies respectively. The amounts of nutrients applied were not
comparable between the two methods, but each was promoted to improve the yield of head and
leaf lettuce which includes romaine lettuce. Foliar applied fertilizer produced considerably more
plant weight than CATS but both foliar and CATS performed better than the control (untreated).
The mean ECe concentration (electrical conductivity in mmhos cm -1), was found to be the
lowest in the CATS applied soil, although not significantly so. The result of this study helped in
providing support to the foliar copper study.
11
The Experiment Carried Out
In this experiment we applied various rates of foliar copper in the form CuSO4.5H20 (copper
sulfate-pentahydrate ~25% Cu) on romaine lettuce planted in low copper soils (less than 1 ppm)
by extraction with DTPA (Diethylene Triamine Pentaacetic Acid). Four rates of copper sulfate
were applied in two levels, one time application (level #1) and split application (level #2) of
these different rates. The location for the experiment was Betteravia Farms, a vegetable farm in
coastal Santa Maria, California. The sites selected were fields previously tested to have low soil
copper concentration of below 1 ppm, by Diethylene Triamine Pentaacetic Acid (DTPA)
extraction. No micronutrients had been added to the soils during the recent years and no
pesticide containing copper had been applied.
Our study with foliar copper began with a field selection process at the beginning of 2008. The
establishment and completion of three consecutive experimental fields (experimental field #1, #2
and #3) began in May and completed in October of 2008.
Experimental field #4 was established in January, and completed in March, 2009. The data from
the first three experimental fields was evaluated collectively at the completion of the
experimental field #3. The data from field #4 was evaluated independently and summarized in
March , 2009.
12
Materials and Methods
The study of foliar copper application commenced early in 2008 with composite soil samples
from the top 30 cm depth being collected from the various fields scheduled to be planted with
romaine lettuce. A complete soil analysis was conducted to determine the nutrient status prior to
planting. The soil samples were air dried and pulverized to pass through a 10 mesh sieve
(<2.0 mm). This sampling procedure was used for all of the following soil analyses.
Soil Analyses
Soil pH
The pH of each sample was measured using the saturated paste method. 200 grams of the
prepared soil sample was placed into a container, deionized water was gradually added and
mixed with the soil to obtain a saturated paste. The mixture was capped and allowed to sit for
four hours prior to measuring the pH using a pH meter.
Electrical Conductivity (EC)
A saturated soil paste extract previously prepared for pH reading was used to obtain the
soil electrical conductivity (ECe).. The saturated paste was scooped into a Buchner funnel above
an Erlehnmeyer flask, connected to a vacuum pump for extraction. The extract collected was
13
used to determine soil electrical conductivity (umhos/cm) using a using the conductivity meter.
Particle Size Distribution of Soil
Particle size distribution was quantified by hydrometer using the modified Bouyoucos
hydrometer method (Butte County Soil Survey Area 612). 50 grams of soil was weighed and
transferred into 250 mL Erlehnmeyer flask. 5 grams of sodium hexametaphosphate and 150 mL
of deionized water was added to the flask and swirled. The flask was capped with a rubber
stopper then shaken for one minute. The flask was allowed to sit for five days, shaking it
vigorously two or three times a day. The sample then was transferred into a one liter graduated
cylinder and the volume brought up to one liter with deionized water, the temperature at 40
seconds of the suspension was recorded. Using a brass plunger the solution was plunged up and
down twenty times. After 20 seconds, the hydrometer was lowered into the suspension. After
another 20 seconds, the forty seconds reading of the time was recorded. The solution was
allowed to sit for six hours, after which the hydrometer was again lowered into the solution.
When the hydrometer stabilized, a second time reading was recorded followed by temperature
reading. The data was calculated to determine the percent sand, silt and clay and the soil texture
of the sample.
Plant Available Phosphorus
Plant available phosphorus was assessed by the sodium bicarbonate extraction method (Olsen
and Sommers, 1982). Two grams of soil sample was placed in a 125 mL plastic extraction
Erlenmeyer. 40 mL of 0.5 N NaHCO3 extraction solution was added to it to include a method
14
blank and standard quality control sample. The extraction vessels were then placed on an
oscillating shaker for 30 minutes and the suspension filtered immediately. 3 mL of aliquot were
measured into test bottles, 9 mL of deionized water was added to each, followed by 3 mL of
ascorbic/molybdate reagent. After ten minutes, the sample was read for plant available
phosphorus, using spectrophotometer at absorbance of 882 nm.
Exchangeable Basic Cations
An ammonium acetate extraction was made to test for the soil exchangeable K+, Ca2+, Mg2+ and
Na+ ions. 2.5 grams of soil sample was weighed and placed into an extraction vessel. 25 mL of
ammonium acetate 1N NH 4OAc extraction solution was added, and placed into a shaker for 30
minutes. These extracts were measured using the ICP-Oes to determine the concentrations of K,
Mg, Ca, and Na. The exchange capacity of the soil was determined from the ratio of the above
elements. (Thomas, 1982).
Cu2+ was analyzed using the Diethylene Triamine Pentaacetic Acid (DTPA) chelate extraction
method on the atomic absorption spectrophotometer (Lindsay and Norvell, 1978). Fields having
low copper concentration of less than the minimum recommended 1 ppm Cu were selected as
candidates for the experimental fields.
15
Sample Crop Selected for Foliar Copper Application Investigation
The romaine variety of lettuce (“Hearts Delight”) was selected for the foliar copper fertilizer
experiment. “Hearts Delight” is a light colored variety commonly sold as salad pack to
complement the darker variety and it is most often sold by weight. The minimum desired weight
is 32 lbs per carton, at 24 heads per carton which translates to 1.33 lbs per head.
Field Design and Treatment
During the early summer of 2008, the first experimental field (Exp. #1) was selected for the
copper application study on romaine lettuce. The DTPA extracted soil copper concentration of
the soil was 0.6 ppm. The soil texture was a loam (24% clay, 42% sand and 34% silt), soil pH
was 7.78. This was established in a completely randomized design. Five treatments, at two
levels of copper applications were applied, and four replicates were established in the trial for a
total of 40 experimental units. The experimental field was established within an existing field of
romaine lettuce. The experimental units used the variety “Hearts delight” direct seeded on May
3, 2008. The usual grower practice was that of soil testing prior to planting. Due to sufficient
nutrient carryover from the previous crop, no starter fertilizer (or pre plant fertilizer) were
necessary here before planting. The experimental units measured 20 feet long by 38 inches
wide. The total experimental plot including borders was one tenth of an acre.
16
The treatment rates were, starting with control (untreated soil), then 100, 200, 400 and 800 grams
of elemental copper equivalent per acre applied as a basic copper sulfate (20 % copper) as a
product of Nutrient Technologies. The two levels represented differing application times.
Level #1 constituted a one time application during the growing season, at mid-growth stage
(six to eight weeks after planting). Level #2 (split application) constituted two applications
during the growing season where half of the rate was applied at mid-growth stage and the other
half was applied the following week. The identifications codes for the treatments are listed on table 1.
Treatments #1 and #2 represent control; treatments #3, #5, #7, and #9 represent level #1 or single
application and treatments #4, #6, #8 and #10 represent level #2 (split application). Soil temperature
data were collected twice daily to determine the average daily temperature. PSNT (pre-side-
dress Nitrate testing) was conducted prior to scheduled irrigation to determine nitrogen status
and the need to apply additional nitrogen fertilizer (Hartz, 2000). The field, including the trial
plot, received no additional nitrogen, throughout the growing season. The total amount fertilizer
added to the field was recorded.
Table 1: Foliar Cu applied to romaine lettuce in grams per acre for experimental fields #1, #2 and #3 In 2008
Application level Treatment Identification code for (CuSO4) applied - (grams/acre)
#1 #2 #3 #4 #5 #6 #7 #8 #9 #10
Level #1 (one application) 0 100 200 400 800
Level #2 (split application ) 0 2 X 50 2 X 100 2 X 200 2 X 400
The foliar copper fertilizer was applied at the scheduled time and rate by using a hand sprayer
and dissolving the copper sulfate with water to deliver an application rate of 50 gallons per acre.
For example, treatment #3 for level #1 received 100 grams of copper sulfate per acre.
17
Treatment #4 for level #2 received 50 grams of copper sulfate per acre initially. The following
week, treatment #4, #6, #8, #10 for level #2 received the remaining: 50, 100, 200, or 400 grams
per acre, respectively.
Plant Tissue Sampling and Preparation
Fifteen whole leaf plant samples were collected from each of the forty experimental units, within
one week of harvest. The whole leaf samples were washed with 1% solution of liquinox (lab
ware detergent), each leaf was halved lengthwise. One half of the leaves were discarded and the
other halves were cut and placed on wire trays. All the trays containing the samples were placed
in a convection oven at temperature 40o F for 24 hours. The dried samples were ground to a fine
particle size of <1.0 mm and placed in storage bottles for further analysis.
Nitrate Nitrogen (NO3-N) in Leaf Tissue
The concentration of leaf nitrate in parts per million was determined by extraction with an
aluminum sulfate solution for subsequent determination by ion-selective electrode (ISE). The
ISE determines NO3-N by measuring an electrical potential developed across a thin layer of
water, immiscible liquid, or gel ion exchanger that is selective for NO3 ions. This layer of ion
exchanger is held in place by a porous membrane. The method has been used primarily to
determine NO3-N for assessing plant nitrogen fertility (Chapman and Pratt, 1961). The
extraction that follows is the standard practice of Betteravia Farms in-house laboratory.
0.25 grams of ground oven dried plant samples were weighed and placed in blender jars, 50 mL
of Aluminum Sulfate extracting solution (0.03 M) were added to the samples and blended for
18
one minute. The samples were measured directly using Ion Selective Electrode (Hach Sense-Ion
4). The results were compared with the grower’s record of nitrate-N sufficiency guideline for
lettuce. Vital data relative to nitrogen NO3-N and phosphate phosphorus (PO 4-P) were gained
from the laboratory testing. Although their importance does not bear directly on the subject of
this study, it is anticipated that future research into soil nutrients will deal with their significance.
Phosphate Phosphorus (PO4-P) in Leaf Tissue
The concentration of leaf phosphate phosphorus in parts per million was determined by
extraction with deionized water and subsequent determination using the spectrophotometer. The
following was the standard practice of Betteravia Farms’ in-house laboratory in Santa Maria,
California to assess plant’s phosphate sufficiency levels. 0.50 grams of oven dried ground
samples were weighed and placed in blender jars. 100 mL of deionized water and ¼ teaspoon of
charcoal was added to the solution and blended for one minute. The samples were filtered
through Whatman #2 filter paper and the filtrates analyzed using Hach DR2000
spectrophotometer at 890 NM.
Metal Ion Concentrations in Leaf Tissue
Dry ash method quantitatively determines the concentrations of potassium (K+) and
copper (Cu 2+) using a high temperature dry oxidation of the organic matter and dissolution of
the ash with hydrochloric acid. One gram of the plant samples were weighed and placed in
porcelain crucibles. Each crucible was placed in a muffled furnace with ramp temperature to
500oC over two hours, then ashed for four hours at an additional 500oC. The samples were then
19
allowed to cool at room temperature in the oven with the door slightly open. After cooling, each
sample was dissolved with 10 ml of 1.0 N Hydrochloric acid. The contents were transferred into
50 ml volumetric flask and diluted to volume with deionized water. The flasks were capped and
inverted three times and filtered through Whatman #2 filter paper into sample beakers. Each
sample was analyzed for the percent potassium (K+) and parts per million of Cu++ using atomic
absorption spectrometry (AAS). The level of leaf copper in each treatment was compared to the
established recommended DRIS pre-harvest optimum level for lettuce (Hartz et al., 2007).
Field Harvest Procedures On the scheduled harvest day, a commercial harvester was used to cut all the marketable heads
of romaine in each experimental unit. A total of 480 heads of romaine were weighed and
measured in the field. Evaluation was done on weight per plant basis as opposed to cartons per
acre, considered as the best method to evaluate the treatments. One box of romaine lettuce heads
from each treatment was randomly selected and weighed in the field and then placed into cold
storage (using a commercial cooler). These boxes were retrieved after one week for further
evaluation by Betteravia Farms’ quality assurance person for of the shelf life and quality of the
plants.
Experimental Field #2
The experiment was repeated (replicated) in a nearby field where the soil texture was loam (24%
clay, 46 % sand, 30 % silt), soil pH was 7.32. The initial DTPA extractable soil copper level was
0.53 ppm . The same light variety of romaine lettuce (“Hearts delight”) was planted in June 17th
20
and harvested in August 21st, 2008. The field received no fertilizer prior to planting. Based on
the PSNT (pre side dress nitrate testing) conducted between irrigation schedules the field
received no additional fertilizer through the life cycle of the crop. As in the previous
experimental field #1, no copper fertilizer or copper containing fungicide had been applied to the
field in recent years.
Experimental Field #3
The experimental field #3 was established in a field of romaine lettuce where the soil texture was
loam (18% Clay, 48 % sand, 34 % silt), the soil pH was 7.70. The initial DTPA extractable soil
copper level was 0.65 parts per million. Light colored variety of romaine (“Heavy Heart”) was
planted in August 5th and harvested in October 13th, 2008. “Heavy heart” is the same light
colored variety as “Hearts delight”. This change in romaine variety was due to its only
availability of light variety in the fall planting season.
Similarly, the first foliar copper sulfate application was made between six to seven weeks after
planting, and the second foliar copper sulfate application was made one week later. The
treatments applied for level #2 were the same as those used for level #1 on the same plots (as
listed in table 1). As in the first experimental field, the second and the third experimental fields
were harvested by using a commercial harvester. The harvest and evaluation procedure was
identical to the one done in the first field assurance official.
21
Experimental Field #4
In 2009, we placed an additional experimental field, transplanted in a field of romaine lettuce
where the soil texture was sandy loam (8% Clay, 70 % sand, 22 % silt). The initial DTPA
extractable soil copper level was 0.8 parts per million and the pH was 7.36. The same light
colored variety of romaine Hearts Delight was planted in January 7 and harvested in
March 20, 2009.
The treatment rates were modified, as listed on table 2. Starting with control (untreated soil),
then 200, 400 and 500 grams of elemental copper equivalent per acre applied as a basic copper
sulfate (20 % copper) as a product of Nutrient Technologies. All the three rates of Cu fertilizer
were applied at once, and replicated five times for a total of 20 experimental units.
The foliar copper sulfate application was made between six to seven weeks after planting and
plant tissue sampling was done one week before harvest. As in the previous experimental fields,
harvesting was done using a commercial harvester and the evaluation procedure was identical to
the previous fields. Five representative commercial boxes of romaine lettuce were placed into
the cool storage for five days prior to further evaluation by a quality assurance official.
Table 2: Foliar Cu applied to romaine lettuce in grams per acre Experimental Field #4 Jan - March 2009
CuSO4 (grams/acre)
Treatments #1 #2 #3 #4
Rate 0 200 400 500
22
Table 3: Summary of the time frame, planting method and pertinent features of the soils in
the four experimental fields
Experimental
Fields Plant date Harvest
date
Method
# of days
Soil Texture
Soil Cu (ppm) Soil pH
#1 1-May-08 14-Jul-08
Direct seeded 71 loam 0.6 7.78
#2 17-Jun-08 21-Aug-08
Direct seeded 65 Loam 0.53 7.32
#3 5-Aug-08 13-Oct-08
Direct seeded 69 loam 0.65 7.7
#4 7-Jan-09 20-Mar-9
transplant 72
sandy loam 0.8 7.36
Statistical analysis of the final plant data
The final plant data relative to Cu application were evaluated using statistical analysis to
determine whether any of the treatments had a statistically significant effect on the weight and
quality of the romaine lettuce. The statistical analysis also permitted the differentiation between
the single (one time application) and the split application of foliar copper sulfate. The data was
analyzed using SAS program version 4.1 and Minitab.
The Experimental field #4 was analyzed independently using the same statistical program and
analysis.
23
Results
For the experimental Fields #1, #2 and #3
The concentration of leaf NO 3-Nitrogen, PO4-Phosphorus and K 2O-potassium were well within
the sufficiency level at harvest in all plant samples. The data was analyzed collectively as
randomized complete block design, blocked by the experimental fields. The analysis of variance,
general linear model, was used to evaluate the effect of the experiment on the weight of the
romaine (lbs/plant). A significant difference was identified between the mean weights of the
romaine (lbs/plant) of the three experimental fields with p value< 0.0001 (table 4). The
experimental field #3 was harvested one week earlier than scheduled which became apparent by
the low overall mean weight per plant in all of the subsequent treatments (table 6). As shown on
the analysis of variance on table 4, no significant difference was found in the weight increase
(lbs/plant) due to neither the level of application (p value 0.5137), nor due to the treatments with
Cu sulfate, p value 0.5972. The interaction between the levels of application and treatments was
not statistically significant, p value 0.2796. However, in the three experimental fields, the plants
responded with the increase of mean weight due to the treatments (table 6). In the experimental
fields #1 and #3 the highest mean weight increase was obtained by a one time application of
200 grams/acre of CuSO4 (Treatment #5). In experimental field #2 a one time application of
400 grams per acre of CuSO4 (Treatment #7) produced the highest mean weight (table 6). The
optimum weight increase in experimental fields #1, #2 and #3 were 4.4, 6 and 4.5 percent
respectively (table 7).
24
The effect of the treatments (foliar Cu sulfate) on the uptake of Cu by plants was most significant
at p value <0.0001 as shown on statistical analysis table 5. Cu uptake by plants due to the level
of applications was also significant at p value 0.0187. Level #2 (split application) produced a
higher leaf Cu uptake than level #1 (one time) application, as illustrated by the graph on fig. 2.
No significant interaction was identified between the level of application and the treatments with
CuSO4.
Table 4: Analysis of variance table for the effects of the experimental fields, the levels, the treatments and the interaction between the levels and the treatments on the weight of the plants.
Source DF Sum of Squares Mean Square F Value Pr > F
Model 11 1.51904710 0.13809519 35.59 <.0001
Error 108 0.41910026 0.00388056
Corrected Total 119 1.93814736
Source DF Type I SS Mean Square F Value Pr > F
Expt 2 1.48661613 0.74330806 191.55 <.0001
level 1 0.00166582 0.00166582 0.43 0.5137
TRT 4 0.01078459 0.00269615 0.69 0.5972
level*TRT 4 0.01998057 0.00499514 1.29 0.2796
25
Table 5. Analysis of variance table for the effect of the experimental fields, level of application and the treatments, on leaf Cu concentration (ppm).
Source DF Sum of Squares
Mean Square
F Value
Pr > F
Model 11 785101.8181 71372.8926 46.57 <.0001
Error 108 165531.8131 1532.7020
Corrected Total
119 950633.6312
Source DF Type I SS Mean Square F Value Pr > F
Expt 2 74656.5776 37328.2888 24.35 <.0001
level 1 8741.5470 8741.5470 5.70 0.0187
TRT 4 698211.5538 174552.8884 113.89 <.0001
level*TRT 4 3492.1398 873.0349 0.57 0.6852
Table 6: The mean weight of romaine lettuce (lbs/ plant) due to the treatments.
Treatment # Exp #1
Exp #2 Exp #3
1 1.283 1.327 1.137
2 1.252 1.325 1.135
3 1.306 1.342 1.106
4 1.297 1.396 1.098
5 1.341 1.392 1.188
6 1.313 1.376 1.051
7 1.290 1.408 1.092
8 1.322 1.360 1.043
9 1.313 1.390 1.053
10 1.298 1.387 1.158
26
Table 7. Summary of the plants’ weight increase due to the treatments in the experimental Fields: #1, #2 and #3
Cu SO4
Exp Fields (grams/ac) Level Untreated wt final wt % increase
#1 200 one time 1.283 1.341 4.4
#2 400 one time 1.327 1.408 6
#3 200 one time 1.136 1.188 4.5
The established optimum concentration of leaf Cu at harvest is between 5 and 8.6 ppm
(Hartz et al., 2007). The untreated control (treatments #1 and #2) in all of the three experimental
fields had sufficient amounts of copper in the leaf tissue at harvest. The highest mean weights
were achieved by plants having mean leaf copper concentrations of: 38.050, 110.628 and 87.885
ppm in the experimental fields #1, #2 and #3 respectively (table 8).
Table 8: Summary of the weight of the romaine lettuce relative to the leaf cu concentration at harvest
Exp. Field #1 Exp. Field #2 Exp. Field #3 Weight Leaf Cu Weight Leaf Cu Weight Leaf Cu Treatment # lbs/plant ppm Lbs/plant ppm lbs/plant ppm
1 1.283 10.188 1.327 6.031 1.137 16.368
2 1.252 11.538 1.325 7.00 1.135 22.65
3 1.306 12.688 1.342 35.53 1.106 53.875
4 1.297 37.710 1.396 27.838 1.098 58.738
5 1.341 38.050 1.392 42.36 1.188 87.885
6 1.313 58.250 1.376 53.734 1.051 123.075
7 1.290 73.737 1.408 110.628 1.092 120.188
8 1.322 85.597 1.360 85.942 1.043 228.018
9 1.313 174.637 1.390 201.17 1.053 276.015
10 1.298 241.660 1.387 747.79 1.158 289.748
27
Fig. 2: The effects of the treatments, the experimental fields and the application level on the uptake of leaf Cu
8004002001000
200
150
100
50
321
21
200
150
100
50
TRT
Mean
leaf
Cu
(ppm
)
Expt
level
Fig. 3: The correlation between leaf cu concentration (ppm) and the weight of the romaine (lbs)
300250200150100500
1.50
1.45
1.40
1.35
1.30
1.25
1.20
leaf Cu (ppm)
mean weight (lbs/plant )
S 0.0619299
R-Sq 8.5%
R-Sq(adj) 6.1%
28
Results
For the Experimental field #4
As in the previous experimental fields, the concentration of leaf NO 3-Nitrogen, PO4-Phosphorus
and K 2O-Potassium were well within the sufficiency level at harvest in all plant samples.
The statistical analysis of the data from the experimental field #4 indicated no significant
difference p value 0.190, between the mean weights of the romaine due to the treatments, as
shown on the analysis of variance table (table 9). However, as in the previous three experimental
fields, the plants responded with an increase in weight as recorded on table 10.
The overall mean weights in all of the treated and untreated plants in this field were higher than
the treated plants in the three previous experiments. As illustrated in Fig.5, the treatment with
200 grams per acre of Cu sulfate, produced the highest mean weight. Treatment #4 (500
grams/acre) produced better result than #3 (400 grams/acre), table 10. The optimum weight
increase in the experimental field #4 was 7.58%, obtained by treatment #2 (200 grams/acre),
shown on table 11.
Table 9: Analysis of variance table for the effect of treatments on the weight of the romaine in experimental field #4.
One-way ANOVA: weight versus treatment
Source DF SS MS F P treatment 3 0.02953 0.00984 1.79 0.190 Error 16 0.08811 0.00551 Total 19 0.11763 S = 0.07421 R-Sq = 25.10% R-Sq (adj) = 11.06%
29
Table 10: The effect of treatments on the weight and leaf cu concentration at harvest on experimental field #4
Treatment # grams/ac Weight (lbs/plant) Leaf Cu (ppm)
1 0 1.522 7.035
2 200 1.638 26.764
3 400 1.549 41.766
4 500 1.608 38.516
Table 11: Summary of the plants’ weight increase due to the treatments
in the experimental field #4
Treatment Grams/acre Control (0) Treated weight % wt increase
#2 200
1.5224
1.6378 7.58
#3 400
1.5224
1.549 1.75
#4 500
1.5224
1.6085 5.65
Fig.4: The effect of the treatments on the mean weight of the plants in Experimental field #4
4(500)3(400)2(200)1(0)
1.650
1.625
1.600
1.575
1.550
treatment # in grams per acre
Mean weight (lbs/plant)
The effect of the treatm ents on the w e ight of the plants
1.65 lbs
30
Summary of experimental fields #1, #2 and #3
Vitosh et al. (1994) suggested that toxicity may occur when leaf copper concentration
exceeds 150 ppm in pre harvest leaf tissue. In all the experimental fields, herein the highest
weight per plant had less than 150 ppm leaf copper at harvest. Weight declines were observed
at harvest leaf copper concentrations of 58.25, 85.9 and 123 ppm (table 8). No evidence of
toxicity such as bluish tint or cupping on the leaf tissue was observed in the plants having copper
concentration as high as 290 ppm but excessive copper may have contributed to the weight
decline.
Harvesting the plants one week too early as in the case of field #3 produced significantly lower
plants’ mean weight than those harvested on time. The mean weight of experimental field #3 was
21 percent lower than the previous two experimental fields (table 6). The variety used in
experimental #3 was although the similar light colored variety, was not the same therefore, may
have had some influence on the outcome.
The effect of leaf Cu on the mean weight of romaine was evaluated to include only experimental
field #1 and field #2. As shown on fig. 3, an upward trend of weight per plant was apparent,
which peaked around 100 ppm leaf Cu and decreases thereafter. However, the correlation
between the weight and leaf Cu concentration was not statistically significant (R Sq 8.5%).
Post harvest evaluation was conducted by the growers’ quality assurance official. Representative
samples of each treatment are illustrated in fig. 5, 6, and 7. All experimental plants were found to
be of acceptable quality for sale and sale after one week in cold storage.
31
Fig: 5. Photograph illustration of samples from untreated and treated experimental units after one week in cold storage
Fig.6. Photograph illustration of untreated control and treatment #7 (400 g/acre) after one week in cold Storage.
32
Fig. 7: Photograph illustration of samples from untreated control and treatment #9 (800 grams/acre) after one week in cold storage
The expected minimum weight for commercial romaine lettuce is 32 lbs per carton of 24 plants
(growers’ communication), and equivalent to 1.33 lbs per plant. A carton of romaine lettuce
weighing 35 lbs (1.46 lbs/plant) falls into the category of premium grade, the weight should not
exceed 40 lbs. The optimum weight increase due to the treatments for each of the individual
experimental fields was previously discussed and summarized on table 7.
33
As shown in Fig. 8 the application level 1 (one time application) produced significantly better
results than level #2 (split application). The combined experimental fields indicated that,
treatments #5 (a one time application) of 200 grams per acre of Cu sulfate produced the best
result in increasing the weight of the romaine. Treatment #10 (split application of 800
grams/acre) also responded, in weight increase, although the cost of double application may
outweigh the benefit. One time application of 400 grams/acre of CuSO4 may proof to be more
economically beneficial, as previously summarized on table 7 (page 26).
Fig.8: The effect of the application level and treatments on the mean weight of the plants in Experimental fields #1, #2 and #3
21
1.29
1.28
1.27
1.26
1.25
1.24
1.23
10987654321
leve l
Leve l #1 T rea tm ents #
Mean weight (lbs/plant)
trea tm ent
34
Summary of experimental field #4- confirming previous observations
As shown on table 10, the highest increase in weight in the experimental Field #4 was obtained
by the application of 200 grams per acre of Cu sulfate. The mean weights of the untreated plants
in the experimental field #4 were higher than the maximum weights per plants observed in the
three previous experiments. Soil texture was sandy loam 8% clay for the experimental field #4,
whereas in the three previous experimental fields the soil texture were loam 18-24% clay, a
factor which must be noted. The mean soil Cu concentration on field #4 at 0.8 ppm was slightly
higher than the three experimental fields at 0.5-0.6 ppm. The two factors combined may have
influenced the outcome.
It was apparent that the overall mean weights of the plants in field #4 were higher than the
previous three fields. The untreated field has a mean weight equivalent to 36.5 lbs/carton which
would be considered premium. As in the previous three experimental fields, the mean leaf Cu
concentration was sufficient at 7.035 ppm, with a mean soil Cu concentration of 0.8 ppm.
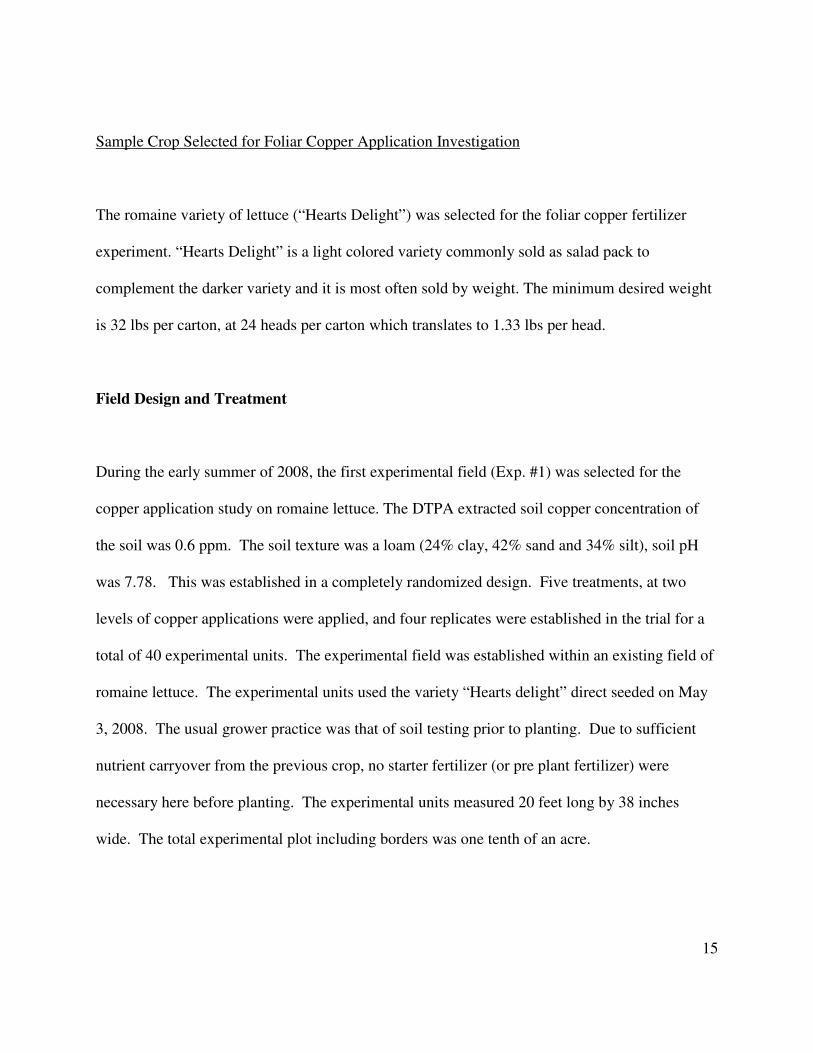
Fig.9 illustrates the treated and untreated samples from field #4, at harvest.
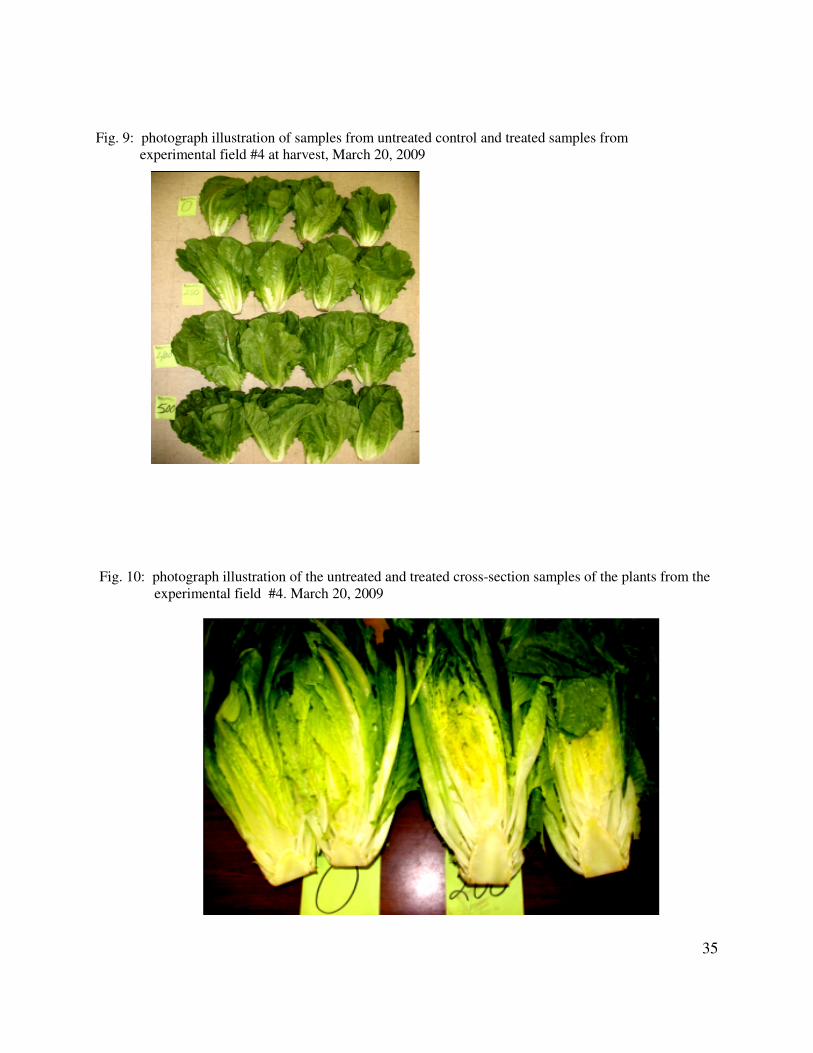
From photograph illustration of the untreated and treated cross-section samples of the plants in
the experimental field #4 (Fig. 10), we observed larger core area and leaf density on the treated
plants as compared to the untreated.
35
Fig. 9: photograph illustration of samples from untreated control and treated samples from experimental field #4 at harvest, March 20, 2009
Fig. 10: photograph illustration of the untreated and treated cross-section samples of the plants from the experimental field #4. March 20, 2009
36
Conclusions:
The application of foliar fertilizer does not replace good soil nutrient management. However, the
result of these experiments indicated that romaine lettuce grown in low copper soils
(<1 ppm DTPA extractable copper), responded to and benefited from the application of foliar
copper sulfate.
37
References
The Agricultural Commissioner’s Office Santa Barbara County, California.
2007 Annual Crop Report
Author, 2006. On-Site experiment, Betteravia Farms, Santa Maria, California.
Author, 2008. On- Site survey, Betteravia Farms Laboratory. Santa Maria, California
Beverly, R. B., and V. L. Guzman. 1985. Lettuce varietal response to soils and foliar nutritional applications on Terra Ceia muck. Soil Crop Sci. Soc. Fla. Proc. 44:88-90. Bradford, G. R.J. Arkley, P.F. Pratt, and FlL. Bair. 1967. Total content of nine mineral elements In fifty selected benchmark soil profiles of California. Hilgardia 38:541-556. Brown,A.L. and G.J. deBoer.1983.Soil tests for zinc, iron, manganese and copper.
In: H.M. Reisenauer (ed.).Soil and plant tissue testing in California. Univ. Calif. Bulletin 1879.
Campbell, R.N., A.S. Greathead, D.F. Myers, and G.J. De Boer. 1985.
Factors related to control of clubroot of crucifers in the Salinas Valley of California. Phytopathology 75:665-670
Chapman, H.D. and P.F. Pratt. 1961. Methods of analysis for soil, plants and waters, Priced Publication 4034. Berkeley: University of California, Division of Agriculture Sciences. Cooper, A.J. 1973. Root temperature and plant growth Research review No.4, Commonwealth Bureau of Horticulural and plantation crop, East Maling,
Madison, Kent, UK.
Fageria et al., V.C. Baligar and R.B. Clark 2002. Micronutrients in crop protection, Adv.Agron.77:185-268
Forsee, W. T. 1940. "Recent plant responses to some micronutrient deficiencies on Everglades peat . soil Sci. Soc. Fla. Proc. 2:53-58.
Franzen, D. W., M.V. McMullen and D.S. Mosset. 2008. Spring wheat and durum yield and disease responses to copper fertilization of mineral Soils. Agron J 100:371-375
38
Graham, R.D.1975. Male sterility in wheat plants deficient in copper. Nature 254:514-515.
Graham, R.D., and M.J. Webb. 1990. Micronutrients and disease resistance and tolerance
in plants. P.329-370. In J.J. Mortvedt et al. (ed.) Micronutrients in agriculture. 2nd ed. SSSA Book Ser.4.SSSa. Madison, WI.
Graham, R.D. 1983. Effects of nutrient stress on susceptibility of plants to disease with
particular reference to the trace elements.p.222–276. In H.W. Woolhouse (ed.) Advances in botanical research. Vol. 10. Academic Press, New York
Hartz, T.K., Williams E., and R.F. Smith 2007. Establishing lettuce leaf nutrient optimum ranges through DRIS analysis. HortScience 42(1):143-145. Hartz, T.K., W.E. Bendixen and L. Wierdsma. 2000. The value of pre-sidedress soil
nitrate testing as a nitrogen management tool in irrigated vegetable production. HortScience 35:651-656.
Kinsey, Neal and Charles Walters. 2006. Hands on Agronomy
ISBN: 0-911311-95-5 pp 85-90 Kretchmer, A. E., and W. T. Forsee. 1964. "The use and effectiveness of various copper bearing materials for application to Everglades organic soils." Soil Sci. Soc. Am. Proc. 18:471-474.
Kruger, G.A., R.E. Karamanos, and J.P. Singh.1985. The copper fertility of
Saskatchewan soils. Can.J.Soil Sci.65:89:99. Kubota, John. 1983. Copper Status of United States Soils and Forage Plants.
Agronomy Journal 75:913-918 Kubota, John, R.M. Welch and D.R. Van Campen. 1987. Soil related nutritional problem
areas for grazing animals. Adv. Soil Sci.6, 189-215
Lindsay, W.L.and W.A. Norvell. 1978. Development of a DTPA soil test for zinc, iron, manganese and copper. Soil Sci.Soc.amer.J.42:421-428.
39
Marschner, Horst. 1986. Mineral Nutrition of Higher Plants. Academic press Second Edition-2002. ISBN 0-12-473542-8 p344 -479 Mordtvedt, J.J., F.R. Cox, L.M Shuman and R.M. Welch. 1991. Micronutrients in
Agriculture. SSS of America. Madison, Wisconsin, USA. P.280-339 Olsen, S.R. and L.E. Sommers.1982.Phosphorus, p.403-430.
In: A.L. Page, R.H. Miller, and D.R. Keeney (eds). Methods of soil analysis: Part 2 Chemical and microbiological properties. ASA Monograph Number 9.
Sanchez, C. A. 1990. Soil testing and fertilization recommendations for crop production on organic soils in Florida." Fla. Agr. Exp. Sta. Bull. 876, 44 pp.
Reade, C. 2006. Betteravia Farms, Santa Maria, California.
2006. personal communication. Robson, A.D., and Reuter, D.J. (1981). Diagnosis of copper deficiency and
toxicity, In ’Copper in Soils and Plants’ (J.F. Loneragan, A.D. Robson and R.D. Graham, eds.), pp.287-312. Academic Press, London.
Ruehr, Thomas A. Cal Poly Univ. San Luis Obispo. 2006 Personal communication. Simonne, E.H. and G.J. Hochmuth. Soil and fertilizer management for vegetable
production in Florida. 2007. Horticultural Sciences Dept.,UF/IFAS, fla. Coop. Ext. Service
Soltanpour, Parviz N, Greg W, Johnson, Stephen M. Workman, J. Benton Jones, Jr., and
Robert O. Miller. 1996. Inductively coupled plasma emission spectrometry and inductively coupled plasma-mass spectroscopy. Pages 91 – 139. in Sparks, D. L., A. L. Page, P. A. Helmke, R. H. Loeppert, P. N. Soltanpour, M. A. Tabatabai, C. T. Johnson, and M. E. Sumner (eds.) Methods of soil analyses Part 3 Chemical Methods. Soil Science Society of America, Inc. and American Society of Agronomy, Inc., Madison, WI
D.R. Keeney (eds). Methods of soil analysis:Part 2. Chemical and microbiological properties. ASA Monograph Number 9.
Varvel, G.E..1983. Effect of banded and broadcast placement of Cu fertilizers on
correction of Cu deficiency. Agron. J. 75:99-101
Vitosh, M.L., Warncke, D.D. and R.E. Lucas. 1994. Secondary and micronutrients for vegetables and field crops. Department of Crop and Soil Sciences, Michigan StateUniversity Extension. Bulletin E-486, revised


![[PPT]Презентация · Web viewPlant cultivation (grade B) Universal fertilizer suitable for practically all kinds of soils and crops Suitable for FOLIAR application Natural](https://static.documents.pub/doc/80x56/5aadd1527f8b9a3a038b6626/ppt-viewplant-cultivation-grade-b-universal-fertilizer.jpg)