40
October 2016 The best laid plans Why the Investment Plan for Europe does not drive the sustainable energy transition
October 2016
The best laid plansWhy the Investment Plan for Europe does not drive the sustainable energy transition
Authors list:Anna Roggenbuck, CEE Bankwatch NetworkMarkus Trilling, CEE Bankwatch Network/Friends of the Earth Europe
Acknowledgements:Sebastian Godinot, WWFXavier Sol, Counter Balance
Editing and design:David Hoffman, CEE Bankwatch Network
This publication has been produced with the financial assistance of the European Union. The content of this publication is the sole responsibility of CEE Bankwatch Network and Friends of the Earth Europe and can under no circumstances be regarded as reflecting the position of the European Union. This publication has been produced with the assistance of the Think Tank Fund of the Open Societies Institute.

ContentsExecutive summary ......................................................................................................................................................................... 4
Introduction ........................................................................................................................................................................................ 7
I. EFSI contribution to its strategic general objectives ......................................................................................................... 9
II.Does the EFSI contribute to the development of a renewables-based, energy efficient and fossil fuels-free economy? .................................................................................................................19
III. Is the EFSI additional? Complementarity of EFSI and EIB investments in the energy and transport sectors ..........................................................................................................................................24
Recommendations ..........................................................................................................................................................................34
Endnotes ............................................................................................................................................................................................36
The best laid plans: why the Investment Plan for Europe does not drive the sustainable energy transition4
Executive summary
The European Fund for Strategic Investments (EFSI), launched in spring 2015 jointly by the European Commission and the EIB Group – the European Investment Bank and European Investment Fund – is an initiative to mobilise private investments and catalyse new projects that implement strategic, transformative and productive invest-ments with high economic, environmental and societal added value1.
The EUR 315 billion investment target is to be reached with financing from the EIB for projects carried out by private or public promoters and based on a guarantee of EUR 16 billion from the EU budget, complemented by a EUR 5 billion allocation from the EIB’s own resources.
The EFSI should play an important role in the fight against climate change and for environmental protection. The EFSI should also support projects in line with the Union’s energy, climate and efficiency targets outlined in the Europe 2020 strategy and in the 2030 and 2050 frameworks for climate and energy policies.
CEE Bankwatch Network, Climate Action Network Europe, Counter Balance, Friends of the Earth Europe and WWF ana-lysed 93 projects approved by July 2016 under the Infrastructure and Innovation Window of the EFSI in order to judge its additionality and added value for meeting these EU objectives. In addition, the analysis compares these projects to standard EIB investments to assess to what extent the EFSI complements the EIB’s business-as-usual portfolio.
The report concludes that the EFSI cannot yet guide a sustainable energy transition in the European Union until deep reforms are made. Indeed, the EFSI fails to reach its objectives in the following areas:
1. Sustainability
Despite claims by the EIB and the European Commission that the EFSI is a strong contributor to the fight against climate change, there is a dark side to these climate contributions, mainly found in two sectors:
• In the energy sector, while we welcome the large amount of support for renewables and energy efficiency, the EFSI also provides significant funding for fossil fuels – in particular gas infrastructure – which has leveraged EUR 1.5 billion in additional investments into fossil fuel infrastructure; and
• In the transport sector, 68 per cent of EFSI support benefits high carbon projects (including motorways and airports), with a strong focus on motorways via public-private partnerships, in particular in the wealthier Member States (Germany, the Netherlands, France and the United Kingdom).
These types of investments are a far cry from the innovative and zero-carbon projects that will help Europe meet the objectives of the Paris Agreement.

The best laid plans: why the Investment Plan for Europe does not drive the sustainable energy transition 5
2. Geographical distribution
While the EFSI supported infrastructure and innovation projects in 19 Member States, three western European countries benefitted the most: more than half of EFSI operations (52 per cent) are located in the UK, Italy and France. Since the EFSI is required to contribute to the EIB’s cohesion objective and complement support from the European Structural and Investment Funds (a part of the EU Budget), it is puzzling that the 13 newest EU Member States – where most territories are less-developed regions – attracted only 12 per cent of EFSI guarantees so far.
This is less than conventional EIB lending without EFSI.
Geographical considerations are also problematic in a sectoral breakdown of EFSI lending. In its first year, the EFSI was biased towards energy projects, which constituted 39 per cent of total approved and signed operations. Within the a key area of this sector – energy efficiency – 93 per cent of the volume was spent in the UK alone.
3. Additionality
Additionality for the EFSI is defined as support of operations which address market failures or sub-optimal investment situations and which could not have been carried out, or not to the same extent, by the EIB, the EIF or under existing EU financial instruments without EFSI support2.
Yet since the creation of the EFSI, the EIB has not financed energy projects to the extent it did so in the past. In particular, in 2016 EIB lending for renewables was limited, and this coincides with the high concentration of EFSI support for the energy sector. This suggests, therefore, that the EFSI has to some extent replaced conventional EIB lending, instead of complementing it.
4. Transparency
To date the EIB and European Commission have struggled to demonstrate the benefits of the EFSI for one main reason: a lack of transparency about the merits of specific EFSI projects. There is currently almost no informa-tion disclosed at the project level, including the main evaluation tool used to assess the benefits of a particular EFSI projects.
Recommendations
The report makes recommendations for decision-makers in order to address these shortcomings. These propos-als should be adopted by the European Parliament and the Council within the proposed legislation3 that sets out the future orientation and legal framework for EFSI operations beyond 2018 until 2020:
1. Improve sectoral and geographical balance to enhance cohesion and sustainable development objectives
• The EFSI should cover a broader range of sectors to allow projects (and clients) outside the scope of normal EIB operations to benefit from this public financial instrument. This is all the more relevant in the dominant sectors like energy and transport.
• The EFSI should further diversify its geographical distribution. France, Italy, Spain and UK are already the main recipients of EIB lending, so the EFSI must add to this across the Union, especially for sectors lacking financing (as the example of the hight concentration renewables and energy efficiency in the UK suggests).
• Additionally, the EFSI should pay special attention to the new EU Member states (EU 13), especially in crucial sectors like modernising and improving the productivity and sustainability of economies through RDI for clean energy, telecommunications and the circular economy. Given that those countries receive significant financial resources from the European Structural and Investment Funds (ESIF), a combination with the EFSI should open opportunities to develop sustainable and viable projects in innovative areas of the economy that have not been well funded in the past.
• The EFSI should further promote energy efficiency projects in countries with relatively-higher energy intensive economies, notably within the EU 13.
• In the renewable energy sector specifically, the EFSI should avoid concentrating on one technology and support instead less developed technologies with a higher risk profile and projects of smaller scale. Such support could come in the form of pro-active technical assistance and innovative financial structuring such

The best laid plans: why the Investment Plan for Europe does not drive the sustainable energy transition6
as investment platforms or community-driven, clean energy projects.
2. Re-direct investments to ensure sustainability
• In the transport sector, EFSI support for high-carbon operations like motorways and airports should be avoided across the EU. The EFSI should redirect its support for measures that reduce transport needs, promote public transport, and support research and innovation for sustainable mobility.
• In the energy sector, the EIB should target that 100% of EFSI financing is climate proof and contributes to climate action in line with the objectives of the Paris Agreement i.e. ending support for fossil fuels. There is no reason for the EFSI to support investments like gas transmission and distribution networks when these already have received increased support from the EIB.
3. Ensure clear additionality in the energy and transport sectors
• The EFSI should provide substantial additionality to the EIB’s business-as-usual portfolio in the energy sector and should not crowd out or replace conventional EIB financing.
• The EFSI should seek to finance energy efficiency projects in addition to those already financed by the EIB. In other words, more emphasis should be placed on developing energy efficiency investment platforms to enable the bundling of small-scale projects that struggle to access public financing via conventional finance vehicles.
4. Improve transparency at the project level
The EFSI should provide a transparent justification of the added-value and additionality of the projects it fi-nances. For the time being, little information is disclosed regarding the expected impacts and the additionality of these projects. Since this information should be mentioned in the ‘scoreboard’ used by EFSI governing bodies to judge the merits of a specific project, the timely disclosure is necessary of such a scoreboard for every EFSI project before it is signed .

The best laid plans: why the Investment Plan for Europe does not drive the sustainable energy transition 7
Introduction
The European Fund for Strategic Investments (EFSI), launched jointly by the European Commission and the EIB Group – the European Investment Bank and the European Investment Fund – is part of an initiative to help mo-bilise private investments and catalyse new projects which implement strategic, transformative and productive investments with high economic, environmental and societal added value4.
This initiative, the ’Investment Plan for Europe’, aims at:• triggering additional investment of at least EUR 315 billion over a three year period (mid-2015 to mid-2018)
(pillar 1, role of the EFSI);• ensuring investments reach the real economy, e.g. via the creation of the European Investment Project Portal
and by increasing technical assistance to project promoters through the European Investment Advisory Hub (pillar 2); and
• improving the investment environment through policy reform (pillar 3)5.
The EUR 315 billion investment target should be reached through financing provided by the EIB for projects carried out by private or public promoters and based on a guarantee of EUR 16 billion from the EU budget, com-plemented by a EUR 5 billion allocation of the EIB’s own resources. The EIB should provide funding only for those economically-viable projects that have a higher risk profile than ordinary EIB activities. It is to focus on various sectors, including:
• Digital, transport and energy infrastructure;• Education, research, development and innovation;• Expansion of renewable energy and resource efficiency;• Support for smaller businesses and midcap companies6.
Unlike previous capital increases at the EIB that aimed to counter economic turbulence within the EU, the EFSI was established as a distinct facility to complement the EIB’s core activities, separately from the bank’s standard portfolio. The EFSI allows the bank to sustain its lending volumes of EUR 64 billion annually within the EU, which otherwise would have fallen to EUR 44-57 billion7, which is what the EIB can muster with standard borrowing and lending. The EFSI is also marked by another important difference to normal EIB lending in that it increases the volume of the bank’s higher risk ‘Special Activities’ within the EU from EUR 5.5 billion to EUR 21.5 billion. The EFSI will cover EUR 16 billion annually in Special Activities , for a total of at least EUR 68 billion in investment facilitated by the EFSI8.
The legislation establishing the EFSI9 sets out various principles related to EU objectives on climate change and

The best laid plans: why the Investment Plan for Europe does not drive the sustainable energy transition8
environmental protection to which the instrument must comply. The EFSI should support projects in line with the Union’s energy, climate and efficiency targets laid down in the Europe 2020 strategy and in the 2030 and 2050 frameworks for climate and energy policies10. This report analyses to what extent the EFSI, after a year of operations, is meeting these objectives. The report provides a sectoral analysis in order to judge the additionality and added value of the EFSI with respect to regu-lar EIB investments. A specific emphasis is given how EFSI investments contribute to reaching the climate and environmental objectives of the EU.
In its communication ‘The Road from Paris: assessing the implications of the Paris Agreement’11, the European Commission reiterated the EU’s commitment to a clean energy transition in order to limit global warming to well below 2°C above pre-industrial levels, and to pursue efforts to limit the temperature increase to 1.5°C. On a global scale the full implementation of such a climate plan would require investments of USD 13.5 trillion in energy efficiency and zero-carbon technologies from 2015 to 2030, an annual average of USD 840 billion for mainly renewables and energy efficiency (led by the transport and buildings sectors)12. At the European level, the Commission explicitly set the EFSI to play a leading role in meeting these financing needs.
The structure of the report is as follows:
• The first part provides an overview of the EFSI Infrastructure and Innovation Window, evaluating 93 projects disclosed as of July 2016. It analyses how the current portfolio contributes to building a decarbonised economy in the energy and transport sectors;
• The second part analyses to what extent EFSI operations complement and strengthen the EIB’s standard portfolio by assessing the impact of the EFSI on the bank’s overall portfolio performance in the energy and transport sectors and its contribution to a clean energy transformation. This is based on the assumption that the EFSI constitutes a distinctive pipeline, which should complement rather than crowd out or replace standard EIB financing.
Both parts are followed by recommendations for the future orientation and legal set-up of the EFSI. The report concludes that the EFSI must still deliver a renewables-based and energy efficient-development and recom-mends that in regards to its sectoral and geographical distribution, EFSI operations must be better aligned towards climate policy objectives.
The best laid plans: why the Investment Plan for Europe does not drive the sustainable energy transition 9
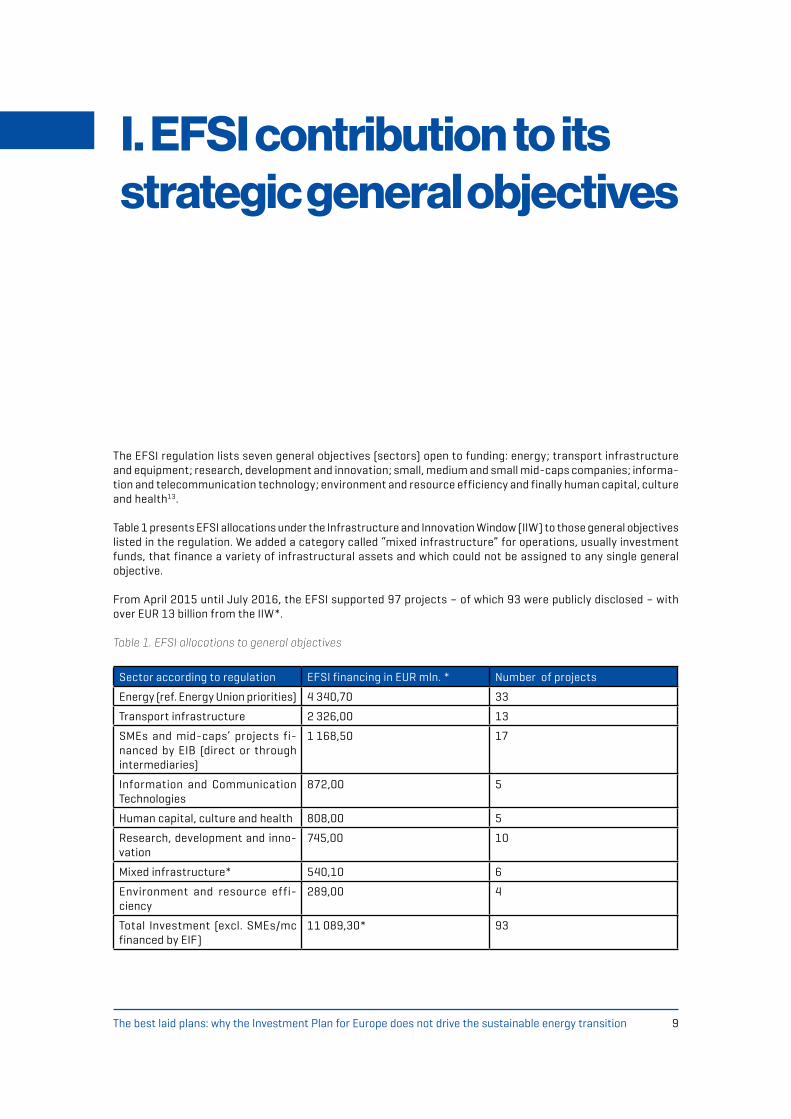
The EFSI regulation lists seven general objectives (sectors) open to funding: energy; transport infrastructure and equipment; research, development and innovation; small, medium and small mid-caps companies; informa-tion and telecommunication technology; environment and resource efficiency and finally human capital, culture and health13.
Table 1 presents EFSI allocations under the Infrastructure and Innovation Window (IIW) to those general objectives listed in the regulation. We added a category called “mixed infrastructure” for operations, usually investment funds, that finance a variety of infrastructural assets and which could not be assigned to any single general objective.
From April 2015 until July 2016, the EFSI supported 97 projects – of which 93 were publicly disclosed – with over EUR 13 billion from the IIW*. Table 1. EFSI allocations to general objectives
Sector according to regulation EFSI financing in EUR mln. * Number of projects
Energy (ref. Energy Union priorities) 4 340,70 33
Transport infrastructure 2 326,00 13
SMEs and mid-caps’ projects fi-nanced by EIB (direct or through intermediaries)
1 168,50 17
Information and Communication Technologies
872,00 5
Human capital, culture and health 808,00 5
Research, development and inno-vation
745,00 10
Mixed infrastructure* 540,10 6
Environment and resource effi-ciency
289,00 4
Total Investment (excl. SMEs/mc financed by EIF)
11 089,30* 93
I. EFSI contribution to its strategic general objectives

The best laid plans: why the Investment Plan for Europe does not drive the sustainable energy transition10
*for 7 approved projects, the volume of EFSI guarantees was not disclosed. The total EFSI volume is calculated for 93 disclosed projects
1.1. Sectors supported by EFSI
The sectoral distribution, broken down by the volume of signed operations supported by the EFSI, is one of the key performance indicators for the Fund. It is the role of the EFSI Steering Board14 to set limits for the volume of operations supported by the EU guarantee. This limit has been set at 30 per cent of the total portfolio of signed operations in any one sector at the end of the initial investment period15.
Chart 1. Sectors supported by EFSI by volume of guarantees, %
In its first year, the EFSI showed a significant bias towards the energy sector, which constituted 39 per cent of the total volume of approved and signed operations. Transport infrastructure rank second at 21 per cent (see Chart 1). Together, these two sectors – which have already received relatively high levels of attention from the EIB before the existence of the EFSI – attracted 60 per cent of EFSI guarantees.
In EU 13 countries16, the EFSI is even far more concentrated on transport and energy, with the transport sec-tor attracting 45 per cent of the EFSI total volume of signed and approved operations. In the EU 13, several EFSI objectives have not received any support, including key sectors for the modernisation and productivity of economies, like Research Development and Innovation (RDI), telecommunication technologies or the circular economy (see Chart 2).
Chart 2. Sectors supported by the EFSI in the EU 13 by volume of guarantees, %
39%
3%
7%
8%
10%
21%
7%
5%
Energy (ref. Energy Union priorities)
Environment and resource e ciency
Human capital, culture and health
Information and Communication Technologies
SMEs and mid-caps' projects financed by
EIB (direct or through intermediaries)
Transport infrastructure
Research, development and innovation
Mixed infrastructure*
30%
7%
18%
45%
Energy
Human captial, culture and health
Support to SMEs and mid-caps
Transport

The best laid plans: why the Investment Plan for Europe does not drive the sustainable energy transition 11
Such a strong focus on two sectors is not compatible with the strategic orientation17 put forward by the fund’s Steering Board and suggests that the bank might not have seized the opportunity to diversify its portfolio from a sectoral perspective.
The transport and energy sectors might simply have offered better investment opportunities in terms of shovel-ready, bankable projects. This resulted in their domination in the initial stage of the EFSI. Projects from the remaining sectors may require more time to be developed, therefore have been underrepresented so far. This sectoral concentration though should be subject to continuous monitoring in order to ensure the accessibility of EFSI money for a variety of projects worthy of support. The EFSI Strategic Orientation states that the Steering Board should prepare recommendations for specific actions in cases where investments in any one sector are too concentrated. This could be done inter alia by using the European Investment Advisory Hub to address this issue.
1.2 EFSI geographical diversification
The EFSI regulation did not establish any geographical targets for funding allocation, assuming instead that it would support investments in all EU Member States. However it authorised the Steering Board to adopt guidelines for geographical diversification. The Strategic Orientation adopted by the board sets the concentration limit for the volume of EFSI operations at 45 per cent in any three countries together for the IIW.
More than a year later, the EFSI supported projects in 19 EU Member States, with the largest number of projects located in France, Italy, Spain and UK.
Chart 3. Number of projects guaranteed by EFSI in EU member states
The concentration of EFSI investments follows this trend. More than half of its operations by volume (52 per cent) were anchored in just three EU countries: the UK, Italy and France. Although the Steering Board acknowledged that the EFSI may initially diverge from the established concentration limit, the EFSI underperforms against this indicator compared to the bank’s lending in general.
It should be added that a 45 per cent concentration limit in three EU countries together represents a conservative approach, as the Bank had not previously exceeded such a threshold for its standard portfolio.
On the other hand, the EFSI’s geographical performance may be partly a relevant response to the fact that in France, Italy, Spain and Greece, a significant decrease in investments was observed following the financial-crisis, while in five countries (Poland, Romania, Netherlands, Germany and Austria) investments have increased after the crisis18.
0
2
4
6
8
10
12
14
16
France
Multi-country
Ita
ly
Spain
United Kingdom
Poland
Germany
Greece
Belgium
Denmark
Finland
Ireland
Lithuania
Netherla
nds
Portugal
Austria
Croatia
Romania
Slovakia

The best laid plans: why the Investment Plan for Europe does not drive the sustainable energy transition12
The EIB, whose core task is to contribute to the development of the internal market and social, economic and ter-ritorial cohesion and which has made social and economic cohesion one of its two cross-cutting policy goals, has been called on by the European Parliament to ensure that the EFSI contributes to the bank’s cohesion objective and complements the investment from the European Structural and Investment Funds, a part of the EU Budget19.
In this context, it is surprising that to date, EU13 countries, where most regions are less-developed, attracted only 12 per cent of EFSI guarantees . This does not exceed the EIB’s own portfolio, where 15-16 per cent of an-nual signatures occur in within the EU13. However, since the EFSI has been established to overcome the Union’s investment difficulties and reduce regional disparities, this should be reflected in a strengthened prioritisation of cohesion purposes in the EFSI. The sectoral concentration within the EU13 on the one hand and the relatively low level of EFSI activity in this region on the other require particular attention.
In addition, EU13 countries receive significant financial resources from the European Structural and Investment Funds (ESIF)20. The EFSI regulation – and the related guidelines published by the European Commission21 – ex-plicitly encourages the combination of EFSI financing with grants provided via the European Regional Develop-ment and Cohesion Funds. This combination could indeed open opportunities to develop bankable projects in innovative areas of the economy that have not been properly supported in the past.
The EIB Climate Action evaluation indicated for instance the need to address the absence of financing for RDI projects in new renewable energy technologies and in the public transport sector22. For such projects a combi-nation of ESIF and EFSI should be an opportunity, but current EFSI results suggest that this opportunity has not been much tapped and the cohesion objective been rather neglected.
Chart 5. EFSI geographical distribution, by volume of guarantees
0
500
1000
1500
2000
2500
3000
United Kingdom
Italy
France
Multi-country
Spain
Germany
Greece
Poland
Slovakia
Belgium
Portugal
Ireland
Lithuania
Netherla
nds
Denmark
Finland
Croatia
Austria
Romania
Sweden
12%
88%
EU13
EU15
Chart 4. Volume of EFSI guarantees in EU member states

The best laid plans: why the Investment Plan for Europe does not drive the sustainable energy transition 13
1.2.1 EFSI guaranteed investments in the energy sector
The geographical coverage of the EFSI differs depending on the supported sector. Projects in the energy sector are strongly concentrated in EU15 countries, mostly in the UK where the number of guarantees (seven) is six times higher than in the second-highest country, Italy (see Chart 6).
Chart 6. EFSI energy investments by country, EUR million
EU13 countries share a megre 9 per cent of EFSI investments in the energy sector (see Chart 7).
Chart 7. EFSI energy investments geographical distribution, by volume, %
1.2.2. EFSI guaranteed investments for transport infrastructure
EFSI investments in the transport sector are not concentrated in any particular country. 14 transport operations were spread across nine EU countries, with three operations each in Italy and Spain, two in France and one in the remaining countries (see Chart 8).
0
500
1000
1500
2000
2500
United Kingdom
Multi-country
Ita
ly
Belgium
Poland
France
Lithuania
Spain
Germany
Denmark
Portugal
Austria
Sweden
Finland
91%
9%
EU15
EU13

The best laid plans: why the Investment Plan for Europe does not drive the sustainable energy transition14
Chart 8. EFSI transport investments in EU, EUR million
Operations in Poland, Slovakia and Lithuania received a quarter of EFSI support for the transport sector (see Chart 9). This does not differ from previous support by the EIB, where approximately one quarter of transport sector operations by volume were located within the EU13.
Chart 9. Geographical distribution of EFSI transport sector operations by volume, %
1.2.3 EFSI guaranteed investments in environment and resource efficiency
In the environment and resource efficiency sector, the EFSI made only four investments (in Italy, France, Ireland
0
100
200
300
400
500
600
700
Italy Slovakia Greece France Germany Spain Netherlands Poland Lithuania
75%
25%
EU 15
EU13

The best laid plans: why the Investment Plan for Europe does not drive the sustainable energy transition 15
and one cross-border project) so it would be premature to draw any conclusions here. Two operations involve solid waste and waste water treatment infrastructure, one remediation project of a polluted brownfield site and the remaining, recycling of scrap titanium (see Chart 10).
Chart 10. Geographical distribution of EFSI environment and resource efficiency investments, EUR million
* for the one operation in France, the volume of the EU guarantee has not been disclosed
1.2.4 EFSI guaranteed investments in RDI
The EFSI provided guarantees to ten operations in seven countries for RDI (projects in Sweden and Portugal were part of cross-border operations, see Chart 11) Chart 11. Geographical distribution of EFSI RDI investments, EUR million
0
50
100
150
200
250
Multi-country F rance* Ireland Italy
Remediation
Waste Infrastructure
0
50
100
150
200
250
Germany Multi-country Italy Spain United Kingdom
France

The best laid plans: why the Investment Plan for Europe does not drive the sustainable energy transition16
Three operations involved RDI activities in the transport sector, namely two in aviation and one in the automotive sector (see Chart 12). The remaining RDI allocations were equally shared among a range of projects including biotechnology, renewable energy, industry, life science and printing technologies.
Chart 12. Investments in the RDI sector by volume, %
1.2.5 EFSI guaranteed investments in human capital, culture and health
The EFSI guaranteed five projects in four countries within the human capital, culture and health sector (Chart 13).
Chart 13. EFSI human capital, culture and health sector investments in EU countries, EUR million
Among these were three projects involving the construction of social housing and two in the health sector, re-spectively for a hospital and primary care centres (Chart 14).
16%
14%
35%
13%
9%
13% Biotechnology / Bioindustry
Steel industry
Transport
Renewable energy technology
Life sciences
Printing technology
0
100
200
300
400
500
600
France United Kingdom Poland Ireland

The best laid plans: why the Investment Plan for Europe does not drive the sustainable energy transition 17
Chart 14. EFSI human capital, culture and health sub-sector investment by volume, %
1.2.6 EFSI guaranteed investments in information and telecommunication technology
Operations under this category took place in seven EU states (several countries were grouped into one operation). Four of these operations concerned internet connectivity while the other, the development of digital platforms.
Chart 15. EFSI IT sector investments in EU countries, EUR million
1.2.7 EFSI guaranteed investments in small and medium-size companies and mid-caps
EFSI support for SME and mid-caps within the IIW are either direct investments or operations through financial intermediaries. Most of SME financing under EFSI takes place under the SME window, operated by the European Investment Fund (EIF). Given that this specific window is not the subject of the present analysis, we focus here on the SME and mid-caps financed solely under the IIW. Here the EFSI supported 17 operations in nine countries (see Chart 17)
9%
25%
66%
Primary Care Centres
Hospitals
Housing
0
100
200
300
400
500
600
Italy France Multi-country
The best laid plans: why the Investment Plan for Europe does not drive the sustainable energy transition18
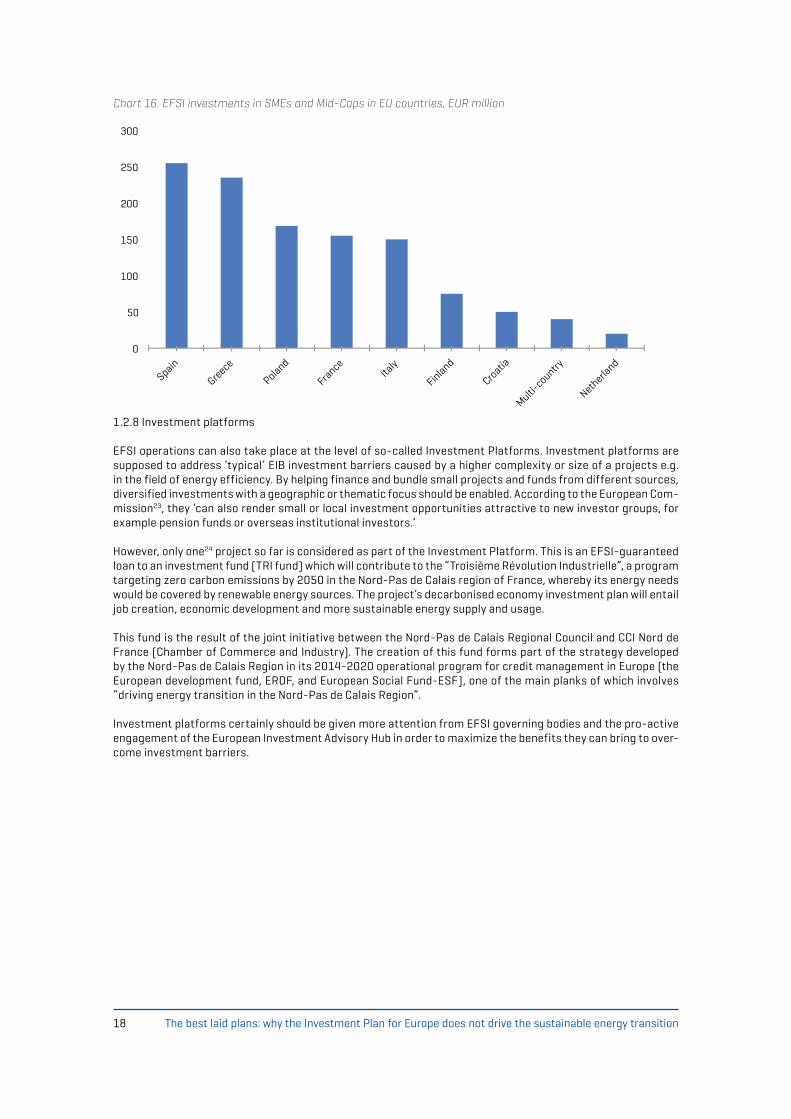
1.2.8 Investment platforms
EFSI operations can also take place at the level of so-called Investment Platforms. Investment platforms are supposed to address ‘typical’ EIB investment barriers caused by a higher complexity or size of a projects e.g. in the field of energy efficiency. By helping finance and bundle small projects and funds from different sources, diversified investments with a geographic or thematic focus should be enabled. According to the European Com-mission23, they ‘can also render small or local investment opportunities attractive to new investor groups, for example pension funds or overseas institutional investors.’
However, only one24 project so far is considered as part of the Investment Platform. This is an EFSI-guaranteed loan to an investment fund (TRI fund) which will contribute to the “Troisième Révolution Industrielle”, a program targeting zero carbon emissions by 2050 in the Nord-Pas de Calais region of France, whereby its energy needs would be covered by renewable energy sources. The project’s decarbonised economy investment plan will entail job creation, economic development and more sustainable energy supply and usage.
This fund is the result of the joint initiative between the Nord-Pas de Calais Regional Council and CCI Nord de France (Chamber of Commerce and Industry). The creation of this fund forms part of the strategy developed by the Nord-Pas de Calais Region in its 2014-2020 operational program for credit management in Europe (the European development fund, ERDF, and European Social Fund-ESF), one of the main planks of which involves “driving energy transition in the Nord-Pas de Calais Region”.
Investment platforms certainly should be given more attention from EFSI governing bodies and the pro-active engagement of the European Investment Advisory Hub in order to maximize the benefits they can bring to over-come investment barriers.
0
50
100
150
200
250
300
Spain
Greece
Poland
France
Italy
Finland
Croatia
Multi-country
Netherla
nd
Chart 16. EFSI investments in SMEs and Mid-Caps in EU countries, EUR million

The best laid plans: why the Investment Plan for Europe does not drive the sustainable energy transition 19
In July 2016 the Commission presented a package of measures to accelerate GHG emissions cuts in all sectors of the EU economy. It also announced that 50 per cent of the EU’s financial resouces are to be climate-related, including the EFSI, which should mobilise additional investments in the real economy and align private invest-ments with climate and resource efficiency objectives25. With its innovative approach to risk bearing in order to achieve policy objectives, the EFSI could be a key instrument for changing the future and thus cannot be ‘wasted’ on operations that perpetuate unsustainable economic development.26 2.1 EFSI support to the energy sector: a continuation of support for fossil fuels
Renewable energy and energy efficiency constituted equal, significant parts of EFSI investments in the energy sector, with 40 per cent, or over EUR 1.7 billion each (see Chart 17). However, fossil fuels still amount to 15 per cent of all EFSI energy sector investments by volume, a questionable issue given the EU’s climate targets.
Chart 17. EFSI supported investments in energy sector by volume, %
The UK is the biggest single recipient of EFSI-guaranteed renewable investments by volume, with two offshore wind operations that amount to 35 per cent of all investments in the sector (see Chart 18). In the EIB’s climate
II. Does the EFSI contribute to the development of a renewables-based, energy efficient and fossil fuels-free economy?
40%
40%
15%
5%
Renewables
Energy E ciency
Fossil fuels
Electricity networks
The best laid plans: why the Investment Plan for Europe does not drive the sustainable energy transition20
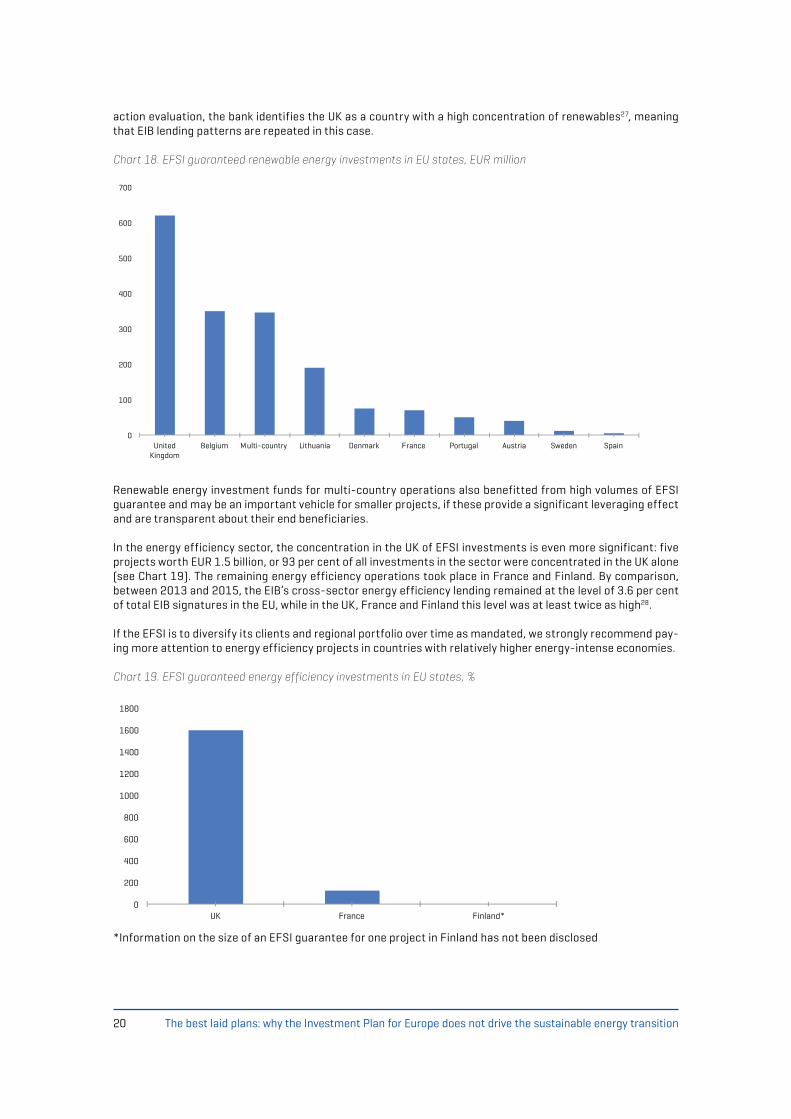
action evaluation, the bank identifies the UK as a country with a high concentration of renewables27, meaning that EIB lending patterns are repeated in this case.
Chart 18. EFSI guaranteed renewable energy investments in EU states, EUR million
Renewable energy investment funds for multi-country operations also benefitted from high volumes of EFSI guarantee and may be an important vehicle for smaller projects, if these provide a significant leveraging effect and are transparent about their end beneficiaries.
In the energy efficiency sector, the concentration in the UK of EFSI investments is even more significant: five projects worth EUR 1.5 billion, or 93 per cent of all investments in the sector were concentrated in the UK alone (see Chart 19). The remaining energy efficiency operations took place in France and Finland. By comparison, between 2013 and 2015, the EIB’s cross-sector energy efficiency lending remained at the level of 3.6 per cent of total EIB signatures in the EU, while in the UK, France and Finland this level was at least twice as high28.
If the EFSI is to diversify its clients and regional portfolio over time as mandated, we strongly recommend pay-ing more attention to energy efficiency projects in countries with relatively higher energy-intense economies.
Chart 19. EFSI guaranteed energy efficiency investments in EU states, %
*Information on the size of an EFSI guarantee for one project in Finland has not been disclosed
0
100
200
300
400
500
600
700
United Kingdom
Belgium Multi-country Lithuania Denmark France Portugal Austria Sweden Spain
0
200
400
600
800
1000
1200
1400
1600
1800
UK France Finland*
The best laid plans: why the Investment Plan for Europe does not drive the sustainable energy transition 21
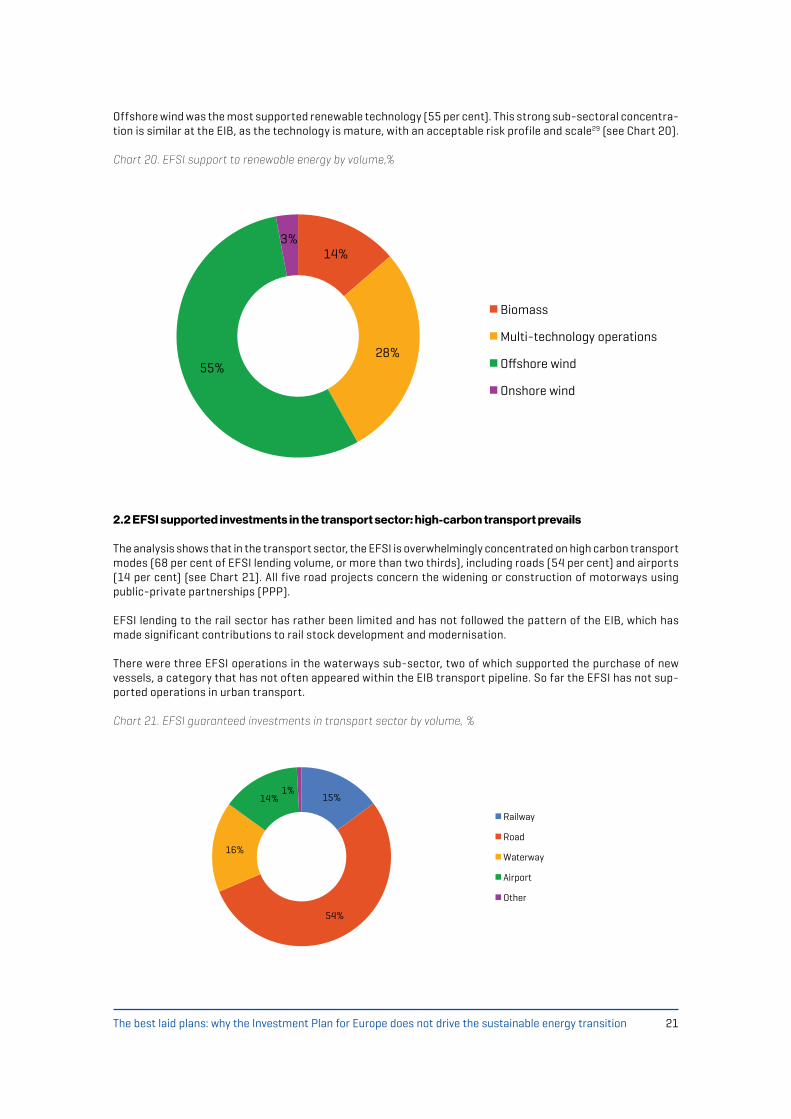
Offshore wind was the most supported renewable technology (55 per cent). This strong sub-sectoral concentra-tion is similar at the EIB, as the technology is mature, with an acceptable risk profile and scale29 (see Chart 20).
Chart 20. EFSI support to renewable energy by volume,%
2.2 EFSI supported investments in the transport sector: high-carbon transport prevails
The analysis shows that in the transport sector, the EFSI is overwhelmingly concentrated on high carbon transport modes (68 per cent of EFSI lending volume, or more than two thirds), including roads (54 per cent) and airports (14 per cent) (see Chart 21). All five road projects concern the widening or construction of motorways using public-private partnerships (PPP).
EFSI lending to the rail sector has rather been limited and has not followed the pattern of the EIB, which has made significant contributions to rail stock development and modernisation.
There were three EFSI operations in the waterways sub-sector, two of which supported the purchase of new vessels, a category that has not often appeared within the EIB transport pipeline. So far the EFSI has not sup-ported operations in urban transport.
Chart 21. EFSI guaranteed investments in transport sector by volume, %
14%
28% 55%
3%
Biomass
Multi-technology operations
O shore wind
Onshore wind
15%
54%
16%
14% 1%
Railway
Road
Waterway
Airport
Other

The best laid plans: why the Investment Plan for Europe does not drive the sustainable energy transition22
EFSI support for the development of low-emission mobility – which should be in line with the European strategy for low-emission mobility – has so far been limited. The recent proposal for an “Effort Sharing Decision” to introduce emissions reduction targets in sectors not subject to the European Emission Trading System (“non-ETS sectors”) for EU Member States suggests a number of measures and policies will have to be implemented to achieve GHG emissions cuts in the transport sector, such as reducing transport needs, promoting public transport, shifting away from fossil fuels-based transport and researching reduced -emission mobility30. At this point the EFSI does not support these efforts but rather undermines them by primarily promoting fossil fuels-based transport modes.
2.3. EFSI support for fossil fuels
From 2013-2015, EIB lending to fossil fuels has modestly but consistently increased in absolute and relative terms31. Although the EFSI prioritises renewable energy and energy efficiency, several energy projects it supports contribute to a further dependency on fossil fuels, in particular on gas (see Chart 22).
Chart 22. EFSI support to fossil fuel projects by volume, %
Around 90 per cent of fossil fuel operations by volume supported by the EFSI were related to gas infrastruc-ture, mostly transmission and distribution (EUR 1.5 billion ). These investments target especially Italy, Spain and Germany, at a time when those countries have repeatedly made commitments to phase out fossil fuel subsidies32 and where renewable alternatives to gas can further be developed (see Chart 23). These operations were approved without being scrutinised in terms of their compliance with the EU 2030 and 2050 climate and energy frameworks. This is of particular concern, as the EFSI regulation explicitly requires alignment with the EU’s long-term climate goals.
Several complementary issues should be taken into account:• The risk is that EFSI-supported gas infrastructure projects make gas more available and competitive and
crowd out renewable energy projects and energy efficiency projects;• According to Eurostat data, EU gas consumption has been decreasing for five years in a row since 2010 –
unlike Commission’s forecasts – posing the risk of a lack of market demand for new gas infrastructure;• The Commission’s 2050 Energy Roadmap scenarios33 all show a decline of EU gas consumption in absolute
terms, increasing the risk that gas infrastructure becomes a ‘stranded assets’;• EFSI-supported gas projects take place in countries that are not particularly dependent on Russian gas34;• The Commission believes that grids need twice as much investment as gas infrastructures by 202035, while
the EFSI is funding the contrary (15 per cent of energy sector volume for fossil fuels versus just five per cent for electricity networks);
• The findings from the Energy Union choices research and modelling finds that under normal market conditions, Europe does not need any new cross-border gas infrastructure between Member States, new import capacities into Europe or to secure supplies36: it concludes that there is enough gas infrastructure in Europe to ensure supply.
44%
30%
16%
4% 6%
Gas transmission and distribution
Smart gas metering
Gas power plant
Oil refinery
CHP

The best laid plans: why the Investment Plan for Europe does not drive the sustainable energy transition 23
In addition to scaling up renewable energy and energy efficiency investments, the EIB and EFSI need to end their support for fossil fuels in order to boost credibility as a genuine proponent of the global fight against climate change. This is all the more relevant at a time of decreasing EU gas consumption and a lack of gas demand in the near and possible mid-long future, which creates a high risks of sub-optimal investments and stranded assets.
Chart 23. EFSI support to fossil fuel operations in EU states, EUR million
0
50
100
150
200
250
300
350
400
Italy Spain Germany Multi-country

The best laid plans: why the Investment Plan for Europe does not drive the sustainable energy transition24
The EFSI regulation clearly defines additionality as support for operations that address market failures or sub-optimal investment situations and that could not have been carried out in the period during which an EU guarantee can be used, or not to the same extent, as from the EIB, EIF or other Union financial instruments. Projects supported by the EFSI should typically have a higher risk profile than projects supported by standard EIB operations, and the EFSI portfolio should have an overall higher risk profile than the portfolio of investments supported by the EIB under its normal investment policies37.
This definition characterises the complementarity of the EFSI pipeline with respect to the standard EIB portfolio. The EIB has four Public Policy Goals adopted by its board of directors: ‘Innovation’, ‘SMEs and midcap finance’, ‘Infrastructure’ and ‘Environment’. There are also two horizontal objectives against which the bank assesses its performance: ‘Economic and social cohesion and convergence’ and ‘Climate action’. Performance indicators have been adopted for these horizontal objectives, 30 and 25 per cent of total signatures, respectively. EFSI operations thus should contribute to these four goals and horizontal objectives.
This chapter analyzes to what extent EFSI operations complement and strengthen the EIB’s standard portfolio by assessing the impact of the EFSI on the bank’s overall portfolio performance in the energy and transport sectors. We consider the EFSI as a distinct pipeline separate from the EIB’s and assume that it should not re-duce the quality of the EIB’s performance, nor crowd out or replace standard bank finance. The 2015-2017 EIB Operational Plan argues as well in this direction, noting that the “EFSI will face specific challenges (…) to build a pipeline which needs to complement that of EIB’s other activities.” In financial terms, this means that the overall portfolio of the EIB will reach approximately EUR 48 billion inside the EU annually, while the EFSI will add EUR 16 billion in Special Activities operations38.
This analysis looks into the EFSI’s additionality for building-up the ‘low carbon economy,’ specifically its contri-bution to the transformation of Europe’s energy system and the sustainability of the transport sector, which go beyond the EIB’s standard operations.
1. How does the EFSI complement standard EIB energy lending?
Lending to the energy sector at the EIB constituted almost 12 per cent of its annual portfolio in 2015, and eight and a half per cent when including EFSI operations (as of July 2016, see Tables 2 and 3)39. The analysis shows a decrease in the share of energy sector lending at the EIB over the last two years when compared to 2011-2014, with the energy sector’s share varying between 13.7 to 16.1 per cent (see Chart 24).
The absolute volume of energy loans also decreased within the timeframe of this study, from EUR 9 billion in 2013 and EUR 10 billion in 2014 to EUR 8.2 billion in 2015 and EUR 2.5 billion by July 2016.
III. Is the EFSI additional? Complementarity of EFSI and EIB investments in the energy and transport sectors

The best laid plans: why the Investment Plan for Europe does not drive the sustainable energy transition 25
Table 2. Share of energy sector in the EIB portfolio 2015
EU energy signed, EUR millionTotal EIB signatures in EU, EUR million
Share of energy in EIB signatures in EU [%]
8 260 69 700 11.9
Table 3. Share of energy sector in the EIB portfolio 2016
EU energy signed, EUR millionTotal EIB signatures July 2016 in EU, EUR million
Share of energy in EIB signatures in EU [%]
2 952 30 426 8.5
The relative share of energy sector lending is even lower in the EIB’s standard portfolio without the EFSI con-tribution (Chart 25). In 2015 it was just ten per cent (EUR 7.3 billion) and by the end of July 2016, 5.9 per cent (EUR 1.8 billion).
Chart 25. Share of energy lending in the EIB portfolio with and without EFSI support, %
Thus EFSI energy projects significantly contributed to the volume of energy sector lending at the EIB and its share in the bank’s overall portfolio in 2015 and 2016.
00
02
04
06
08
10
12
14
16
18
2011 2012 2013 2014 2015 2016
0
2
4
6
8
10
12
14
2015 2016
Energy sector with EFSI operations
Energy sector without EFSI operations
Chart 24. Share of energy lending in the EIB standard portfolio (without EFSI), %
The best laid plans: why the Investment Plan for Europe does not drive the sustainable energy transition26
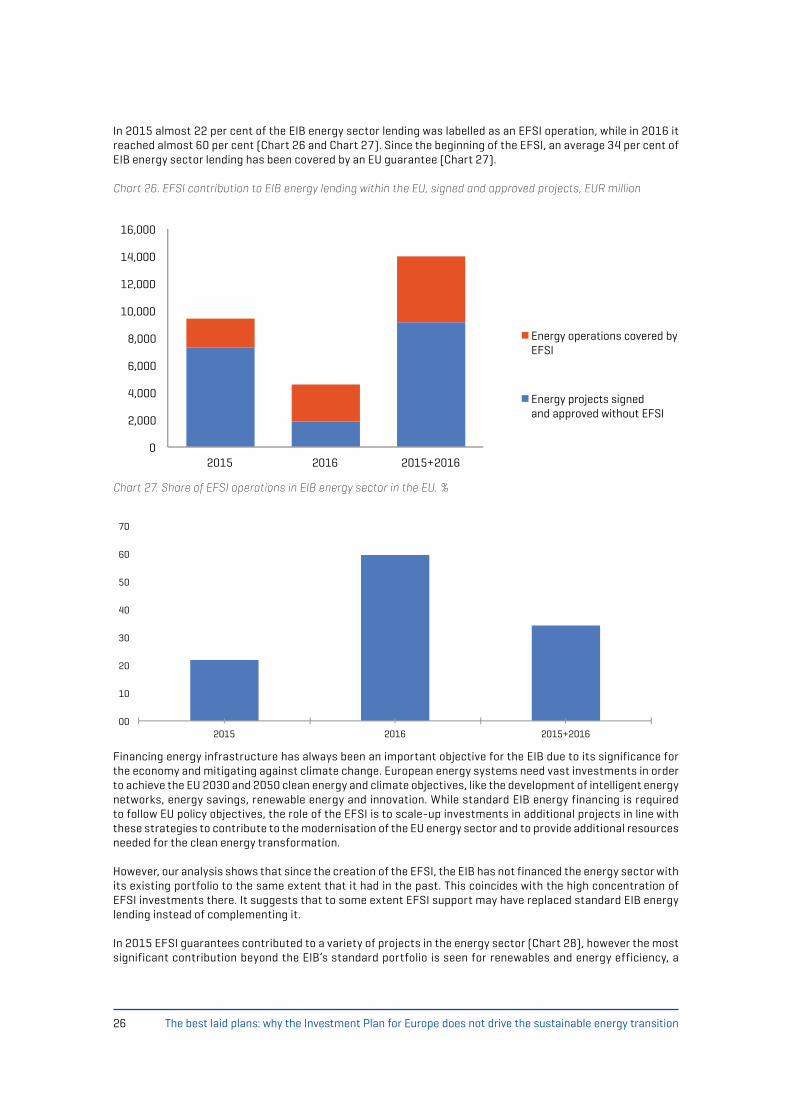
In 2015 almost 22 per cent of the EIB energy sector lending was labelled as an EFSI operation, while in 2016 it reached almost 60 per cent (Chart 26 and Chart 27). Since the beginning of the EFSI, an average 34 per cent of EIB energy sector lending has been covered by an EU guarantee (Chart 27).
Chart 26. EFSI contribution to EIB energy lending within the EU, signed and approved projects, EUR million
Chart 27. Share of EFSI operations in EIB energy sector in the EU, %
Financing energy infrastructure has always been an important objective for the EIB due to its significance for the economy and mitigating against climate change. European energy systems need vast investments in order to achieve the EU 2030 and 2050 clean energy and climate objectives, like the development of intelligent energy networks, energy savings, renewable energy and innovation. While standard EIB energy financing is required to follow EU policy objectives, the role of the EFSI is to scale-up investments in additional projects in line with these strategies to contribute to the modernisation of the EU energy sector and to provide additional resources needed for the clean energy transformation.
However, our analysis shows that since the creation of the EFSI, the EIB has not financed the energy sector with its existing portfolio to the same extent that it had in the past. This coincides with the high concentration of EFSI investments there. It suggests that to some extent EFSI support may have replaced standard EIB energy lending instead of complementing it.
In 2015 EFSI guarantees contributed to a variety of projects in the energy sector (Chart 28), however the most significant contribution beyond the EIB’s standard portfolio is seen for renewables and energy efficiency, a
00
10
20
30
40
50
60
70
2015 2016 2015+2016
0
2,000
4,000
6,000
8,000
10,000
12,000
14,000
16,000
2015 2016 2015+2016
Energy operations covered by EFSI
Energy projects signed and approved without EFSI
The best laid plans: why the Investment Plan for Europe does not drive the sustainable energy transition 27
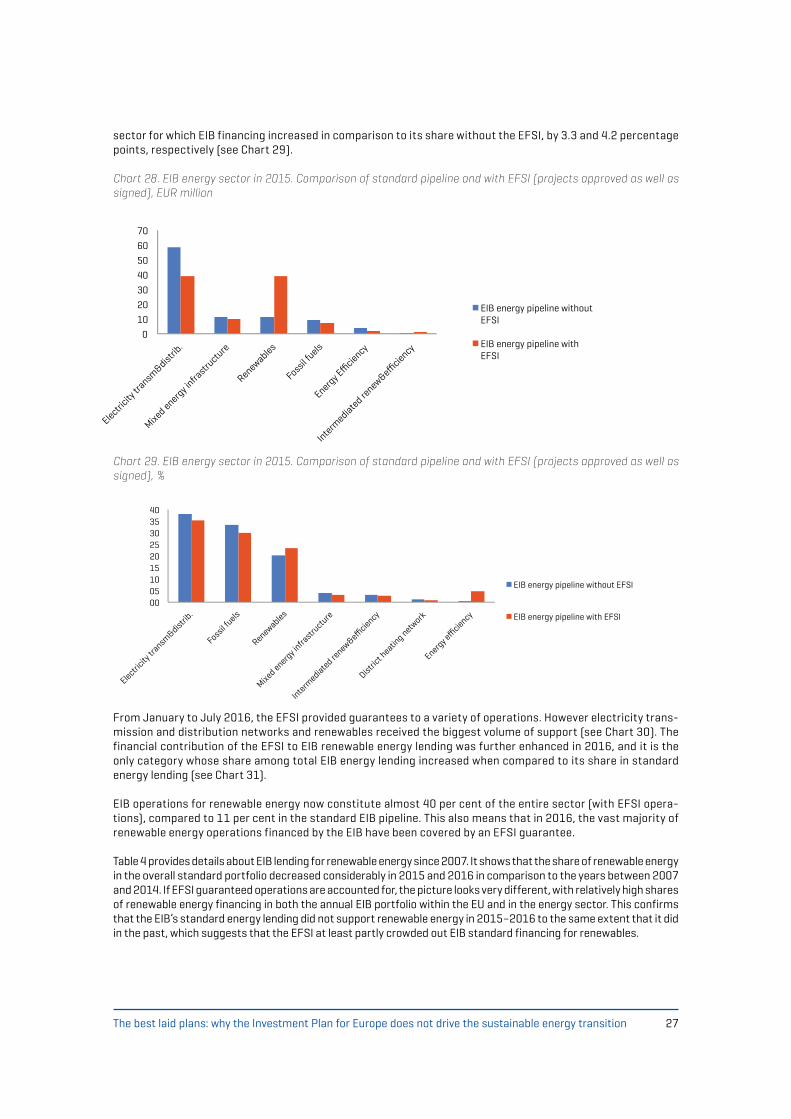
sector for which EIB financing increased in comparison to its share without the EFSI, by 3.3 and 4.2 percentage points, respectively (see Chart 29).
Chart 28. EIB energy sector in 2015. Comparison of standard pipeline and with EFSI (projects approved as well as signed), EUR million
Chart 29. EIB energy sector in 2015. Comparison of standard pipeline and with EFSI (projects approved as well as signed), %
From January to July 2016, the EFSI provided guarantees to a variety of operations. However electricity trans-mission and distribution networks and renewables received the biggest volume of support (see Chart 30). The financial contribution of the EFSI to EIB renewable energy lending was further enhanced in 2016, and it is the only category whose share among total EIB energy lending increased when compared to its share in standard energy lending (see Chart 31).
EIB operations for renewable energy now constitute almost 40 per cent of the entire sector (with EFSI opera-tions), compared to 11 per cent in the standard EIB pipeline. This also means that in 2016, the vast majority of renewable energy operations financed by the EIB have been covered by an EFSI guarantee.
Table 4 provides details about EIB lending for renewable energy since 2007. It shows that the share of renewable energy in the overall standard portfolio decreased considerably in 2015 and 2016 in comparison to the years between 2007 and 2014. If EFSI guaranteed operations are accounted for, the picture looks very different, with relatively high shares of renewable energy financing in both the annual EIB portfolio within the EU and in the energy sector. This confirms that the EIB’s standard energy lending did not support renewable energy in 2015–2016 to the same extent that it did in the past, which suggests that the EFSI at least partly crowded out EIB standard financing for renewables.
0 10 20 30 40 50 60 70
Electricity
transm
&distrib
.
Mixed energ
y infra
structu
re
Renewables
Fossil f
uels
Energy E
ciency
Intermediated re
new&eciency
EIB energy pipeline without EFSI
EIB energy pipeline with EFSI
00 05 10 15 20 25 30 35 40
Electricity
transm
&distrib
.
Fossil f
uels
Renewables
Mixed energ
y infra
structu
re
Intermediated re
new&eciency
Distric
t heatin
g network
Energy e
ciency
EIB energy pipeline without EFSI
EIB energy pipeline with EFSI

The best laid plans: why the Investment Plan for Europe does not drive the sustainable energy transition28
Table 4. EFSI contribution to EIB renewable energy lending, EUR million
Year 2007 2008 2009 2010 2011 2012 2013 2014 2015* 2016*
Standard signatures 41 300 52 000 70 605 63 500 53 770 45 200 63 600 69 000 66 302 28000
Standard energy lending
5 162 7 505 9 944 11 507 8 631 6 182 9 078 10 305 7 332 1853
Standard renewable energy lending
1 424 1 692 3 420 5 175 4 003 2 084 2 730 2 849 1 589 216
Share of renewables in annual standard lending [%]
3,4 3,3 4,8 8,1 7,4 4,6 4,3 4,1 2,4 0,8
Share of renewables in standard energy sector [%]
27,6 22,5 34,4 45,0 46,4 33,7 30,1 27,6 21,7 11
Share of renewables in annual lending with EFSI [%]
3,4 5,9
Share of renewables in energy sector with EFSI [%]
24,6 40,0
0 200 400 600 800
1000 1200 1400 1600 1800 2000
Electricity
transm
&distrib
.
Mixed energ
y infra
structu
re
Renewables
Fossil f
uels
Energy E
ciency
Intermediated re
new&eciency
EIB energy pipeline without EFSI
EIB energy pipeline with EFSI
0 10 20 30 40 50 60 70
Electricity
transm
&distrib
.
Mixed energ
y infra
structu
re
Renewables
Fossil f
uels
Energy E
ciency
Intermediated re
new&eciency
EIB energy pipeline without EFSI
EIB energy pipeline with EFSI
Chart 30. EIB energy sector in 2016. Comparison of standard pipeline and with EFSI (projects approved as well as signed), EUR million
Chart 31. EIB energy sector in 2016. Comparison of standard pipeline and with EFSI (projects approved as well as signed), %
The best laid plans: why the Investment Plan for Europe does not drive the sustainable energy transition 29
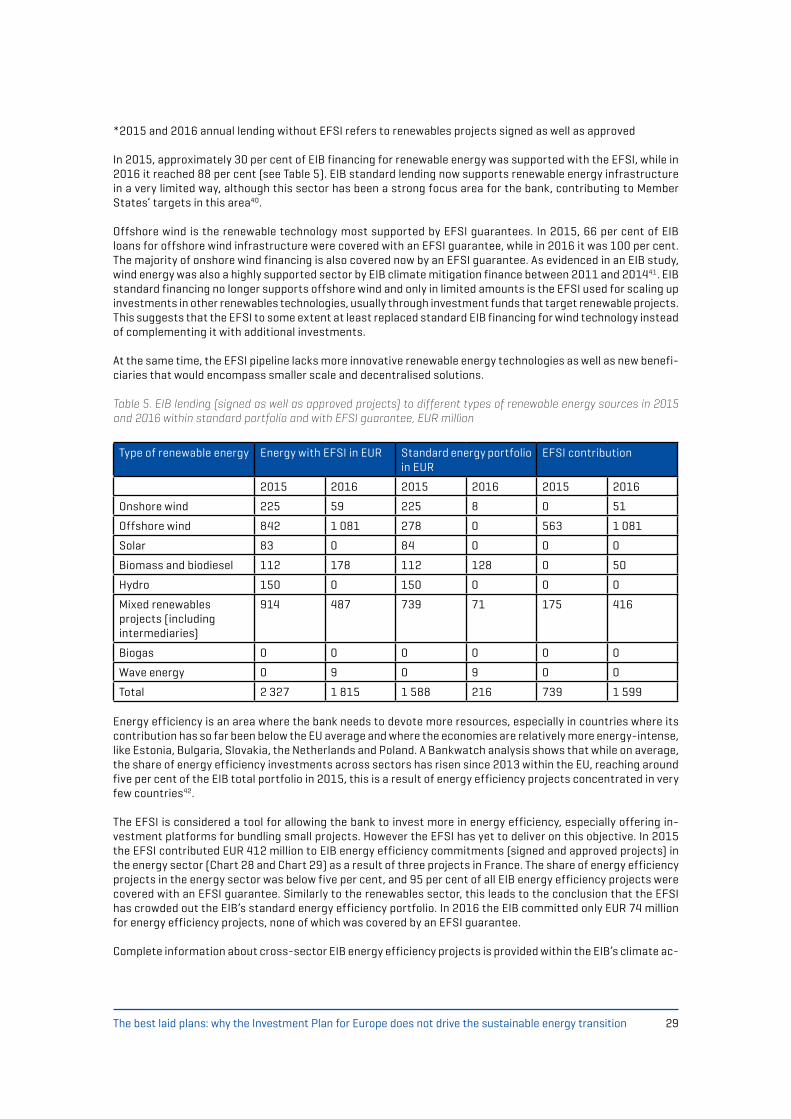
*2015 and 2016 annual lending without EFSI refers to renewables projects signed as well as approved
In 2015, approximately 30 per cent of EIB financing for renewable energy was supported with the EFSI, while in 2016 it reached 88 per cent (see Table 5). EIB standard lending now supports renewable energy infrastructure in a very limited way, although this sector has been a strong focus area for the bank, contributing to Member States’ targets in this area40.
Offshore wind is the renewable technology most supported by EFSI guarantees. In 2015, 66 per cent of EIB loans for offshore wind infrastructure were covered with an EFSI guarantee, while in 2016 it was 100 per cent. The majority of onshore wind financing is also covered now by an EFSI guarantee. As evidenced in an EIB study, wind energy was also a highly supported sector by EIB climate mitigation finance between 2011 and 201441. EIB standard financing no longer supports offshore wind and only in limited amounts is the EFSI used for scaling up investments in other renewables technologies, usually through investment funds that target renewable projects. This suggests that the EFSI to some extent at least replaced standard EIB financing for wind technology instead of complementing it with additional investments.
At the same time, the EFSI pipeline lacks more innovative renewable energy technologies as well as new benefi-ciaries that would encompass smaller scale and decentralised solutions.
Table 5. EIB lending (signed as well as approved projects) to different types of renewable energy sources in 2015 and 2016 within standard portfolio and with EFSI guarantee, EUR million
Type of renewable energy Energy with EFSI in EUR Standard energy portfolio in EUR
EFSI contribution
2015 2016 2015 2016 2015 2016
Onshore wind 225 59 225 8 0 51
Offshore wind 842 1 081 278 0 563 1 081
Solar 83 0 84 0 0 0
Biomass and biodiesel 112 178 112 128 0 50
Hydro 150 0 150 0 0 0
Mixed renewables projects (including intermediaries)
914 487 739 71 175 416
Biogas 0 0 0 0 0 0
Wave energy 0 9 0 9 0 0
Total 2 327 1 815 1 588 216 739 1 599
Energy efficiency is an area where the bank needs to devote more resources, especially in countries where its contribution has so far been below the EU average and where the economies are relatively more energy-intense, like Estonia, Bulgaria, Slovakia, the Netherlands and Poland. A Bankwatch analysis shows that while on average, the share of energy efficiency investments across sectors has risen since 2013 within the EU, reaching around five per cent of the EIB total portfolio in 2015, this is a result of energy efficiency projects concentrated in very few countries42.
The EFSI is considered a tool for allowing the bank to invest more in energy efficiency, especially offering in-vestment platforms for bundling small projects. However the EFSI has yet to deliver on this objective. In 2015 the EFSI contributed EUR 412 million to EIB energy efficiency commitments (signed and approved projects) in the energy sector (Chart 28 and Chart 29) as a result of three projects in France. The share of energy efficiency projects in the energy sector was below five per cent, and 95 per cent of all EIB energy efficiency projects were covered with an EFSI guarantee. Similarly to the renewables sector, this leads to the conclusion that the EFSI has crowded out the EIB’s standard energy efficiency portfolio. In 2016 the EIB committed only EUR 74 million for energy efficiency projects, none of which was covered by an EFSI guarantee.
Complete information about cross-sector EIB energy efficiency projects is provided within the EIB’s climate ac-

The best laid plans: why the Investment Plan for Europe does not drive the sustainable energy transition30
tion database43, which includes signed projects. In 2015 the EFSI supported EUR 158 million of EUR 3.3 billion energy efficiency projects in the EU. By the end of June 2016, the EIB signed projects worth EUR 1.3 billion in energy efficiency, of which EUR 236 million was financed with an EFSI guarantee. Therefore the complementarity of the EFSI to standard EIB energy efficiency financing was rather limited.
Electricity transmission and distribution networks have been the most supported form of energy financing by the EIB over the last few years, and the EFSI also additionally contributed with EUR 1.2 billion (Charts 30 and 31). The EFSI contribution focused on financing smart metering in the UK and electricity distribution networks in Poland. The project in Poland approved by the EIB Board of Directors in November 2015 was not initially labelled as an EFSI investment. Thus it is unclear why the EIB deemed it necessary to cover this project with an EFSI guarantee.
2. EFSI complementarity to the EIB transport sector lending
The transport sector has traditionally been important for the EIB. The bank has financed the development of EU transport corridors, urban transport, airports, marine ports, railways, stock renewal and safety upgrades. In the last four years, the share of the transport sector in overall EIB lending has decreased, even though the bank still devotes almost a fifth of its total annual lending for transport infrastructure (Table 8).
Transport has also been labelled a strategic sector for the EFSI. Infrastructure development and modernisation, equipment and innovative technologies in transport are the focus of the EFSI within the sector. In particular, the EFSI is supposed to support TEN-T infrastructure and smart and sustainable urban mobility.
The EFSI complemented EIB transport lending with over EUR 3 billion in 2015 and over EUR 1 billion in 2016 (Table 6 and Table 7).
Table 6. EFSI contribution to EIB transport lending (signed as well as approved projects) in 2015, million EUR
Approved and signed EFSI Share of EFSI operations, %
16 883 3 215 19.0
Table 7. EFSI contribution to EIB transport sector lending (signed as well as approved projects) in 2016, million EUR
Transport projects approved and signed, million EUR
EFSI transport projects, million EUR Share of EFSI operations, %
7 307 1 131 15.5
Table 8. Share of the EIB transport lending in the annual EIB lending in EU 2007-2016, million EUR
2007 2008 2009 2010 2011 2012 2013 2014 2015 2016
EIB annual signatures 41 300 52 000 70 605 63 500 53 770 45 200 63 600 69 000 69 700 30 426
Transport lending signatures
10230 13595 15464 13270 14125 10 075 11 640 12 964 12 317 5 014
Share of transport in total annual signatures [%]
24,8 26,1 21,9 20,9 26,3 22,3 18,3 18,8 17,8 16,5
EIB annual signatures without EFSI
66 302 28 009
Transport lending signatures without EFSI
12 017 4 491
Share of transpor t in annual signatures without EFSI [%]
18,1 16,0
The volume of standard EIB financing for the transport sector stabilised in recent years. This is also the case for the EIB’s standard lending (without EFSI) in 2015 and 2016, when the bank allocated a similar share of its annual financing to the sector (Table 8 and Chart 32). Additionally, it financed projects guaranteed by the EFSI (Chart 32).

The best laid plans: why the Investment Plan for Europe does not drive the sustainable energy transition 31
Chart 32. EFSI contribution to EIB transport lending in 2015 and 2016
Chart 33. EFSI contribution to EIB financing for transport modes 2015, EUR million
In 2015, the EFSI focused mainly on motorways and expressways (Chart 33). In volume, more than half of EIB operations in this subsector were covered with EFSI guarantees. Other subsectors that were supported include ports and vessels (of which 18 per cent were covered by the EFSI) and a mixed infrastructure category (of which 22 per cent were covered by the EFSI). This category includes operations supporting framework regional transport programmes, EU funds co-financing and private infrastructure investments or equity funds. Individual projects supported were unknown at the time of project approval and signature.
The EFSI did not guarantee any operations for urban mobility, airports and other roads, although it cannot be excluded that such projects were guaranteed under the mixed infrastructure category. In 2016, in addition to the
14.5
15
15.5
16
16.5
17
17.5
18
18.5
2015 2016
Share of transport sector in annual lending with EFSI
Share of transport sector in annual lending without EFSI
0 1,000 2,000 3,000 4,000 5,000 6,000 7,000 8,000 9,000
motorw
ays and exp
ressways
railw
ay and ra
il sto
ck
metro
urban tr
ansport
infrastr
ucture
sea ports
and vess
els
airports
mixed in
frastr
ucture
roads
EFSI operations
EIB standard operations
The best laid plans: why the Investment Plan for Europe does not drive the sustainable energy transition32
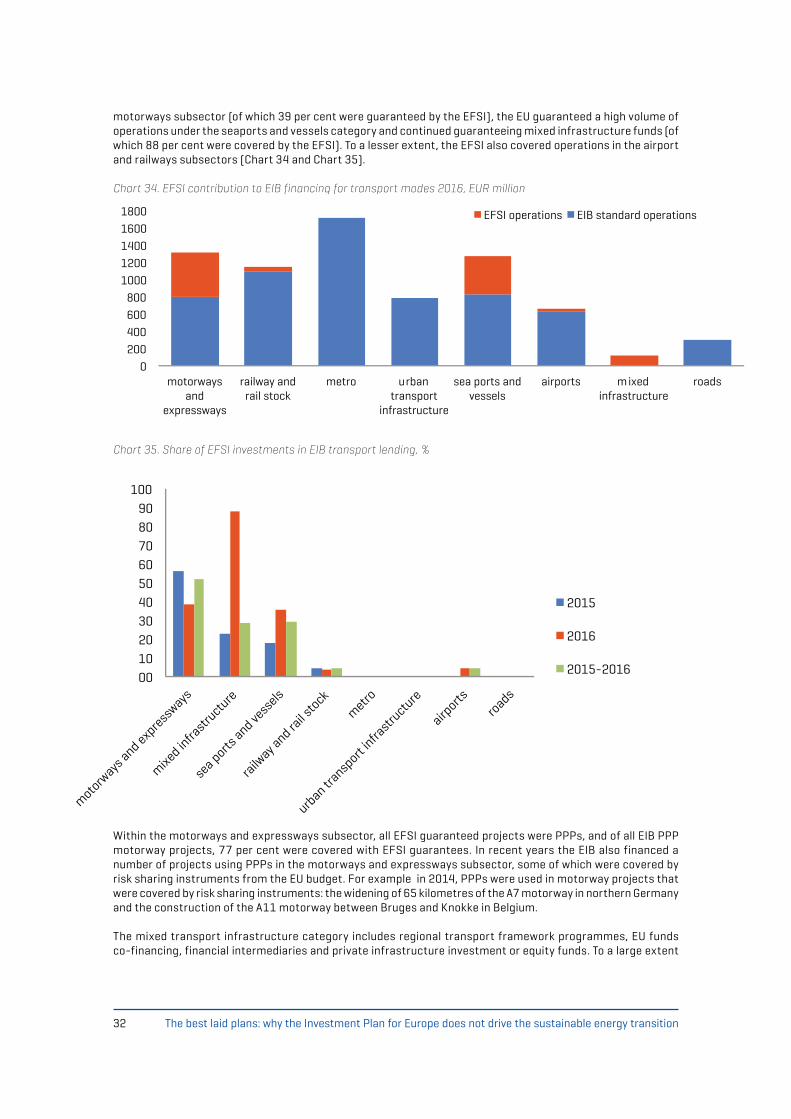
motorways subsector (of which 39 per cent were guaranteed by the EFSI), the EU guaranteed a high volume of operations under the seaports and vessels category and continued guaranteeing mixed infrastructure funds (of which 88 per cent were covered by the EFSI). To a lesser extent, the EFSI also covered operations in the airport and railways subsectors (Chart 34 and Chart 35).
Chart 34. EFSI contribution to EIB financing for transport modes 2016, EUR million
Chart 35. Share of EFSI investments in EIB transport lending, %
Within the motorways and expressways subsector, all EFSI guaranteed projects were PPPs, and of all EIB PPP motorway projects, 77 per cent were covered with EFSI guarantees. In recent years the EIB also financed a number of projects using PPPs in the motorways and expressways subsector, some of which were covered by risk sharing instruments from the EU budget. For example in 2014, PPPs were used in motorway projects that were covered by risk sharing instruments: the widening of 65 kilometres of the A7 motorway in northern Germany and the construction of the A11 motorway between Bruges and Knokke in Belgium.
The mixed transport infrastructure category includes regional transport framework programmes, EU funds co-financing, financial intermediaries and private infrastructure investment or equity funds. To a large extent
0 200 400 600 800
1000 1200 1400 1600 1800
motorways and
expressways
railway and rail stock
metro urban transport
infrastructure
sea ports and vessels
airports m ixed infrastructure
roads
EFSI operations EIB standard operations
00 10 20 30 40 50 60 70 80 90
100
motorw
ays and exp
ressways
mixed in
frastr
ucture
sea ports
and vess
els
railw
ay and ra
il sto
ck
metro
urban tr
ansport
infrastr
ucture
airports
roads
2015
2016
2015-2016
The best laid plans: why the Investment Plan for Europe does not drive the sustainable energy transition 33
the EFSI guarantee was used for private sector infrastructure investment and equity funds, with the exception of one operation supporting a publicly-owned Spanish fund. In 2016, of six EIB operations where financial in-termediaries and investment funds were used in the transport sector, five were covered by an EFSI guarantee.
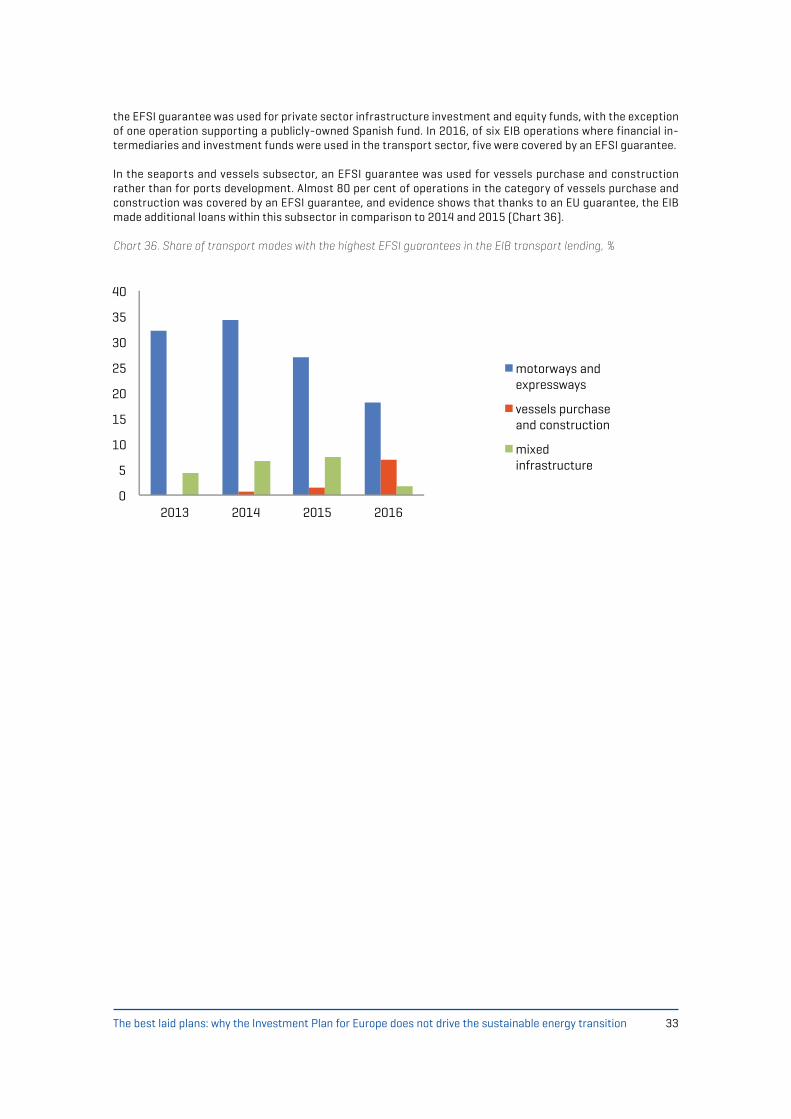
In the seaports and vessels subsector, an EFSI guarantee was used for vessels purchase and construction rather than for ports development. Almost 80 per cent of operations in the category of vessels purchase and construction was covered by an EFSI guarantee, and evidence shows that thanks to an EU guarantee, the EIB made additional loans within this subsector in comparison to 2014 and 2015 (Chart 36). Chart 36. Share of transport modes with the highest EFSI guarantees in the EIB transport lending, %
0
5
10
15
20
25
30
35
40
2013 2014 2015 2016
motorways and expressways
vessels purchase and construction
mixed infrastructure

The best laid plans: why the Investment Plan for Europe does not drive the sustainable energy transition34
Based on our assessment, the following recommendations are for decision-makers to address the shortcomings of the EFSI and its Innovation and Infrastructure Window. We ask EU institutions to make use of these proposals in the context of the mid-term review of the EFSI, which will set out the future orientation and legal framework for the EFSI to operate beyond 2018 and until 2020:
1. Improve sectoral and geographical balance to enhance cohesion and sustainable development objectives
• The EFSI should cover a broader range of sectors to allow projects (and clients) outside the scope of normal EIB operations to benefit from this public financial instrument. This is all the more relevant in the dominant sectors like energy and transport.
• The EFSI should further diversify its geographical distribution. France, Italy, Spain and UK are already the main recipients of EIB lending, so the EFSI must add to this across the Union, especially for sectors lacking financing (as the example of the hight concentration renewables and energy efficiency in the UK suggests).
• Additionally, the EFSI should pay special attention to the new EU Member states (EU 13), especially in crucial sectors like modernising and improving the productivity and sustainability of economies through RDI for clean energy, telecommunications and the circular economy. Given that those countries receive significant financial resources from the European Structural and Investment Funds (ESIF), a combination with the EFSI should open opportunities to develop sustainable and viable projects in innovative areas of the economy that have not been well funded in the past.
• The EFSI should further promote energy efficiency projects in countries with relatively-higher energy intensive economies, notably within the EU 13.
• In the renewable energy sector specifically, the EFSI should avoid concentrating on one technology and support instead less developed technologies with a higher risk profile and projects of smaller scale. Such support could come in the form of pro-active technical assistance and innovative financial structuring such as investment platforms or community-driven, clean energy projects.
2. Re-direct investments to ensure sustainability
• In the transport sector, EFSI support for high-carbon operations like motorways and airports should be avoided across the EU. The EFSI should redirect its support for measures that reduce transport needs, promote public transport, and support research and innovation for sustainable mobility.
• In the energy sector, the EIB should target that 100% of EFSI financing is climate proof and contributes to climate action in line with the objectives of the Paris Agreement i.e. ending support for fossil fuels. There is no reason for the EFSI to support investments like gas transmission and distribution networks when these already have received increased support from the EIB.
IV. Recommendations

The best laid plans: why the Investment Plan for Europe does not drive the sustainable energy transition 35
3. Ensure clear additionality in the energy and transport sectors
• The EFSI should provide substantial additionality to the EIB’s business-as-usual portfolio in the energy sector and should not crowd out or replace conventional EIB financing.
• The EFSI should seek to finance energy efficiency projects in addition to those already financed by the EIB. In other words, more emphasis should be placed on developing energy efficiency investment platforms to enable the bundling of small-scale projects that struggle to access public financing via conventional finance vehicles.
4. Improve transparency at the project level
The EFSI should provide a transparent justification of the added-value and additionality of the projects it fi-nances. For the time being, little information is disclosed regarding the expected impacts and the additionality of these projects. Since this information should be mentioned in the ‘scoreboard’ used by EFSI governing bodies to judge the merits of a specific project, the timely disclosure is necessary of such a scoreboard for every EFSI project before it is signed .

1. http://ec.europa.eu/priorities/jobs-growth-and-investment/investment-plan_en2. Regulation (EU) 2015/1017 of the European Parliament and of the Council of 25 June 2015 on the European Fund for Strategic Investments, the European Investment Advisory Hub and the European Investment Project Portal3. http://eur-lex.europa.eu/resource.html?uri=cellar:08ec00f9-7a52-11e6-b076-01aa75ed71a1.0001.02/DOC_1&format=PDF4. Regulation (EU) 2015/1017 of the European Parliament and of the Council of 25 June 2015 on the European Fund for Strategic Investments, the European Investment Advisory Hub and the European Investment Project Portal5. Investment Plan for Europe, European Commission, http://ec.europa.eu/priorities/jobs-growth-and-investment/investment-plan_en6. Regulation (EU) 2015/1017 on the European Fund for Strategic Investments, Article 9 point 27. EIB Corporate Operational Plan 2014-20168. EIB Corporate Operational Plan 2016-20189. Regulation (EU) 2015/1017 on the European Fund for Strategic Investments, the European Investment Advisory Hub and the European Investment Project Portal and amending Regulations (EU) No 1291/2013 and (EU) No 1316/2013 — the European Fund for Strategic Investments10. Regulation (EU) 2015/1017, Art. 9 point 2b. 11. COM(2016) 110 final; The Road from Paris: assessing the implications of the Paris Agreement and accompanying the proposal for a Council decision on the signing, on behalf of the European Union, of the Paris agreement adopted under the United Nations Framework Convention on Climate Change; Brussels, 2.3.2016 12. World Energy Outlook. Special briefing. October 2015, International Energy Agency, https://www.iea.org/newsroomandevents/pressreleases/2015/october/climate-pledges-for-cop21-slow-energy-sector-emissions-growth-dramatically.html 13. Regulation (EU) 2015/1017 on the European Fund for Strategic Investments, Article 9 point 214. The EFSI Steering Board governs the implementation of EFSI for the purpose of ensuring the appropriate use of the Guarantee. It determines the strategic orientation of the EFSI, the operating policies and the procedures and operations with investment platforms and national promotional banks or institutions.15. EFSI Strategic Orientation, 15 December 2015, http://www.eib.org/attachments/strategies/efsi_steering_board_efsi_strategic_orientation_en.pdf 16. Countries which joined the European Union in 2004 and later: Bulgaria, Croatia, Cyprus, Czech Republic, Estonia, Hungary, Latvia, Lithuania, Malta, Poland, Romania, Slovakia, Slovenia. 17. EFSI Strategic Orientation, 15 December 2015 http://www.eib.org/attachments/strategies/efsi_steering_board_efsi_strategic_orientation_en.pdf18. Reindustrializing Europe, Member States’ competitiveness report 2014, European Commission http://ec.europa.eu/growth/industry/competitiveness/reports/ms-competitiveness-report_en
Endnotes

19. European Parliament resolution of 28 April 2016 on the European Investment Bank (EIB) – Annual Report 2014 (2015/2127(INI))20. http://bankwatch.org/publications/climates-enfants-terribles-how-new-member-states-misguided-use-eu-funds-holding-back-eu21. http://ec.europa.eu/regional_policy/en/information/publications/brochures/2016/european-structural-and-investment-funds-and-european-fund-for-strategic-investments-complementarities-ensuring-coordination-synergies-and-complementarity 22. Evaluation on Climate Action 2010-2014. EIB Operations Evaluation, 2015, page 1423. http://ec.europa.eu/clima/news/articles/news_2016072001_en.htm 24. http://bankwatch.org/publications/efsi-case-study-integrated-clean-energy-project-third-industrial-revolution-nord-pas-de 25. Driving Europe’s transition to a low-carbon economy, European Commission 20 July 2016, http://ec.europa.eu/clima/news/articles/news_2016072001_en.htm 26. Accelerating Europe’s transition to a low-carbon economy, Communication from the Commission, 20 July 2016, https://ec.europa.eu/transparency/regdoc/rep/1/2016/EN/1-2016-500-EN-F1-1.PDF 27. Evaluation on Climate Action 2010-2014. EIB Operations Evaluation, 2015, page 928. European Investment Bank and Climate Action 2013-2016, CEE Bankwatch Network, May 201629. Evaluation on Climate Action 2010-2014, p.930. http://ec.europa.eu/clima/policies/effort/index_en.htm 31. http://bankwatch.org/publications/european-investment-bank-and-its-energy-sector-lending-2013-2015 32. For instance in the framework of G7 and G20 proclamations.33. European Commission, Energy Roadmap 205034. Clingendael International Energy Programme, Russian gas imports to Europe and security of supply. Spain notably does not import Russian gas at all and Italy around 20% only of its gas consumption35. European Commission, Impact Assessment - Energy infrastructure priorities for 2020 and beyond - A Blueprint for an integrated European energy network (COM(2010) 677 final)36. Energy Union Choices (2016), A Perspective on Infrastructure and Energy Security In the Transition37. EFSI Regulation, Art 5.138. Special activities are projects of a higher risk profile covered by additional EIB own resources guarantee or risk sharing instruments, http://www.eib.org/attachments/strategies/cop2015_en.pdf39. http://bankwatch.org/publications/european-investment-bank-and-its-energy-sector-lending-2013-2015 40. Evaluation of Climate Action 2010-2014, European Investment Bank 2015, page 841. Ibid, page 942. CEE Bankwatch Network briefing on EIB Climate Action 2013-2015, May 2016, http://bankwatch.org/publications/european-investment-bank-and-climate-action-2013-2015 43. Available on request from the European Investment Bank


![‘The Best Laid Plans’ ____________________ Planning and Economic Growth [‘No Room! No Room!’ (1987)]](https://static.documents.pub/doc/80x56/56649d985503460f94a821da/the-best-laid-plans-planning-and-economic-growth.jpg)


