Bosnia Herzegovina Agency for Statistics (BHAS) Institute of Statistics of the Federation of Bosnia Herzegovina (FIS) Institute of Statistics of the Republika Srpska (RSIS) The BiH Consumer Price Survey 1. Methodology and Results
Transcript
Bosnia Herzegovina Agency for Statistics (BHAS)
Institute of Statistics of the Federation of Bosnia Herzegovina (FIS)
Institute of Statistics of the Republika Srpska (RSIS)
The BiH Consumer Price Survey 1. Methodology and Results
2
Volume 1. Methodology and Results Table of Contents Foreword ........................................................................................................................................................ 5
Index ............................................................................................................................................................. 58
Federico Polidoro, Antonella Simone, Marco Zaninelli.
Special thanks go to Vera Nastic for the translation, editing and layout of the
publications in all languages and to Tiziana Pellicciotti for the editing and layout of the
English version.
7
Introduction1 Consumer price survey in Bosnia Herzegovina (BiH) is the survey that allows to
measure the consumer price inflation, that is the rate of change of the consumer prices
of goods and services that are purchased by the households through monetary
transactions. Consumer price inflation in Bosnia Herzegovina is measured by the
Consumer Price Index (CPI), that is, coherently with the European Union approach to
consumer price statistics, a pure price index that reflects only the changes that the
current price has registered with respect to a base reference period. BiH CPI is not a Cost
of Living Index (COLI)2. With reference to the EU approach, the coverage of CPI are the
goods and services included in the Household Final Monetary Consumption Expenditure
(HFMCE). HFMCE is the part of Final Consumption Expenditure incurred by households,
without nationality distinction, for monetary transactions in the economic territory of the
country for products that directly satisfy consumer needs.
Consumer price survey in Bosnia Herzegovina is a sample survey for which monthly
price collection is carried out for a sample of products, in a sample of geographical areas,
in a sample of outlets within the geographical areas, for a sample of elementary items
inside the selected outlets.
Starting from January 2005, the survey and the data collection methodology and the
algorithms of calculation of the indices have been revised taking into account the Italian
and European experiences and methodological references, harmonizing the consumer
price survey with the main tenets of European methodology fixed in the Regulations.
Moreover, the methodological design of the survey was implemented in a computer
procedure that allows to carry out the controlled data entry, the check of the data
entered and the calculation of the indices, starting from indices at town level to the index
of the general inflation.
From January 2005 consumer price indices, consistently with the European
approach of a pure price index, have started to be produced, and from the end of 2006
disseminated in the country. For the time being, the old retail price index is still
produced but it is on the way to be suspended or produced only for legal aims that are
still valid. It is worth mentioning that it was elaborated separately by each entity without
the possibility of calculating an unique index for Bosnia Herzegovina as a whole, due to
the different methodological designs of the two surveys in the two entities.
1 Federico Polidoro, Istat, Division for Price Statistics and Foreign Trade, Price Statistics Section 2 The previous retail price index calculate for Federation of Bosnia Herzegovina and Republika Srpska was more similar to a COLI.
8
Now the consumer price data collection is carried out in six towns of the Republika
Srpska (RS), five towns of the Federation of Bosnia Herzegovina (FBiH) and in Brcko
District, adopting an unique basket of goods and services and producing indices for each
geographical level from the towns where data collection is carried out to the Entities and
BiH. In 2006 the basket of product consists of 646 products grouped in 580
representative positions. The representative position is the first level at which it has been
possible to estimate a weight. Weights have been calculated on the base of the data on
expenditure coming from Household Budget Survey (HBS) carried out in 2004, that
represented a crucial survey for the updating of the weights for the CPI.
These two volumes present the main results of the project implemented in
partnership by the Italian National Institute of Statistics (Istat), the Bosnia Herzegovina
Agency of Statistics (BHAS), the Institute of Statistics of the Federation (FIS) and the
Institute of Statistic of the Republika Srpska (RSIS) plus the Brcko District Statistical
Agency.
The first volume is dedicated to the statistical results in terms of survey and data
collection methodology and of aggregate indices, whereas the second volume is devoted to
the technical aspects and, in particular, to a wide description of the procedure developed
and implemented by the Italian IT experts.
The first volume consists of two chapters: the first one deals with the main aspects of
the statistical methodology that were defined at the very beginning of the project and
developed and deepened during the project; the second volume analyses the aggregate
indices of inflation referred to the country as a whole, to each entity and to Brcko
District. The analysis of the inflation focuses on the period from January 2005 to
December 2006 for which indices in a common base (2005=100) have been calculated.
The second volume is divided into three main parts. The first chapter introduces the
more relevant aspects of the IT project that was developed for the CPI. Chapters from 3 to
8 describe in details the so called Module 1, that is the module of the procedure for
managing the controlled data entry, the check of microdata, the calculation of the
average data and indices of representative positions at level of towns. Chapter 9 is
dedicated to the so called Module 2, that is the procedure for managing the calculation of
the aggregate indices at entity and country level.
Both volumes include a glossary and volume 1 also presents a set of statistical tables
and graphs.
1. Statistical methodology3
1.1 Preliminary remarks
Cooperation in the field of consumer prices statistics among the Italian National
Institute of Statistics (Istat), the Statistical Agency of Bosnia Herzegovina (BHAS), the
Institute of Statistics of the Federation (FIS) and the Institute of Statistics of the
Republika Srspka (RSIS) focused immediately on the main issue: the quality of
elementary data used to calculate an accurate measure of the inflation for the two
Entities and for the country as a whole. A high quality of elementary data depends
closely on a sound methodological background able to provide statisticians, survey
experts and collectors with clear guidelines to carry out the fieldwork. Therefore it has
been crucial to point out and improve the main aspects of the statistical methodology,
that are resumed in the first chapter of this volume. The references for this work have
been the wide literature on consumer prices statistics and, above all, the European
Regulations.
The discussions held during the missions in Bosnia Herzegovina and Italy allowed to
identify the main issues in terms of statistical methodology on the one hand, and of data
collection methodology on the other hand. In terms of statistical methodology the main
issues focused are:
the sample design (geographical areas, products, outlets and elementary items for
which prices have to be observed);
the criteria to be adopted to select the elementary items for which prices are
collected;
managing the events associated with the consumer price observation: missing
observations and substitutions of the elementary items for different reasons;
the treatment of seasonal products;
managing temporary reductions of prices;
designing the questionnaires for monthly and bimonthly data collection;
the indices calculation, starting from elementary indices to the aggregate ones;
the weights estimation on the basis of the data from the 2004 HBS.
Moreover, some rules have been defined for the data collection calendar (taking into
account the running European Union Regulations developments) and for production
steps and dissemination standards.
3 Federico Polidoro, Istat, Division for Price Statistics and Foreign Trade, Price Statistics Section
10
1.2 Scope and aim of the Consumer Price Index
The main objective of the consumer price data collection in Bosnia Herzegovina is to
provide a measure of inflation for the two Entities, the Brcko District and for the country
as a whole. Inflation for the households is the measure of the rate of change in the prices
of products (goods and services) bought for the purpose of consumption in the economic
territory of BiH. Therefore, taking into account the European System of Accounts (ESA
95), the coverage of BiH Consumer Price Index (CPI) is the Household Final Monetary
Consumption Expenditure (HFMCE).
Moreover BiH CPI, according to the European approach, is a Laspeyres-type pure
price index and not a cost of living index, that is, it reflects the price change between the
current and the reference period eliminating the influences on price movements due to
other factors.
In theory, a measure of the inflation should register the rate of change in the prices of
all the products available in the market to consumers. In reality, it is necessary to select
a group of goods and services (basket of products) that are representative of the
consumption of households. The Consumer Price Index measures the time changes of a
basket of products representative of all the products meant for the final consumption by
households and purchasable in the market through monetary transactions.
This definition excludes from the coverage of CPI free transactions, self consumption,
imputed rents as measure of the owner occupier housing costs and all the taxes that are
not paid with the purchase of consumer goods. Taxes linked with the purchase of a
consumer good are included in the coverage of the consumer price indices (e.g. VAT).
Coherently with European Regulation concerning HICP, also games for chance are
excluded from the coverage of consumer price surveys.
One of the main achievements of the project has been the definition of an unique
basket of products for the two Entities and for the Brcko District. In 2005 the basket of
products for Bosnian CPI consisted of 642 elementary products, grouped in 580
representative positions; then the 580 representative positions are grouped in 123 voices
of products, 92 classes, 40 groups and 12 categories. In 2006 a small revision of the
basket has been carried out so that starting from January data are collected for 646
elementary products that are grouped in 580 representative positions, 127 voices of
products, 93 classes, 40 groups and 12 divisions (Graph 1.1). Relevant changes in the
basket are not scheduled until the results of HBS 2007 will be available: it is reasonable
to foresee a deeper revision of the basket for 2009. Classes, groups and categories refer
to the COICOP classification.
11
Graph 1.1 – Hierarchical structure of BiH CPI. Year 2006
Price collection is carried out for products of different typologies: food, grocery,
alcoholic beverages and tobacco, clothes and footwear, services for the maintenance of
the house, house equipment and furniture, health products and services, fuels and
transportation, recreational services, education, cafés, restaurants and hotels, insurance
services and other goods and services.
1.3 Coverage and weights of the Consumer Price Index
Generally speaking, according to the European Regulation the coverage of the CPI
“(…) is defined as those goods and services which are included in HFMCE. It is classified
according to the four digit categories and sub-categories of the COICOP/HICP
(Classification Of Individual COnsumption by Purpose adapted to the needs of HICPs).
HFMCE is defined as that part of final consumption expenditure which is incurred:
by households irrespective of nationality or residence status, and
in monetary transactions, and
on the economic territory of the Member State, and
General index
12 divisions
93 classes
127 voices of products
580 representative positions
646 products
40 groups
12
on goods and services that are used for the direct satisfaction of individual needs or
wants, and
in one or both of the time periods being compared.” 4
Prices collected for BiH CPI are the prices paid by the households to purchase
individual goods and services in monetary transactions. The prices collected are those
actually paid at the time of purchase; including any taxes less subsidies on the products.
Prices are collected either full, i.e. without taking into account temporary reductions of
prices, or after deductions for discounts and they exclude interest or services charges
added under credit arrangements; prices that do not take into account temporary
reductions are used to calculate CPI whereas prices that include temporary reductions
are used to calculate the Harmonized Index of Consumer Prices (HICP).
1.4 The sample design
The consumer price survey is typically a sample survey. European Regulation
1749/96 establishes the Minimum standards for sampling in article 8:
“HICPs constructed from target samples which, for each category of COICOP/HICP and
taking into account the weight of the category, have sufficient elementary aggregates to
represent the diversity of items within the category and sufficient prices within each
elementary aggregate to take account of the variation of price movements in the population
shall be deemed reliable and comparable.”
It is clear that the Regulation requirement is very general and it has represented the
reference for sampling also in Bosnia Herzegovina. EUROSTAT has set up two task forces
that have produced a first attempt to identify the possible source of errors and a
theoretical framework for sampling in the field of consumer price statistics.
In Bosnia Herzegovina, as in the majority of EU Member States (MS), the sample
selected for the consumer price survey is not a random sample but a purposive one.
Generally speaking, it is possible to identify four stages in the selection of the sample for
Bosnia Herzegovina:
a. The selection of the geographical areas;
b. The selection of the outlets;
c. The selection of the products (basket of products);
d. The selection of the elementary items.
Each stage will be briefly described in the next paragraphs (1.4, 1.5, 1.6, 1.7). For the
last three stages the main principle adopted is to ensure the representation of the
4 Compendium of HICP – Reference documents 2/2001/B/5, page 19
13
consumer behaviour in terms of more purchased products, more frequented outlets,
more sold elementary items.
The central statistical offices (FIS and RSIS) at Entity level and the statistical Agency
(BHAS), at country level, have the very delicate task of selecting the basket of products
that better represent the consumer behaviour.
The regional or canton offices have an important task, that is to select a sample that
meets the basic requirements of representativeness in terms of outlets (collection units)
and items for which elementary prices shall be collected. This task means selecting the
outlets on the basis of the more complete list, taking into account some crucial variables
(weight of different trade typologies, location, turnover of each outlet, etc.) and choosing
the single items by means of colloquia with the sales directors on the basis of sales data
referred to each product.
The stages of the sample selection are therefore fundamental, and all the offices and
persons involved in Consumer Price survey have their own crucial task.
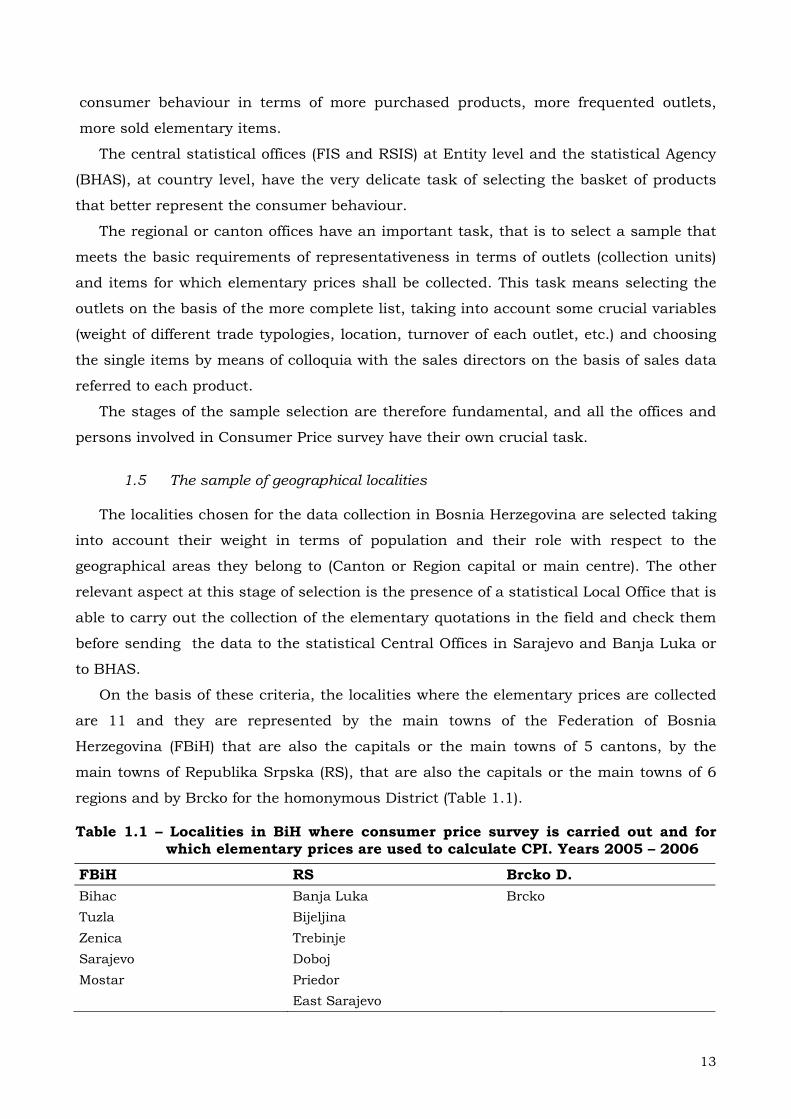
1.5 The sample of geographical localities
The localities chosen for the data collection in Bosnia Herzegovina are selected taking
into account their weight in terms of population and their role with respect to the
geographical areas they belong to (Canton or Region capital or main centre). The other
relevant aspect at this stage of selection is the presence of a statistical Local Office that is
able to carry out the collection of the elementary quotations in the field and check them
before sending the data to the statistical Central Offices in Sarajevo and Banja Luka or
to BHAS.
On the basis of these criteria, the localities where the elementary prices are collected
are 11 and they are represented by the main towns of the Federation of Bosnia
Herzegovina (FBiH) that are also the capitals or the main towns of 5 cantons, by the
main towns of Republika Srpska (RS), that are also the capitals or the main towns of 6
regions and by Brcko for the homonymous District (Table 1.1).
Table 1.1 – Localities in BiH where consumer price survey is carried out and for which elementary prices are used to calculate CPI. Years 2005 – 2006
FBiH RS Brcko D. Bihac Banja Luka Brcko Tuzla Bijeljina Zenica Trebinje Sarajevo Doboj Mostar Priedor East Sarajevo
14
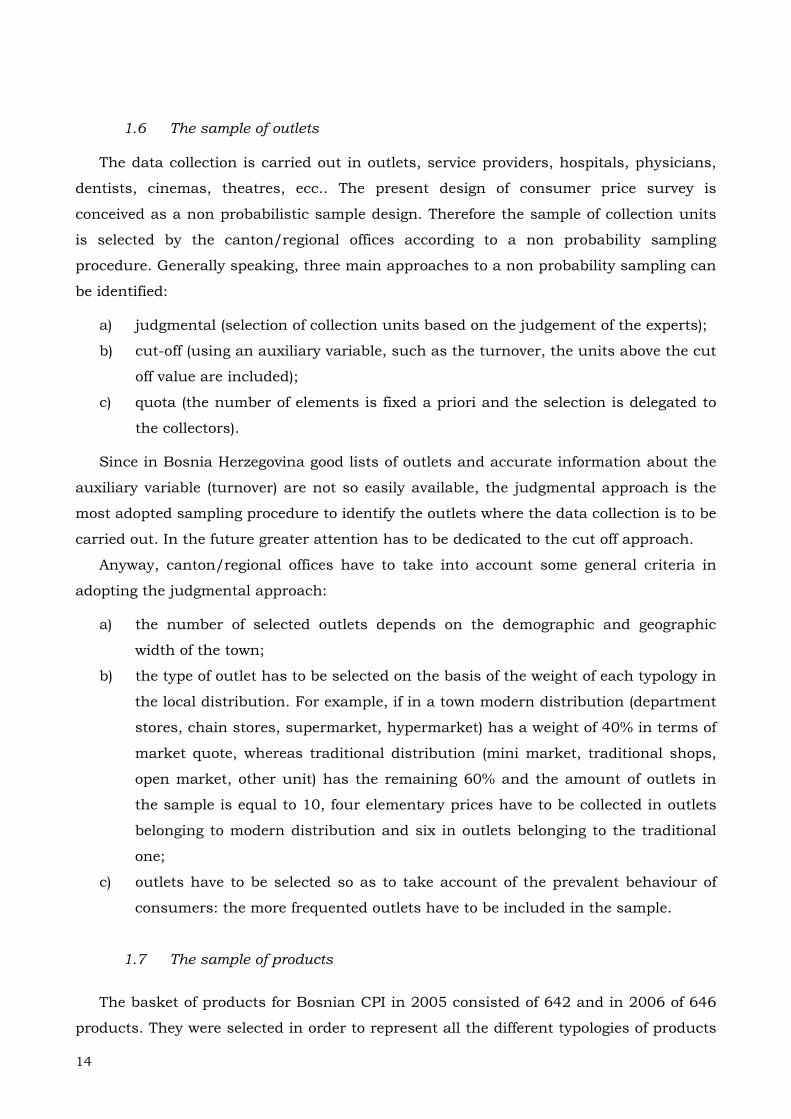
1.6 The sample of outlets The data collection is carried out in outlets, service providers, hospitals, physicians,
dentists, cinemas, theatres, ecc.. The present design of consumer price survey is
conceived as a non probabilistic sample design. Therefore the sample of collection units
is selected by the canton/regional offices according to a non probability sampling
procedure. Generally speaking, three main approaches to a non probability sampling can
be identified:
a) judgmental (selection of collection units based on the judgement of the experts);
b) cut-off (using an auxiliary variable, such as the turnover, the units above the cut
off value are included);
c) quota (the number of elements is fixed a priori and the selection is delegated to
the collectors).
Since in Bosnia Herzegovina good lists of outlets and accurate information about the
auxiliary variable (turnover) are not so easily available, the judgmental approach is the
most adopted sampling procedure to identify the outlets where the data collection is to be
carried out. In the future greater attention has to be dedicated to the cut off approach.
Anyway, canton/regional offices have to take into account some general criteria in
adopting the judgmental approach:
a) the number of selected outlets depends on the demographic and geographic
width of the town;
b) the type of outlet has to be selected on the basis of the weight of each typology in
the local distribution. For example, if in a town modern distribution (department
stores, chain stores, supermarket, hypermarket) has a weight of 40% in terms of
market quote, whereas traditional distribution (mini market, traditional shops,
open market, other unit) has the remaining 60% and the amount of outlets in
the sample is equal to 10, four elementary prices have to be collected in outlets
belonging to modern distribution and six in outlets belonging to the traditional
one;
c) outlets have to be selected so as to take account of the prevalent behaviour of
consumers: the more frequented outlets have to be included in the sample.
1.7 The sample of products
The basket of products for Bosnian CPI in 2005 consisted of 642 and in 2006 of 646
products. They were selected in order to represent all the different typologies of products
15
available in the market, to cover the entire spectrum of consumption that is summarised
in COICOP classification and to take into account, as required by European Regulation
1749/96, the weights of the COICOP categories (the greater the weight of the category,
the wider the spectrum of products belonging to that category).
For each of the 646 items data collection and data entry are carried out by
canton/regional offices respectively of FIS and RSIS, and Brcko District. Then micro
indices calculated for each elementary item in each outlet are grouped into 646 products
and then 580 representative positions elementary indices by geometric means. The
results of the Household Budget Survey carried out in 2004 in the framework of the
cooperation project with Istat, provided the weights used to group the 580 representative
positions elementary indices.
The assumption underlying the selection of the basket is that the prices of products
belonging to the same category show a common profile, so that changes in the price of
one of them should reflect the changes in the prices of the entire category. The prices
collected for the basket selected to calculate Bosnian CPI should represent the price
changes of all the goods and services purchased in the market by consumers through
monetary transactions.
The list of 646 products is defined at country level and it is common to the two
Entities. Obviously, in each town one ore more products may not be available: in that
town prices will be collected for other products composing the same representative
position or higher aggregate. The basket of products for 2005 has been agreed and
revised for 2006 by BHAS, FIS and RSIS on the basis of the experience in the field. It is
transmitted to the Regional Offices with the following information:
a) An extension of the COICOP code (6 digits, each consisting of two positions) that
identifies univocally each product. The code represents an extension of the
COICOP code fixed in the international version of COICOP for HICP;
b) a brief denomination of the products;
c) a more detailed description of the product that should steer the work of the
collectors in identifying the specific item for which prices will be collected. For
example: whipped cream is the denomination of the product with code
01.01.04.02.08 and the description is whipped cream, 20% fats, in plastic cups;
d) the unit of measurement by which the official quantity is defined;
e) the official quantity, that is a way to report the price collected (that could be
referred to different quantities observed) to a common quantity a priori defined
for each product. In fact, the official quantity could be different from the quantity
collected. In the case of butter, industrial production (code 01.01.05.01.01), the
official quantity is 1000 grams, whereas the price could be collected for packages
16
of 250 or 500 grams. It is very important that the collectors record the exact
quantity the price collected is referred to, so that the procedure automatically
calculates the average price for 1000 grams of butter.
The work carried out to estimate the weights for CPI on the basis of HBS data started
from matching the HBS basket with the CPI basket of products. The results of this
matching have stressed the improvements obtained for CPI basket in 2005 but also the
persistent partial coverage in some sectors: 75 HBS headings have no direct
representation in the CPI basket, that represent 24,4% in terms of number of HBS
headings but about 5% of the total expenditure of households that are referred to the
coverage of consumer price survey. These findings suggest two main improvements to be
implemented for 2007:
a) to widen the elementary items for which prices are collected in order to complete
the coverage in terms of household expenditure;
b) to take into account a closer relationship between HBS and CPI basket for 2007
HBS. This task has to be stressed because of the difficulties found in matching
the 2 baskets during the procedures for estimating the weights for CPI.
1.8 Selection of the single items for which prices are collected
The second step of sampling, that is assigned to the canton/regional offices and to
the collectors, is the selection of elementary items.
The detailed description of each product helps the collector identify the item for which
the price has to be recorded. For example, regarding the product 01.01.04.02.04.06 fruit
yoghurt, the description specifies fruit yoghurt in plastic cups: the collector shall not take
into account yoghurt sold loose by kilo. But the description is not enough to identify the
very single item for which the price has to be collected. The same product, specified by
the description adopted, is available in different varieties, is produced by different brands
and is available in different packages. These three elements (variety, brand and package)
are often very important in fixing the level of the price of a product, and, depending on
their mix, prices for the same product may vary noticeably.
For example Soup pasta (white flour with eggs) is available in outlets in different types
(long or short pasta), different brands (Barilla, Buitoni, etc.) or different sizes of packages
(for example half or one kilo). For fresh fruits it is possible to find different types
(varieties) of the same products. For clothes a lot of types and brands are available for
the same products. In general, the price of each elementary item belonging to the
products of the basket, with its own description, is influenced by these three main
elements:
17
a) Variety; EUROSTAT defines the variety as a more detailed description of the
particular item selected in an outlet by the price collector within the item
specification provided by the National Statistical Institute. For fresh fruits and
vegetables varieties are the natural ones, whereas for appliances varieties are
represented by technical characteristics of the products;
b) brand, that allows to identify the producer of each products (for example Levi's
for jeans or Lavazza for coffee);
c) the package or quantity collected, that can be specified in terms of weight (as in
the case of many food products), of piece or unit (as is the case with many
clothes).
The mix of information regarding product, outlet, variety, brand and quantity
collected identifies exactly the elementary item for which prices have to be collected
monthly or bimonthly.
The collector has to identify the elementary item according to the criterion of the more
sold item, that means that in a specific outlet for a specific product, he has to select the
variety, the brand and package more sold. In order to select the item he/she can ask
information about the quantities sold for each product to the sales director in the case of
big chains of distribution or to the single retailer in the case of traditional distribution.
The identification of each single item has to be carried out at least once a year during
the change of base and it has to be monitored monthly in order to maintain the
representativeness of the items in terms of consumer behaviour. Monitoring the
representativeness of each item selected means checking that it remains the more sold; if
it loses this requisite, it has to be substituted (see § 1.10).
For each elementary item a quotation has to be collected (monthly or bimonthly).
The amount of quotations that have to be collected for each product in each town is
fixed, at the beginning of the year, on the basis of the following elements:
a) price variability, that depends on the type of product and the characteristics of
the local market;
b) the local trade distribution; to fix the amount of elementary quotations to be
collected, it has to be taken into account whether the modern distribution
(hypermarket, supermarket, etc.) is prevalent compared to the traditional trade;
c) the geographic extension;
d) the demographic width;
e) the weight of the product with respect to other products in the basket.
As a general rule, it seems correct to fix a minimum number of elementary quotations
to be collected in each town involved in the survey and data collection:
18
a) for food products it can be fixed at seven;
b) for non food products this threshold can be fixed at five;
c) for a list of services (gas for households, electric energy, monthly ticket for city
transport, ecc.) for which only one elementary quotation is normally available in
the local market the previous thresholds are not valid;
d) the threshold of 7 and 5 are not valid for all those products for which the
situation of trade distribution in each town does not make available enough
outlets. In some small towns for example, cars may be sold only in 2 or 3 outlets;
in this case the amount of elementary quotes to be collected can be less than 5.
In general, it is a good practical rule to avoid including in the sample all the outlets
that sell a specific product. For example if there are 8 outlets that sell bread, it would not
be difficult to include all the outlets in the sample, but should one of them close
definitively, it would be impossible to replace it: therefore it is advisable to keep one of
them as possible substitute.
1.9 Missing observations
A crucial requirement for CPI is the sample maintenance (at least for one year in the
case of chain indices with annual sample revision as in BiH CPI): it is essential in order
to register the price changes taking into account the approach of the pure price index
(see § 1.2). This requirement implies that a missing price has to be estimated in the short
term, whereas a replacement has to be carried out when the missing observation
persists. Therefore appropriate procedures for estimating missing observations and
carrying out elementary item replacements are essential. European Regulation 1749/96
is the main reference for the issues of missing observation and replacements.
Concerning the issue of missing observation dealt with in this paragraph, point (g) of
article 2 says:
“Estimated price is a price which is substituted for an observed price and is based on
an appropriate estimation procedure. Previously observed prices shall not be regarded as
estimated prices unless they can be shown to be appropriate estimates.”
On the other hand European Regulation and EUROSTAT do not fix what are the
appropriate procedures to estimate the missing observation.
For the time being the practice adopted for BiH CPI is the estimation of a missing
observation through the previously observed price with very strict temporal limits,
consistent with European Regulation that fixes in two months the maximum period when
an estimated price can be adopted, for carrying forward this price and replacing the
missing elementary item. It is clear that in the next future other procedures (starting
19
from the class mean imputation) to estimate the missing observation have to be tested in
order to compare the results obtained with the results coming from the present
procedure adopted.
In a month or in one of the two for bimonthly products, a collector may not record the
price for the elementary item under observation, for one of the following causes:
a) data collection was not carried out for any justified reason;
b) temporary closing of the outlet;
c) definitive closing of the outlet;
d) item temporarily not available;
e) item definitively not available;
f) item not available for seasonal reasons.
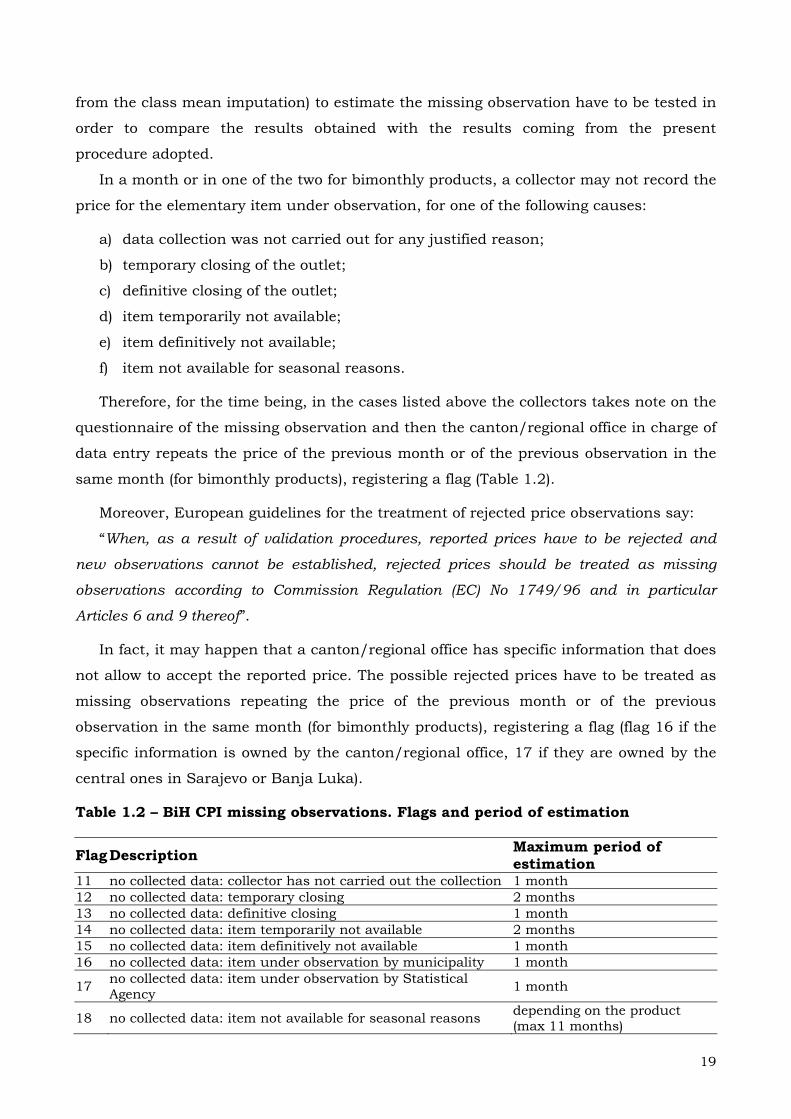
Therefore, for the time being, in the cases listed above the collectors takes note on the
questionnaire of the missing observation and then the canton/regional office in charge of
data entry repeats the price of the previous month or of the previous observation in the
same month (for bimonthly products), registering a flag (Table 1.2).
Moreover, European guidelines for the treatment of rejected price observations say:
“When, as a result of validation procedures, reported prices have to be rejected and
new observations cannot be established, rejected prices should be treated as missing
observations according to Commission Regulation (EC) No 1749/96 and in particular
Articles 6 and 9 thereof”.
In fact, it may happen that a canton/regional office has specific information that does
not allow to accept the reported price. The possible rejected prices have to be treated as
missing observations repeating the price of the previous month or of the previous
observation in the same month (for bimonthly products), registering a flag (flag 16 if the
specific information is owned by the canton/regional office, 17 if they are owned by the
central ones in Sarajevo or Banja Luka).
Table 1.2 – BiH CPI missing observations. Flags and period of estimation
Flag Description Maximum period of estimation
11 no collected data: collector has not carried out the collection 1 month 12 no collected data: temporary closing 2 months 13 no collected data: definitive closing 1 month 14 no collected data: item temporarily not available 2 months 15 no collected data: item definitively not available 1 month 16 no collected data: item under observation by municipality 1 month
17 no collected data: item under observation by Statistical Agency 1 month
18 no collected data: item not available for seasonal reasons depending on the product (max 11 months)
20
1.10 Managing elementary item replacements
In general the replacement of an elementary item is due to a change in at least one of
the four aspects that identify each elementary item:
a) brand; the brand for which the price was collected until the previous month is
no longer available or it has lost the requisite of "more sold" brand;
b) variety; the variety for which the price was collected until the previous month is
no longer available or it has lost the requisite of "more sold" variety;
c) package; that specific package for which the price was collected until the
previous month is no longer available or it has lost the requisite of "more sold"
package;
d) outlet; the outlet where the price collection was carried out has definitively
closed. Therefore a substitution is necessary for all the products available in the
outlet closed.
The replacement of an elementary item introduces the issue of quality adjustment
because, in the majority of cases, the elementary item replacing implies a change in
quality. Also for quality adjustment European Regulations fix only some general criteria.
In particular Regulation 1749/96 in article 5, says:
“1. HICPs for which appropriate quality adjustments are made shall be deemed to be
comparable. Where quality changes occur, Member States shall construct price indices by
making appropriate quality adjustments based on explicit estimates of the value of the
quality change. In the absence of national estimates, Member States shall use estimates
based on information provided by the Commission (EUROSTAT) where these are available
and relevant.
2. Where no estimates are available, price changes shall be estimated as the difference
between the price of the selected substitute and that of the item it has replaced. In no case
should a quality change be estimated as the whole of the difference in price between the
two items, unless this can be justified as an appropriate estimate.”
A task force has been set up by EUROSTAT in order to deal with the issue of quality
adjustment. For the time being, the choice suggested has been the case by case
approach, that is to say for different groups of products a ranking of the quality
adjustment methods is done (from A methods, i.e. the reference ones, to C methods, that
should not be used). In general, methods for quality adjustment can be divided in explicit
and implicit: European Regulation 1749/96 recommends the adoption of explicit
estimates but also the implicit methods are acceptable with the exception of attributing
the whole of the difference between the two prices (the price of the previous elementary
21
item and the price of the replacing one) to the quality change (price change taken as
quality change).
In BiH CPI the approach adopted is the overlap: the value of the quality change
between the elementary item and the replacing one is assessed in terms of difference in
price between the two items in a period when both items are available.
Therefore, whatever is the case of substitution, the collector has to record the price of
the replacing item in the previous month. The price is recorded in the dedicated cell of
the questionnaire. On the basis of the availability of the prices respectively of the
replaced and the replacing item for the previous month, the procedure will recalculate a
new base for the micro index adopting the following proportion:
PN : PO = BN : BO
where
PN = previous month price for the new item;
PO = previous month price for the old item;
BN = calculation base for the new item (unknown term);
Bo = calculation base for the old item;
The unknown term is obtained as
O
O
N
O
ON N B
PP
PBPB ⇒==
Therefore the possible difference in the price of the replacing elementary item is taken
into account in the micro index calculated on the new base obtained through the above
proportion. The above calculation is made automatically by the procedure. The collector
has to note carefully only the information about the previous month price for the new
item. In general, we can deal with two possible cases:
a) the previous price of the new item has been observed by the collector. If the
collector during the monthly/bimonthly collection has been warned by the seller
that the item for which he is collecting the price will not be available in the next
period, and in every case the elementary item selected is either temporarily not
available (missing observation with flags 12 and 14) or it is definitively not
available but the collector is able to select the new elementary item (see § 1.13)
the collector has to choose the replacing item on the basis of the criterion of
"more sold", and he has to note, apart from the questionnaire, the
characteristics of the new item including price, in order to manage the
information about the previous month price when he/she will be obliged to carry
out the substitution;
22
b) the previous price of the new item is unknown, and it has to be estimated. It
could be estimated on the basis of an information provided by the seller or, for
the time being, adopting the repetition of the price of the current month as an
estimate of the price in the previous month.
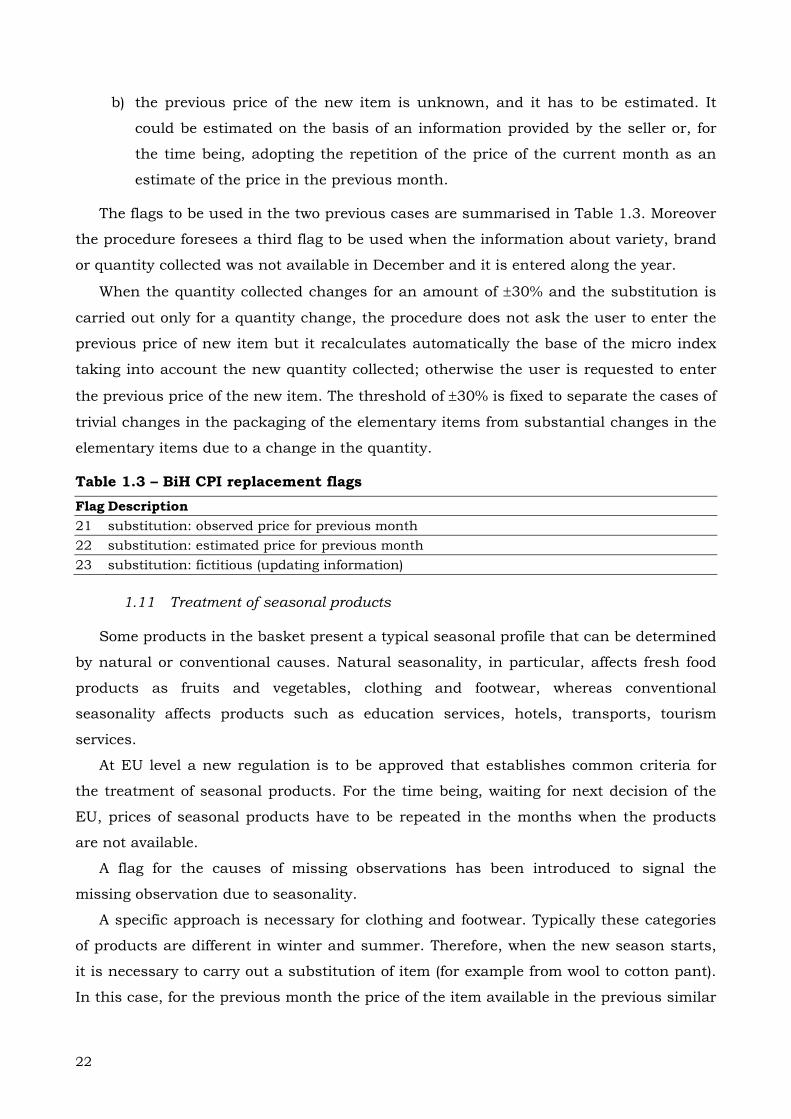
The flags to be used in the two previous cases are summarised in Table 1.3. Moreover
the procedure foresees a third flag to be used when the information about variety, brand
or quantity collected was not available in December and it is entered along the year.
When the quantity collected changes for an amount of ±30% and the substitution is
carried out only for a quantity change, the procedure does not ask the user to enter the
previous price of new item but it recalculates automatically the base of the micro index
taking into account the new quantity collected; otherwise the user is requested to enter
the previous price of the new item. The threshold of ±30% is fixed to separate the cases of
trivial changes in the packaging of the elementary items from substantial changes in the
elementary items due to a change in the quantity.
Table 1.3 – BiH CPI replacement flags
Flag Description 21 substitution: observed price for previous month 22 substitution: estimated price for previous month 23 substitution: fictitious (updating information)
1.11 Treatment of seasonal products
Some products in the basket present a typical seasonal profile that can be determined
by natural or conventional causes. Natural seasonality, in particular, affects fresh food
products as fruits and vegetables, clothing and footwear, whereas conventional
seasonality affects products such as education services, hotels, transports, tourism
services.
At EU level a new regulation is to be approved that establishes common criteria for
the treatment of seasonal products. For the time being, waiting for next decision of the
EU, prices of seasonal products have to be repeated in the months when the products
are not available.
A flag for the causes of missing observations has been introduced to signal the
missing observation due to seasonality.
A specific approach is necessary for clothing and footwear. Typically these categories
of products are different in winter and summer. Therefore, when the new season starts,
it is necessary to carry out a substitution of item (for example from wool to cotton pant).
In this case, for the previous month the price of the item available in the previous similar
23
season has to be entered, if the two items are comparable in terms of brand and
materials used (type of garment, quality of leather, etc.).
1.12 Temporary reductions of prices
EU Regulation 2602/2000 has established that temporary reductions of price have to
be registered for the calculation of HICP. Article 2 of the Regulation fixes 4 conditions to
record the price reductions:
"(…) such reductions
a) can be attributed to the purchase of an individual good and service;
b) are available to all potential consumers with no special conditions attached
(fidelity cards, paying two pieces to purchase three, etc.);
c) are known to the purchaser at the time when they enter into the agreement with
the seller to purchase the product concerned;
d) can be claimed at the time of purchase or within such a time period following the
actual purchase that they might to be expected to have a significant influence on
the quantities purchasers are willing to purchase."
The conditions above have been deepened in the guidelines for the treatment of
reduced prices in the harmonized index of consumer prices (HICP): these guidelines5 are
the reference also for consumer prices data collection in Bosnia Herzegovina.
Condition d) fixed by Regulation 2602/2000 was implemented for BiH HICP
establishing that a reduction of price has to be taken into account if it remains available
at least 15 days.
For BiH, indeed, two indices will be calculated: the CPI will be calculated on the basis
of the full prices observed, whereas the HICP will be calculated on the basis of the full
and the possibly reduced prices. Therefore, when the temporary reduction of price
matches the requirements defined above, the collector has to record it in the dedicated
cell of the questionnaire. At least one of the two information (the reduced price or the
percentage of reduction) has to be registered in the questionnaire: the procedure will
calculate the missing one. On the basis of the kind of information available, the person
in charge of data entry has to record one of the flags in Table 1.4.
Table 1.4 – BiH CPI: flags for temporary reductions of price
Flag Description 40 reduced price 41 full price, reduced price and percentage of discount collected 42 price and reduced price collected 43 price and percentage of discount collected 44 price, reduced price and percentage of discount collected 5 (Compendium of HICP – Reference documents 2/2001/B/5, page 351)
24
If a new item with a reduced price is available to replace the old one, at present the
procedure does not allow to manage both the substitution and the registration of the
reduced price. Therefore the collector has to register the full price of the new item, asking
to the seller or calculating it on the basis of the percentage of reduction and he has to
indicate the substitution; the following month, if it continues, the reduced price will be
collected and recorded in the questionnaire.
At last, as the reduction has to be temporary, if the price reduction lasts for more
than three months, at the fourth month the reduced price becomes full price and the
collector has to record it in the cell dedicated to the full price.
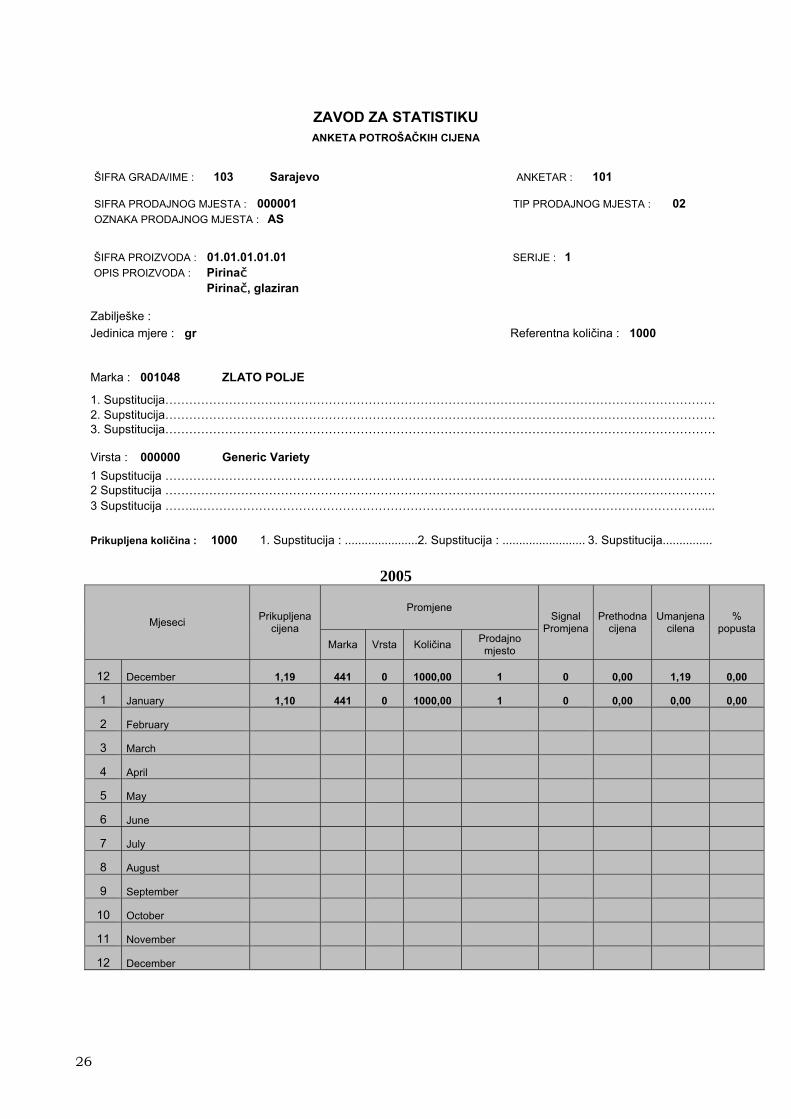
1.13 The questionnaire for monthly data collection
The following pages show an example of monthly questionnaire that can be
downloaded from the procedure for data entry. Each questionnaire refers to each single
item selected for the price collection. It contains all the information necessary to identify
exactly each single item: this information is available in the first part of the
questionnaire. The questionnaires for each town are printed at the beginning of the year
and they show all the general information inserted in the database (besides general
information on the product, all the information regarding the outlet, the brand, the
variety, the quantity collected for each product) together with the price of December (i.e.
the base for the calculation index). The canton/regional offices in collaboration with the
collectors prepare a book for each outlet with all the questionnaires for the different
items, so that the collector can organise efficiently his/her tour of price collection.
Below the information about brand and variety and near information on the quantity
collected, three empty spaces are available to record the denomination of the new brand,
variety or the amount of the new quantity collected when the collector has to substitute
the item for which he/she collected previously the price (see § 1.10 for instructions to
manage correctly the substitutions of items).
In the second section of the questionnaire (a table), at the beginning of the year, the
price for December, together with the codes of brand, variety, collection unit and the
figure of quantity collected are available.
For the months starting from January, each collector has to record the full price
collected for the current month. If the item is the same as the previous month, in the
columns following the column of price he has to repeat all the information of the previous
month and, in case, record the reduced price or the percentage of discount (see § 1.12 for
rules on temporary reductions of prices). If the collector has to replace the elementary
item, he has to mark with "x" the cell corresponding to the substitution managed (it may
be a substitution of brand and/or variety and/or outlet and/or quantity collected) and
25
record the price of the new item for the previous month. Moreover, in the column of
signal he has to write 21 if the price of the previous month is actually observed, 22 if it is
estimated.
When a substitution is carried out, it is recommended to print the questionnaire with
the new information and provide it to the collector.
In the case of substitution of an outlet (the outlet substitution is a task of the
canton/regional office, not of the collector), normally the steps are the following:
a) the collector informs the office that an outlet has to be substituted, for example
for definitively closing. For that month the collector repeats the price of the
previous month, writing 13 in the column of signal;
b) the office identifies a new outlet the collector shall visit showing the letter of
presentation of the survey (if it is not already in the sample), and possibly
identifying a new item for that product. For example, it could happen that in
the previous outlet for the product man's blue jeans the more sold jeans was
Levi's, whereas in the new one is Wrangler. The collector takes note of the
characteristics of this new item and records the price for that month in a
provisional sheet;
c) In the following month, the collector visits the new outlet with the
questionnaire referred to the previous outlet; he/she takes definitively note of
the substitution of the outlet and eventually of the item together with the price
of the current month and the price of the previous month that he/she had
noted in the provisional sheet;
d) The canton/regional office registers the information provided by the collector
and prints the new questionnaire that the collector inserts in the book of the
new outlet.
1.14 The questionnaire for bimonthly data collection
The following pages present an example of bimonthly questionnaire that can be
downloaded from the procedure for data entry.
Compared to the monthly questionnaire, the main difference in the first part is the
absence of information about brand, because this information is not present and nor
relevant for fresh vegetables and fruits, that are the products for which price are
collected bimonthly.
26
ZAVOD ZA STATISTIKU ANKETA POTROŠAČKIH CIJENA
ŠIFRA GRADA/IME : 103 Sarajevo ANKETAR : 101
SIFRA PRODAJNOG MJESTA : 000001 TIP PRODAJNOG MJESTA : 02 OZNAKA PRODAJNOG MJESTA : AS
ŠIFRA PROIZVODA : 01.01.01.01.01 SERIJE : 1 OPIS PROIZVODA : Pirinač Pirinač, glaziran
Zabilješke : Jedinica mjere : gr Referentna količina : 1000
Marka : 001048 ZLATO POLJE 1. Supstitucija………………………………………………………………………………………………………………………… 2. Supstitucija………………………………………………………………………………………………………………………… 3. Supstitucija…………………………………………………………………………………………………………………………
2 February 3 March 4 April 5 May 6 June 7 July 8 August 9 September
10 October 11 November 12 December
27
ZAVOD ZA STATISTIKU ANKETA POTROŠAČKIH CIJENA ZA SVJEŽE POVRĆE I VOĆE
ŠIFRA GRADA/IME : 103 Sarajevo ANKETAR : 102
SIFRA PRODAJNOG MJESTA : 000015 TIP PRODAJNOG MJESTA : 06 OZNAKA PRODAJNOG MJESTA : PIJACA CIGLANE ŠIFRA PROIZVODA : 01.01.04.02.05 SERIJE : 1 OPIS PROIZVODA : Mileram DOAMĆI i INDUSTRIJSKI Zabilješke : Jedinica mjere : gr Referentna količina : 1000
In the second part, besides the absence of any kind of information about brand, there
are no cells for reduced prices (that are supposed not to be significant for such products)
and there are two cells for the bimonthly observations.
Therefore signals of substitution are available only for substitutions due to change in
the outlet, in the variety or in the quantity collected. The way to manage the signal of
substitution is the same as the monthly questionnaires, except for the possibility of a
change in the quantity collected for both the observations.
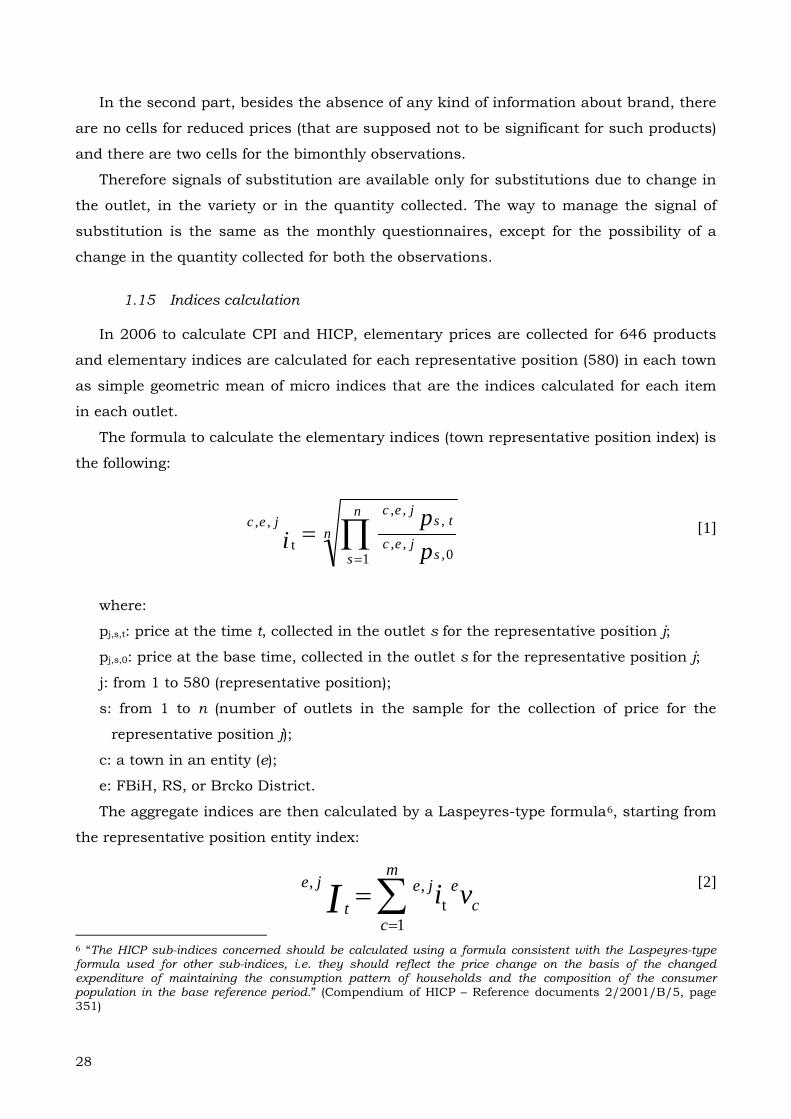
1.15 Indices calculation
In 2006 to calculate CPI and HICP, elementary prices are collected for 646 products
and elementary indices are calculated for each representative position (580) in each town
as simple geometric mean of micro indices that are the indices calculated for each item
in each outlet.
The formula to calculate the elementary indices (town representative position index) is
the following:
[1]
where:
pj,s,t: price at the time t, collected in the outlet s for the representative position j;
pj,s,0: price at the base time, collected in the outlet s for the representative position j;
j: from 1 to 580 (representative position);
s: from 1 to n (number of outlets in the sample for the collection of price for the
representative position j);
c: a town in an entity (e);
e: FBiH, RS, or Brcko District.
The aggregate indices are then calculated by a Laspeyres-type formula6, starting from
the representative position entity index:
[2]
6 “The HICP sub-indices concerned should be calculated using a formula consistent with the Laspeyres-type formula used for other sub-indices, i.e. they should reflect the price change on the basis of the changed expenditure of maintaining the consumption pattern of households and the composition of the consumer population in the base reference period.” (Compendium of HICP – Reference documents 2/2001/B/5, page 351)
29
∑=
=2
1,,
, we
ej
tej
tejBiH II
∑=
=580
1,
, wj
je
tjce
tc iI
where:
c: from 1 to m (number of towns in each entity);
e
cc p
pv = that is the population in canton/region/district c as percentage of the
population in entity e (population estimated on the basis of the results of HBS
referred to 2004).
Again the Laspeyres-type formula is used to calculate the representative position
country index:
[3]
where:
BiHj
ej
ej
hchcw = that is the weight in terms of value of households consumption of the
representative position j in an entity e as percentage of the value of households
consumption of product j in Bosnia Herzegovina as a whole. The weights are estimated
on the basis of the results of the HBS referred to 2004. The weights used to build the
single product country index are the so called horizontal weights for the matrix used to
estimate them. The matrix consists of 580 rows and 2 columns: the marginal column
presents the values of consumption at country level for each of the 580 representative
positions, whereas the marginal row shows the values of the total consumption of each
entity. Horizontal weights are the relatives of the previous matrix with respect to the total
by row, whereas the vertical ones are the relatives with respect to the total by column.
Starting from formulae [1], [2] and [3] it is possible to build the all items indices
respectively for each town, entity and for Bosnia Herzegovina as a whole.
The Laspeyres-type formula is used to calculate the all items town index:
[4]
where:
∑=
je
je
je
hchc
w that is the weight (vertical) in terms of value of households
consumption of the product j in the entity e as percentage of the value of household
30
∑=
=580
1, w
jj
etj
et
e II
∑=
=580
1
BiH,
BiHt w
jjtj
BiH II
consumption of all the products in the entity e. The weights are estimated on the basis of
the results of HBS referred to 2004.
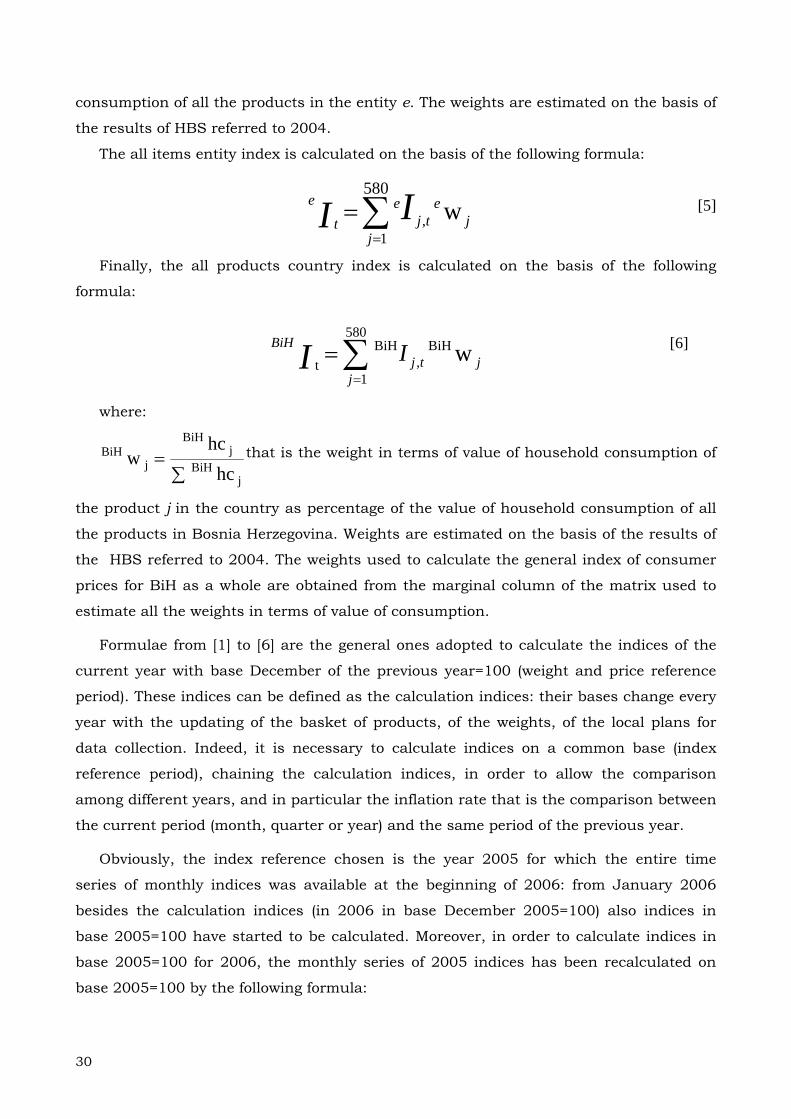
The all items entity index is calculated on the basis of the following formula:
[5]
Finally, the all products country index is calculated on the basis of the following
formula:
[6]
where:
∑=
jBiH
jBiH
jBiH
hchc
w that is the weight in terms of value of household consumption of
the product j in the country as percentage of the value of household consumption of all
the products in Bosnia Herzegovina. Weights are estimated on the basis of the results of
the HBS referred to 2004. The weights used to calculate the general index of consumer
prices for BiH as a whole are obtained from the marginal column of the matrix used to
estimate all the weights in terms of value of consumption.
Formulae from [1] to [6] are the general ones adopted to calculate the indices of the
current year with base December of the previous year=100 (weight and price reference
period). These indices can be defined as the calculation indices: their bases change every
year with the updating of the basket of products, of the weights, of the local plans for
data collection. Indeed, it is necessary to calculate indices on a common base (index
reference period), chaining the calculation indices, in order to allow the comparison
among different years, and in particular the inflation rate that is the comparison between
the current period (month, quarter or year) and the same period of the previous year.
Obviously, the index reference chosen is the year 2005 for which the entire time
series of monthly indices was available at the beginning of 2006: from January 2006
besides the calculation indices (in 2006 in base December 2005=100) also indices in
base 2005=100 have started to be calculated. Moreover, in order to calculate indices in
base 2005=100 for 2006, the monthly series of 2005 indices has been recalculated on
base 2005=100 by the following formula:
31
[7]
Both for indices in base December of the previous year=100 and the indices in base
2005=100, the choice adopted was rounding at the fourth decimals for all the levels of
aggregation. It is important to stress that the all items index and all the sub indices (at
level of division, group, class or voice of product) are calculated directly from the indices
of the representative positions so that no information is lost for consecutive rounding.
By formula [7], also the index of December 2005 in base 2005=100 has been
calculated.
10020052005,12
=I is the starting point to chain in a common base the indices of 2006 in
base December of the previous year=100, through the formula
[8]
[8] will be adopted also to build up the time series of indices for 2007 in base
2005=100, starting from the index in base 2005=100 of December 2006.
1.16 Weights estimation
“The weights of the HICP are the aggregate expenditures by households on any set of
goods and services covered by the HICP expressed as a proportion of the total expenditure
on all goods and services within coverage”7.
Weights for 2005 CPI basket were estimated with data on household expenditure
coming from the Household Budget Survey carried out in 2004.
The procedure for the estimation has been driven through the following steps:
a) HBS headings that are out of the coverage of CPI have been excluded. Therefore
self consumption, expenditures for games for chance, expenditure for
7 (Compendium of HICP – Reference documents 2/2001/B/5, page 20)
)4),12
/((
12
1
10020042005,
10020042005,
10020052005,
∑=
=
==
= m
decm
decmm
IIroundI
)4),12
/((
12
1
10020042005,
10020042005,12
10020052005,12
∑=
=
==
= m
decm
decI
IroundI
)4)),100/(*(( 10020052006,
10020052005,12
10020052006,
===
= decmm IIroundI
32
extraordinary maintenance of the house and imputed rentals for owner-occupied
houses have not been considered;
b) the HBS heading for which correspondence in the CPI basket does not exist were
attributed to the HBS headings belonging to the same CPI voices of product in
proportion to the weight of each HBS heading with respect to the voice of
product or higher aggregate;
c) the issue of splitting the HBS headings among the 642 products was carried out
taking account of the lack of sources able to provide recent reliable information.
Therefore, when possible and reasonable, the data used to split HBS data among
the products have been:
• the weights used in the Federation in 2003;
• Italian data, where the assumption that the consumer behaviour are no so
different between BiH and Italy was reasonable.
When splitting HBS data was not possible, products were grouped into representative
positions for which indices are calculated as geometric mean of micro indices (calculated
for each elementary item in each outlet). Therefore, where splitting was carried out there
is a one-to-one relationship between product and representative position, whereas where
splitting was not carried out some products were grouped into one representative
position. Finally, the weights estimated in terms of expenditure have been normalized to
sum up 1.000.000. Therefore, for each representative position an elementary index is
calculated and then each representative position participates in the calculation of the
aggregate indices with its own weight (see § 1.15).
For the 2006 CPI basket the same procedure has been adopted, taking into account
that the total amount of product has risen to 646, but the weights, obtained for the 580
representative positions and expressed in expenditure values, have been updated to
December 2005 through the consumer price indices of December 2005 in base December
2004=100. For the new representative positions8, the value of the expenditure has been
updated by the consumer price index of the level of aggregation immediately higher.
The updating of the weights was carried out for the very CPI based exclusively on the
full prices collected and for the HICP base on the full and the possibly reduced prices: of
course weights for HICP have been calculated using the 2005 HICP. 8 For the 2006 CPI basket of products, 9 representative positions of 2005 have been eliminated and 9 have been added but one of the new representative positions actually is the aggregation of 2 old ones. In particular, 04.03.01.01.05, 05.04.01.01.06, 06.02.01.01.01, 06.02.01.01.02 09.01.05.01.02, 09.04.02.01.01, 09.05.01.01.02, 09.05.04.01.04, 09.05.04.01.06 are the codes that have been eliminated whereas 05.04.01.01.14, 06.01.02.01.03, 06.02.01.01.03, 06.02.02.01.03, 06.02.03.01.01, 06.02.03.02.01, 09.05.01.02.04, 09.05.04.01.08, 09.05.04.01.09 are the new representative positions (06.02.01.01.03 is the aggregation of the previous codes 06.02.01.01.01, 06.02.01.01.02). Therefore the number of representative positions has remained the same but really the composition of the basket has changed.
33
The CPI weights calculated for 2005 and 2006 at level of COICOP divisions are listed
and compared in Table 1.5
Table 1.5 – BiH CPI 2005 and 2006 weights comparison
Divisions BiH Federation SR
2005 2006 2005 2006 2005 2006
Food And Non-Alcoholic Beverages 332730 330068 338913 337078 319202 315414
Clothing And Footwear 63742 60228 64115 62270 63206 56643
Housing, Water, Electricity, Gas And Other Fuels 107396 111763 103105 104754 116030 125255 Furnishings, Household Equipment And Routine Maintenance Of The House 86220 82321 87045 83736 85160 80204
Health 46616 44357 41517 40372 56621 52094
Transport 124429 130138 121821 128085 128551 133113
Communication 31947 35054 32853 34591 30490 36155
Recreation And Culture 43084 41114 44537 42907 40803 38248
Education 12146 11667 12503 11976 12161 11754
Restaurants And Hotels 32212 30893 35209 34124 26968 25342
Miscellaneous Goods And Services 77208 76098 78996 76920 74070 74813
1.17 Tasks and role of the collectors
The role of the price collector is crucial in the survey. According to the descriptions
associated with each product in the basket, to the criteria resumed in § 1.8 and to the
instructions received, he/she has to select the elementary item for which collecting
prices in the outlet selected by the canton or regional Offices that could provide further
instructions to the collector. He/she has to collect the actual purchase price practiced,
that could be also different from the price in the price-list, at the time of the visit.
Possibly he/she has to collect also the reduced price, if available. Moreover, the collectors
have to manage the replacement of the elementary items that could be no longer
available, they have to assure an accurate data collection, following a strict calendar,
noting all the information they need to carry out their work.
As a general rule, it is very important that the collectors are expert, fully aware of the
main aspects and aims of the survey and able in managing the questionnaires.
It is preferable that the first contact with the outlet is established through an official
letter of presentation by the canton/regional offices. Then the collector has to visit each
month (or twice a month) the outlet, maintaining a good level of cooperation with the
seller.
The behaviour of the collector has to be driven by a few simple rules:
a) He/she has not to show his/her opinion about topics that are not part of their
tasks, such as political, social or other topics;
b) He/she has to record the prices without comments on their increase or decrease;
c) He/she has to remind the seller of the monthly visit;
34
d) He/she has not to ask for favours of any kind. In general the collector has to
keep an impartial behaviour with the interviewees;
e) He/she has to be recognised by the seller.
1.18 The calendar of data collection
Taking into account the regulation recently approved by the European Union, the
data collection shall be carried out from the 1 to 21 of the month in question.
Data collection will be carried out bimonthly for fresh vegetables and fruits in the first
and the third week of the reference month. In the future also prices for automotive fuels
and other energetic products will be collected bimonthly. The prices of all the remaining
goods and services will be collected monthly.
For monthly products data collection has to be carried out so as to keep always the
same time interval between each monthly collection: this means that if an outlet is
visited by the collector on the first of the month, that outlet shall be visited always on the
first of the month without changing the day of collection.
For tariffs, such as gas, electricity, water supply and taxi, the prices to be registered
are those current on the 15 of the month in question.
According to European Regulation, the changes in the price of services have to be
registered in the Consumer Price Index when the consumers start the utilization of the
service to which those changes are associated and come into force.
For each group of products the collection has to be distributed along the entire
working period of the data collection avoiding concentrating in a few days single groups
of products. Therefore canton and regional offices together with the collectors have to fix
a very strict calendar for the collection and respect it. If the fixed day of price collection
falls on a week end or an holiday, the collection is moved up to the first useful working
day.
1.19 Production and dissemination calendar and rules9
In the fourth week of the month (from 22 to 28), the local offices send the average
prices, the indices of the representative positions in base December of the previous year
and the check tables (these by fax and e-mail) to the central offices of the entities (Brcko
to the Agency). The central offices of the entities (and the Agency for Brcko) check the
average prices and indices and, through the check tables, the micro data and ask local
offices to check possible mistakes in the micro data by controlling the questionnaires or
9 Althought we plan to follow the production and dissemination calendar and rules exsposed in this paragraph, for the first period it will be reconciled with the agreement made by the directors of statistical institutes in Bosnia and Herzegovina.
35
returning in the field: if necessary, local offices revise and edit the micro data. Each
central office and the Agency for Brcko carry out random controls in the field to verify the
accuracy of the price collectors work.
As soon as the micro data are checked and edited, the central offices and the Agency
validate the micro data. As soon as the micro data are validated in the first week of the
month following the reference one, local offices calculate the town reference base indices
and transmit them together with the average prices and the indices of the representative
positions in base December of the previous year to the central offices and to the Agency.
The central office of the Federation transmits to the office in the Republika Srspka the
index in base December of the previous year of the representative position
07.03.03.01.01 (“Tickets for air”) in order to complete the indices of the basket of
products that is unique for the entire country and allows RSIS to calculate the all-items
index for the entity. Starting from January 2007 (and December 2006 as base), prices for
07.0.3.03.01.01 will be entered in Banja Luka. The central offices of the entities calculate
the entity aggregate indices in base 2005=100 and the Agency calculate the country
aggregate indices in base 2005=100; Brcko does not participate in the calculation of the
aggregate reference base indices of the Federation, whereas it participate in the
calculation of the indices of the representative positions in base December of the
previous year for the Federation to calculate the country aggregate indices. Once the
central offices of the entities and the Agency have validated the entity reference base
indices and the Agency has validated the country reference base indices:
• the entities prepare press releases to disseminate and comment the reference
base current month and the previous month indices, the rate of change of the
current month/quarter (for March, June, September and December data) with
respect to the previous one, the rate of change of the current month/quarter
with respect to the same month/quarter of the previous year, for both CPI and
HICP, for the all items indices and divisions at level of Entities and for the all
items indices of the towns, making remarks for the groups at entity level and for
the divisions at town level (time series for divisions and general indices will be
made available in electronic format on the web site and for groups on demand);
• the Agency prepares press releases to disseminate and comment the reference
base current month and previous month indices, the rate of change of the
current month/quarter (for March, June, September and December data) with
respect to the previous one, the rate of change of the current month/quarter
with respect to the same month/quarter of the previous year, for both CPI and
HICP, for the all items indices and divisions at level of country and for the all
36
items indices of the entities, making remarks for the divisions at entity level and
for the groups at country level (time series from groups to general indices will be
made available in electronic format in the web site and for classes on demand).
The dissemination of the press releases will be carried out at the same time by central
offices of the Entities and by the Agency, according to a Press Release Calendar defined
before for the entire 2007. The dissemination dates should be scheduled for the second
week of the month following the one to which data are related. The indices of the current
month will be denominated preliminary, whereas the indices of the previous month will
be denominated definitive, to allow possible further revisions in the following month.
Together with the dissemination of the definitive indices, the entities and the Agency
will make available on their websites the average price referred to the official quantity for
a list of products of large consumption, warning users not to use these data with the aim
of calculating the temporal changes that are correctly measured by the indices.
For 2007 a press release calendar shall be defined on the basis of the previous rules;
during 2007 efforts will be done to schedule in 2008 flash estimates of the current month
in the last days of the month to which the data are referred and a definitive release of the
indices for the second week of the month following the one to which the data are referred.
Flash estimates will be disseminated by the Agency with the reference base indices and
the rates of change above mentioned for the general indices and for the divisions at level
of Agency and only for the general indices at level of entities. With the definitive release
central offices of the entities and Agency will disseminate all the indices listed before:
revisions of the indices of the previous month will still be possible in 2008 and no longer
starting from January 2009. Flash estimates will be calculated using the data of some of
the towns that participate in the calculation of the Consumer Price Indices, granting that
at least 50% of the population of BiH is covered in terms of population of Region and
Cantons of the towns where data collection is carried out. The use of a partial
information will imply the adoption of an estimate procedure for the temporary missing
data in terms of estimation of the indices of representative positions in base December of
the previous year for the towns that did not sent the data to the Central Offices and to
the Agency. Therefore partial information means that all the indices of a town are used or
not, to calculate the flash estimate: the use of some of the indices of one town is not
admitted. In 2007 estimate procedures will be implemented.
All the rules above described entered into force starting from June 2007, when the
first press release will be disseminated: starting from this date, the dissemination of
retail price indices will be interrupted and their calculation will be carried out only for
legal purposes when necessary.
37
2. BiH Consumer price indices (2005 January – 2006 December)10
2.1 General remarks concerning BiH inflation in 2006
From January 2005 the consumer price data collection has started in both entities
and in Brcko District according to the methodological issues resumed in Chapter 1 of the
present volume. The period adopted as base of the calculation indices is December 2004.
Therefore, starting from January 2005 indices in base December 2004=100 have been
calculated. From January 2006 the period adopted as base of the calculation indices is
December 2005 and indeed, starting from this date, indices in base December 2005 have
been calculated. As described in paragraph 1.15, from January 2006 in addition to the
calculation indices (in 2006 in base December 2005=100) also indices in base 2005=100
have started to be calculated.
At the time of the drafting of the volume indices until December 2006 have been
elaborated, and time series at every level of aggregation of the 2006 hierarchical
structure from January 2005 to December 2006 are available. Therefore, it is possible to
analyze monthly data from January 2005 and annual data concerning 2006. In this
paragraph some general comments have been sketched.
The entire dataset and the analysis are referred to the COICOP divisions, for the
country as a whole, the two entities (FBiH and RS) and the Brcko District, for indices
without temporary reductions of prices and indices with temporary reduction of prices.
Of course, 24 monthly rates of change with respect to previous months have been
calculated, 12 monthly rates of change with respect to the same month of the previous
year (from January to December 2006) and the annual 2006 rates of inflation are
available.
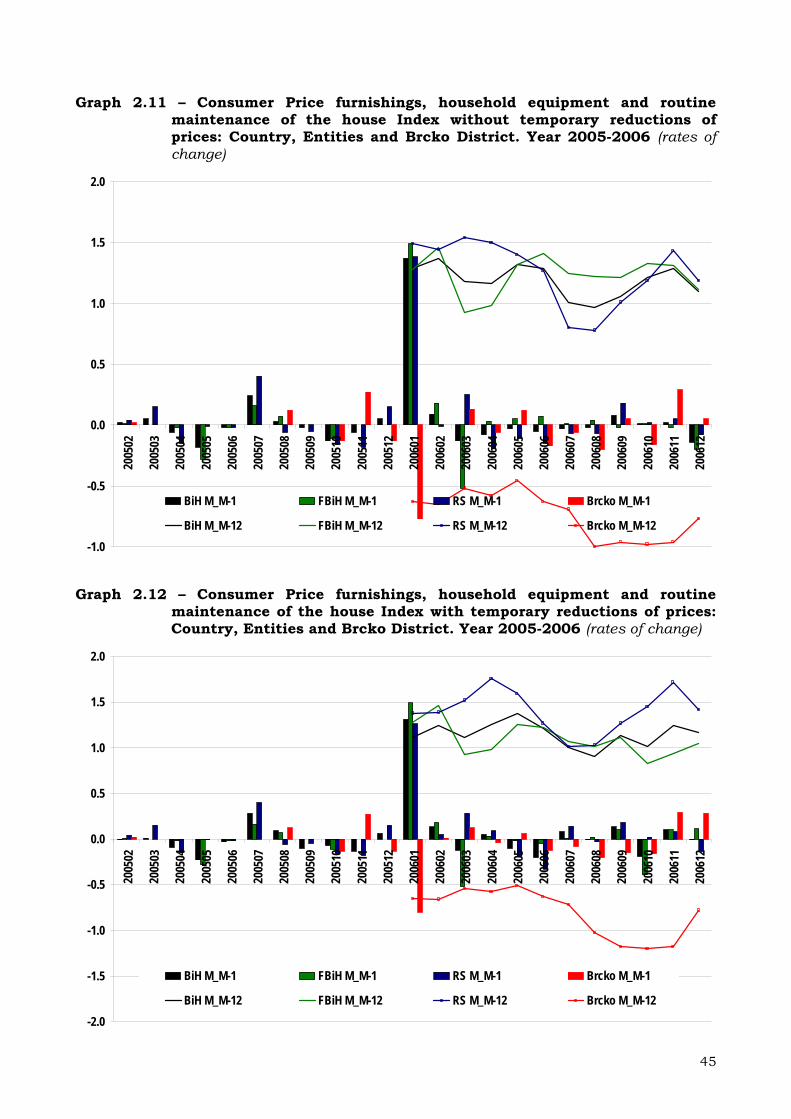
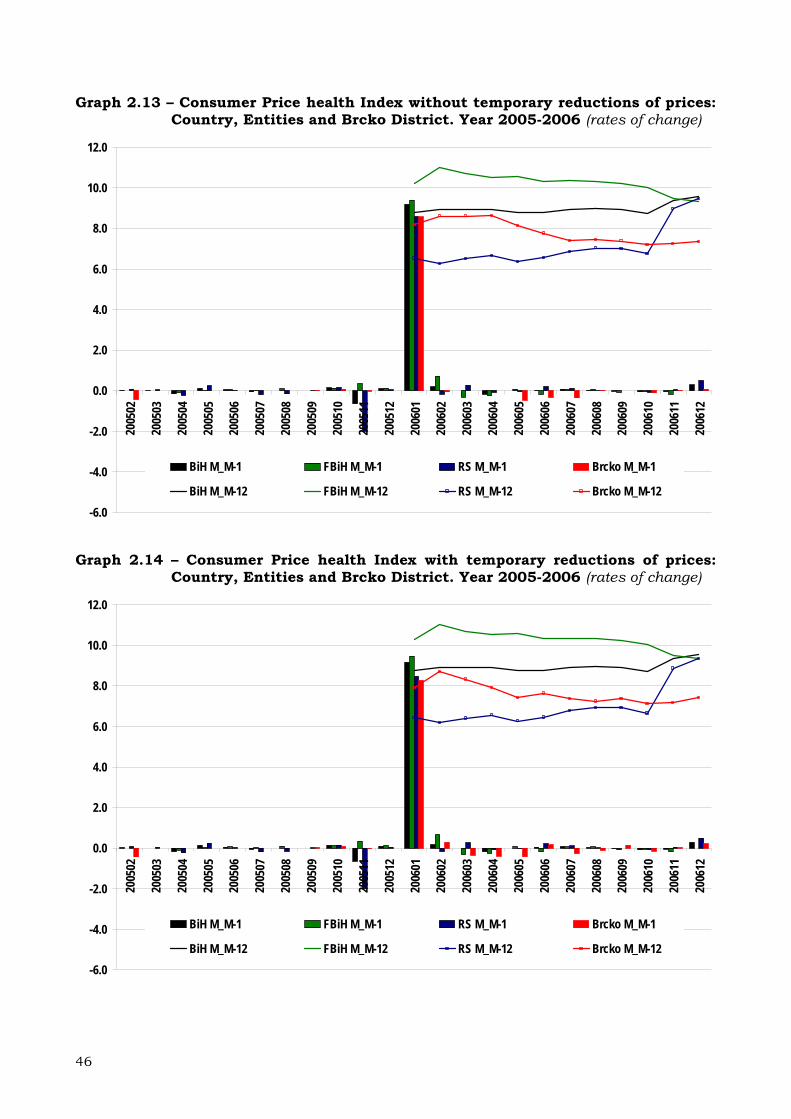
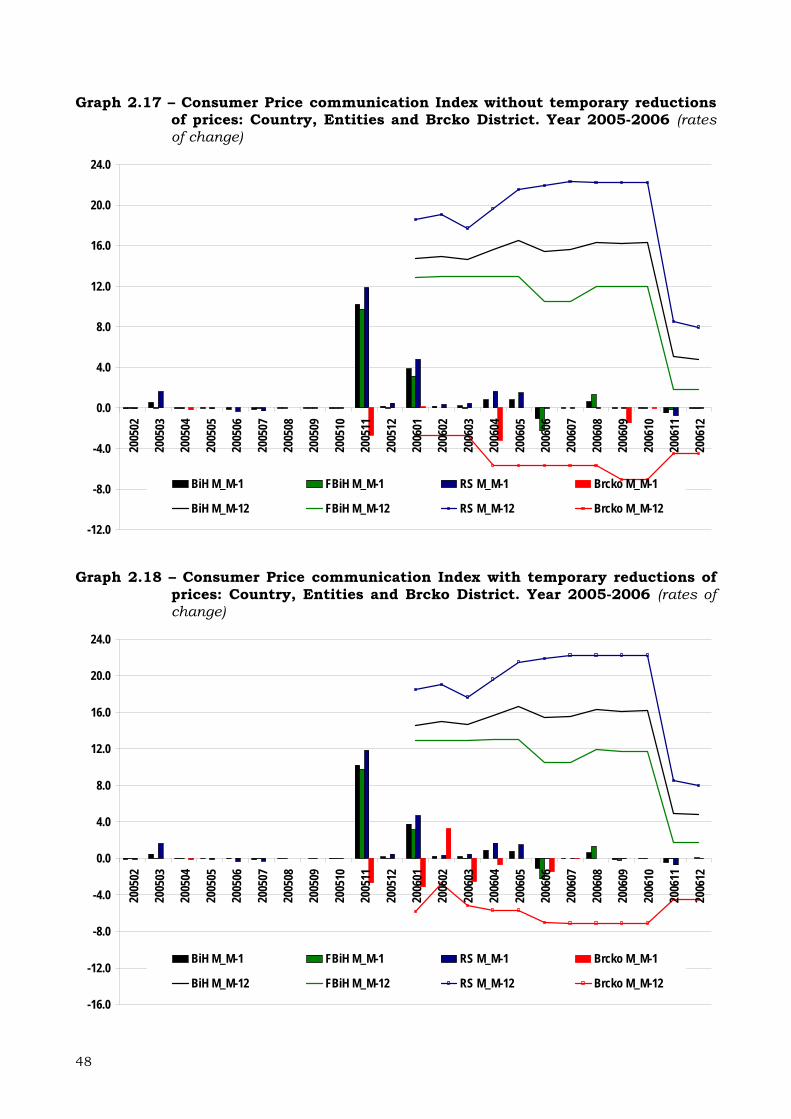
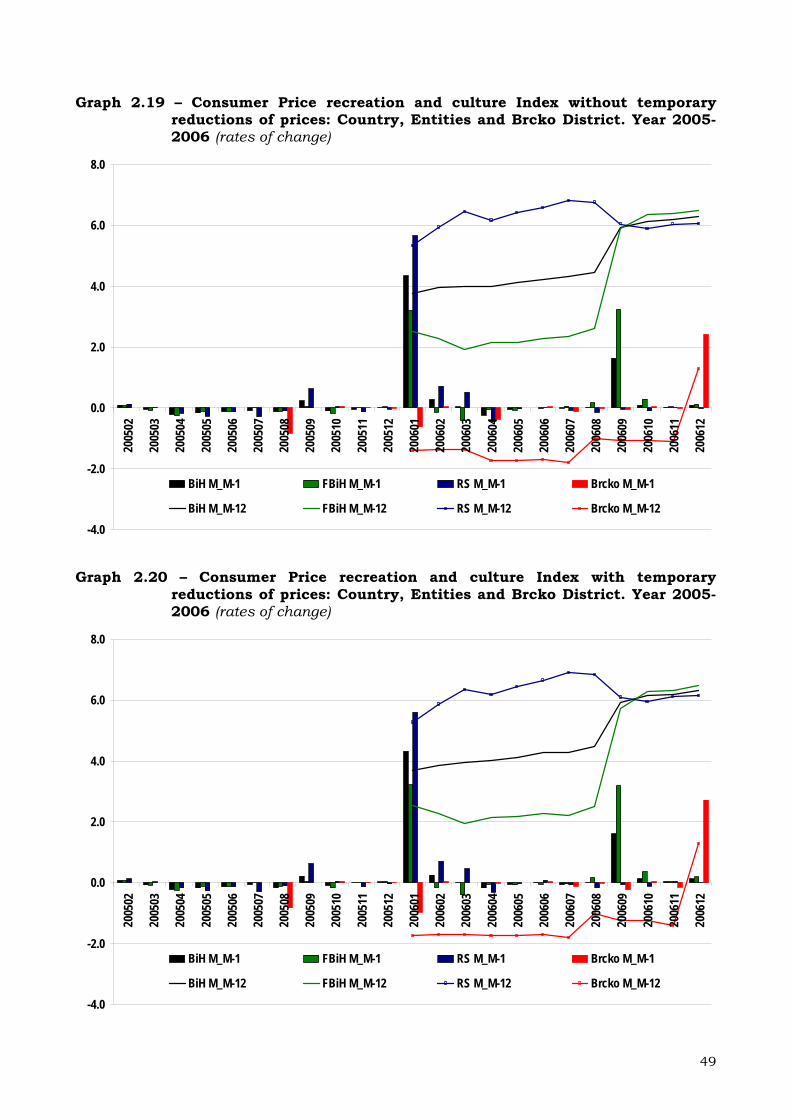
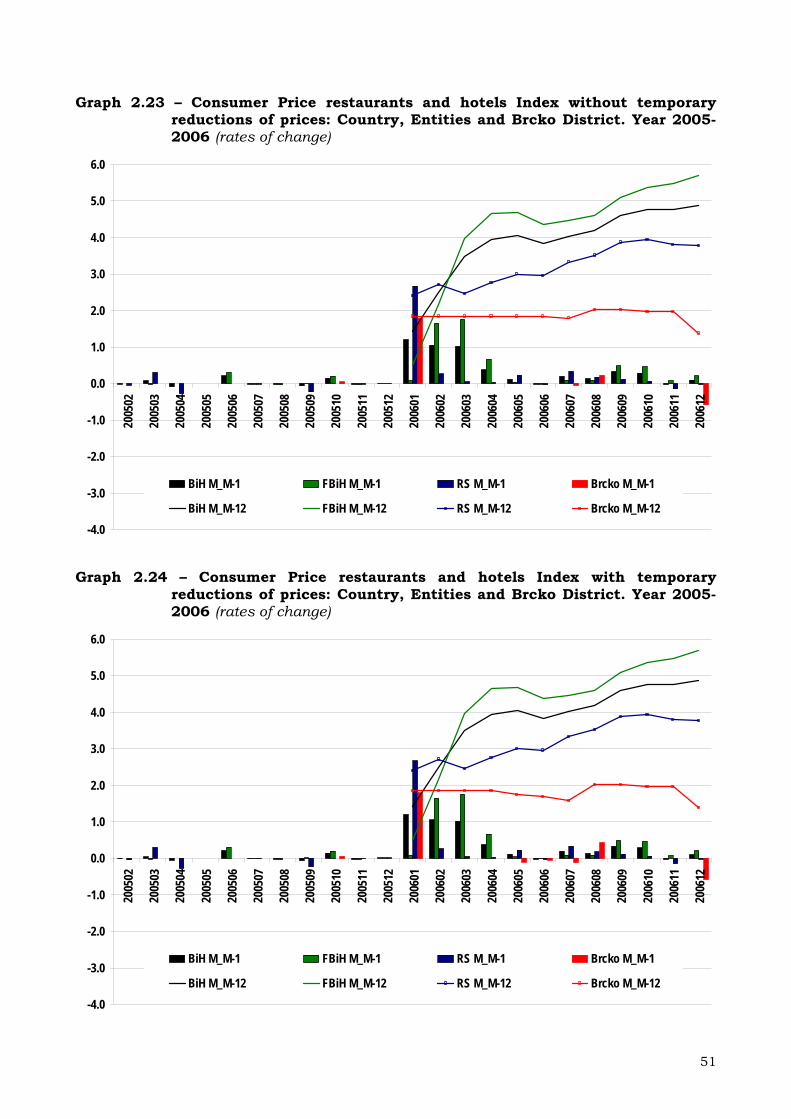
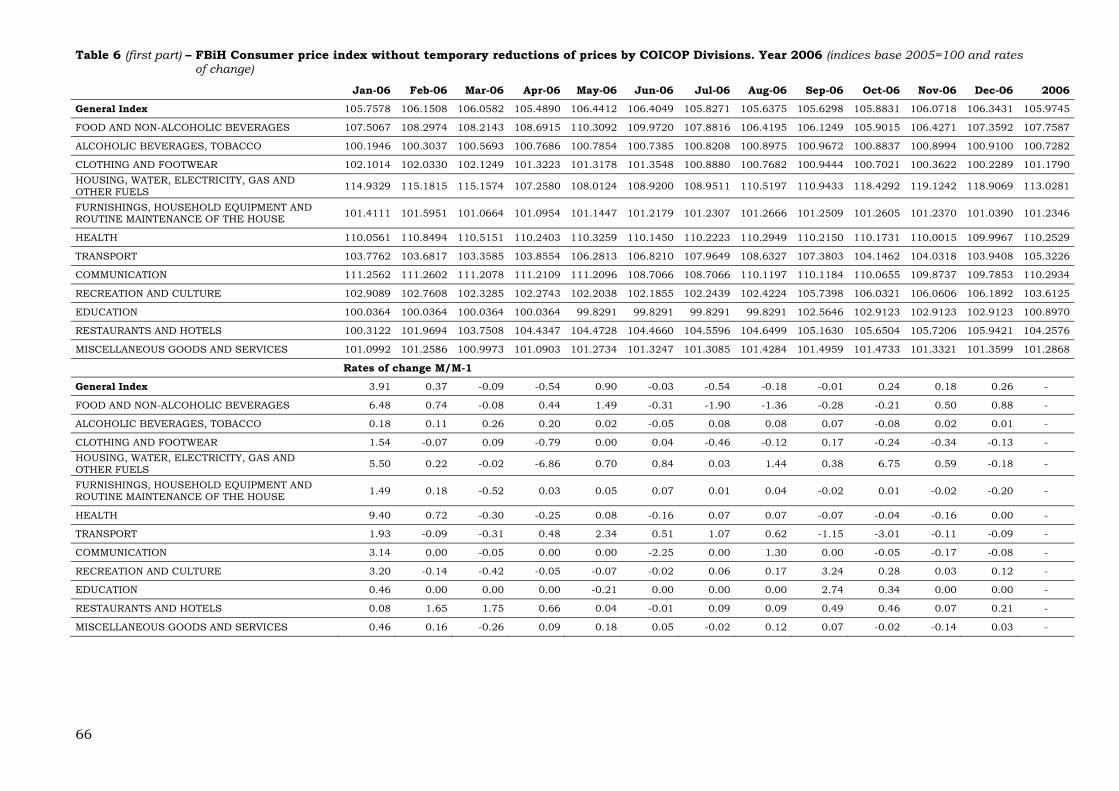
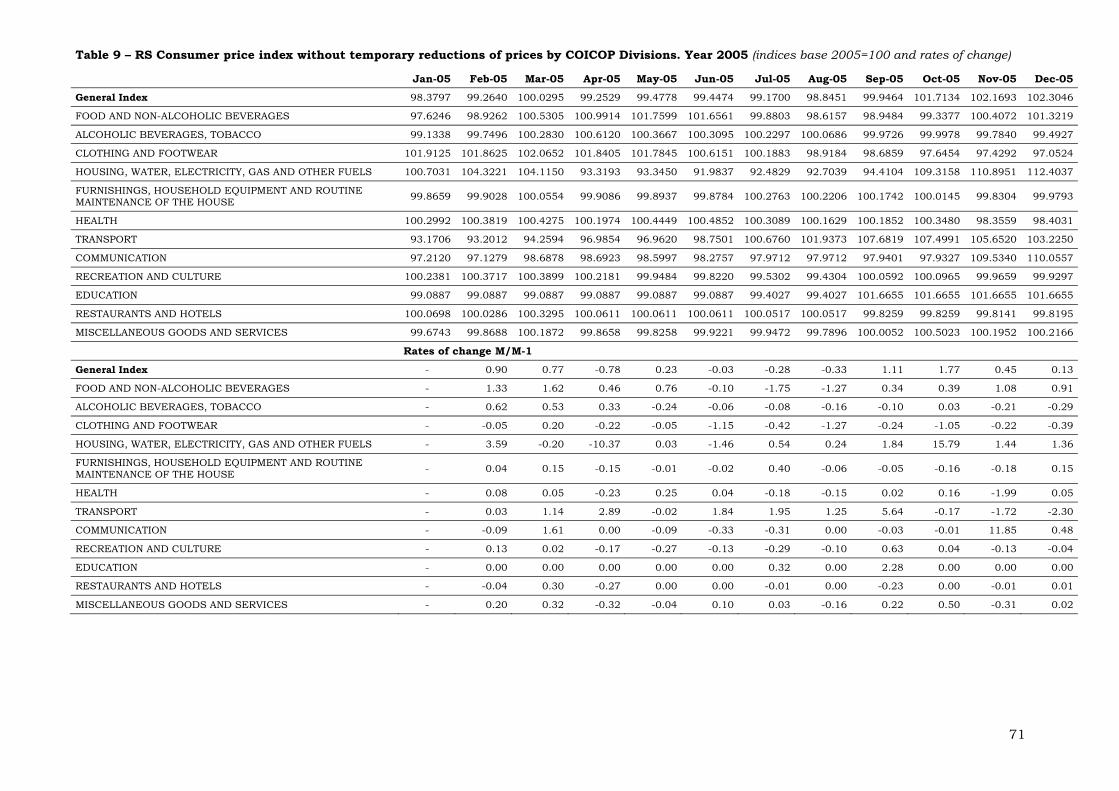
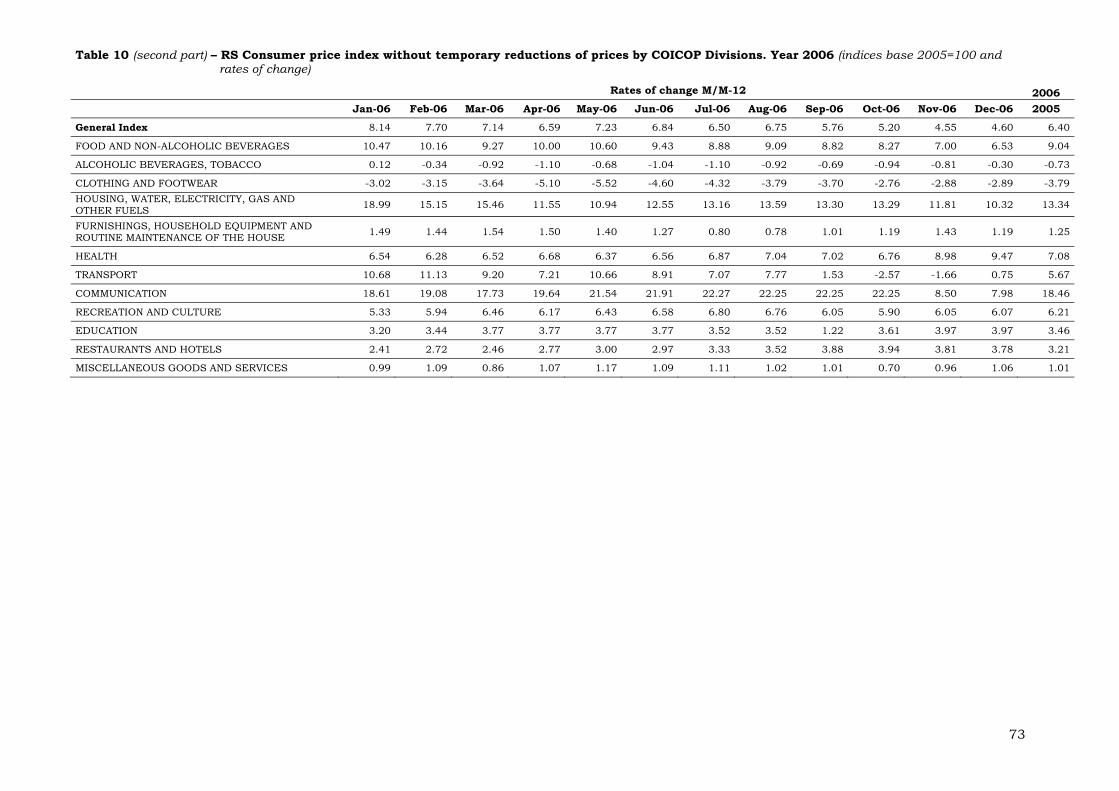
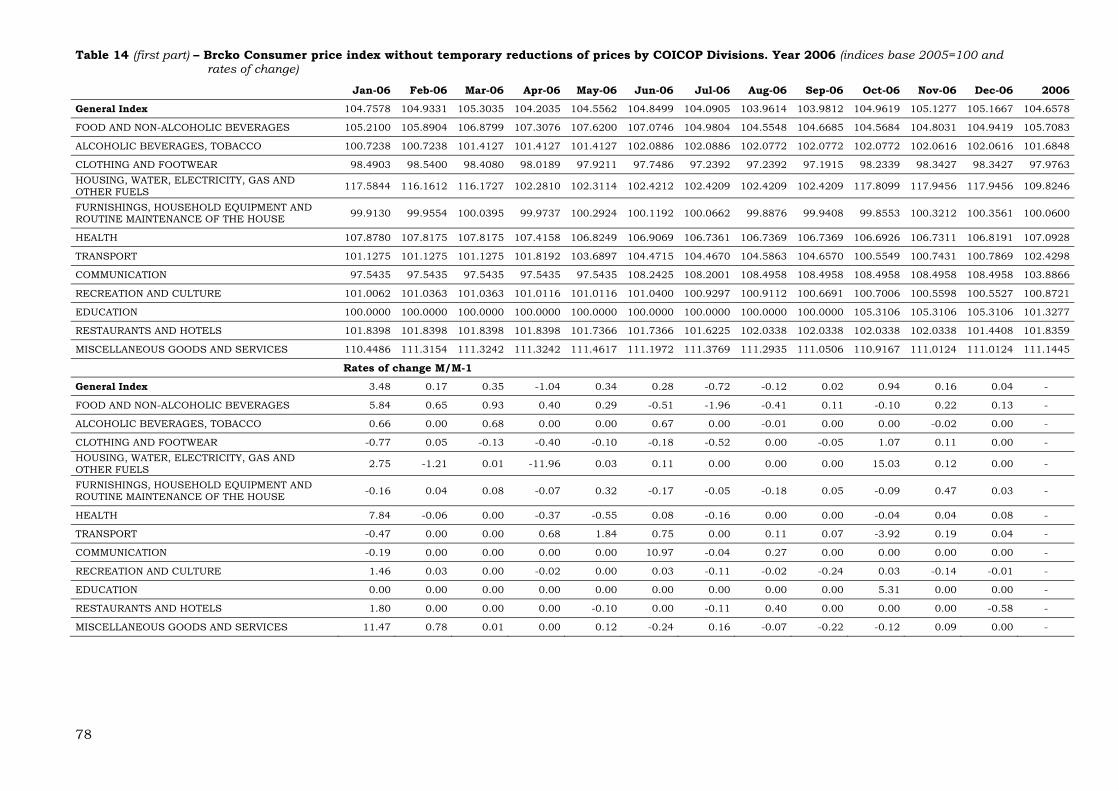
In graphs from 2.1 to 2.26 rates of change with respect to the previous month and
rates of change with respect to the same month of the previous year are displayed, both
without taking into account temporary reductions of prices and taking into account
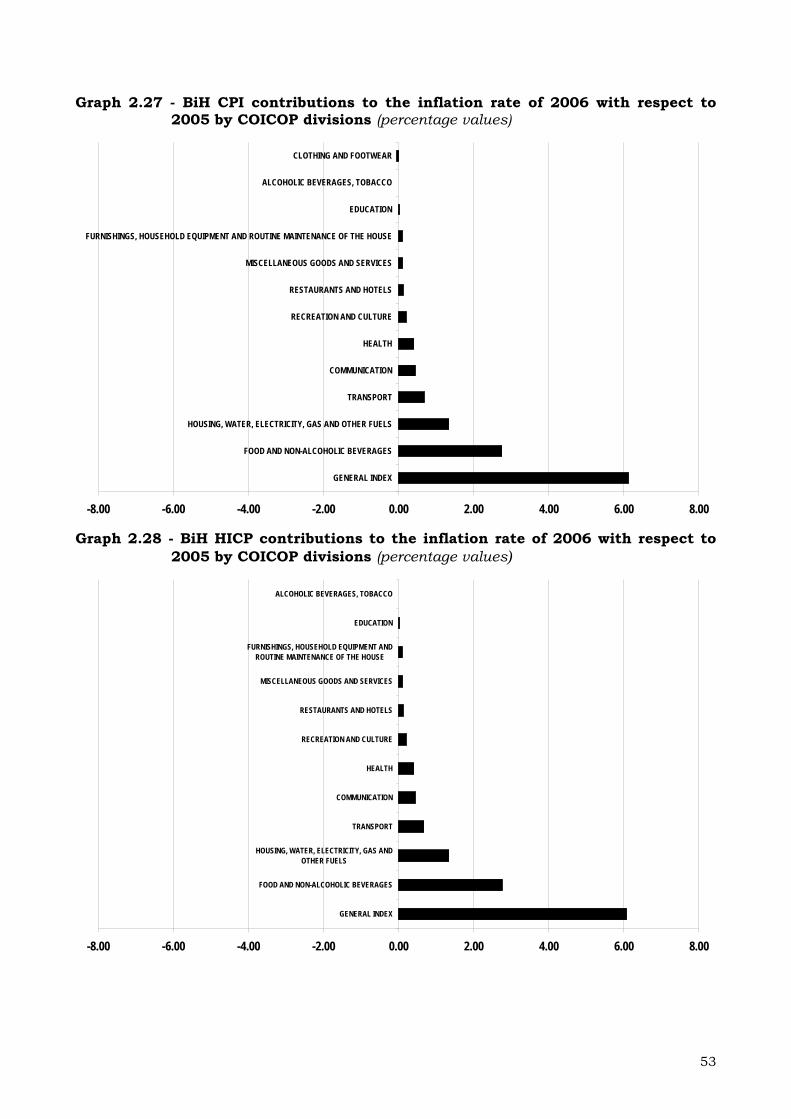
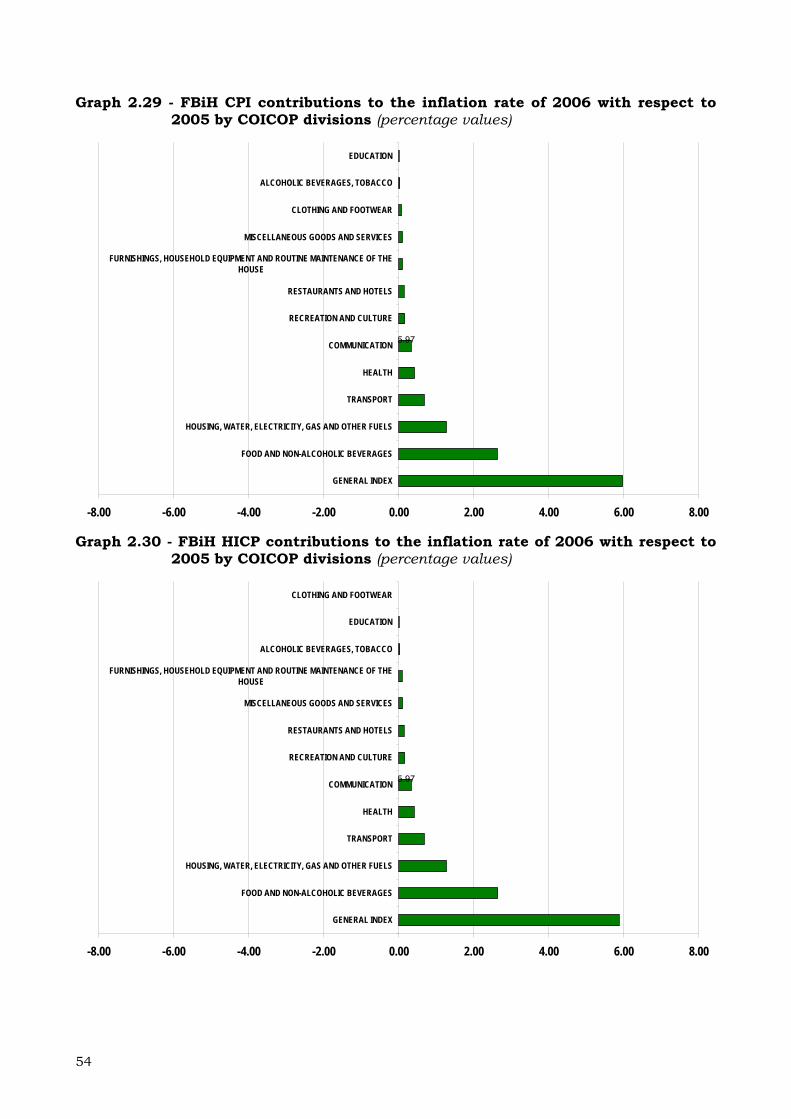
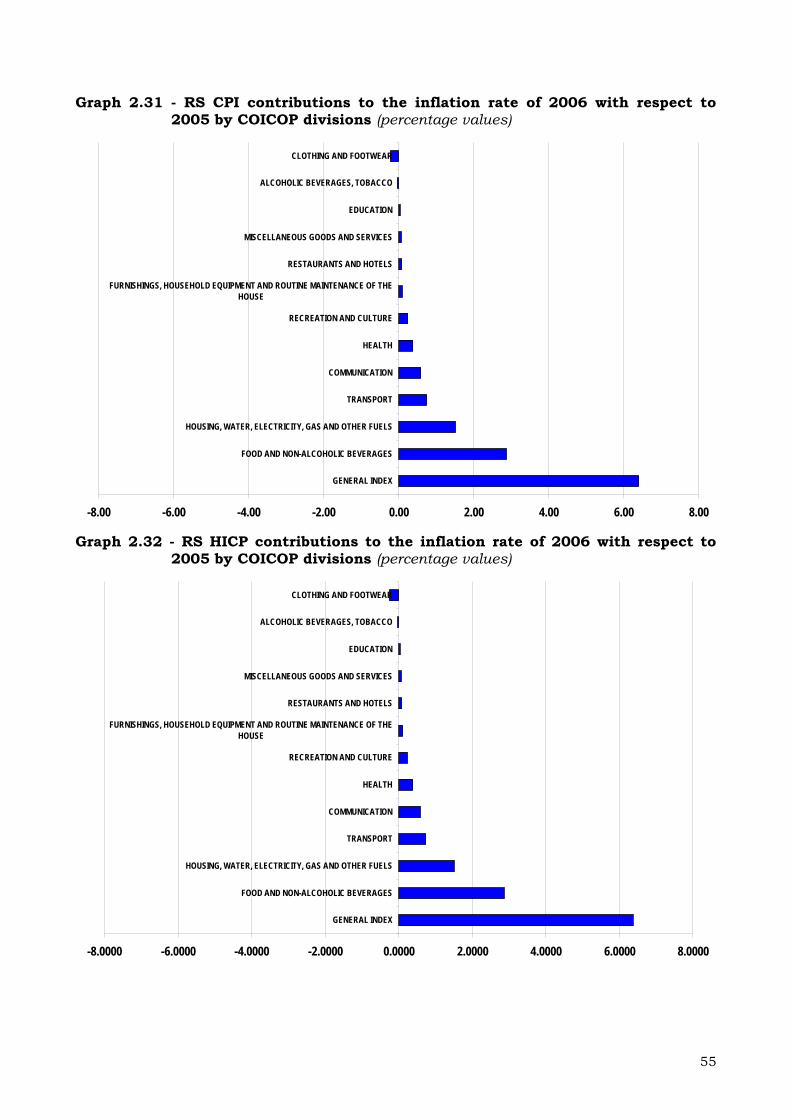
temporary reductions of prices. Graphs from 2.27 to 2.34 show the contributions of the
different COICOP divisions to the annual rate of change of 2006 (the annual inflation)
with respect to 2005. Finally, in the statistical tables in the Appendix the level of the
indices and all the rates of change are available.
In terms of economic analysis of inflation in Bosnia Herzegovina, the first issue that
has to be stressed is a general issue. The level of the inflation calculated through the
rates of change of the current period with respect to the same period of the previous
10 Federico Polidoro, Istat, Division for Price Statistics and Foreign Trade, Price Statistics Section
38
month has sharply increased at the beginning of 2006, in particular in January. This
sharp increase appears to be diffused to the entire basket of products apart from those
belonging to the division of alcoholic beverages and tobacco and to the division of
transport, and it appears to be mainly due to the increase of VAT to 17% that has been
introduced for a large amount of consumption products. For Bosnia Herzegovina as a
whole in January 2006 with respect to December 2005, the general index registered a
rate of change equal to 3.96% and the inflation rate with respect to January 2005 has
been equal to +7.15%.
In FBiH January 2006 inflation has been equal to +6.62%, whereas in RS it has been
+8.14% and in Brcko +5.05%.
In the country, in terms of month to month rates of change, after a further growth in
February with respect to January 2006 (+0.43%) and a very weak increase in March
(+0.09%), in April inflation has decreased with respect to March for seasonal reasons,
mainly due to the prices of electricity that decline after the winter season. After an
increase equal to 0.86% in May, other decreases have been registered in June, July and
August. In the last fourth months of 2006, prices have increased with respect to the
previous month, in particular in October, when the seasonal increase of electricity price
has influenced upward the inflation dynamics (+0,69%). Taking into account that in the
second semester of 2005 the month to month profile of inflation has registered higher
rates of changes, the inflation rate in the second semester of 2006 has declined (in
December it has been equal to +4.55%). In 2006, with respect to 2005, inflation rate has
been equal to +6.12%. The most relevant contribution to this average inflation rate comes
from the division of food and non-alcoholic beverages (+2.75%), followed by the division
of housing, water, electricity, gas and other fuels (+1.34%) and by transport (+0.68%),
thus confirming the important influence on the inflationary profile of Bosnia Herzegovina
of the group of product with a relevant presence of energetic goods. It is clear that the
relevance of the division of food and non alcoholic beverages in the inflation is due to the
weight that it registers in the household expenditure, that in terms of CPI weight
accounts for more than 30% of the entire basket of products.
With reference to 2006, similar dynamics have been registered also in BiH, in RS and
in Brcko District. In RS, it is worth to be noticed that the division of clothing an footwear
provides a negative contribution (-0.23%) to the inflation of 2006.
The temporal profiles of the indices that take into account temporary reductions of
prices are very similar to temporal profiles of the indices that do not take into account
39
temporary reductions of prices, that show their evident effects in the division of clothing
and footwear as expected.
2.2 Graphical analysis of BiH inflation in 2005 and 2006
In the following graphs an analysis of the inflation with reference to both entities, to
Brcko District and to Bosnia Herzegovina as a whole has been carried out.
The graphs concern the general index and the COICOP divisions indices either
without or with temporary reductions of prices.
The indicators represented for the general indices are the level of the indices, the
rates of changes with respect to the previous month and the rates of change with respect
to the same month of the previous year.
At level of COICOP divisions only the two rates of change (with respect to the previous
month and with respect to the same month of the previous year) have been displayed.
The temporal profiles in terms of level of the indices or in terms of the figures and
signs of the rates of change or in terms of temporal profile show a relevant correlation
among the different geographical areas compared.
A similar correlation is shown by the rates of changed referred to the divisions of
transport and communication, whereas for the other divisions the profile, although often
correlated, presents different values and in some case different signs of the rates of
change.
The indices that have been analysed are still provisional, but they represent a very
important and wide representation of the main inflationary dynamics in BiH, based on a
methodological approach that is homogeneous among the different areas and consistent
with the main principles fixed at European level.
40
Graph 2.1 – Consumer Price General Index without temporary reductions of prices: Country, Entities and Brcko District. Year 2005-2006 (indices base 2005=100 and rates of change)
Graph 2.3 – Consumer Price food and non alcoholic beverages Index without temporary reductions of prices: Country, Entities and Brcko District. Year 2005-2006 (rates of change)
-10.0
-8.0
-6.0
-4.0
-2.0
0.0
2.0
4.0
6.0
8.0
10.0
12.0
14.0
2005
0 2
2005
0 3
2005
04
2005
05
200 5
06
2005
07
2005
08
2 005
0 9
2 005
1 0
2005
11
2005
12
200 6
01
2006
02
2006
03
2 006
04
2 006
0 5
2006
0 6
2006
07
200 6
08
200 6
09
2006
10
2006
11
2 006
1 2
BiH M_M-1 FBiH M_M-1 RS M_M-1 Brcko M_M-1
BiH M_M-12 FBiH M_M-12 RS M_M-12 Brcko M_M-12
Graph 2.4 – Consumer Price food and non alcoholic beverages Index with
temporary reductions of prices: Country, Entities and Brcko District. Year 2005-2006 (rates of change)
-10.0
-8.0
-6.0
-4.0
-2.0
0.0
2.0
4.0
6.0
8.0
10.0
12.0
14.0
2005
0 2
2005
0 3
2005
04
2005
05
200 5
06
2005
07
2005
08
2 005
0 9
2 005
1 0
2005
11
2005
12
200 6
01
2006
02
2006
03
2 006
04
2 006
0 5
2006
0 6
2006
07
200 6
08
200 6
09
2006
10
2006
11
2 006
1 2
BiH M_M-1 FBiH M_M-1 RS M_M-1 Brcko M_M-1
BiH M_M-12 FBiH M_M-12 RS M_M-12 Brcko M_M-12
42
Graph 2.5 – Consumer Price alcoholic beverages and tobacco Index without temporary reductions of prices: Country, Entities and Brcko District. Year 2005-2006 (rates of change)
-3.0
-2.0
-1.0
0.0
1.0
2.0
3.0
4.0
2005
02
2 005
0 3
2 005
0 4
2005
0 5
2005
06
2005
07
200 5
08
2005
09
2005
10
2005
11
2 005
1 2
2 006
0 1
2006
02
2006
03
2006
04
200 6
05
200 6
06
2006
07
2006
08
2 006
0 9
2 006
1 0
2006
1 1
2006
12
BiH M_M-1 FBiH M_M-1 RS M_M-1 Brcko M_M-1
BiH M_M-12 FBiH M_M-12 RS M_M-12 Brcko M_M-12
Graph 2.6 – Consumer Price alcoholic beverages and tobacco Index with temporary
reductions of prices: Country, Entities and Brcko District. Year 2005-2006 (rates of change)
-4.0
-3.0
-2.0
-1.0
0.0
1.0
2.0
3.0
4.0
2005
02
2 005
0 3
2 005
0 4
2005
0 5
2005
06
2005
07
200 5
08
2005
09
2005
10
2005
11
2 005
1 2
2 006
0 1
2006
02
2006
03
2006
04
200 6
05
200 6
06
2006
07
2006
08
2 006
0 9
2 006
1 0
2006
1 1
2006
12
BiH M_M-1 FBiH M_M-1 RS M_M-1 Brcko M_M-1
BiH M_M-12 FBiH M_M-12 RS M_M-12 Brcko M_M-12
43
Graph 2.7 – Consumer Price clothing and footwear Index without temporary reductions of prices: Country, Entities and Brcko District. Year 2005-2006 (rates of change)
-8.0
-7.0
-6.0
-5.0
-4.0
-3.0
-2.0
-1.0
0.0
1.0
2.0
3.0
4.0
2005
02
2 005
0 3
2 005
0 4
2005
0 5
2005
06
2005
07
200 5
08
2005
09
2005
10
2005
11
2 005
1 2
2 006
0 1
2006
02
2006
03
2006
04
200 6
05
200 6
06
2006
07
2006
08
2 006
0 9
2 006
1 0
2006
1 1
2006
12
BiH M_M-1 FBiH M_M-1 RS M_M-1 Brcko M_M-1
BiH M_M-12 FBiH M_M-12 RS M_M-12 Brcko M_M-12
Graph 2.8 – Consumer Price clothing and footwear Index with temporary
reductions of prices: Country, Entities and Brcko District. Year 2005-2006 (rates of change)
-8.0
-7.0
-6.0
-5.0
-4.0
-3.0
-2.0
-1.0
0.0
1.0
2.0
3.0
4.0
2005
02
2 005
0 3
2 005
0 4
2005
0 5
2005
06
2005
07
200 5
08
2005
09
2005
10
2005
11
2 005
1 2
2 006
0 1
2006
02
2006
03
2006
04
200 6
05
200 6
06
2006
07
2006
08
2 006
0 9
2 006
1 0
2006
1 1
2006
12
BiH M_M-1 FBiH M_M-1 RS M_M-1 Brcko M_M-1
BiH M_M-12 FBiH M_M-12 RS M_M-12 Brcko M_M-12
44
Graph 2.9 – Consumer Price housing, water, electricity and other fuels Index without temporary reductions of prices: Country, Entities and Brcko District. Year 2005-2006 (rates of change)
-30.0
-25.0
-20.0
-15.0
-10.0
-5.0
0.0
5.0
10.0
15.0
20.0
25.0
30.0
2005
02
2005
03
2005
04
2005
0 5
2 005
06
200 5
07
2005
08
200 5
09
2005
1 0
2 005
11
2 005
1 2
2006
01
200 6
02
200 6
03
2006
04
2006
0 5
2 006
06
2 006
07
2006
08
200 6
09
2006
10
2006
11
2 006
1 2
BiH M_M-1 FBiH M_M-1 RS M_M-1 Brcko M_M-1
BiH M_M-12 FBiH M_M-12 RS M_M-12 Brcko M_M-12
Graph 2.10 – Consumer Price housing, water, electricity and other fuels Index with
temporary reductions of prices: Country, Entities and Brcko District. Year 2005-2006 (rates of change)
-30.0
-25.0
-20.0
-15.0
-10.0
-5.0
0.0
5.0
10.0
15.0
20.0
25.0
30.0
2005
02
2005
03
2005
04
2005
0 5
2 005
06
200 5
07
2005
08
200 5
09
2005
10
2 005
11
2 005
1 2
2006
01
200 6
02
200 6
03
2006
04
2006
0 5
2 006
06
2 006
07
2006
08
200 6
09
2006
10
2006
11
2 006
1 2
BiH M_M-1 FBiH M_M-1 RS M_M-1 Brcko M_M-1
BiH M_M-12 FBiH M_M-12 RS M_M-12 Brcko M_M-12
45
Graph 2.11 – Consumer Price furnishings, household equipment and routine maintenance of the house Index without temporary reductions of prices: Country, Entities and Brcko District. Year 2005-2006 (rates of change)
-1.0
-0.5
0.0
0.5
1.0
1.5
2.0
2005
02
2 005
0 3
2 005
0 4
2005
0 5
2005
06
2005
07
200 5
08
2005
09
2005
10
2005
11
2 005
1 2
2 006
0 1
2006
02
2006
03
2006
04
200 6
05
200 6
06
2006
07
2006
08
2 006
0 9
2 006
1 0
2006
1 1
2006
12
BiH M_M-1 FBiH M_M-1 RS M_M-1 Brcko M_M-1
BiH M_M-12 FBiH M_M-12 RS M_M-12 Brcko M_M-12
Graph 2.12 – Consumer Price furnishings, household equipment and routine
maintenance of the house Index with temporary reductions of prices: Country, Entities and Brcko District. Year 2005-2006 (rates of change)
-2.0
-1.5
-1.0
-0.5
0.0
0.5
1.0
1.5
2.0
2005
02
2 005
0 3
2 005
0 4
2005
0 5
2005
06
2005
07
200 5
08
2005
09
2005
10
2005
11
2 005
1 2
2 006
0 1
2006
02
2006
03
2006
04
200 6
05
200 6
06
2006
07
2006
08
2 006
0 9
2 006
1 0
2006
1 1
2006
12
BiH M_M-1 FBiH M_M-1 RS M_M-1 Brcko M_M-1
BiH M_M-12 FBiH M_M-12 RS M_M-12 Brcko M_M-12
46
Graph 2.13 – Consumer Price health Index without temporary reductions of prices: Country, Entities and Brcko District. Year 2005-2006 (rates of change)
-6.0
-4.0
-2.0
0.0
2.0
4.0
6.0
8.0
10.0
12.020
0502
2005
03
2005
04
2 005
0 5
2005
0 6
2005
07
2005
08
200 5
09
200 5
10
2005
11
2005
12
2 006
01
2 006
0 2
2006
03
2006
04
2006
05
200 6
06
2006
07
2006
08
2 006
09
2 006
1 0
2006
1 1
2006
12
BiH M_M-1 FBiH M_M-1 RS M_M-1 Brcko M_M-1
BiH M_M-12 FBiH M_M-12 RS M_M-12 Brcko M_M-12
Graph 2.14 – Consumer Price health Index with temporary reductions of prices:
Country, Entities and Brcko District. Year 2005-2006 (rates of change)
-6.0
-4.0
-2.0
0.0
2.0
4.0
6.0
8.0
10.0
12.0
2005
02
2005
03
2005
04
2 005
0 5
2005
0 6
2005
07
2005
08
200 5
09
200 5
10
2005
11
2005
12
2 006
01
2 006
0 2
2006
03
2006
04
2006
05
200 6
06
2006
07
2006
08
2 006
09
2 006
1 0
2006
1 1
2006
12
BiH M_M-1 FBiH M_M-1 RS M_M-1 Brcko M_M-1
BiH M_M-12 FBiH M_M-12 RS M_M-12 Brcko M_M-12
47
Graph 2.15 – Consumer Price transport Index without temporary reductions of prices: Country, Entities and Brcko District. Year 2005-2006 (rates of change)
-8.0
-6.0
-4.0
-2.0
0.0
2.0
4.0
6.0
8.0
10.0
12.0
2005
02
2005
03
2005
04
2 005
0 5
2005
0 6
2005
07
2005
08
200 5
09
200 5
10
2005
11
2005
12
2 006
01
2 006
0 2
2006
03
2006
04
2006
05
200 6
06
2006
07
2006
08
2 006
09
2 006
1 0
2006
1 1
2006
12
BiH M_M-1 FBiH M_M-1 RS M_M-1 Brcko M_M-1
BiH M_M-12 FBiH M_M-12 RS M_M-12 Brcko M_M-12
Graph 2.16 – Consumer Price transport Index with temporary reductions of prices:
Country, Entities and Brcko District. Year 2005-2006 (rates of change)
-8.0
-6.0
-4.0
-2.0
0.0
2.0
4.0
6.0
8.0
10.0
12.0
2005
02
2005
03
2005
04
2 005
0 5
2005
0 6
2005
07
2005
08
200 5
09
200 5
10
2005
11
2005
12
2 006
01
2 006
0 2
2006
03
2006
04
2006
05
200 6
06
2006
07
2006
08
2 006
09
2 006
1 0
2006
1 1
2006
12
BiH M_M-1 FBiH M_M-1 RS M_M-1 Brcko M_M-1
BiH M_M-12 FBiH M_M-12 RS M_M-12 Brcko M_M-12
48
Graph 2.17 – Consumer Price communication Index without temporary reductions of prices: Country, Entities and Brcko District. Year 2005-2006 (rates of change)
-12.0
-8.0
-4.0
0.0
4.0
8.0
12.0
16.0
20.0
24.0
2005
02
2005
03
200 5
04
2005
05
2005
06
2 005
07
2 005
0 8
2005
09
2005
10
200 5
11
200 5
12
2006
01
2 006
02
2 006
0 3
2006
0 4
2006
05
200 6
06
200 6
07
2006
08
2006
09
2 006
1 0
2006
1 1
2006
12
BiH M_M-1 FBiH M_M-1 RS M_M-1 Brcko M_M-1
BiH M_M-12 FBiH M_M-12 RS M_M-12 Brcko M_M-12
Graph 2.18 – Consumer Price communication Index with temporary reductions of
prices: Country, Entities and Brcko District. Year 2005-2006 (rates of change)
-16.0
-12.0
-8.0
-4.0
0.0
4.0
8.0
12.0
16.0
20.0
24.0
2005
02
2005
03
200 5
04
2005
05
2005
06
2 005
07
2 005
0 8
2005
09
2005
10
200 5
11
200 5
12
2006
01
2 006
02
2 006
0 3
2006
0 4
2006
05
200 6
06
200 6
07
2006
08
2006
09
2 006
1 0
2006
1 1
2006
12
BiH M_M-1 FBiH M_M-1 RS M_M-1 Brcko M_M-1
BiH M_M-12 FBiH M_M-12 RS M_M-12 Brcko M_M-12
49
Graph 2.19 – Consumer Price recreation and culture Index without temporary reductions of prices: Country, Entities and Brcko District. Year 2005-2006 (rates of change)
-4.0
-2.0
0.0
2.0
4.0
6.0
8.0
2005
02
2 005
0 3
2 005
0 4
2005
0 5
2005
06
2005
07
200 5
08
2005
09
2005
10
2005
11
2 005
1 2
2 006
0 1
2006
02
2006
03
2006
04
200 6
05
200 6
06
2006
07
2006
08
2 006
0 9
2 006
1 0
2006
1 1
2006
12
BiH M_M-1 FBiH M_M-1 RS M_M-1 Brcko M_M-1
BiH M_M-12 FBiH M_M-12 RS M_M-12 Brcko M_M-12
Graph 2.20 – Consumer Price recreation and culture Index with temporary
reductions of prices: Country, Entities and Brcko District. Year 2005-2006 (rates of change)
-4.0
-2.0
0.0
2.0
4.0
6.0
8.0
2005
02
2 005
0 3
2 005
0 4
2005
0 5
2005
06
2005
07
200 5
08
2005
09
2005
10
2005
11
2 005
1 2
2 006
0 1
2006
02
2006
03
2006
04
200 6
05
200 6
06
2006
07
2006
08
2 006
0 9
2 006
1 0
2006
1 1
2006
12
BiH M_M-1 FBiH M_M-1 RS M_M-1 Brcko M_M-1
BiH M_M-12 FBiH M_M-12 RS M_M-12 Brcko M_M-12
50
Graph 2.21 – Consumer Price education Index without temporary reductions of prices: Country, Entities and Brcko District. Year 2005-2006 (rates of change)
-4.0
-3.0
-2.0
-1.0
0.0
1.0
2.0
3.0
4.0
5.0
6.0
2005
02
2 005
0 3
2 005
0 4
2005
0 5
2005
06
2005
07
200 5
08
2005
09
2005
10
2005
11
2 005
1 2
2 006
0 1
2006
02
2006
03
2006
04
200 6
05
200 6
06
2006
07
2006
08
2 006
0 9
2 006
1 0
2006
1 1
2006
12
BiH M_M-1 FBiH M_M-1 RS M_M-1 Brcko M_M-1
BiH M_M-12 FBiH M_M-12 RS M_M-12 Brcko M_M-12
Graph 2.22 – Consumer Price education Index with temporary reductions of prices:
Country, Entities and Brcko District. Year 2005-2006 (rates of change)
-4.0
-3.0
-2.0
-1.0
0.0
1.0
2.0
3.0
4.0
5.0
6.0
2005
02
2 005
0 3
2 005
0 4
2005
0 5
2005
06
2005
07
200 5
08
2005
09
2005
10
2005
11
2 005
1 2
2 006
0 1
2006
02
2006
03
2006
04
200 6
05
200 6
06
2006
07
2006
08
2 006
0 9
2 006
1 0
2006
1 1
2006
12
BiH M_M-1 FBiH M_M-1 RS M_M-1 Brcko M_M-1
BiH M_M-12 FBiH M_M-12 RS M_M-12 Brcko M_M-12
51
Graph 2.23 – Consumer Price restaurants and hotels Index without temporary reductions of prices: Country, Entities and Brcko District. Year 2005-2006 (rates of change)
-4.0
-3.0
-2.0
-1.0
0.0
1.0
2.0
3.0
4.0
5.0
6.0
2005
02
2 005
0 3
2 005
0 4
2005
0 5
2005
06
2005
07
200 5
08
2005
09
2005
10
2005
11
2 005
1 2
2 006
0 1
2006
02
2006
03
2006
04
200 6
05
200 6
06
2006
07
2006
08
2 006
0 9
2 006
1 0
2006
1 1
2006
12
BiH M_M-1 FBiH M_M-1 RS M_M-1 Brcko M_M-1
BiH M_M-12 FBiH M_M-12 RS M_M-12 Brcko M_M-12
Graph 2.24 – Consumer Price restaurants and hotels Index with temporary
reductions of prices: Country, Entities and Brcko District. Year 2005-2006 (rates of change)
-4.0
-3.0
-2.0
-1.0
0.0
1.0
2.0
3.0
4.0
5.0
6.0
2005
02
2 005
0 3
2 005
0 4
2005
0 5
2005
06
2005
07
200 5
08
2005
09
2005
10
2005
11
2 005
1 2
2 006
0 1
2006
02
2006
03
2006
04
200 6
05
200 6
06
2006
07
2006
08
2 006
0 9
2 006
1 0
2006
1 1
2006
12
BiH M_M-1 FBiH M_M-1 RS M_M-1 Brcko M_M-1
BiH M_M-12 FBiH M_M-12 RS M_M-12 Brcko M_M-12
52
Graph 2.25 – Consumer Price miscellaneous goods and services Index without temporary reductions of prices: Country, Entities and Brcko District. Year 2005-2006 (rates of change)
-6.0
-4.0
-2.0
0.0
2.0
4.0
6.0
8.0
10.0
12.0
14.0
2005
02
2005
03
2005
04
2 005
0 5
2005
0 6
2005
07
2005
08
200 5
09
200 5
10
2005
11
2005
12
2 006
01
2 006
0 2
2006
03
2006
04
2006
05
200 6
06
2006
07
2006
08
2 006
09
2 006
1 0
2006
1 1
2006
12
BiH M_M-1 FBiH M_M-1 RS M_M-1 Brcko M_M-1
BiH M_M-12 FBiH M_M-12 RS M_M-12 Brcko M_M-12
Graph 2.26 – Consumer Price miscellaneous goods and services Index with
temporary reductions of prices: Country, Entities and Brcko District. Year 2005-2006 (rates of change)
-6.0
-4.0
-2.0
0.0
2.0
4.0
6.0
8.0
10.0
12.0
14.0
2005
02
2005
03
2005
04
2 005
0 5
2005
0 6
2005
07
2005
08
200 5
09
200 5
10
2005
11
2005
12
2 006
01
2 006
0 2
2006
03
2006
04
2006
05
200 6
06
2006
07
2006
08
2 006
09
2 006
1 0
2006
1 1
2006
12
BiH M_M-1 FBiH M_M-1 RS M_M-1 Brcko M_M-1
BiH M_M-12 FBiH M_M-12 RS M_M-12 Brcko M_M-12
53
Graph 2.27 - BiH CPI contributions to the inflation rate of 2006 with respect to 2005 by COICOP divisions (percentage values)
-8.00 -6.00 -4.00 -2.00 0.00 2.00 4.00 6.00 8.00
GENERAL INDEX
FOOD AND NON-ALCOHOLIC BEVERAGES
HOUSING, WATER, ELECTRICITY, GAS AND OTHER FUELS
TRANSPORT
COMMUNICATION
HEALTH
RECREATION AND CULTURE
RESTAURANTS AND HOTELS
MISCELLANEOUS GOODS AND SERVICES
FURNISHINGS, HOUSEHOLD EQUIPMENT AND ROUTINE MAINTENANCE OF THE HOUSE
EDUCATION
ALCOHOLIC BEVERAGES, TOBACCO
CLOTHING AND FOOTWEAR
Graph 2.28 - BiH HICP contributions to the inflation rate of 2006 with respect to
2005 by COICOP divisions (percentage values)
-8.00 -6.00 -4.00 -2.00 0.00 2.00 4.00 6.00 8.00
GENERAL INDEX
FOOD AND NON-ALCOHOLIC BEVERAGES
HOUSING, WATER, ELECTRICITY, GAS ANDOTHER FUELS
TRANSPORT
COMMUNICATION
HEALTH
RECREATION AND CULTURE
RESTAURANTS AND HOTELS
MISCELLANEOUS GOODS AND SERVICES
FURNISHINGS, HOUSEHOLD EQUIPMENT ANDROUTINE MAINTENANCE OF THE HOUSE
EDUCATION
ALCOHOLIC BEVERAGES, TOBACCO
54
Graph 2.29 - FBiH CPI contributions to the inflation rate of 2006 with respect to 2005 by COICOP divisions (percentage values)
-8.00 -6.00 -4.00 -2.00 0.00 2.00 4.00 6.00 8.00
GENERAL INDEX
FOOD AND NON-ALCOHOLIC BEVERAGES
HOUSING, WATER, ELECTRICITY, GAS AND OTHER FUELS
TRANSPORT
HEALTH
COMMUNICATION
RECREATION AND CULTURE
RESTAURANTS AND HOTELS
FURNISHINGS, HOUSEHOLD EQUIPMENT AND ROUTINE MAINTENANCE OF THEHOUSE
MISCELLANEOUS GOODS AND SERVICES
CLOTHING AND FOOTWEAR
ALCOHOLIC BEVERAGES, TOBACCO
EDUCATION
5.9746
Graph 2.30 - FBiH HICP contributions to the inflation rate of 2006 with respect to
2005 by COICOP divisions (percentage values)
-8.00 -6.00 -4.00 -2.00 0.00 2.00 4.00 6.00 8.00
GENERAL INDEX
FOOD AND NON-ALCOHOLIC BEVERAGES
HOUSING, WATER, ELECTRICITY, GAS AND OTHER FUELS
TRANSPORT
HEALTH
COMMUNICATION
RECREATION AND CULTURE
RESTAURANTS AND HOTELS
MISCELLANEOUS GOODS AND SERVICES
FURNISHINGS, HOUSEHOLD EQUIPMENT AND ROUTINE MAINTENANCE OF THEHOUSE
ALCOHOLIC BEVERAGES, TOBACCO
EDUCATION
CLOTHING AND FOOTWEAR
5.9746
55
Graph 2.31 - RS CPI contributions to the inflation rate of 2006 with respect to 2005 by COICOP divisions (percentage values)
-8.00 -6.00 -4.00 -2.00 0.00 2.00 4.00 6.00 8.00
GENERAL INDEX
FOOD AND NON-ALCOHOLIC BEVERAGES
HOUSING, WATER, ELECTRICITY, GAS AND OTHER FUELS
TRANSPORT
COMMUNICATION
HEALTH
RECREATION AND CULTURE
FURNISHINGS, HOUSEHOLD EQUIPMENT AND ROUTINE MAINTENANCE OF THEHOUSE
RESTAURANTS AND HOTELS
MISCELLANEOUS GOODS AND SERVICES
EDUCATION
ALCOHOLIC BEVERAGES, TOBACCO
CLOTHING AND FOOTWEAR
Graph 2.32 - RS HICP contributions to the inflation rate of 2006 with respect to
Table 4 (second part) – BiH Consumer price index with temporary reductions of prices by COICOP Divisions. Year 2006 (indices base 2005=100 and rates of
Table 6 (first part) – FBiH Consumer price index without temporary reductions of prices by COICOP Divisions. Year 2006 (indices base 2005=100 and rates
Table 8 (first part) – FBiH Consumer price index with temporary reductions of prices by COICOP Divisions. Year 2006 (indices base 2005=100 and rates of
HOUSING, WATER, ELECTRICITY, GAS AND OTHER FUELS 107396 111763 107396 111806
FURNISHINGS, HOUSEHOLD EQUIPMENT AND ROUTINE MAINTENANCE OF THE HOUSE 86220 82321 86220 82251
HEALTH 46616 44357 46616 44377
TRANSPORT 124429 130138 124429 130172 COMMUNICATION 31947 35054 31947 35063
RECREATION AND CULTURE 43084 41114 43084 41111
EDUCATION 12146 11667 12146 11671
RESTAURANTS AND HOTELS 32212 30893 32212 30903
MISCELLANEOUS GOODS AND SERVICES 77208 76098 77208 76112
Table 18 – FBiH Consumer price index without and with temporary reductions of prices by COICOP Divisions: weights. Years 2005 - 2006 (normalised values)
CPI HICP COICOP DIVISIONS 2005_weights 2006_weights 2005_weights 2006_weights GENERAL INDEX 1000000 1000000 1000000 1000000
HOUSING, WATER, ELECTRICITY, GAS AND OTHER FUELS 103105 104754 103105 104783
FURNISHINGS, HOUSEHOLD EQUIPMENT AND ROUTINE MAINTENANCE OF THE HOUSE 87045 83736 87045 83764
HEALTH 41517 40372 41517 40010
TRANSPORT 121821 128085 121821 128133 COMMUNICATION 32853 34591 32853 34602
RECREATION AND CULTURE 44537 42907 44537 42986
EDUCATION 12503 11976 12503 11979
RESTAURANTS AND HOTELS 35209 34124 35209 34135
84
MISCELLANEOUS GOODS AND SERVICES 78996 76920 78996 76942 Table 19 – RS Consumer price index without and with temporary reductions of prices by COICOP Divisions: weights. Years 2005 - 2006
(normalised values)
CPI HICP COICOP DIVISIONS 2005_weights 2006_weights 2005_weights 2006_weights GENERAL INDEX 1000000 1000000 1000000 1000000