The BikeNet Mobile Sensing System for Cyclist Experience Mapping S. B. Eisenman, † E. Miluzzo, * N. D. Lane, * R. A. Peterson, * G-S. Ahn, † A. T. Campbell * * Computer Science, Dartmouth College, {campbell,miluzzo,niclane,rapjr}@cs.dartmouth.edu † Electrical Engineering, Columbia University, {ahngang,shane}@ee.columbia.edu Abstract We describe our experiences deploying BikeNet, an ex- tensible mobile sensing system for cyclist experience map- ping leveraging opportunistic sensor networking principles and techniques. BikeNet represents a multifaceted sensing system and explores personal, bicycle, and environmental sensing using dynamically role-assigned bike area network- ing based on customized Moteiv Tmote Invent motes and sensor-enabled Nokia N80 mobile phones. We investigate real-time and delay-tolerant uploading of data via a num- ber of sensor access points (SAPs) to a networked reposi- tory. Among bicycles that rendezvous en route we explore inter-bicycle networking via data muling. The repository provides a cyclist with data archival, retrieval, and visual- ization services. BikeNet promotes the social networking of the cycling community through the provision of a web por- tal that facilitates back end sharing of real-time and archived cycling-related data from the repository. We present: a de- scription and prototype implementation of the system archi- tecture, an evaluation of sensing and inference that quantifies cyclist performance and the cyclist environment; a report on networking performance in an environment characterized by bicycle mobility and human unpredictability; and a descrip- tion of BikeNet system user interfaces. Visit [4] to see how the BikeNet system visualizes a user’s rides. Categories and Subject Descriptors: C.2.1 [Network Ar- chitecture and Design]: Wireless Communications; J.3 [Life and Medical Sciences]: Health. General Terms: Design, Experimentation, Performance. Keywords: Applications, Bicycling, Recreation, Systems. 1 Introduction There is substantial interest in the mainstream recre- ational cycling community in collecting data quantifying various aspects of the cycling experience, mirroring the broader interest in fitness metrics among exercise enthusiasts and other health conscious individuals. Existing commer- cial bike-sensing systems targeting this demographic mea- sure and display simple data such as wheel speed, and Permission to make digital or hard copies of all or part of this work for personal or classroom use is granted without fee provided that copies are not made or distributed for profit or commercial advantage and that copies bear this notice and the full citation on the first page. To copy otherwise, to republish, to post on servers or to redistribute to lists, requires prior specific permission and/or a fee. SenSys’07, November 6–9, 2007, Sydney, Australia. Copyright 2007 ACM 1-59593-763-6/07/0011 ...$5.00 provide simple inferences such as distance traveled and calories burned. These systems have become increasingly more sophisticated and miniaturized. This trend is contin- uing and bicycles in the future will be sold with embedded fitness/performance-related sensing systems. However, the data collected by current systems fails to capture a more comprehensive picture of the cyclist experience. Among recreational cyclists there is a spread in the level of inter- est about various characteristics of a ride. Some are com- petitive with their friends for the sake of bragging rights, and may want to initiate challenges to set up virtual com- petitions among geographically separated cyclists; some fo- cus on health-related aspects such as personal fitness; many view bicycling as a time to relax while getting some moder- ate exercise and are most interested in finding routes that are safe and quiet; others want to simply archive statistics about their rides for later analysis [5]. In this paper, we design and implement the prototype of a system not only to give context to the cyclist performance as part of a user-targeted application (e.g., health and safety), but also to collect envi- ronmental data as part of communal projects (e.g., pollution monitoring/mapping). We quantify aspects of cycling per- formance and environmental conditions that the mainstream recreational cyclist can appreciate and afford, akin to the Nike+iPod kit, a system [6] for recreational runners that logs exercise history. BikeNet represents the first working mobile networked sensing system for bikes. Contributions of our work include: • Disconnected Operation. BikeNet utilizes an opportunis- tic networking paradigm, whereby mobile sensing platforms are tasked and data is muled or uploaded according to the opportunities that arise as a result of the uncontrolled mo- bility of the cyclists. The BikeNet system operates in a de- lay tolerant sensing mode by default, where cyclists go on trips, collect sensed data, and upload their data when they return to home, possibly using the assistance of data mules (as discussed in Section 2.2.3). This default mode is akin to the Nike+iPod [6] sensing system for runners. In this case, BikeNet represents a pure delay tolerant mote-based solu- tion. However, if the cyclist carries a cell phone (such as the Nokia N80 in our implementation) BikeNet automatically in- tegrates the cell phone into the system as a mobile sensor gateway (i.e., a mobile sensor access point (SAP)) and offers real-time interaction between the back end and the cyclist in support of real-time sensing. • Cyclist Performance/Fitness Measurement. The system collects and stores data about the following baseline cycling performance metrics: current speed, average speed, distance traveled, calories burned. In addition, the system collects and
Transcript
The BikeNet Mobile Sensing Systemfor Cyclist Experience Mapping
S. B. Eisenman,† E. Miluzzo,∗ N. D. Lane,∗ R. A. Peterson,∗ G-S. Ahn,† A. T. Campbell∗∗Computer Science, Dartmouth College, {campbell,miluzzo,niclane,rapjr}@cs.dartmouth.edu
†Electrical Engineering, Columbia University, {ahngang,shane}@ee.columbia.edu
AbstractWe describe our experiences deploying BikeNet, an ex-
tensible mobile sensing system for cyclist experience map-ping leveraging opportunistic sensor networking principlesand techniques. BikeNet represents a multifaceted sensingsystem and explores personal, bicycle, and environmentalsensing using dynamically role-assigned bike area network-ing based on customized Moteiv Tmote Invent motes andsensor-enabled Nokia N80 mobile phones. We investigatereal-time and delay-tolerant uploading of data via a num-ber of sensor access points (SAPs) to a networked reposi-tory. Among bicycles that rendezvous en route we exploreinter-bicycle networking via data muling. The repositoryprovides a cyclist with data archival, retrieval, and visual-ization services. BikeNet promotes the social networking ofthe cycling community through the provision of a web por-tal that facilitates back end sharing of real-time and archivedcycling-related data from the repository. We present: a de-scription and prototype implementation of the system archi-tecture, an evaluation of sensing and inference that quantifiescyclist performance and the cyclist environment; a report onnetworking performance in an environment characterized bybicycle mobility and human unpredictability; and a descrip-tion of BikeNet system user interfaces. Visit [4] to see howthe BikeNet system visualizes a user’s rides.
Categories and Subject Descriptors: C.2.1 [Network Ar-chitecture and Design]: Wireless Communications; J.3 [Lifeand Medical Sciences]: Health.
General Terms: Design, Experimentation, Performance.
1 IntroductionThere is substantial interest in the mainstream recre-
ational cycling community in collecting data quantifyingvarious aspects of the cycling experience, mirroring thebroader interest in fitness metrics among exercise enthusiastsand other health conscious individuals. Existing commer-cial bike-sensing systems targeting this demographic mea-sure and display simple data such as wheel speed, and
Permission to make digital or hard copies of all or part of this work for personal orclassroom use is granted without fee provided that copies are not made or distributedfor profit or commercial advantage and that copies bear this notice and the full citationon the first page. To copy otherwise, to republish, to post on servers or to redistributeto lists, requires prior specific permission and/or a fee.SenSys’07,November 6–9, 2007, Sydney, Australia.Copyright 2007 ACM 1-59593-763-6/07/0011 ...$5.00
provide simple inferences such as distance traveled andcalories burned. These systems have become increasinglymore sophisticated and miniaturized. This trend is contin-uing and bicycles in the future will be sold with embeddedfitness/performance-related sensing systems. However, thedata collected by current systems fails to capture a morecomprehensive picture of the cyclist experience. Amongrecreational cyclists there is a spread in the level of inter-est about various characteristics of a ride. Some are com-petitive with their friends for the sake of bragging rights,and may want to initiate challenges to set up virtual com-petitions among geographically separated cyclists; some fo-cus on health-related aspects such as personal fitness; manyview bicycling as a time to relax while getting some moder-ate exercise and are most interested in finding routes that aresafe and quiet; others want to simply archive statistics abouttheir rides for later analysis [5]. In this paper, we designand implement the prototype of a system not only to givecontext to the cyclist performance as part of a user-targetedapplication (e.g., health and safety), but also to collect envi-ronmental data as part of communal projects (e.g., pollutionmonitoring/mapping). We quantify aspects of cycling per-formance and environmental conditions that the mainstreamrecreational cyclist can appreciate and afford, akin to theNike+iPod kit, a system [6] for recreational runners that logsexercise history.
BikeNet represents the first working mobile networkedsensing system for bikes. Contributions of our work include:
• Disconnected Operation. BikeNet utilizes an opportunis-tic networking paradigm, whereby mobile sensing platformsare tasked and data is muled or uploaded according to theopportunities that arise as a result of the uncontrolled mo-bility of the cyclists. The BikeNet system operates in ade-lay tolerant sensing mode by default, where cyclists go ontrips, collect sensed data, and upload their data when theyreturn to home, possibly using the assistance of data mules(as discussed in Section 2.2.3). This default mode is akin tothe Nike+iPod [6] sensing system for runners. In this case,BikeNet represents a pure delay tolerant mote-based solu-tion. However, if the cyclist carries a cell phone (such as theNokia N80 in our implementation) BikeNet automatically in-tegrates the cell phone into the system as a mobile sensorgateway (i.e., a mobile sensor access point (SAP)) and offersreal-time interaction between the back end and the cyclist insupport ofreal-time sensing.
• Cyclist Performance/Fitness Measurement. The systemcollects and stores data about the following baseline cyclingperformance metrics: current speed, average speed, distancetraveled, calories burned. In addition, the system collects and
stores the following advanced metrics: path incline, heartrate, galvanic skin response (a simple indicator of emotionalexcitement or stress level). All data sensed by the system isat least stamped with time and location metadata.
• Environment/Experience Mapping. The system pro-vides quantitative guidance to cyclists about the healthinessof a given route in terms of pollution levels, allergen levels,noise levels, and roughness of the terrain. These measure-ments, together with data from cyclist performance measure-ments, are correlated to create a holistic picture of the cyclingexperience. This environmental data is also provided to thelarger community.
• Long Term Performance Trend Analysis. Collected datapersists beyond the ride on which it is collected. The systemenables the upload of data traces into a personal repositorythat can be selectively shared with other individuals, or intoa public database. The data is archived in such a way as tofacilitate spatio-temporal trend analysis.
• Data Collection and Local Presentation. BikeNet allowsthe cyclist to customize, via a profile of preferences, whatdata is collected by the system, when it is collected, whereit is collected, and under what correlated conditions sensordata capture occurs (e.g., increase the sampling rate of theheart rate when the path incline is above a threshold). Theprofile also indicates how data is to be presented, both lo-cally (e.g., on a handle bar-mounted cell phone LCD) on thebicycle whenen route and through access and presentationmethods once the data has been delivered to the back endrepository.
• Data Query and Remote Presentation. The system pro-vides a web-based portal [4] on the back end as a means toinject queries into the system to request particular bicycling-related data of interest to the back end system user. Also,the portal can be used as a place to publish/share data withfriends/competitors about themselves and the paths they tra-verse for real-time or delayed display. In so doing, we pro-vide a useful tool to network members of the cycling com-munity through data of mutual interest.
In the following sections, we describe our experiences de-ploying a sensing system for cyclist experience mapping,leveraging opportunistic sensor networking principles andtechniques [22]. We discuss the system architecture, de-sign, and implementation in Section 2. Section 3 describesour cyclist experience mapping application, including sens-ing accuracy and inference techniques, communication pro-tocol performance, and feasibility results. Related work isdiscussed in Section 4 before concluding with a summaryand a discussion of possible extensions in Section 5.
2 System Architecture and DesignBikeNet is a network characterized by mobile sensing
and sparse radio network connectivity. Given these char-acteristics, and the application requirements for the sys-tem, we design the BikeNet system as an instantiation ofthe architecture presented in [22]. The architecture offersa people-centric paradigm for large-scale sensing at the edgeof the Internet using an opportunistic sensor networking ap-proach. This approach leverages mobility-enabled interac-
StaticSAP Static
SAP
GSM/GPRS
StaticSAP
Sensors
(muling)MobileSAP
Sensors
(uploading)
Back End Servers
Internet
Client BikeNet Portal (tasking)(uploading)
Figure 1: BikeNet System Overview. Sensors collect cyclistandenvironmental data along the route. Application tasking and senseddata uploading occurs when the sensors come within radio rangeof a static sensor access point (SAP) or via a mobile SAP alongtheroute. Sensed data muling can occur when cyclists come within mu-tual radio range. We collect data about the cyclist (heart rate, gal-vanic skin response), about the cyclist’s performance (wheel speed,pedaling cadence, frame tilt, frame lateral tilt, magneticheading),and about the cyclist’s surroundings (sound level, carbon dioxidelevel, cars).
tions and provides coordination between people-centric mo-bile sensors, static sensors (e.g., [27]) and edge wirelessac-cess nodes (i.e., SAPs) in support of sensing, tasking, anddata collection. Figure 1 shows a pictorial overview of theBikeNet system. Details of a prototype implementation areincluded to make the architecture and design descriptionsmore concrete.
2.1 HardwareThe BikeNet system hardware is organized into three
tiers, the back end server tier, the sensor access point (SAP)tier and the mobile sensor tier. In the following, we discussthe design and implementation of each tier, along with infor-mation on ruggedizing and calibration of the hardware.
2.1.1 Mobile Sensor TierThe mobile sensor tier incorporates a number of bicycle-
mounted and human-mounted Moteiv Tmote Invent [8] mo-bile sensing platforms. Together these sensors gather dataconcerning cycling performance, cyclist health and fitness,and the environment surrounding the cyclists’ routes. TheTmote Invents mounted to a particular bicycle, along withthose mounted to the human riding the particular bicycle,constitute a BAN. Intra-BAN communication occurs viashort range IEEE 802.15.4 radio. The BAN architecture isdesigned in a modular way such that sensing components canbe added or subtracted simply according to user preferences(dynamically) set in software. Figure 2 shows a logical rep-resentation of thebicycle area network (BAN), and Figure 3shows a prototype sensor-enabled bicycle.
We use the native sensors provided by the Tmote Invent: atwo axis accelerometer, a thermistor, a photodiode, and a mi-crophone. We also interface a number of additional sensorsto the Invent. We process the accelerometer data to measurethe angle of incline, and lateral tilt of the bicycle. To measurethe angular velocity of the wheel and pedal, forward speed,and distance traveled, we attach a magnet-triggered reed re-lay mounted across the Invent’s user button. Every time therelay closes (every pedal/wheel rotation) a TinyOS [11] in-terrupt event is generated. To measure direction and devia-
(02) Magnetometer
(05) 802.15.4/Bluetooth
(10) CO meter2
− Camera− Display− Speaker− Microphone
Bluetooth IEEE 802.11
GSM/GPRS
(08) Mobile Phone
BAN(IEEE 802.15.4)
(03) Pedal Speed
(01) Microphone
(04) Inclinometer
(06) Lateral Tilt
(07) GSR Stress Monitor
(11) GPS
(09) Speedometer/Odometer
Figure 2: Logical representation of bicycle area networking. Sen-sors share a common IEEE 802.15.4 channel. A mobile phone playsa dual architectural role depending on whether its cellularradio isactive/connected. If connected to the cellular back end themobilephone acts as a mobile sensor access point (SAP) facilitating real-time sensing; else it acts as a local member of a BAN engaged indelay tolerant sensing.
tion with respect to the Earth’s magnetic field, we add a dualaxis magneto-inductive sensor (Honeywell HMC1052L) byconnecting the sensor output to two ADC channels on the In-vent and connecting a free I/O pin from the Invent’s MSP430microcontroller configured as output to act as a digital con-trol line. We further process the magnetometer data for useas a metal detector, and in particular for automobile detec-tion. To provide a common notion of absolute time and lo-cation within a BAN, we connect a Garmin Etrex 12 channelGPS unit (Figure 4(b)) via the UART0 port of the TmoteInvent’s MSP430. The Garmin Etrex provides time and lo-cation data at the fixed rate of once per two seconds via itsRS232 interface. To measure the carbon dioxide levels in theenvironment surrounding the cyclist, we interface the stan-dard Tmote Invent with the Telaire 7001 CO2/TemperatureMonitor, via an ADC port of the Tmote Invent’s MSP430.To measure the galvanic skin response of the cyclist, we usean ArcherKit Biofeedback Monitor connected to a Tmote In-vent. Wires connected to the fingers of the cyclist measureepidermal microcurrents.
The Tmote Invents and external sensors are powered us-ing rechargeable batteries in our prototype. A commercialimplementation could leverage ongoing work in energy har-vesting (particularly from pedaling and frame vibration) toreduce the need for external recharging. This is outside thescope of the current work.
2.1.2 SAP TierThe SAP tier offers high performance, high reliability,
and secure gateway access from the sensor tier to the backend servers. This access allows sensed data to flow to thesystem repositories, and provides a point of command for thearchitecture to task available sensors with user applicationrequests/queries. When possible, these gateways are sym-biotically implemented on the back of existing network in-frastructure by plugging a short range radio module into theexisting network element (e.g., IEEE 802.11 access point),allowing it to communicate with the sensor tier. SAPs canbe static and wired directly to the Internet, or can be mobile
Figure 3: Physical implementation of the BikeNet system. Num-bered sensors installed on the bicycle map to the sensor types la-beled in the logical BAN representation in Figure 2.
and use a data service over a wide area radio access networkto provide connectivity to the back end (e.g., mobile phonewith GSM/GPRS). We study both tasking and uploading viaboth static and mobile SAPs in our implementation. SAPsare also equipped with sensors to provide context and vali-dation for uploaded data.
The static SAP is implemented using an unmodifiedTmote Invent plugged into the USB port of an Aruba AP-70 IEEE 802.11a/b/g access point. The Aruba is running acustomized version of OpenWRT, an embedded Linux vari-ant. The BikeNet SAP is implemented as an overlay of toolsrequiring only user privileges. Certain kernel module sup-port is needed; modules are loaded at run time if necessary.The tools distribution is cleanly encapsulated in a single tar-ball making symbiotic deployment of a BikeNet SAP on toa standard WiFi access point easy to manage. The mobileSAP is implemented using a Nokia N80 paired to a cus-tom built Bluetooth/802.15.4 gateway via its Bluetooth ra-dio. The N80 SymbianOS uses a serial device emulation ofthe Bluetooth SPP profile to read and write from the Blue-tooth/802.15.4 gateway. The back end interface of the SAPuses GSM/GPRS to the BikeNet repository and back end ser-vices. This is done with a combination of SMS messagesfrom the back end pushed to the phone, and TCP connec-tions initiated by the N80 to transmit responses to a backend server that translates data uploads to SQL commands toinsert data into the repository.
The use of a personal device like a cell phone as a mo-bile SAP gives rise to an interesting dual role for the N80in our system. Architecturally, there is a clean separationbetween SAP and sensor tiers, but in the case of a mobilephone owned by the cyclist the BAN to which the cyclistbelongs may have continuous access to the SAP servicesand resources whenever GPRS service is available. A mo-bile phone thus plays a dual architectural role depending onwhether its cellular radio is active/connected. If connected tothe cellular back end the mobile phone acts as a mobile SAPfacilitating real-time sensing; else it acts as a local member
(a) A two-axis magnetometer is attached toa Tmote Invent via its ADC.
(b) An external GPS unit is attached to aTmote Invent via its UART0 port.
(c) A BikeNet static SAP is a WiFi AP withan Invent inserted in the USB port.
(d) Waterproof OtterBox. Wires are fedthrough drilled holes that are then filled withsilicone sealant. Wires have crimped con-nectors for easy disconnect.
(e) Ground truth video/sound/photo helmetwith four N80s and GPS receiver, only foruse in debugging our system and validatingour inference techniques.
(f) BikeNet mobile SAP implementation.The Nokia N80 Bluetooth radio associateswith a custom-built Bluetooth/802.15.4gateway.
Figure 4
of a BAN engaged in delay tolerant sensing. GPRS pric-ing and performance also comes into play when using thecell phone as a SAP, but we set aside this problem for futurework.
2.1.3 Server TierMembers of the back end are Ethernet-connected servers
equipped with practically unbounded storage and computa-tional power. These provide a number of services to the ar-chitecture, some of which are described in Section 2.2.6. Inparticular, it is to the back end servers that system users con-nect to submit application requests/queries for executioninthe sensor tier, and to retrieve and visualize sensed data.
2.1.4 Ruggedizing the HardwareBecause of the outdoor nature of the BikeNet testbed we
take steps to protect the Tmote Invents from the weather(e.g., rain, snow) by enclosing each in an OtterBox 1600Case. The OtterBox comes with adhesive foam that is cus-tomizable to a degree that allows us to secure the Tmote In-vents inside the cases without any slipping. A number ofsensors require running wires from the Tmote Invent out ofthe OtterBox to other places on bicycle or cyclist (e.g., theWheelSensor’s reed relay is wired to the front fork of the bi-cycle). For these we drill holes through the OtterBox 1600and fill the holes with silicone gel after passing through thewires to maintain waterproofing. We cut the wires insidethe box and crimp/solder on connectors (see Figure 4(d)) toallow a quick disconnect of the Tmote Invents for recharg-ing. Additionally, the Otterbox cases are securely fastened to
the bicycle frame, using a system of steel mounting bars andsteel hose clamps, since bicycling implies often severe vibra-tion and jolting. The OtterBoxes are screwed to these mount-ing bars and the screw holes are sealed with silicone gel.In determining the geometry and placement of the mountingbars we have attempted to minimize vibration and unwanteddegrees of freedom for the sensors (a picture of a sensor-enabled bicycle appears in Figure 3).
2.1.5 Calibration/ValidationDespite efforts to mount the accelerometers at perfect
right angles (in two dimensions) with the ground, we findthat calibration is required for each bicycle in order to cor-rectly understand the measured values. Even if the error an-gle of the mounting bracket is small it can lead to a largeskew in the calculated slope, because of the non-linear na-ture of the inverse tangent function used to calculate theslope. Stationary calibration is done in the lab by matchingthe bicycle-mounted accelerometer outputs against a set ofknown inclines to derive a calibration curve for each device.To validate this static calibration in the field, we manual mea-sure a 0.75km section of the road containing slopes from 0 to7 degrees using a laser level (model TUV EPT-97A, 650nm)at 30m intervals. We receive excellent correlation betweenmanual measurements and those made using the accelerom-eter (the TiltSensor role).
We find that calibration is also necessary for the magneto-inductive sensors due to the steel frame of the bicycle, andthe steel mounting bars. This is done by executing a hard/soft
iron calibration [28] for each bicycle, and adding the correc-tion for the magnetic declination of Hanover, NH, USA.
We infer cyclist fitness level using a combination of thelateral tilt, slope, and pedal speed to wheel speed ratio. Tocheck our inference technique against a more direct physio-logical measure of cyclist fitness, we use the Garmin Fore-runner 301 Heart Rate Monitor/GPS. A positive correlationbetween our inferred cyclist fitness level, and that indicatedby the actual cyclist heart rate validates our technique.
To provide richer context for the sensor measurementsand inference we do in BikeNet, we attach four Nokia N80phones on a bicycle helmet, i.e., facing front, back, left andright (see Figure 4(e)). Using continuous video capture (bothvisual and audio) throughout the ride we are able to validatethat events sensed/inferred by BAN sensors are at least rea-sonable/probable and depending on the measurement typewe can definitively validate the data (e.g., car passing thebike or not).
To validate detection-based inferences, we use a standardTmote Invent programmed to write the (time, location) 2-tuple to the Flash every time the user button on the TmoteInvent is clicked. We term this theButtonMote for ease ofreference. For example, in testing the MetalDetector (Sec-tion 3.1.1) we manually click the ButtonMote user buttonevery time we pass a parked or moving automobile or an au-tomobile passes us, and compare the time/location-alignedMetalDetector trace with the ButtonMote trace to determinedetection accuracy.
2.2 SoftwareFigures 5(a), 5(b) and 5(c) show how the BikeNet soft-
ware system maps to the three tier hardware architecture,respectively defining the mobile sensor, SAP and back endsoftware sub-architectures. In our implementation, commu-nication between the SAP and back end sub-architectures isvia either a TCP/IP stack (for static SAPs) or a GPRS/GSMstack (for mobile SAPs). Primary software elements are dis-cussed in the following.
2.2.1 BikeNet Role AssignmentFor purposes of modularity the functional requirements
within a BAN are divided into logicalroles. ThePedalSen-sor andWheelSensor roles measure the angular velocity ofthe pedal and front wheel, respectively. From these the cur-rent and average speed, distance traveled, pedaling cadenceand gear ratio is measured or inferred. TheTiltSensor rolemeasures the angle of incline of the bicycle frame with re-spect to the gravitational force vector, allowing for real timeslope calculation and a mapping of the terrain along a cy-clist’s route. TheLateralTiltSensor role measures the lateralangle of incline of the bicycle frame. TheCompassSensorrole measures the instantaneous angle of the bike frame withrespect to the Earth’s magnetic field. TheMetalDetector rolemeasures distortions in the the Earth’s magnetic field causedby nearby ferromagnetic metals, allowing inference of theamount of passing automobile traffic. TheSyncSprinklerrole provides a common absolute notion of time and locationto all members of the bike area network via periodic shortrange broadcasts. TheLocalDisplay role provides a meansto locally display sensed data. TheCO2Sensor role measures
Invent + CO meter2 CO Sensor2
Invent + magnetometer
Invent + GPS
Invent + reed relay mounted on pedal
Invent using its accelerometer
Invent using its microphone
Invent
BAN Roles
CompassSensor
CameraSensor, LocalDisplay
SyncSprinklerWheelSensor
PedalSensor
SoundSensor
PersonalNode
TiltSensor
LateralTiltSensor
MetalDetector,
Invent + reed relay mounted on wheel
Invent using its accelerometer
Invent + 802.15.4/BlueTooth Gateway + N80
BAN Hardware
Figure 6: Mapping between BAN hardware and logical roles.
the carbon dioxide content in the atmosphere surroundingthe bicycle, allowing the system to infer whether the cyclistis passing through an urban area (more CO2 from auto ex-haust) or a rural area (less CO2 due to plant respiration). TheSoundSensor role measures the volume of noise in the envi-ronment surrounding the cyclist, and is used for voice trig-gered sensing and audio annotation of a cyclist’s ride. TheCameraSensor role provides triggered capture of an image,or a video clip of specified duration. ThePersonalNode roleprovides control via short range radio over the other sensingroles, including executing user preferences within the BAN(e.g., required sensors, sampling parametrization), and sig-naling the start and stop of a cycling trip. Each cyclist nec-essarily possesses a PersonalNode, but all other roles are op-tional, depending on the sensing preferences of the cyclist.Figure 6 shows the mapping between BikeNet roles and thesensing hardware, where each row represents a different (setof) devices on a fully equipped prototype bicycle.
We assume that each cyclist possesses a mobile personalcomputing device (e.g., Tmote Invent, Nokia N80, radio-equipped Apple iPod) at all times that can be tasked bythe SAP to take on the PersonalNode role. In our proto-type system, each cyclist carries a Tmote Invent preconfig-ured with the PersonalNode role. The PersonalNode roleincludes a list of user preferences that dictate what addi-tional sensing roles are desired to quantify the cyclist fit-ness/performance/environment. These sensing roles are splitinto two lists, required and preferred, that are included intoa hello beacon periodically broadcast by the PersonalNode.Thehello beacon also includes the required sensing parame-terization (e.g., sample rate). Each available mobile sensingplatform (i.e., Tmote Invent) that receives the beacon replieswith a hello reply if its sensing capabilities match either arequired or preferred role requested in thehello beacon. Thehello reply indicates which role(s) the respondent is offer-ing to fill. However, a recipient of thehello that is alreadyassociated with another PersonalNode will not reply. Uponreceiving ahello reply, the PersonalNode first registers therespondent and the role(s) it is offering to fill, and then sendsahello reply ack to complete the association. Thehello replyack contains a list of identifiers reflecting the current BANmembership. Subsequenthello beacons sent by the Person-alNode do not request sensing roles that are already beingfilled by associated mobile sensing platforms. If ahello re-ply ack is not received in response to ahello reply, thereply
Data Exchange Services
Tasking Exchange
Uploading Exchange
Muling Exchange
...BikeNet Roles
BikeNet Role
Assignment
TinyOS Networking Stack
Management and ControlIntra− and Inter−BAN
(a) Mobile sensor architecture.
Data Exchange Services
Uploading Exchange
Tasking Exchange
Back End Comm.Networking StackNetworking Stack
Sensing Resource
Query Management
Sensing
Ground Truth
SelectionSensing Resource
Discovery
TinyOS
(b) Sensor access point (SAP) architecture.
Back End Comm. Networking Stack
Que
ry S
ubm
issi
on P
orta
l
Sys
tem
Sta
te D
atab
ase
Sen
sor
Dat
a R
epos
itory
Sen
sor
Dat
a M
inin
g
Sen
sor
Dat
a V
isua
lizat
ion
(c) Back end architecture.Figure 5
is retransmitted up toN times. If afterN times theack is notreceived, then it is assumed that mobility has carried the Per-sonalNode and potential sensor out of range and the partialassociation state is purged.
Though generally a mobile sensing platform may, de-pending on sensing capabilities, be able to take on more thanone BikeNet role, for our current prototype implementationwe allow only one role per sensing platform to work withinhardware limitations of the Tmote Invent. For example, thereare a limited number of free configurable I/O pins and ADCchannels available for external sensors on the Tmote Invent,and a shortage of Flash/RAM. In the future with more capa-ble hardware, we will be able to condense our current imple-mentation, assigning multiple roles to a single sensing plat-form and greatly reducing BAN complexity and costs (i.e.,monetary, radio congestion, energy consumption). In therest of the paper, unless stated we treat the logical sensingrole and the mobile sensing platform to which the role is as-signed as synonymous.
2.2.2 Intra-BAN and Inter-BAN ManagementLocalization and Synchronization. The SyncSprinkler
role provides, via a periodic broadcast within the BAN, peri-odic samples of the instantaneous absolute time and location.In our implementation these are obtained from a GPS unit.The SyncSprinkler controls its transmission power to limitthe scope of its beacons, thereby maintaining a higher lo-cation accuracy for all broadcast recipients. All BAN mem-bers’ time estimate is updated externally with the values con-tained in the SyncSprinkler broadcasts, and internally viaalocal clock set to provide higher time resolution between re-ceived SyncSprinkler broadcasts.
Sensing Control. When the PersonalNode has estab-lished associations with sensing platforms (i.e., Tmote In-vents) sufficient to meet all the roles specified by theuser preferences, an LED on the PersonalNode indicates a“Ready” state. A button click on the PersonalNode whenin this “Ready” state sends astart message broadcast fromthe PersonalNode indicating that the ride is beginning andsensors should start collecting data with their prescribedparametrization. This message is acted on by mobile sensingplatforms that are associated with that PersonalNode, mov-ing both the PersonalNode and the associated mobile sensorsinto the “Started” state. If associated sensors do not receive astart message within a timeout period, the association timesout and the mobile sensors are free to associate with another
PersonalNode at that time. A subsequent PersonalNode but-ton click while the PersonalNode is in the “Started” statesends astop message broadcast, signaling the end of the ride.Thestop message causes mobile sensors associated with thatPersonalNode and are in the “Started” state to cease sensing.
Event-triggered Sensing vs. Continuous Sensing.Sensing is set up to occur either continuously or only whentriggered by other events. In the continuous case, the userpreferences executed by the PersonalNode parametrize thesensing capture (e.g., sampling rate, duration, local process-ing functions) that takes effect immediately upon receivingthe start message of the sensing control protocol. Continu-ous sensing in BikeNet is appropriate for roles such as theTiltSensor where terrain mapping should be continuous. Onthe other hand, some sensing operations may be too energyexpensive for a mobile sensing platform to do continuously,or may not have meaning except under certain contexts (e.g.,certain locations of interest, or under certain sensed circum-stances). Triggers are defined by dynamically updatable userprofiles executed by the PersonalNode that specify the con-ditions under which sensing should occur.
The BikeNet implementation support of triggered sensingincludes methods to define and submit sensing triggers andactions to the PersonalNode for execution within the BAN.Upon receiving the triggered sensing definition, the Person-alNode breaks apart the conditions that must be met for theaction to take place, and reliably transmits each condition(e.g., “slope> 5 degrees”) to the BAN member suited toevaluate the condition (e.g., the TiltSensor). When a condi-tion evaluates to true, the BAN member signals the Person-alNode. The PersonalNode initiates the action when all con-ditions for a given triggered action are met. We are currentlyfocusing on triggered photography, video and audio captureusing the camera and microphone on the N80, when certainconditions in the BAN are met, but we also implement sup-port for a number of other actions such as sending data to bedisplayed on the LocalDisplay, sensing something at a dif-ferent parametrization than the current one, playing a soundon the N80 or Tmote Invent speaker, transferring sensed datafrom one Tmote Invent to another, and blinking LEDs.
Real-time Feedback/Display. The local display proto-col is used by the LocalDisplay to query other BAN mem-bers for values to display. The LocalDisplay is providedby a handlebar-mounted N80 mobile phone, via the Blue-tooth/802.15.4 gateway shown in Figure 4(f). The Tmote
Invent’s hardware design shares the SPI bus between radioand flash, and the same physical microcontroller pins areused for UART0. Since the Bluetooth-to-Serial converteris connected to the Tmote Invent UART0 port, this pre-cludes simultaneous radio communication and display up-dating. Hence, BikeNet uses a simple TDMA-like time slotassignment on top of the TinyOS CSMA MAC to improvecommunication between the roles generating sensor data andthe LocalDisplay. The LocalDisplay periodically broadcastsa query for data and the sensor roles register the first Local-Display they hear a query from as the only LocalDisplay theywill reply to thereafter. This association times out after aperiod if no queries are heard from the LocalDisplay. Thedata that a given sensor role returns to the LocalDisplay is amatter of user policy, but a typical display includes speed,distance traveled, bike frame tilt angle, pedal RPMs, andtime of day. To support flexibility in the user configura-tion of the display, data is represented in the packet with(type,length,value) format for flexibility.2.2.3 Data Exchange Services
Three types of data exchange occur in the BikeNet sys-tem: tasking exchange, uploading exchange, and mulingexchange. The tasking and uploading data exchanges takeplace between mobile sensing platforms and SAPs. Themuling data exchange takes place only between members ofthe mobile sensing tier (e.g., Tmote Invents). As default,BikeNet uses a delay-tolerant mode where a BAN’s Person-alNode mules data for sensing roles in its BAN (up to thelimits of its available storage) and uploads the data via wireor a wireless upload protocol. Inter-BAN muling and in situuploading via either mobile SAPs or opportunistically en-countered static SAPs support queries from back end userapplications that may want data in a more timely manner.
In the BikeNet tasking exchange, a SAP interacts withavailable mobile sensing platforms (e.g., Tmote Invents) tofirst instantiate a PersonalNode programmed with a cyclist’sBAN preference profile. Based on this profile, the Person-alNode assembles a BAN by tasking other available mo-bile sensing platforms with the required sensing roles as dis-cussed in Section 2.2.1. Aside from this BAN bootstrap-ping, the tasking exchange also includes the handling of userqueries/requests for data by back end system users, receivedvia the SAP. The PersonalNode responds to these queries byinvoking the necessary continuous or triggered sensing (Sec-tion 2.2.2) within its BAN.
In the muling exchange, sensed data is transferred be-tween mobile sensors outside of the radio range of either amobile or static SAP. A simple muling protocol is imple-mented on every Tmote Invent, but the option to activatemuling (i.e., spend Flash space to carry others’ data) is setby cyclist preference. The protocol uses anadvertisement-accept-data exchange, where theadvertisement specifies theamount of data the provider wants to have muled, theacceptmessage indicates the amount of data the consumer is will-ing to mule (based on Flash constraints) and thedata mes-sage represents a burst of data packets from the producer tothe consumer. In addition, Stop-and-Wait ARQ with a max-imum of three resends provides for reliable transfer of thedata packet burst. If a producer still receives no acknowledg-
ment after three resends of the same packet it will assumethe session is over and begins advertising anew. Our im-plementation includes support for replication of sensed data(i.e., via the muling exchange) but the replication of muleddata is not allowed. Restricting the right to replicate to thedata origin allows it to maintain control over the number ofcopies of its data that are circulating and also to vet (in termsof trustworthiness) all candidate mules.
In the uploading exchange, when a BAN comes withinthe radio range of a mobile or static SAP, the Tmote Inventscomposing the BAN attempt to upload sensed data to theback end data repository. The upload protocol message ex-change is identical to that of the muling protocol. When aSAP receives data packets, they are forwarded (in both themobile SAP and static SAP cases) to the back end reposi-tory. The decision to accept new upload sessions is madebased on channel congestion around the SAP.2.2.4 Ground Truth Sensing
In the BikeNet sensing system, SAPs are equipped withcertain sensors and can provideground truth measurements.Ground truth1 sensing refers to a trusted, high fidelity, al-ways accessible stream of data. One use of ground truth datais as a filter applied to data uploaded from a sensor beforethe data is passed by the SAP to the back end repository.The ground truth filter can be applied to validate or invalidateuploaded data when the uploaded data samples and groundtruth data samples have a high expected correlation (e.g.,temperature sampled at the same location and at the sametime, samples triggered by the same set of circumstances).Further, ground truth sensing can be used to satisfy queriescoming from a back end system user that have only coarse lo-cation context requirements. Ground truth data is also usedto satisfy queries coming from a BAN in the radio range ofa SAP. In this case the BAN can ask for readings from theSAP’s ground truth sensors, e.g., as part of a self-calibrationroutine.2.2.5 Query Management
The query management component on the SAP handlesqueries both from the back end system user, and from thePersonalNode of a BAN. It invokes a sensing resource dis-covery routine to determine what sensing resources are avail-able to meet the sensing request. The routine checks both anyground truth sensors on the SAP itself (Section 2.2.4) andavailable sensing resources on any BANs that may be withinradio range of the SAP. Once a list of available sensing re-sources is compiled, the SAP invokes a sensing resource se-lection routine to decide which resources will be tasked inorder to satisfy the request, and invokes a tasking routine toexecute the necessary request (i.e., a simple function callifthe resource is on-SAP, or via the tasking exchange (Sec-tion 2.2.3) if the resource is in a BAN in radio range. In theBikeNet implementation, we have experimented with han-dling queries to the SAP, originating both from the back endand from a BAN in radio range, for ground truth data. Inparticular, using a cellular phone as a mobile SAP, we have
1While related in principle, this notion of ground truth sensingshould not be confused with sensing for experimental validation anddebug (e.g., using the quad capture video helmet in Figure 4(e)).
Figure 7: BikeView portal [4] for data display and query submission. A CO2 map of Hanover, NH, USA streets on a summer weekdayafternoon is shown.
experimented both with event triggered capture of images,sound and videos requested by the BAN (e.g., an audio an-notated ride); and with direct requests from the back endBikeNet web portal for image, sound and video samples.2.2.6 Back End Services
Query Submission Portal. The BikeNet back end in-cludes a web portal (BikeView [4]) containing a graphicalpresentation of a cyclists data, but also allowing for the realtime querying of BANs using a GPRS connection via theN80, if the cyclist is using such a device for their PersonalN-ode. The user can select the BAN of interest and assemble aquery to submit to the query manager component of that SAPusing a collection of pull down menus. A final mouse clicktransmits the query over the cellular network to the selectedmobile SAP. We implement the ability to query a BAN’s lo-cation, capture a camera image, and sample the microphonevia this portal interface by sending SMS over GPRS to theN80.
Sensor Data Storage, Processing and Visualization.The sensor data repository provides a location for the longterm storage of cyclist experience data on a per-cyclist basisand also provides a convenient location for the aggregationof all long term trace data for all participating cyclists. Ac-cess to particular data is a matter of a the policy that each cy-clist registers with the repository (or a separate access controlentity). The sensor data mining component provides a set ofstandard statistical functions and reusable calculations/ datatransformations that a user (e.g., cyclist) can invoke to con-trol the retrieval and presentation of data. For BikeNet weuse a number of data interpretation and inference tools and
techniques, including scatter plots to look for data correla-tion, fast Fourier transforms (FFTs) to look for periodicity,running averages to smooth data to look for trends, and in-terpolation to align samples according to distance. For ex-ample, we use a method to filter spurious vibration data fromthe TiltSensor when calculating the slope of the cyclists path.Currently, the data handling is done in a non-automated wayby storing raw data streams in flat text log files, processingthese files using Awk scripts to extract data of different typesand apply methods for smoothing, averaging, scaling, andusing an external tool for FFT analysis. Further, we developscripts to transform data values intoBikeView [4] visualiza-tions. With BikeView (see Figure 7), we present summarizedcollected data sorted by user, and sorted by ride within eachuser account (akin to the presentation of “My Runs” on theNike+iPod web page [6]). Detailed sensed data can be ob-tained by simple mouse hovers and clicks over the graphicrepresentations of different rides. The vision is to provideback end sharing between users facilitated by dynamic cre-ation of group pages that are visible to all users in the groupand to which all group members can publish data.
System State Database. The system state database con-tains both static state information (e.g., Tmote Invent phys-ical address and sensing capabilities, PersonalNode humancustodian information) and dynamic state information (e.g.,last known position of a mobile SAPs, and BANs, SAP loadaverage) about elements in the network. In particular, thesystem state database tracks which BANs are currently in ra-dio range of mobile and static SAPs. This facilitates properquery routing from the back end query submission portal to
41.9
42
42.1
42.2
42.3
42.4
16.8 17 17.2 17.4 17.6 17.8 18
Latit
ude
(dec
imal
min
utes
)
Longitude (decimal minutes)
AB
C
D
GPS trace
(a) The mapped GPS trace of the cyclistroute, comprising roads in the vicinity ofDartmouth College in Hanover, NH, USA.
0
50
100
150
200
250
300
0 1 2 3 4 5
10
8
6
4
2
0
-2
-4
-6
-8
-10
-12
Rat
io (
%)
Slo
pe a
ngle
(de
gree
)
Distance (km)
Tilt slope angleWheel/Pedal ratio
(b) Cyclist fitness is inferred by correlatingthe gear ratio inferred from the wheel/pedalratio and the measured road slope.
-20
-15
-10
-5
0
5
10
0 0.5 1 1.5 2 2.5 3 3.5 4 4.5 5
Late
ral T
ilt (
degr
ees)
Distance (Kilometers)
A
B
C,D
(c) Lateral tilt plotted versus distance.Changes in lateral tilt are correlated withturns along the route shown in Figure 8(a).
Figure 8
particular BANs, for BAN-specific user queries. The infor-mation is also valuable more generally for debugging andmanagement of the network.
3 System EvaluationWe build five fully equipped BikeNet bicycles, imple-
ment all of the aforementioned sensing roles using TmoteInvent motes and Nokia N80 mobile phones, build a num-ber of static and mobile SAPs, and implement a functionalback end web portal offering query submission and data re-trieval services. In this section, we present selected resultsfrom several groups of experiments respectively targeted at:quantifying the cyclist experience from sensed data collectedabout a single cyclist and his environment; looking at per-formance aspects of key BikeNet subsystems; and measur-ing the real-time performance of a deployed system acrossthe Dartmouth campus and in adjacent areas of the town ofHanover, NH, USA. We use a common path that we call theground truth route. This route includes a variety of urban cy-cling terrain, including built up busy roads in the town centerwith lots of cars and pedestrian traffic and quiet back roadswith little or no traffic. The route exposes cyclists to a vari-ety of flat terrain, gradual down hill and steep uphill sections.Typically the ground truth route takes 25-30 minutes to rideand is nearly 5km long. The experiments are conducted atrush hour and in the middle of the day when there is lesstraffic and activity. We conducted many experiments over theperiod August 2006 - August 2007 collecting a typical dataset of 0.8 MB per ride per bike. We record the runs usingvideo from the video helmet (Figure 4(e)) that collects quad-directional video of a ride for ground truth validation of ourcorrelation/inference methods (not part of standard BikeNetequipment). BikeView [4] contains an example of one suchvideo recording.
3.1 Cyclist Experience Mapping3.1.1 Inference and Cyclist Fitness Sensing
In this section we present a series of plots characterizingcyclist behavior and the environmental conditions encoun-tered during a ride. We collect data from each of the sens-ing roles mentioned in Section 2.2.1, and apply fusion tech-niques and trend analysis to extract additional informationfrom the raw data.
Figure 8(b) shows the measured slope profile of the routecalculated from TiltSensor readings versus distance (theWheel/Pedal ratio curve is explained later). The slopes iscalculated according tos = arctan(x/y), wherex andy arethe TiltSensor’s measured x- and y-channel accelerometerreadings, respectively. We register accurate measurementswhen the bike is stationary; error increases with speed andterrain roughness due to unfiltered vibrations and cyclist be-havior. The slope profile which matches the manually mea-sured ground truth road segment (c.f. Section 2.1.5) well(less than 10% deviation from the ground truth slope mea-surements).
Figure 8(c) shows the lateral tilt plotted versus distance.The lateral tilt is calculated in the same manner just de-scribed for the TiltSensor. A cyclist’s aggressiveness in turn-ing is inferred. From the plot we correlate the increases inlateral tilt magnitude shown on the y-axis, with corner turnsexpected from the mapped GPS trace shown in Figure 8(a).Positive lateral angle indicates a right-side lean whereasneg-ative angles indicate left-side leans. In Figure 8(c), we label(viz. A, B, C, D) a sample of the lateral tilts that can be cor-related with corner turns in the cyclist GPS trace (see Figure8(a)), where at A, B, C, and D the biker makes, respectively,a right, a right, a left, and a left turn. The sharp left tilt (al-most -20 degrees) is due to mounting the bicycle at the startof the ride.
The quantitative aspects of the cyclist fitness include theslope of the road/trail that the cyclist covers on his ride, thespeed profile of the cyclist, the gear used when traveling upa given slope, and the location of the route. Figure 8(b)shows the slope profile of the road traversed on the cyclist’strip, and the ratio of the tire/wheel speed to the pedal speed.This ratio infers the approximate gear the bicycle is in at agiven point in the route, and provides a notion of the fitnessof the cyclist. This indicator is most accurate when the cy-clist is going uphill, since when coasting downhill the pedalsmay not be moved much. A strong cyclist can use a higherWheel/Pedal ratio when climbing hills. In Figure 8(b), inter-vals where the cyclist changes gears to climb hills are evident(from roughly 1 to 1.25km and from roughly 2 to 2.7km),where the Wheel/Pedal ratio is nearly 1.
Knowledge of the sensed path slope combined with the
6
4
2
0
-2
-4
-6
-8
-10
-12 0 0.5 1 1.5 2 2.5 3 3.5 4 4.5 5
Brake
Coast
Slo
pe A
ngle
(de
gree
s)
Infe
rred
Sta
te
Distance (km)
Tilt slope angleCoastingBraking
Figure 9: Periods of coasting and strong braking can be inferredfrom relationships between pedal RPM, wheel RPM and road slope.
measured pedal speed and wheel speed allows us to inferwhen a cyclist is coasting or braking. On a given bicyclethere is a finite discrete set of pedal speed to wheel speed ra-tios possible when the bicycle chain is engaged with a gearand providing thrust to the bicycle. The cardinality of thissetis equal to the number of gears the bicycle has. If the mea-sured ratio of pedal speed to wheel speed does not match oneof the allowable values we can infer that the cyclist is coast-ing. Braking can be inferred in a similar fashion to coasting.It is likely a cyclist is braking if the measured wheel speedslows while the slope is negative (downhill). Further, brak-ing is likely when going uphill if the measured wheel speedslows faster than dictated by the slope of the hill. However,this is more challenging to detect since inference of uphillbraking is also dependent on unknown quantities such as thecombined mass of the bicycle and the cyclist, and the routesurface composition/coefficient of rolling friction.
Figure 9 shows a plot of the road slope versus distancealong the ground truth route. Applying the simple infer-ence technique of observing decreasing speed when the slopeis negative (downhill), we infer sharp braking intervals at1.6km, 3.3km and 4.1km, which are verified by our knowncyclist behavior. In these cases, we see a sharp decreasein wheel speed concurrent with a sustained downhill slope.Similarly, if the pedal speed is near zero and the wheel speedis high, we can easily infer the cyclist is coasting. In the fig-ure, we infer periods of coasting from roughly 1.25 to 2kmand 2.7 to 3.3km.
Aside from route topography and personal performancemetrics, cyclists are interested in the ambience and safetyofa route as a determinant in the overall enjoyment of the cy-cling experience. We take steps towards quantifying the am-bience in terms of automobile traffic, air quality, and soundlevel. The presence of vehicles is often undesirable for cy-clists who have concerns about safety, noise, or pollution.Toinfer automobile traffic along the cyclist route (Figure 8(a)),each BAN is equipped with a MetalDetector. When the Met-alDetector passes close to any large metal body the Earth’smagnetic field is deformed and the presence of a car is in-
2800
3000
3200
3400
3600
3800
0 0.5 1 1.5 2 2.5 3 3.5 4 4.5
Mag
neto
met
er R
eadi
ng
Distance (km)
Y-channelEstimated cars detection (magnetometer)
Ground truth cars detection (button)X-channel
Figure 10: From measured magnetic field distortions, we use athresholding method to infer locations with dense patches of cars.
ferred. To collect ground truth data for the experiment tocompare against the inference from the MetalDetector, thecar rendezvous event is manually logged by the cyclist witha ButtonMote click. We include the cases when the bikepasses a car (parked or moving), and when a car passes thebike. We find that detection of cars more than 2m away isunreliable with our hardware, so we do not try to log whena car passes in the oncoming lane (about 3m away). Eachclick generates a record of GPS time and location informa-tion. Figure 10 shows, the raw x-channel and y-channel read-ings of a MetalDetector’s magnetometer plotted versus thedistance covered along the ride. ButtonMote events and po-sitions of inferred cars are overlaid on the same plot. Theinference algorithm is run against both x and y channel dataand works as follows. First, the exponentially weighted mov-ing average of the magnetometer reading is calculated. If thedifference between the current value and the moving averageis greater than a threshold, and the current value is a peak(greater than both the preceding and succeeding values), acar is inferred. The threshold values for x and y channelsand the moving average weight are learned by training withthe readings from 0 to 1 kilometers. These trained values arethen used along the rest of the route from 1 to 4.5 kilome-ters. While discrepancies between the ground truth data andthe output of the detection algorithm exist, we note that ouraim is not counting the exact number of cars but to identifyareas of high automobile concentration. Using this simplethresholding technique we are able achieve a level of detec-tion accuracy that supports this aim.
To provide a measure of air quality along the cyclist’sroute we conduct experiments using a sensor measuring thelevel of carbon dioxide in the air surrounding the cyclist. Fig-ure 11(a) shows a trace of the carbon dioxide sensor readingsalong the route shown in Figure 8(a) for two different cases,namely, rush hour and low traffic. The peaks in the rush hourcase occur when the biker was cycling on downtown roadswith a considerable presence of cars. In fact, variation in car-bon dioxide levels measured on roadways is likely to be theresult of automobile exhaust. While carbon dioxide has low
410 420 430 440 450 460 470 480 490 500 510
0 0.5 1 1.5 2 2.5 3 3.5 4 4.5
CO
2 R
eadi
ng (
PP
M)
Distance (Kilometers)
Rush hourLow traffic
(a) CO2 level along the ground truth route.Large spikes as the cyclist passes throughthe center of town at rush hour.
68
70
72
74
76
78
80
0 0.5 1 1.5 2 2.5 3 3.5 4 4.5
Sou
nd v
olum
e (d
B)
Distance (Kilometers)
Sound reading
(b) Sound level along the ground truth route.Even small town traffic exceeds the longterm health threshold (70dB).
1
0.8
0.6
0.4
0.2
0 0 0.5 1 1.5 2 2.5 3 3.5 4 4.5 5
Inde
x
Distance (Kilometers)
HealthPerformance
(c) Digesting the data: health and perfor-mance metrics to visualize a cyclist’s expe-rience.
Figure 11
toxicity at all levels we recorded during our experiments, itcan act as a predictor of other noxious automobile exhaustconstituents such as hydrocarbons, nitrous oxides, and par-ticulate matter. Thus, from readings of the carbon dioxidesensor we can infer how enjoyable the traveled route is for acyclist from the standpoint of pollution. The portal snapshotin Figure 7 shows a CO2 map of the Hanover streets on asummer weekday afternoon.
Another way to detect the presence of high vehicle den-sity, and to characterize the ambience of a route, is by mea-suring the sound volume. Sound in decibels is plotted versusdistance in Figure 11(b) for a ride along the ground truthroute. The sound volume peaks near 80dB when the routepasses through the main intersections of town where the au-tomobile traffic is more prevalent.3.1.2 Interpreting Cyclist Experience
In Figures 8(b) - 11(b), we present a large amount of rawdata and first level inferences. In this section, we introducetwo example metrics to help cyclists and other system usersunderstand and make use of the types of data that a BikeNetsystem provides. The metrics are weighted combinations ofvarious sensor data types. In the metrics introduced below(health and performance), we constrain ourselves to incor-porating sensors for which we collect data in our prototypeBikeNet implementation, though there are other appropri-ate sensors that might reasonably be added. The weights(e.g., a in the expression for Health below) comprise twosubweights: the user-defined preference/importance and thenormalizing factor for each element. The user-defined pref-erences reflect relative personal sensitivities (e.g., a cyclistwith asthma might weight the CO2 higher) to the elementscomposing a given index score. With the second subweight,we normalize each element (e.g., CO2) according to its max-imum dynamic range measured along routes about whichsensed data has been collected so far. At the back end, oron a user’s local display, index scores can be plotted versusdistance to see the variations across the route to identify crit-ical/interesting sections. For example, the plot of healthinFigure 11(c) shows a large dip in the health index just before1km where the CO2 spikes (ref. Figure 11(a)). Secondly,users can compare the average index value among differentroutes at different times to identify the most favorable routes
for a given aim (e.g., joy-riding, exercise). These index val-ues can be mapped to colors and routes can be visualizedas a color-coded playlist. As the number and coverage ofroute segments are built up, a lookup service that returns themost healthy route at the desired time between two endpointsbecomes possible. By sharing index values for routes of in-terest, and the user-defined preference weights, cyclists areable to learn from each other about where the good cyclingis.
Health. Air pollution and its effect on public health is ofgreat interest in many urban communities. In Austria, Franceand Switzerland, by measuring particulates specifically frommotorized traffic the effect of air pollution on public healthis estimated to account for>20,000 adult deaths, more than290,000 episodes of bronchitis in children, and more than500,000 asthma attacks each year [20]. Noise pollution isalso a factor in urban areas. According to the EnvironmentalProtection Agency’s Office of Noise and Abatement Con-trol in order to protect from hearing loss, one should not beexposed to more than 70dB for an extended period of time.Meanwhile the average city traffic is 85dB and in larger citieslike New York, the noise level often exceeds 90db. 87%of America’s city dwellers are exposed to noise so loud ithas the potential to degrade hearing capacity over time [21].Even in the small town of Hanover, NH, USA (see Figure11(b)) the noise level is often above 70dB on the main streetsat certain times. BikeNet sensing supports not only commu-nal pollution mapping, but on a more personal level it sup-ports the categorization of cycling routes according to theirpotential impact on a cyclist’s health. We define ahealthindex that combines data that indicate safety, noise and airpollution (either directly or through inference) as follows:
Health = 1.0−a1 ∗CarDensity−a2 ∗CO2Level −a3 ∗SoundLevel.
From the raw values obtained from the MetalDetector weinfer the density of cars along the route, along with raw val-ues of CO2Sensor and sound levels from the SoundSensor,we derive values for the health index of routes that a cyclisttravels. A higher CO2 level and derived car density implythere are more cars near the cyclist, creating an unpleasant
0
500
1000
1500
2000
0 5 10 15 20 25 30 35 40
Num
ber
of p
acke
ts u
ploa
ded
Node Id
Direct uploadingMuling + uploading
(a) Data uploaded directly and after mulingfor the twenty nodes in the four BANs.
0
1000
2000
3000
4000
5000
0 5 10 15 20 25 30 35 40
Late
ncy
(sec
onds
)
Node Id
Direct uploadingMuling + uploading
(b) Delivery delay comparison between di-rect uploading and muling + uploading.
0
20
40
60
80
100
0 5 10 15 20 25 30 35 40
Effi
cien
cy (
%)
Node Id
Direct uploadingMuling + uploading
(c) Delivery efficiency comparison betweendirect uploading and muling + uploading.
Figure 12
experience due to exhaust, noise, and increased danger, driv-ing the health index down. Similarly an increase in noiselevel indicates more traffic, people, wind, shouting, etc.,re-ducing the health index. Figure 11(c) shows the details ver-sus distance of how the characteristics of the route affect thecyclist, highlighting areas that should be avoided on futurerides. We use an equal user-defined preference weight of1
3for each of the three elements that are included in the score.The dynamic ranges (i.e., measured difference between maxand min) for car density, CO2 level and sound level are 12,100 and 70, respectively. Therefore, we usea1 = 1
3 ∗112,
a2 = 13 ∗
1100, anda3 = 1
3 ∗170. The average value of the health
index over the entire route is 0.746 and the standard devia-tion is 0.096. As previously mentioned, this average valuecan be used to help a user rank his routes according to hisown preferences and also to share with his peers.
Performance/Fitness. Some cyclists’ primary purposein riding is for exercise or for competition. For these rid-ers we calculate aperformance index, using the values ob-tained from the WheelSensor, PedalSensor, and TiltSensor.We compute a unitless measure of performance using the fol-lowing equation:
Per f . = b1 ∗HillAngle+b2 ∗W heelSpeed/PedalSpeed +b3 ∗Distance.
When HillAngle is positive the performance index goesup; when it is negative the index goes down. When thewheel/pedal ratio is high this indicates the bike is in a highergear (the wheel goes further with fewer pedal turns) and theindex increases. The further a rider travels (largerDistance)the higher the performance index. The plot in Figure 11(c)shows the performance of a cyclists traveling the groundtruth route. The weights are set according to the same ra-tionale as for the health expression, with values:b1 = 1
3 ∗113,
b2 = 13 ∗
180, andb3 = 1
3 ∗15. With these user weights, the
average value of the performance index over the entire routeis 0.253 with a standard deviation of 0.094.
3.2 Data Muling and UploadingThroughout the conducted experiments, sensed data is al-
ways stored in the local Flash memory of the Tmote Invent.Ultimately, this data must be transferred to the back end data
repository. Depending on bicycle and cyclist mobility thistransfer may happen directly from BAN to SAP using theupload protocol (c.f. Section 2.2.3), or may happen indi-rectly via the muling protocol (c.f. Section 2.2.3). EachBAN member knows the identifiers of the other mobile sens-ing platforms in its BAN as a result of the role assignmentprotocol (see Section 2.2.1), and will only mule data for mo-bile sensors not in its BAN. The exception to this rule is thatthe PersonalNode does mule data on behalf of its associatedBAN members. There is no intra-BAN coordinator for eitherupload or muling exchanges; BAN members transfer theirdata independently and contend using CSMA for the wire-less channel. There are two main scenarios to consider: (i)the bicycle enters in range of a SAP in which case the mo-bile sensors in the BAN upload their data to the SAP directlyor (ii) the bicycle is traveling out of range of the SAP, andmust rely on probabilistic mobility of other people or BANsto mule the data to a SAP.
Since the Stop-and-Wait ARQ reliable transfer mecha-nism used in the muling and upload protocols is well knownwe omit any evaluation of this mechanism per se. Rather,we aim to characterize the opportunistic sensor networkingenvironment provided by our initial prototype implementa-tion of BikeNet. In Figures 12(a), 12(b) and 12(c), we showresults from a multi-bicycle experiment where each cyclistfollows a prescribed path; the paths intersect giving rise tointer-bicycle muling opportunities. The paths followed byeach of the four bicycles used in the experiment follow theperimeter of a central grassy area called “the Green” com-monly used for recreation at Dartmouth College. The areaof the Green is approximately 150m by 100m. Two cyclistsride clockwise around the Green and the other two cyclistsride counter clockwise. The transmission range of the TmoteInvent reaches fewer than 50m so the connections amongthe cyclists are intermittent. However, there are data ex-change opportunities when the cyclists who are moving inopposite directions pass by each other. Rendezvous dura-tions are 10.75 seconds on average. After ten minutes ofcircling around the Green, each cyclist leaves the square inturn at fifteen minute intervals and parks the bicycle withinthe radio range of the SAP installed at the Sensor SystemsLab in the Computer Science building which is 250m awayfrom the northeast corner of the Green (i.e., out of range).
0
0.2
0.4
0.6
0.8
1
0 500 1000 1500 2000 2500
Cum
ulat
ive
Del
iver
y F
unct
ion
Time (seconds)
A
BC
Cyclist 1Cyclist 2Cyclist 3
(a) Data delivery traces for three cyclists us-ing direct upload from BAN to SAP.
0
0.2
0.4
0.6
0.8
1
0 500 1000 1500 2000
Cum
ulat
ive
Del
iver
y F
unct
ion
Time (seconds)
AB
C
DirectSAP augmented
Muling agumented
(b) Comparison of different delivery meth-ods for single cyclist’s data.
0
0.2
0.4
0.6
0.8
1
0 500 1000 1500 2000 2500
Cum
ulat
ive
Del
iver
y F
unct
ion
Time (seconds)
A
B1 SAP2 SAP3 SAP4 SAP5 SAP
(c) Evaluation of delivery delay versusnumber of SAP encountered en route
Figure 13
In Figure 12(a), we show the number of data packets di-rectly uploaded and the number of data packets muled to theSAP. Data records have unique identifiers to allow filteringof duplicates between muled and directly uploaded packets.The x-axis of the plot shows the identifiers of the TmoteInvents in each BAN. The Tmote Invents with identifiers 1through 6 belong to BAN-1, 11 through 16 belong to BAN-2,21 through 26 belong to BAN-3, and 31 through 36 belong toBAN-4. This x-axis is the same for Figures 12(b) and 12(c).Figure 12(a) shows that the rendezvous intervals in the ex-periment support a substantial amount of muling exchange.Overall, more data packets are directly uploaded than muled,but a considerable amount of data are muled before upload-ing (e.g., almost half of BAN-1’s data).
Figure 12(b) presents the latency of direct uploading andmuling. We measure the latency as the time difference fromthe time the sensor data packet is generated to the time thepacket is uploaded to a SAP, either by the originator of thepacket or by a mule. The result clearly shows the benefit ofmuling. The data from BAN-3 and BAN-4 are muled by theTmote Invents on BAN-1 and BAN-2 which enter within ra-dio range of the SAP earlier than BAN-3 and BAN-4. As aresult, the data from BAN-3 and BAN-4 are delivered earlierwith muling than with direct uploading. In particular, datafrom BAN-4 experience an average of 1500 seconds less de-lay with muling than with direct uploading.
Muling implies a performance penalty due to the addi-tional radio transmissions that are required on the path fromorigin to mule(s) and mule(s) to SAP. Figure 12(c) illustratesthe transfer efficiency for both muling and direct upload-ing as a function of the packets transferred. Here we de-fine efficiency as the ratio of data bytes transferred to the to-tal bytes sent (including data packet replicas and retransmis-sions). A higher efficiency for a given transferred packet re-flects a number of possible factors, including a higher qualityradio link and less congestion between sender and receiver,both of which lead to fewer retransmissions. The data ori-gin always stores a copy in its local Flash hoping to uploadthe data directly to a SAP. In our experiments, the mulingreplication degree is one, meaning we allow the originatingTmote Invent to transfer only a single copy of the data to an-other mobile sensor via the muling protocol. Further, we donot allow multi-hop muling; only the originating node may
replicate data. Figure 12(c) shows that the muling efficiencyis less than uploading efficiency as expected. While the up-loading efficiency ranges from 40% to 68%, the muling effi-ciency ranges from 12% to 33%. The difference between themuling efficiency and the uploading efficiency represents thecost for improving the data delivery delay. We are currentlystudying the effect of replication degree on performance; weexpect to see that more replication leads to improved deliv-ery delay performance, but also lower efficiency.3.3 Town-scale System Scenario
We build five sensor bikes and implement a small-scaleBikeNet testbed with seven static SAPs at a number of pointsacross the Dartmouth College campus and in the town ofHanover to validate and evaluate an operational BikeNet sys-tem. In what follows, we present results from data collectedby a group of three cyclists on the morning of November 20,2006. We have collected a significant amount of data fromover 50 different BikeNet experiments starting in summer2006 but here only present data from a single-shot experi-ment with the three cyclists. The three cyclists’ routes andthe times they started their rides are pre-planned. Cyclists 1and 2 live near each other and ride much of the way towardcampus from the town together.
Before getting to the campus they rendezvous with cyclist3 before cyclists 1 and 3 depart toward the library while cy-clist 2 heads to the Computer Science building. The longestjourney time for a cyclist is 40 minutes. The results pre-sented in this section provide insights into how live sensordata collected by each of the bikes is either muled or directlyuploaded to a passing SAP, in an opportunistic manner.
We first consider the time taken for each cyclist to uploadits data into the back end data repository via direct upload toa SAP and present the results in Figure 13(a). Note that inthis case the data uploaded to a SAP by a cyclist’s BAN in-cludes data originating in the local BAN and any data muledon behalf of other BANs. Figure 13(a) shows the cumulativedelivery function versus the trip time. We definecumula-tive delivery function as the cumulative fraction as the tripproceeds of the total data packets delivered to the back end.For example, at 520 seconds into the experiment cyclist 2has delivered 40% of its data including any data it may muleon behalf of cyclists 1 and 3. The initial lack of any datadelivery evident in the plots is due to the initial absence of
SAPs along the route from the homes of cyclists 1, 2 and3. Cyclists 1 and 2 encounter a SAP along Main Street inHanover at approximately 520 seconds into their ride. Eventhough only a modest number of SAPs are deployed we cansee from the plot that all bikes are capable of delivering siz-able fractions of their data before their trips end. For exam-ple, cyclists 1 and 2 deliver approximately 50% and 40%,respectively, of their data to the back end repository beforethe half way point of the trip time. From Figure 13(a), weobserve that data is transferred between bikes and SAPs inquick bursts. The amount of data transferred in strongly in-fluenced by the short contact times which are a product ofthe short range radios used in the BikeNet experiments.
Figure 13(b) shows the delivery of sensor data that isgenerated by only a single cyclist - in this case cyclist 1.We consider three scenarios of possible transfer between cy-clist 1 and the data repository:Direct, which is where cy-clist 1 keeps all its data, does not replicate and only uploadsto the SAP at the Computer Science building (the cyclist’sdestination);SAP augmented, which is where cyclist 1 op-portunistically transfers data to SAPs it encounters alongthe way with no help from mules; and finally,Muling/SAPaugmented, which exploits muling and opportunistic use ofSAPs to transfer cyclist 1’s data to the repository. Figure13(b) shows the performance of these three types of commu-nication across the trip time. From the plot we can observethe direct benefit of muling: cyclist 1 is disconnected for ap-proximately 15 minutes between points A and C in the plotof the cumulative delivery function, but at the intermediatepoint B the delivery of cyclist 1’s packets continues.
Next, we evaluate the impact of the incremental additionof SAPs to the system on the average delay of data deliv-ered from the three cyclists to the back end repository. Asthe number of SAPs increases from one to five, we plot thecumulative delivery function versus time. We run five trialsat each SAP level, each with the three cyclists riding pre-scribed routes from their respective homes to the ComputerScience department. Figure 13(c) shows the cumulative de-livery functions for each of the five cases, truncated at thetime when 100% of data is delivered by all cyclists for thecase of five SAPs. The plot shows that at the time all datais uploaded in the five SAP case, only 78% and 70% of datais uploaded in the three SAPs and one SAP cases, respec-tively. When the cyclists return to the Computer Sciencebuilding they become stationary and upload their remainingdata. This is reflected in the steep step in all the curves atpoint B in Figure 13(c), representing a large delivery of theremaining data from the bicycles to the SAP. In contrast, theflat portions of the curves, e.g., in the area of point A, repre-sent periods when cyclists 2 and 3 are disconnected from thenetwork with no other mobile sensors acting to mule data tothe SAPs. From Figure 13(c), we can also observe that theaddition of a new SAP yields a non-uniform improvement inthe data delivery performance. The impact of adding SAPsto the system on the data delivery delay is highly dependenton many factors including the SAP deployment density, andthe location of the SAPs in relation to routes frequented bythe cyclists.
4 Related WorkA number of companies (e.g., [9] [7]) have begun to of-
fer products that integrate data from multiple sensors on asingle user display, including biometric, advanced cyclo-performance and GPS location data, showing the interestin quantifying performance. These range from rather lim-ited $40 devices to very capable $500 devices [7]. Prod-ucts with a slightly different focus offer integrated hard-ware and software solutions (e.g., [9]) to help cyclists withpre-ride route planning, and in-ride navigation cues via pre-downloaded maps combined with real-time GPS data. Oth-ers (e.g., [10]) offer offline planning software packaged withan online GPS tracking service available via a select set ofcellular providers. BikeNet goes beyond any of these com-mercial offerings by adding environmental sensors to givecontext to performance. Further, the BikeNet system in-corporates a dual mode wireless networking approach fordata delivery to a back end analysis and visualization tier,providing usable and understandable information to users.By providing this dual mode architecture, we aim to sup-port both delay tolerant query/delivery as well as expeditedquery/delivery models. BikeNet supports delay tolerant in-teraction for the sake of the biker doing post-ride analysisof his entire ride, and real time interaction for more time-sensitive operations by community consumers of the data.
The wearable computing and personal area networkingfields have produced numerous examples [12], [13], [14],[15] of wireless networks that operate on and near the hu-man body and interact with the wearer’s surroundings orother people’s devices. There has also been work in de-lay tolerant networking [16], [17], [18] to improve datatransfer in networks that are often disconnected as BikeNetis. BikeNet synthesizes these ideas, using opportunisticrendezvous among personal computing devices (e.g., cellphones), embedded bicycle sensor networks, and sensor ac-cess points. BikeNet adds an implementation of back enddata storage, analysis and visualization services, to translateraw sensor data streams into meaningful information aboutpersonal health and performance, and community health.BikeNet provides a complete opportunistic sensing systemtargeted at a cyclist experience application, and adds a newdimension to delay-tolerant networking by investigating bothhuman-to-bike and bike-to-bike data transfer.
Mobile sensing systems have been proposed in other ap-plication contexts. Zebranet [1] monitors zebras wearingsensor collars using a mobile jeep-mounted radio gateway.The Cartel project [3] provides a mobile communicationsinfrastructure based on car-mounted communication plat-forms exploiting open WiFi access points in a city, but unlikeBikeNet it does not integrate either a sensing or sensed dataanalysis component. SATIRE [2] presents a software archi-tecture for smart clothing, similar to the BikeNet three tierarchitecture. The MetroSense Project [30] proposed a mo-bile sensing system for skier-based sensing. BikeNet differsin its application scope and its inclusion of bicycles as mo-bile sensing platforms for personal and environmental sens-ing. Further, we have developed BikeView, our communityoriented web-based portal for visualization and sharing ofcycling health and performance information.
Tightly bound to the domain of people-centric sensing, isthe issue of privacy [26]. Though the bulk of sensed datacollected by the BikeNet system may seem innocuous (es-pecially since it may be later shared with the communityanyway), concerns about personal performance, and espe-cially location tracking must be addressed. While back enddata sharing is regulated by the user, in-network techniquessuch as muling along with the possibility of wireless snoop-ing [29], mandate some privacy solution. While we do notintegrate privacy protection into our prototype, we note thework of others can likely be leveraged. We conjecture thatconcepts such as virtual walls [25] can be used when decid-ing what information to reveal in real time via the back end orto peer BANs. Light-weight encryption (e.g., TinySec [24],MiniSec [23]) may used for intra-BAN communications andto protect against data prying on the part of mules.
5 ConclusionIn this paper, we have presented the detailed design, im-
plementation and evaluation of the BikeNet mobile sensingsystem, adding to the growing body of work exploring op-portunistic sensor networking techniques. BikeNet repre-sents the first comprehensive mobile sensing system quan-tifying the cyclist experience. BikeNet provides for the col-lection and analysis of personal performance and commu-nal environmental sampling. BikeNet supports two modes ofoperation in support of delay-tolerant and real-time sensing,and collected data can be presented both locally to the cy-clist or to others via back end services. The BikeView portalconcept promotes social networking among cyclists, and tothe broader community. Initial results are encouraging anddemonstrate some of the value that mobile wireless sensornetworks can bring to our lives, including how we are im-pacted by our environment and how we can regulate our ac-tivity patterns to improve our quality of life. While our cur-rent experiments have concentrated on sensing for the cyclistand bicycle mounted sensors we conjecture that the BikeNetsystem could be implemented on other vehicles such as carswith little modification to the software system.
AcknowledgmentThis work is supported in part by Intel Corp., Nokia, NSF
NCS-0631289, ARO W911NF-04-1-031, and the Institutefor Security Technology Studies (ISTS) at Dartmouth Col-lege. The authors thank Xiao Zheng and Hong Lu for theirhelp with data collection, Peter Boda and Chieh-Yih Wan fortheir support of this project, and Peter Corke who served asthe shepherd for this paper. ISTS support for this research isprovided under award 60NANB6D6130 from the U.S. De-partment of Commerce and award 2005-DD-BX-1091 fromthe U.S. Bureau of Justice Assistance. The statements, find-ings, conclusions, and recommendations are those of the au-thor(s) and do not necessarily reflect the views of the Na-tional Institute of Standards and Technology (NIST), theU.S. Department of Commerce, or the U.S. Department ofJustice.
6 References[1] T. Liu, C. Sadler, P. Zhang, M. Martonosi. Implementing software on resource-
constrained mobile sensors: experiences with Impala and ZebraNet. InProc.of 2nd Int’l Conf. on Mobile Systems, Applications, and Services, pp. 259–269,Boston, MA, USA, Jun 7-9 2004.
[2] R. Ganti, P. Jayachandran, T. Abdelzaher, J. Stankovic.SATIRE: A SoftwareArchitecture for Smart AtTIRE. InProc. of 4th Int’l Conf. on Mobile Systems,Applications, and Services, pp. 110–123, Uppsala, Sweden, Jun 19-22 2006.
[3] B. Hull, V. Bychkovsky, Y. Zhang, K. Chen, M. Goraczko, A.Miu, E. Shih,H. Balakrishnan, and S. Madden. CarTel: A Distributed Mobile Sensor Com-puting System. InProc. of 4th Int’l Conf. on Embedded Networked SensorSystems, pp. 125–138, Boulder, CO, USA, Nov 1-3, 2006.
[4] BikeView - the BikeNet Web Portal.http://bikenet.cs.dartmouth.edu.Username: bikeview, Password: bikes
biking.aspx.[11] TinyOS. http://www.tinyos.net/.[12] M. Feldmeier and J. A. Paradiso. Giveaway wireless sensors for large-group
interaction. InExtended Abstracts on Human Factors in Computing Systems,pp. 1291–1292, Vienna, Austria, Apr 24-29 2004.
[13] R. DeVaul, M. Sung, J. Gips, and A. Pentland. MIThril 2003: Applicationsand Architecture.Proc. of the 7th Int’l Symp. on Wearable Computers, pp. 4,White Plains, NY, USA, Oct 21-23 2003.
[14] T. Zimmerman. Personal Area Networks: Near-field Intrabody Communica-tion. IBM Systems Journal, 35(No. 3,4), 1996.
[15] B. Gyselinckx, C. Van Hoof, J. Ryckaert, R.F. Yazicioglu, P. Fiorini, andV. Leonov. Human++: Autonomous Wireless Sensors for Body Area Net-works. InProc. of 27th Conf. on Custom Integrated Circuits, pp. 13–19, SanJose, CA, USA, Sep 18-21 2005.
[16] J. Scott, P. Hui, J. Crowcroft, and C. Diot. Haggle: A Networking Archi-tecture Designed Around Mobile Users.Proc. of 3rd Ann. Conf. on WirelessOn-demand Network Systems and Services, pp. 78–86, Les Menuires, France,Jan 18 2006.
[17] A. Kansal, A. A. Somasundara, D. D. Jea, M. B. Srivastava, and D. Estrin.Intelligent Fluid Infrastructure for Embedded Networks. In Proc. of 2nd Int’lConf on Mobile Systems, Applications, and Services, pp. 111–124, Boston,MA, USA, Jun 7-9 2004.
[18] Y. Wang and H. Wu. DFT-MSN: The Delay Fault Tolerant Mobile SensorNetwork for Pervasive Information Gathering. InProc. of 25th Int’l Conf. onComputer Communications, pp. 1-12, Barcelona, Spain, Apr 23-29 2006.
[19] Nokia N80 Mobile Device.http://www.nokia.com/nseries/index.html.[20] N. Kunzli, et al. Public-health Impact of Outdoor and Traffic-related Air Pol-
lution: A European Assessment.The Lancet. Vol. 356, Iss. 9232, pp. 795-801,Sep 2000.
[21] J. Orlando. Vehicle Noise and the Toll on People.http://www.culturechange.org/issue19/vehicle noise.htm.
[22] A. T. Campbell, S. B. Eisenman, N. D. Lane, E. Miluzzo, and R. A. Peterson.People-Centric Urban Sensing. InProc. of 2nd Ann. Int’l Conf. on WirelessInternet, Boston, MA, USA, Aug 2-5 2006.
[23] M. Luk, G. Mezzour, A. Perrig, and V. Gligor. MiniSec: A Secure SensorNetwork Communication Architecture. InProc. of the 6th Int’l Conf. on Infor-mation Processing in Sensor Networks, pp. 479–488, Cambridge, MA, USA,Apr 25-27 2007.
[24] C. Karlof, N. Sastry, and D. Wagner. TinySec: A Link Layer Security Architec-ture for Wireless Sensor Networks. InProc. of the 2nd Int’l Conf. on EmbeddedNetworked Sensor Systems, pp. 162–175, Baltimore, MD, USA, Nov 3-5 2004.
[25] A. Kapadia, T. Henderson, J. J. Fielding, and D. Kotz, Virtual Walls: ProtectingDigital Privacy in Pervasive Environments. InProc. of the 5th Int’l Conf. onPervasive Computing, pp. 162–179, Toronto, Canada, May 13-16 2007.
[26] P. Johnson, A. Kapadia, D. Kotz, N. Triandopoulos. People-Centric UrbanSensing: Security Challenges for the New Paradigm.Dartmouth TechnicalReport TR2007-586, Feb 2007.
[27] CitySense.http://www.citysense.net/.[28] M. J. Caruso. Applications of Magnetic Sensors for Low Cost Compass Sys-
tems. InProc. of IEEE Position Location and Navigation Symp., pp. 177–184,San Diego, CA, USA, Mar 13-16 2000.
[29] T. S. Saponas, J. Lester, C. Hartung, and T. Kohno. Devices That Tell On You:The Nike+iPod Sport Kit. http://www.cs.washington.edu/research/systems/privacy.htm.


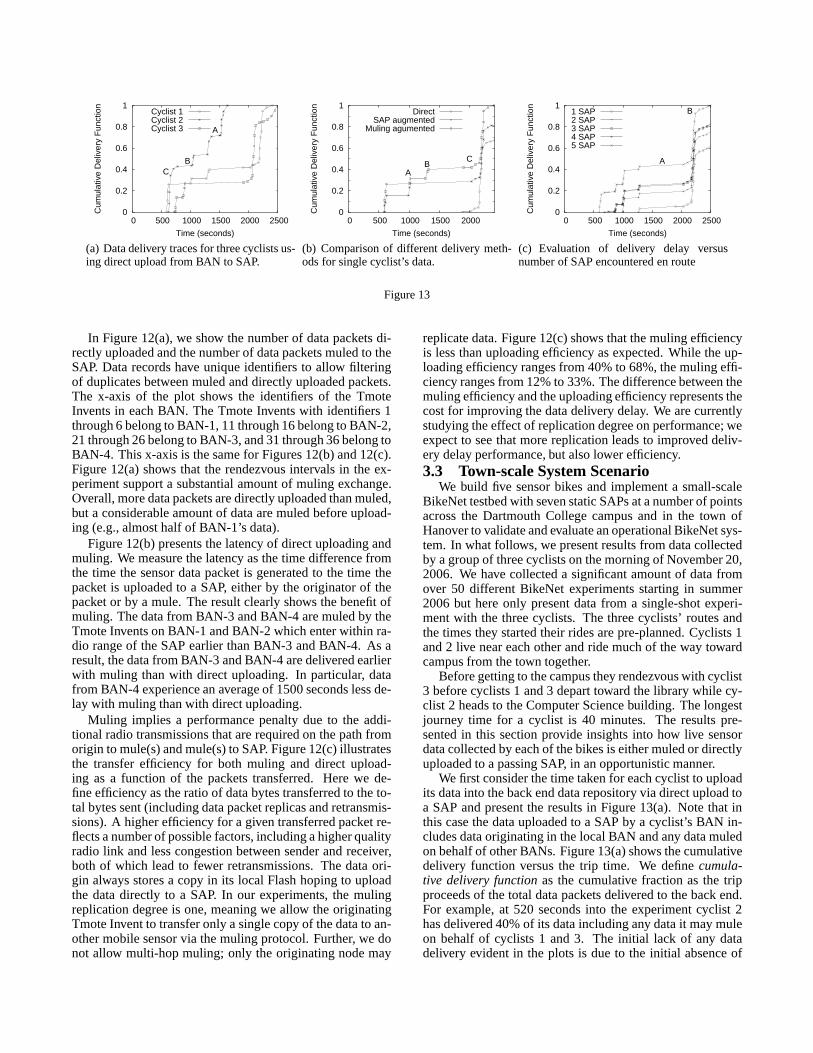


![A Multimodal Sensing Platform for Cyclist Risk Perception ...users.isr.ist.utl.pt/~mncosta/projects/smartbike/documents/PV_SMA… · road width [3]. More recently an MIT project used](https://static.documents.pub/doc/80x56/6034c1e73c93e2161c05cafc/a-multimodal-sensing-platform-for-cyclist-risk-perception-usersisristutlptmncostaprojectssmartbikedocumentspvsma.jpg)


